2017 hispanic demographic trends - sonomaedb.org
TRANSCRIPT

HISPANIC DEMOGRAPHIC TRENDS
DEMOGRAPHICS REPORT 2017
PG. 2SONOMAEDB.ORG
ECONOMIC DEVELOPMENT BOARDB
OA
RD
OF
D
IRE
CTO
RS
EDB FOUNDATION SPONSORS
PRESENTING LEVEL
EXECUTIVE LEVEL
FOUNDATION LEVEL PREMIER LEVEL
MEDIA LEVEL
AMERICAN AGCREDIT
AMERICAN RIVER BANK
COMCAST
GEORGE PETERSEN INSURANCE
KEEGAN & COPPIN CO.
MIDSTATE CONSTRUCTION
NORBAR
SONOMA COUNTY ALLIANCE
SUMMIT STATE BANK
VANTREO INSURANCE
ZAINER RINEHART CLARKE
PAM CHANTER, CHAIR JORGE ALCAZAR SKIP BRAND TERRI DENTE TERRY GARRETT KATHRYN HECHT LINDA KACHIUWAYNE LEACH MICHAEL NICHOLLS MICHAEL TOMASINIBEN STONE, Executive Director
PG. 3SONOMAEDB.ORG
CONTENTS
4. EXECUTIVE SUMMARY
6. A DEMOGRAPHIC SHIFT
7-8. DEMOGRAPHICS
9-10. K-12 EDUCATION
11. COLLEGE EDUCATION
12. HOUSING
13. WORKFORCE
14. HISPANIC BUSINESS PROFILE
15. HEALTHCARE
16. SOURCES
17. ACKNOWLEDGMENTS

PG. 4SONOMAEDB.ORG
HISPANIC DEMOGRAPHIC TRENDS
EXECUTIVE SUMMARYThe Sonoma County Economic Development Board (EDB) is pleased to present the 2017 Hispanic Demographics Trends. This report includes demographic and workforce statistics at the local, state, and national levels.
Over the last 20 years, a demographic shift has taken place in Sonoma County. The region has become increasingly diverse, due in part to the rapid growth of the Hispanic population. This demographic shift is not restricted to the county, but is active across California and the United States.
The 2017 Hispanic Demographic Trends was created to help government, non-profits, businesses, and educational institutions develop plans that will address the future challenges and opportunities associated with changing demographics.
The EDB expects to continue to pursue projects and reports related to the Hispanic community. Thank you for your continued interest in the EDB’s research. As always, if you have any questions, please feel free to contact us at (707) 565-7170. All data used is the most recent data available.
April 2017
HIGHLIGHTS
According to the U.S. census data, Sonoma County’s Hispanic population was 132,197 in 2015, making up over 26 percent of the county’s inhabitants. The California Department of Finance projects that the Hispanic population will become the ethnic majority in the country (51%) by 2050 (see p. 6).
Hispanic-owned businesses have also seen rapid growth both at the local level in Sonoma County and at the national level. According to the most recent U.S. census data available, as of 2012, there are 5,024 Hispanic-owned businesses in Sonoma County, an increase of 24% since 2007.
Hispanic purchasing power and aggregate household income has seen a significant rise in buying power, with $1.7 trillion in buying power at the national level and $2.1 billion in aggregate household income for Hispanics in Sonoma County.
The Hispanic labor force in Sonoma County has a higher rate of full-time employment than the white labor force, coupled with the Hispanic demographic shifting from young workers entering the market to a larger working-age population, suggests growth in the Hispanic labor force participation rate in Sonoma County.

PG. 5SONOMAEDB.ORG

PG. 6SONOMAEDB.ORG
HISPANIC DEMOGRAPHIC TRENDS
A DEMOGRAPHIC SHIFT
Sonoma County is continuing to experience a demographic shift, due in large part to the growing population of Hispanics that has reshaped the region’s economic identity. The Hispanic population has grown by almost 230 percent within the last 25 years, and by 2060 the Hispanic population is projected to make up 40 percent of the total population of Sonoma County (see p. 4).
In 1990, the county had a population of 388,222, about 10 percent of which was Hispanic. By 2015, the Sonoma County population had grown to 502,146, of which Hispanics made up 26.3 percent of the population.
The White population remains the majority in Sonoma County, with 63.8 percent of the population identifying as White, 4 percent as Asians, and 3.61 percent as African-Americans.
Looking at future forecasts, Sonoma County is expected to become more heterogeneous in the next couple decades. The Hispanic population is projected to increase by more than 100,000 individuals and grow at a rate of 2.5 times faster that the total population in the county.
As this major demographic shift continues and higher rates of Hispanics enter the workforce, unique opportunities and challenges for business, government, education, and community-based organizations will emerge.
Bay Area Census (www.bayareacensus.ca.gov) U.S. Census Bureau (www.census.gov)
Source:
Population Growth Sonoma County1990-2015
0
100000
200000
300000
400000
500000
600000
Total Population
Hispanic
2015201020001990
502,146
132,197
39,537
388,222
California Department of Finance (www.dof.ca.gov)
Source:
Projected Population Growth(Sonoma County), 2020-2060
100000
200000
300000
400000
500000
600000
700000
800000
Total PopulationHispanic
20602050204020302020
U.S. Census Bureau (www.census.gov)Source:
Percentage Change in PopulationSonoma County, 2020-2060
0%
5%
10%
15%
20%
25%
Total Population
Hispanic
2050-20602040-20502030-20402020-2030
148,333
523,615
264,818
660,937
California Department of Finance (www.dof.ca.gov)
Source:
Projected Population Growth(Sonoma County), 2020-2060
100000
200000
300000
400000
500000
600000
700000
800000
Total PopulationHispanic
20602050204020302020
148,333
523,615
264,818
660,937
U.S. Census Bureau (www.census.gov)Source:
Percentage Change in PopulationSonoma County, 2020-2060
0%
5%
10%
15%
20%
25%
Total Population
Hispanic
2050-20602040-20502030-20402020-2030
Bay Area Census (www.bayareacensus.ca.gov) U.S. Census Bureau (www.census.gov)
Source:
Population Growth Sonoma County1990-2015
0
100000
200000
300000
400000
500000
600000
Total Population
Hispanic
2015201020001990
502,146
132,197
39,537
388,222
U.S. Census Bureau (www.census.gov)Source:
Percentage Change in PopulationSonoma County, 2020-2060
0%
5%
10%
15%
20%
25%
Total Population
Hispanic
2050-20602040-20502030-20402020-2030
California Department of Finance (www.dof.ca.gov)
Source:
Projected Population Growth(Sonoma County), 2020-2060
100000
200000
300000
400000
500000
600000
700000
800000
Total PopulationHispanic
20602050204020302020
148,333
523,615
264,818
660,937
Bay Area Census (www.bayareacensus.ca.gov) U.S. Census Bureau (www.census.gov)
Source:
Population Growth Sonoma County1990-2015
0
100000
200000
300000
400000
500000
600000
Total Population
Hispanic
2015201020001990
502,146
132,197
39,537
388,222

PG. 7SONOMAEDB.ORG
HISPANIC DEMOGRAPHIC TRENDS
DEMOGRAPHICS
Sonoma County has a Hispanic population of over 132,000, boasting the largest Hispanic population in the North Bay region. As a percentage of the total population, Sonoma County’s Hispanic population grew faster that that of the Bay Area, state and nation from 2010-2015. In the last 15 years, Sonoma County’s Hispanic population grew by 66 percent and the Hispanic population in the Bay Area grew by 38 percent. During the same time period, the Hispanic population of Napa County increased by 64.1 percent, while the Hispanic population in Marin increased only by 7.2 percent.
The composition of Sonoma County’s Hispanic population as a percentage of the total population is 26.3 percent, similar to the composition of the Bay Area, with Hispanics making up 23.8 percent of the total population. While the percentage composition of Sonoma County increased from 24.9 percent to 26.3 percent from 2010 to 2015, this percentage is lower than the state average of 38.8 percent. At the national level, Hispanics comprise 17.6 percent of the U.S. population.
The Hispanic population in Sonoma County has 33 percent of its population under the age of 18. By contrast, 14 percent of the White population is under the age of 18. The White and Hispanic populations have a similar portion of their population in the working age (ages 18-64), with 61.5 percent of the Hispanic population at working age compared to 62.3 percent of whites. However, the Hispanic population is younger, with 33 percent under the working age of 18, indicative of a strong relative increase in Hispanics entering the workforce in upcoming years.
U.S. Census Bureau (www.census.gov)Source:
North Bay Hispanic Population by County2000-2015
0
30000
60000
90000
120000
1500002015
2010
2005
2000
SonomaNapaMarin
U.S. Census Bureau (www.census.gov)Source:
North Bay Hispanic Population by County2000-2015
0%
5%
10%
15%
20%
25%
30%
35%
40%2015
2010
2005
2000
CaliforniaSonomaBay AreaUnited States
U.S. Census Bureau (www.census.gov)Source:
Age Breakdown2015
0%
20%
40%
60%
80%
100%
65+18-640-17
HispanicWhite
14.14%
62.25%
23.62%
33.28%
61.45%5.27%
U.S. Census Bureau (www.census.gov)Source:
North Bay Hispanic Population by County2000-2015
0%
5%
10%
15%
20%
25%
30%
35%
40%2015
2010
2005
2000
CaliforniaSonomaBay AreaUnited States
U.S. Census Bureau (www.census.gov)Source:
North Bay Hispanic Population by County2000-2015
0
30000
60000
90000
120000
1500002015
2010
2005
2000
SonomaNapaMarin
U.S. Census Bureau (www.census.gov)Source:
Age Breakdown2015
0%
20%
40%
60%
80%
100%
65+18-640-17
HispanicWhite
14.14%
62.25%
23.62%
33.28%
61.45%5.27%
U.S. Census Bureau (www.census.gov)Source:
Age Breakdown2015
0%
20%
40%
60%
80%
100%
65+18-640-17
HispanicWhite
14.14%
62.25%
23.62%
33.28%
61.45%5.27%
U.S. Census Bureau (www.census.gov)Source:
North Bay Hispanic Population by County2000-2015
0
30000
60000
90000
120000
1500002015
2010
2005
2000
SonomaNapaMarin
U.S. Census Bureau (www.census.gov)Source:
North Bay Hispanic Population by County2000-2015
0%
5%
10%
15%
20%
25%
30%
35%
40%2015
2010
2005
2000
CaliforniaSonomaBay AreaUnited States
PG. 8SONOMAEDB.ORG
HISPANIC DEMOGRAPHIC TRENDS
DEMOGRAPHICS
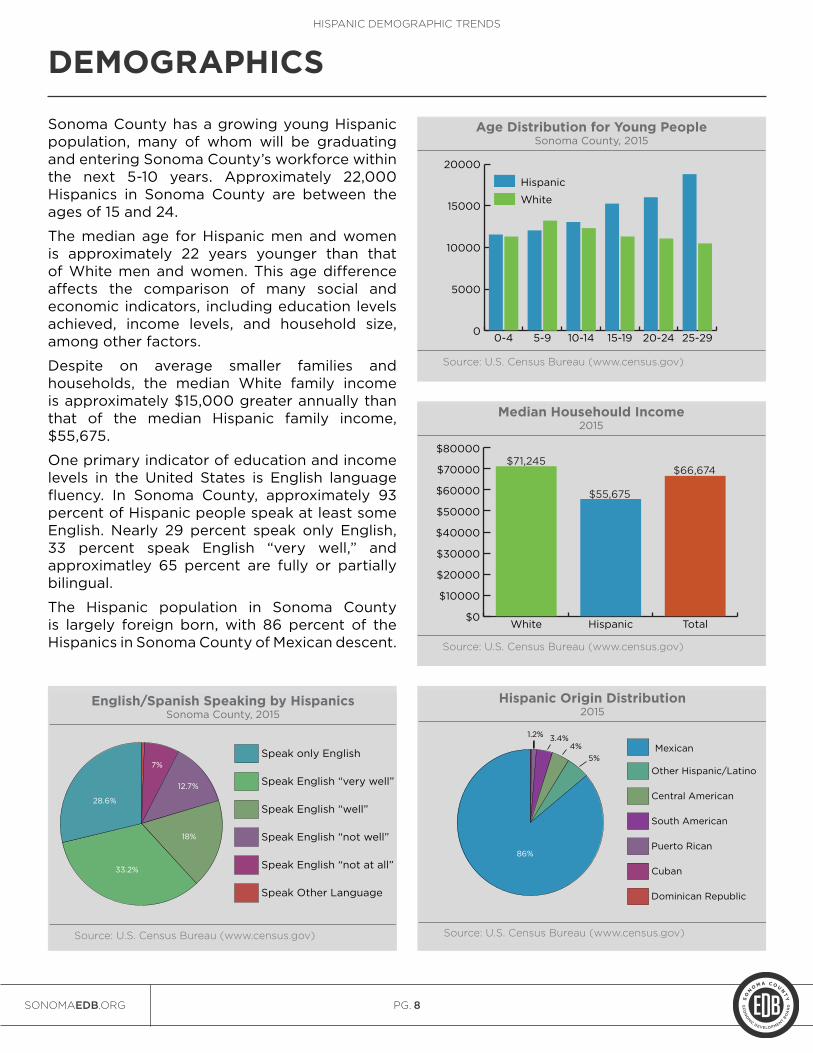
Sonoma County has a growing young Hispanic population, many of whom will be graduating and entering Sonoma County’s workforce within the next 5-10 years. Approximately 22,000 Hispanics in Sonoma County are between the ages of 15 and 24.
The median age for Hispanic men and women is approximately 22 years younger than that of White men and women. This age difference affects the comparison of many social and economic indicators, including education levels achieved, income levels, and household size, among other factors.
Despite on average smaller families and households, the median White family income is approximately $15,000 greater annually than that of the median Hispanic family income, $55,675.
One primary indicator of education and income levels in the United States is English language fluency. In Sonoma County, approximately 93 percent of Hispanic people speak at least some English. Nearly 29 percent speak only English, 33 percent speak English “very well,” and approximatley 65 percent are fully or partially bilingual.
The Hispanic population in Sonoma County is largely foreign born, with 86 percent of the Hispanics in Sonoma County of Mexican descent.
U.S. Census Bureau (www.census.gov)Source:
Age Distribution for Young PeopleSonoma County, 2015
0
5000
10000
15000
20000
Hispanic
White
25-2920-2415-1910-145-90-4
U.S. Census Bureau (www.census.gov)Source:
Hispanic Origin Distribution2015
Mexican
Other Hispanic/Latino
Central American
South American
Puerto Rican
Cuban
Dominican Republic
U.S. Census Bureau (www.census.gov)Source:
Median Househould Income2015
$0
$10000
$20000
$30000
$40000
$50000
$60000
$70000
$80000
TotalHispanicWhite
$71,245
$55,675
U.S. Census Bureau (www.census.gov)Source:
English/Spanish Speaking by HispanicsSonoma County, 2015
Speak only English
Speak English “very well”
Speak English “well”
Speak English “not well”
Speak English “not at all”
Speak Other Language
$66,674
86%
5%4%
3.4%1.2%
28.6%
33.2%
18%
12.7%
7%
U.S. Census Bureau (www.census.gov)Source:
Median Househould Income2015
$0
$10000
$20000
$30000
$40000
$50000
$60000
$70000
$80000
TotalHispanicWhite
$71,245
$55,675
$66,674
U.S. Census Bureau (www.census.gov)Source:
Age Distribution for Young PeopleSonoma County, 2015
0
5000
10000
15000
20000
Hispanic
White
25-2920-2415-1910-145-90-4
U.S. Census Bureau (www.census.gov)Source:
Hispanic Origin Distribution2015
Mexican
Other Hispanic/Latino
Central American
South American
Puerto Rican
Cuban
Dominican Republic
U.S. Census Bureau (www.census.gov)Source:
English/Spanish Speaking by HispanicsSonoma County, 2015
Speak only English
Speak English “very well”
Speak English “well”
Speak English “not well”
Speak English “not at all”
Speak Other Language
86%
5%4%
3.4%1.2%
28.6%
33.2%
18%
12.7%
7%
U.S. Census Bureau (www.census.gov)Source:
Age Distribution for Young PeopleSonoma County, 2015
0
5000
10000
15000
20000
Hispanic
White
25-2920-2415-1910-145-90-4
U.S. Census Bureau (www.census.gov)Source:
Hispanic Origin Distribution2015
Mexican
Other Hispanic/Latino
Central American
South American
Puerto Rican
Cuban
Dominican Republic
U.S. Census Bureau (www.census.gov)Source:
Median Househould Income2015
$0
$10000
$20000
$30000
$40000
$50000
$60000
$70000
$80000
TotalHispanicWhite
$71,245
$55,675
$66,674
86%
5%4%
3.4%1.2%
U.S. Census Bureau (www.census.gov)Source:
Hispanic Origin Distribution2015
Mexican
Other Hispanic/Latino
Central American
South American
Puerto Rican
Cuban
Dominican Republic
86%
5%4%
3.4%1.2%
U.S. Census Bureau (www.census.gov)Source:
Age Distribution for Young PeopleSonoma County, 2015
0
5000
10000
15000
20000
Hispanic
White
25-2920-2415-1910-145-90-4
U.S. Census Bureau (www.census.gov)Source:
Median Househould Income2015
$0
$10000
$20000
$30000
$40000
$50000
$60000
$70000
$80000
TotalHispanicWhite
$71,245
$55,675
U.S. Census Bureau (www.census.gov)Source:
English/Spanish Speaking by HispanicsSonoma County, 2015
Speak only English
Speak English “very well”
Speak English “well”
Speak English “not well”
Speak English “not at all”
Speak Other Language
$66,674
28.6%
33.2%
18%
12.7%
7%
U.S. Census Bureau (www.census.gov)Source:
English/Spanish Speaking by HispanicsSonoma County, 2015
Speak only English
Speak English “very well”
Speak English “well”
Speak English “not well”
Speak English “not at all”
Speak Other Language
28.6%
33.2%
18%
12.7%
7%
PG. 9SONOMAEDB.ORG
HISPANIC DEMOGRAPHIC TRENDS
K-12 EDUCATION
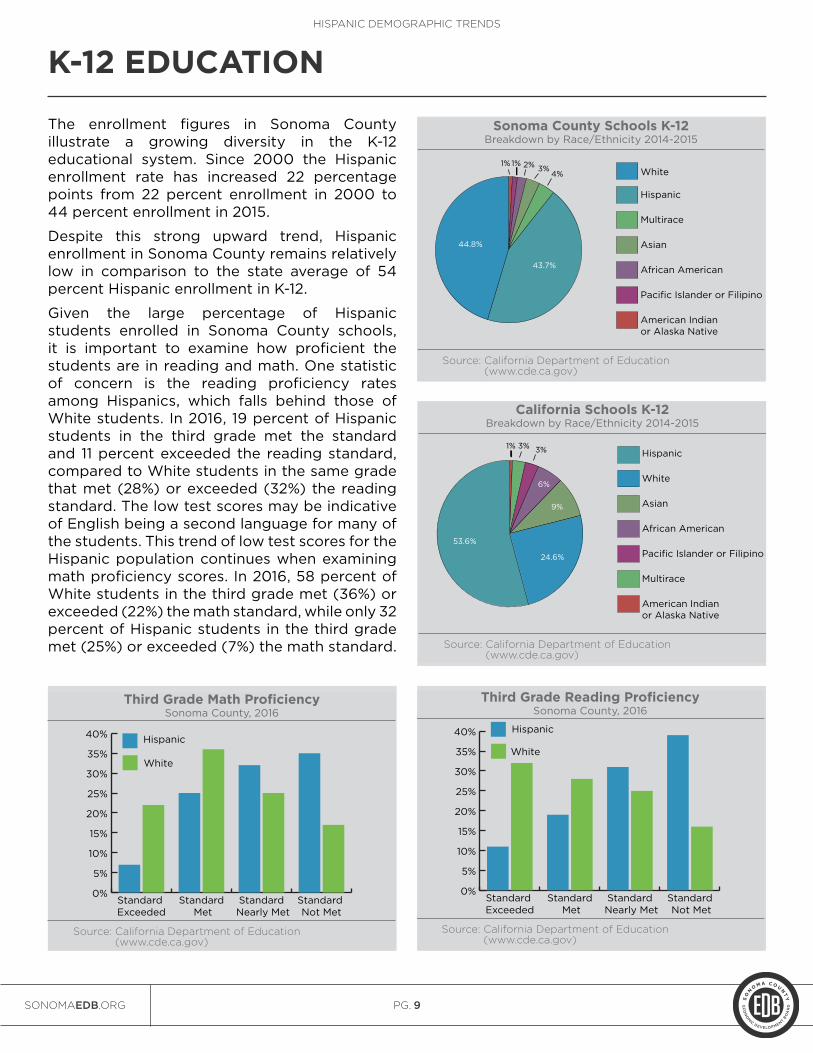
The enrollment figures in Sonoma Countyillustrate a growing diversity in the K-12educational system. Since 2000 the Hispanic enrollment rate has increased 22 percentage points from 22 percent enrollment in 2000 to 44 percent enrollment in 2015.
Despite this strong upward trend, Hispanicenrollment in Sonoma County remains relatively low in comparison to the state average of 54 percent Hispanic enrollment in K-12.
Given the large percentage of Hispanicstudents enrolled in Sonoma County schools, it is important to examine how proficient the students are in reading and math. One statistic of concern is the reading proficiency ratesamong Hispanics, which falls behind those of White students. In 2016, 19 percent of Hispanic students in the third grade met the standard and 11 percent exceeded the reading standard, compared to White students in the same grade that met (28%) or exceeded (32%) the reading standard. The low test scores may be indicative of English being a second language for many of the students. This trend of low test scores for the Hispanic population continues when examining math proficiency scores. In 2016, 58 percent of White students in the third grade met (36%) or exceeded (22%) the math standard, while only 32 percent of Hispanic students in the third grade met (25%) or exceeded (7%) the math standard.
California Department of Education (www.cde.ca.gov)
Source:
Sonoma County Schools K-12Breakdown by Race/Ethnicity 2014-2015
White
Hispanic
Multirace
Asian
African American
Pacific Islander or Filipino
American Indian or Alaska Native
44.8%
43.7%
4%3%2%1%1%
California Department of Education (www.cde.ca.gov)
Source:
California Schools K-12Breakdown by Race/Ethnicity 2014-2015
Hispanic
White
Asian
African American
Pacific Islander or Filipino
Multirace
American Indian or Alaska Native
California Department of Education (www.cde.ca.gov)
Source:
Third Grade Math ProficiencySonoma County, 2016
0%
5%
10%
15%
20%
25%
30%
35%
40%
White
Hispanic
Standard Not Met
Standard Nearly Met
Standard Met
Standard Exceeded
California Department of Education (www.cde.ca.gov)
Source:
Third Grade Reading ProficiencySonoma County, 2016
0%
5%
10%
15%
20%
25%
30%
35%
40%
White
Hispanic
Standard Not Met
Standard Nearly Met
Standard Met
Standard Exceeded
53.6%
24.6%
9%
6%
3%3%1%
California Department of Education (www.cde.ca.gov)
Source:
California Schools K-12Breakdown by Race/Ethnicity 2014-2015
Hispanic
White
Asian
African American
Pacific Islander or Filipino
Multirace
American Indian or Alaska Native
53.6%
24.6%
9%
6%
3%3%1%
California Department of Education (www.cde.ca.gov)
Source:
Sonoma County Schools K-12Breakdown by Race/Ethnicity 2014-2015
White
Hispanic
Multirace
Asian
African American
Pacific Islander or Filipino
American Indian or Alaska Native
California Department of Education (www.cde.ca.gov)
Source:
Third Grade Math ProficiencySonoma County, 2016
0%
5%
10%
15%
20%
25%
30%
35%
40%
White
Hispanic
Standard Not Met
Standard Nearly Met
Standard Met
Standard Exceeded
California Department of Education (www.cde.ca.gov)
Source:
Third Grade Reading ProficiencySonoma County, 2016
0%
5%
10%
15%
20%
25%
30%
35%
40%
White
Hispanic
Standard Not Met
Standard Nearly Met
Standard Met
Standard Exceeded
44.8%
43.7%
4%3%2%1%1%
California Department of Education (www.cde.ca.gov)
Source:
Sonoma County Schools K-12Breakdown by Race/Ethnicity 2014-2015
White
Hispanic
Multirace
Asian
African American
Pacific Islander or Filipino
American Indian or Alaska Native
California Department of Education (www.cde.ca.gov)
Source:
California Schools K-12Breakdown by Race/Ethnicity 2014-2015
Hispanic
White
Asian
African American
Pacific Islander or Filipino
Multirace
American Indian or Alaska Native
California Department of Education (www.cde.ca.gov)
Source:
Third Grade Reading ProficiencySonoma County, 2016
0%
5%
10%
15%
20%
25%
30%
35%
40%
White
Hispanic
Standard Not Met
Standard Nearly Met
Standard Met
Standard Exceeded
44.8%
43.7%
53.6%
24.6%
4%3%2%1%1%
9%
6%
3%3%1%
California Department of Education (www.cde.ca.gov)
Source:
Third Grade Reading ProficiencySonoma County, 2016
0%
5%
10%
15%
20%
25%
30%
35%
40%
White
Hispanic
Standard Not Met
Standard Nearly Met
Standard Met
Standard Exceeded
California Department of Education (www.cde.ca.gov)
Source:
Sonoma County Schools K-12Breakdown by Race/Ethnicity 2014-2015
White
Hispanic
Multirace
Asian
African American
Pacific Islander or Filipino
American Indian or Alaska Native
California Department of Education (www.cde.ca.gov)
Source:
California Schools K-12Breakdown by Race/Ethnicity 2014-2015
Hispanic
White
Asian
African American
Pacific Islander or Filipino
Multirace
American Indian or Alaska Native
California Department of Education (www.cde.ca.gov)
Source:
Third Grade Math ProficiencySonoma County, 2016
0%
5%
10%
15%
20%
25%
30%
35%
40%
White
Hispanic
Standard Not Met
Standard Nearly Met
Standard Met
Standard Exceeded
44.8%
43.7%
53.6%
24.6%
4%3%2%1%1%
9%
6%
3%3%1%
California Department of Education (www.cde.ca.gov)
Source:
Third Grade Math ProficiencySonoma County, 2016
0%
5%
10%
15%
20%
25%
30%
35%
40%
White
Hispanic
Standard Not Met
Standard Nearly Met
Standard Met
Standard Exceeded

PG. 10SONOMAEDB.ORG
HISPANIC DEMOGRAPHIC TRENDS
K-12 EDUCATION
Graduation rates among Sonoma CountyHispanics are continuing their positive trend while dropout rates are decreasing. In 2015, 52 percent of Sonoma County high school graduates were White, and 36 percent were Hispanic. This is up from 5 years ago, when 29 percent of Sonoma County high school graduates were Hispanic.
In Sonoma County, about 25 percent of Hispanic graduates completed the necessary criteria to continue with a four-year university program. By contrast, 35 percent of Hispanic graduates achieved those same standards across the state. Comparatively, 38 percent of White graduates in Sonoma County completed the necessarycriteria to enter a four-year university, which is lower than the 50 percent of graduates across the state.
Although achieving skilled employment andearning a high income are not solely contingent upon earning a four-year university degree,they become significantly harder to obtainfor those who lack a high school diploma. In Sonoma County dropout rates for Hispanics are continuing to decline, with an annual adjusted grade 9-12 dropout rate of 3.3 percent forHispanic students in 2015.
Maintaining this downward trend in dropout rates will be vital for the economic competitiveness of the ever-increasing amount of Hispanics entering the workforce. An increase in both the Hispanic graduation rate and the percentage of Hispanic graduates who completed the necessary criteria to continue with a four-year university program, in conjuction with a decrease in dropout rates, forecasts an improved and productive Hispanic labor force.
California Department of Education (www.cde.ca.gov)
Source:
Sonoma County High School GraduatesBreakdown by Race/Ethnicity 2014-2015
White
Hispanic
Asian
Multirace
African American
Pacific Islander or Filipino
American Indian or Alaska Native
52%36%
4%3%
2%2%1%
California Department of Education (www.cde.ca.gov)
Source:
Graduates with UC/CSU Required Courses2014-2015
0%10%20%30%40%50%60%70%80%
Sonoma County
California
Amer
ican
Indian
/Alas
ka N
ative
Pacifi
c Isla
nder
/Filip
inoAfri
can
Am
erica
n
Multir
ace
Asian
Hispan
ic
Whi
te
49
.7%
38.4
%
34.6
%
25.3
%
71.8
%
50.5
%
49
.3%
29.1%
32.7
%
22.9
%
56.2
%
42%
30.4
%
29.3
%
California Department of Education (www.cde.ca.gov)
Source:
Dropout Percentage by Race/Ethnicity2014-2015
0%
2%
4%
6%
8%
10%Sonoma County
California
Amer
ican
Indian
/Alas
ka N
ative
Pacifi
c Isla
nder
/Filip
inoAfri
can
Amer
ican
Multir
ace
Asian
Hispan
ic
Whi
te
3.4
%
3.3%
California Department of Education (www.cde.ca.gov)
Source:
Graduates with UC/CSU Required Courses2014-2015
0%10%20%30%40%50%60%70%80%
Sonoma County
California
Amer
ican
Indian
/Alas
ka N
ative
Pacifi
c Isla
nder
/Filip
inoAfri
can
Am
erica
n
Multir
ace
Asian
Hispan
ic
Whi
te
49
.7%
38.4
%
34.6
%
25.3
%
71.8
%
50.5
%
49
.3%
29.1%
32.7
%
22.9
%
56.2
%
42%
30.4
%
29.3
%
California Department of Education (www.cde.ca.gov)
Source:
Sonoma County High School GraduatesBreakdown by Race/Ethnicity 2014-2015
White
Hispanic
Asian
Multirace
African American
Pacific Islander or Filipino
American Indian or Alaska Native
California Department of Education (www.cde.ca.gov)
Source:
Dropout Percentage by Race/Ethnicity2014-2015
0%
2%
4%
6%
8%
10%Sonoma County
California
Amer
ican
Indian
/Alas
ka N
ative
Pacifi
c Isla
nder
/Filip
inoAfri
can
Amer
ican
Multir
ace
Asian
Hispan
ic
Whi
te
3.4
%
3.3%
52%36%
4%3%
2%2%1%
California Department of Education (www.cde.ca.gov)
Source:
Dropout Percentage by Race/Ethnicity2014-2015
0%
2%
4%
6%
8%
10%Sonoma County
California
Amer
ican
Indian
/Alas
ka N
ative
Pacifi
c Isla
nder
/Filip
inoAfri
can
Amer
ican
Multir
ace
Asian
Hispan
ic
Whi
te
3.4
%
3.3%
California Department of Education (www.cde.ca.gov)
Source:
Sonoma County High School GraduatesBreakdown by Race/Ethnicity 2014-2015
White
Hispanic
Asian
Multirace
African American
Pacific Islander or Filipino
American Indian or Alaska Native
California Department of Education (www.cde.ca.gov)
Source:
Graduates with UC/CSU Required Courses2014-2015
0%10%20%30%40%50%60%70%80%
Sonoma County
California
Amer
ican
Indian
/Alas
ka N
ative
Pacifi
c Isla
nder
/Filip
inoAfri
can
Am
erica
n
Multir
ace
Asian
Hispan
ic
Whi
te
49
.7%
38.4
%
34.6
%
25.3
%
71.8
%
50.5
%
49
.3%
29.1%
32.7
%
22.9
%
56.2
%
42%
30.4
%
29.3
%
52%36%
4%3%
2%2%1%
PG. 11SONOMAEDB.ORG
HISPANIC DEMOGRAPHIC TRENDS
COLLEGE EDUCATION
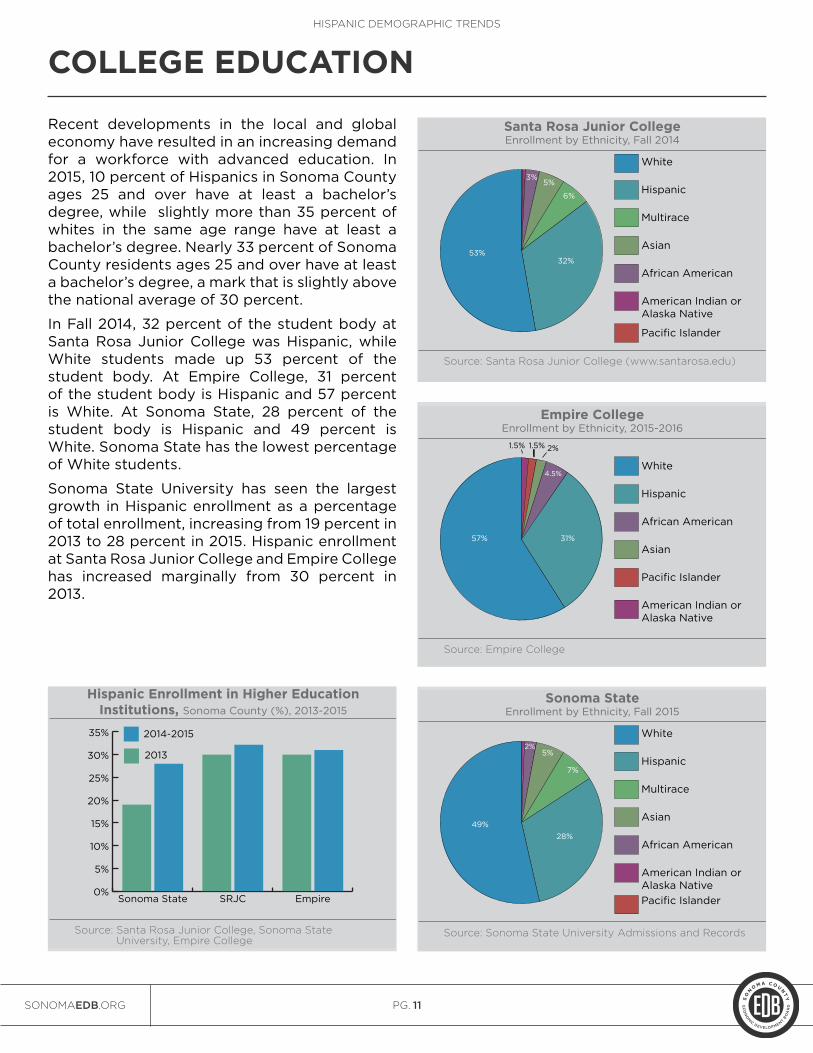
Recent developments in the local and global economy have resulted in an increasing demand for a workforce with advanced education. In 2015, 10 percent of Hispanics in Sonoma County ages 25 and over have at least a bachelor’s degree, while slightly more than 35 percent of whites in the same age range have at least a bachelor’s degree. Nearly 33 percent of Sonoma County residents ages 25 and over have at least a bachelor’s degree, a mark that is slightly above the national average of 30 percent.
In Fall 2014, 32 percent of the student body at Santa Rosa Junior College was Hispanic, while White students made up 53 percent of the student body. At Empire College, 31 percent of the student body is Hispanic and 57 percent is White. At Sonoma State, 28 percent of the student body is Hispanic and 49 percent is White. Sonoma State has the lowest percentage of White students.
Sonoma State University has seen the largest growth in Hispanic enrollment as a percentage of total enrollment, increasing from 19 percent in 2013 to 28 percent in 2015. Hispanic enrollment at Santa Rosa Junior College and Empire College has increased marginally from 30 percent in 2013.
Santa Rosa Junior College (www.santarosa.edu)Source:
Santa Rosa Junior CollegeEnrollment by Ethnicity, Fall 2014
White
Hispanic
Multirace
Asian
African American
American Indian or Alaska Native
Pacific Islander
32%53%
6%
5%3%
Sonoma State University Admissions and RecordsSource:
Sonoma StateEnrollment by Ethnicity, Fall 2015
White
Hispanic
Multirace
Asian
African American
American Indian or Alaska NativePacific Islander
Empire CollegeSource:
Empire CollegeEnrollment by Ethnicity, 2015-2016
White
Hispanic
African American
Asian
Pacific Islander
American Indian or Alaska Native
28%49%
31%57%
Santa Rosa Junior College, Sonoma State University, Empire College
Source:
Hispanic Enrollment in Higher Education Institutions, Sonoma County (%), 2013-2015
0%
5%
10%
15%
20%
25%
30%
35% 2014-2015
2013
EmpireSRJCSonoma State
7%
5%2%
4.5%
2%1.5%1.5%
Empire CollegeSource:
Empire CollegeEnrollment by Ethnicity, 2015-2016
White
Hispanic
African American
Asian
Pacific Islander
American Indian or Alaska Native
31%57%
4.5%
2%1.5%1.5%
Santa Rosa Junior College (www.santarosa.edu)Source:
Santa Rosa Junior CollegeEnrollment by Ethnicity, Fall 2014
White
Hispanic
Multirace
Asian
African American
American Indian or Alaska Native
Pacific Islander
Sonoma State University Admissions and RecordsSource:
Sonoma StateEnrollment by Ethnicity, Fall 2015
White
Hispanic
Multirace
Asian
African American
American Indian or Alaska NativePacific Islander
32%53%
28%49%
Santa Rosa Junior College, Sonoma State University, Empire College
Source:
Hispanic Enrollment in Higher Education Institutions, Sonoma County (%), 2013-2015
0%
5%
10%
15%
20%
25%
30%
35% 2014-2015
2013
EmpireSRJCSonoma State
6%
5%3%
7%
5%2%
Santa Rosa Junior College (www.santarosa.edu)Source:
Santa Rosa Junior CollegeEnrollment by Ethnicity, Fall 2014
White
Hispanic
Multirace
Asian
African American
American Indian or Alaska Native
Pacific Islander
Sonoma State University Admissions and RecordsSource:
Sonoma StateEnrollment by Ethnicity, Fall 2015
White
Hispanic
Multirace
Asian
African American
American Indian or Alaska NativePacific Islander
Empire CollegeSource:
Empire CollegeEnrollment by Ethnicity, 2015-2016
White
Hispanic
African American
Asian
Pacific Islander
American Indian or Alaska Native
32%53%
28%49%
31%57%
6%
5%3%
7%
5%2%
4.5%
2%1.5%1.5%
Sonoma State University Admissions and RecordsSource:
Sonoma StateEnrollment by Ethnicity, Fall 2015
White
Hispanic
Multirace
Asian
African American
American Indian or Alaska NativePacific Islander
28%49%
7%
5%2%
Santa Rosa Junior College (www.santarosa.edu)Source:
Santa Rosa Junior CollegeEnrollment by Ethnicity, Fall 2014
White
Hispanic
Multirace
Asian
African American
American Indian or Alaska Native
Pacific Islander
Empire CollegeSource:
Empire CollegeEnrollment by Ethnicity, 2015-2016
White
Hispanic
African American
Asian
Pacific Islander
American Indian or Alaska Native
32%53%
31%57%
Santa Rosa Junior College, Sonoma State University, Empire College
Source:
Hispanic Enrollment in Higher Education Institutions, Sonoma County (%), 2013-2015
0%
5%
10%
15%
20%
25%
30%
35% 2014-2015
2013
EmpireSRJCSonoma State
6%
5%3%
4.5%
2%1.5%1.5%
Santa Rosa Junior College, Sonoma State University, Empire College
Source:
Hispanic Enrollment in Higher Education Institutions, Sonoma County (%), 2013-2015
0%
5%
10%
15%
20%
25%
30%
35% 2014-2015
2013
EmpireSRJCSonoma State
PG. 12SONOMAEDB.ORG
HISPANIC DEMOGRAPHIC TRENDS
HOUSING
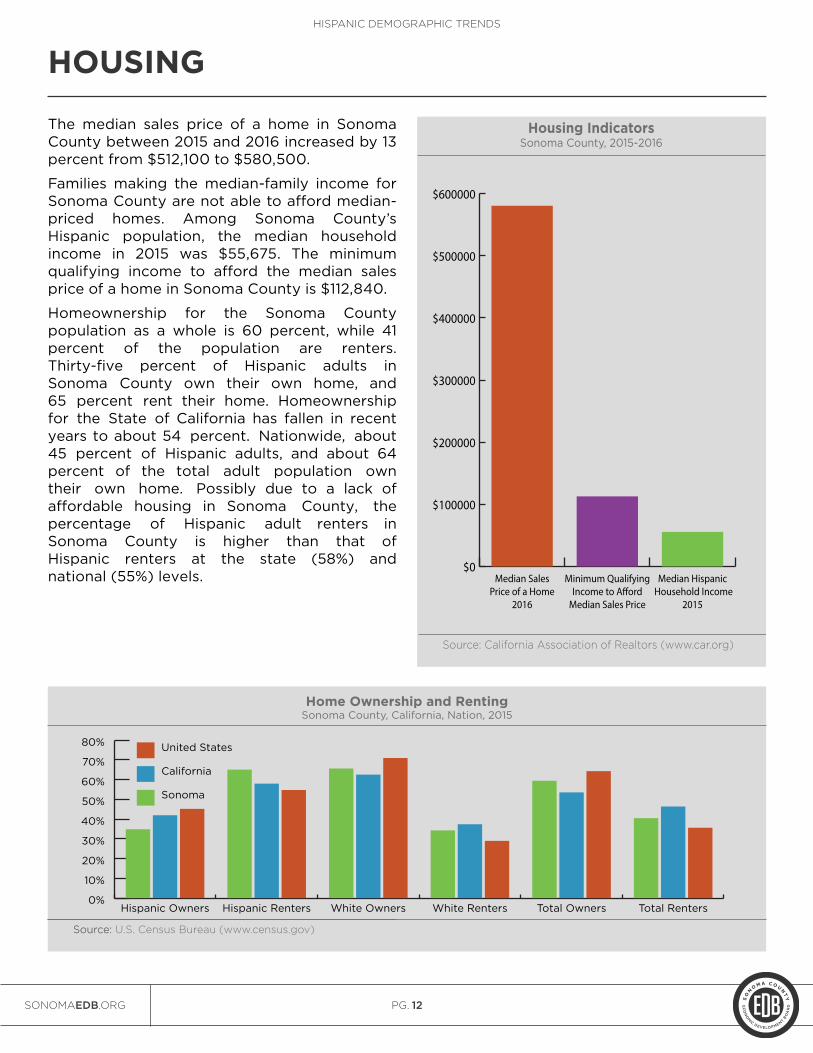
The median sales price of a home in Sonoma County between 2015 and 2016 increased by 13 percent from $512,100 to $580,500.
Families making the median-family income for Sonoma County are not able to afford median-priced homes. Among Sonoma County’sHispanic population, the median householdincome in 2015 was $55,675. The minimum qualifying income to afford the median sales price of a home in Sonoma County is $112,840.
Homeownership for the Sonoma County population as a whole is 60 percent, while 41 percent of the population are renters. Thirty-five percent of Hispanic adults in Sonoma County own their own home, and 65 percent rent their home. Homeownership for the State of California has fallen in recent years to about 54 percent. Nationwide, about 45 percent of Hispanic adults, and about 64 percent of the total adult population own their own home. Possibly due to a lack of affordable housing in Sonoma County, the percentage of Hispanic adult renters in Sonoma County is higher than that of Hispanic renters at the state (58%) and national (55%) levels.
California Association of Realtors (www.car.org)Source:
Housing IndicatorsSonoma County, 2015-2016
$0
$100000
$200000
$300000
$400000
$500000
$600000
Median Hispanic Household Income
2015
Minimum Qualifying Income to A�ord Median Sales Price
Median Sales Price of a Home
2016
U.S. Census Bureau (www.census.gov)Source:Source:
Home Ownership and RentingSonoma County, California, Nation, 2015
0%
10%
20%
30%
40%
50%
60%
70%
80% United States
California
Sonoma
Total RentersTotal OwnersWhite RentersWhite OwnersHispanic RentersHispanic Owners

PG. 13SONOMAEDB.ORG
HISPANIC DEMOGRAPHIC TRENDS
WORKFORCE
In 2015, Hispanics made up 26.3 percent of Sonoma County’s labor force, an increase from 2010 when Hispanics made up 24 percent of Sonoma County’s labor force. Of the total Hispanic population, 42 percent worked full-time in the past 12 months. In comparison, 38 percent of the total population of Sonoma County worked full-time in the past 12 months.
Despite a higher rate of full-time employment, median household income for Hispanics in Sonoma County falls below the median household income for the total population. Median household income for Hispanics is $55,675. Comparatively, the average median household income for the total population in Sonoma County is $66,674, and in California is $64,500.
The Hispanic population is seeing a demographic shift from young workers entering the market to a larger working age population. Nearly 70 percent of Hispanics between the ages of 25 and 54 are employed or looking for work, amounting to nearly 46,000 current and potential workers.
In Sonoma County, the Hispanic workforce is most heavily concentrated in the areas of service work, labor and help, construction, and sales and related occupations. In 2015, 18,103 Hispanic workers were employed as service workers, and of those employed as service workers nearly 6,000 were employed in food preparation and serving related occupations. Hispanics were also represented heavily in other occupations, such as the 11,693 Hispanic workers in sales and office occupations, and the nearly 9000 Hispanic workers employed in production and transportation occupations.
As a percentage of Sonoma County’s total workforce, Hispanics made up 50 percent of natural resources, construction, and maintenance occupations, 37 percent of all service workers, and 36 percent of all workers. Sonoma County’s Hispanic workforce has a significant economic impact on Sonoma County as evident through the occupations and industries with a high percentage of Hispanic workers.
U.S. Census Bureau (www.census.gov)Source:
Hispanics in Labor Force by Age Group2015
16-19
20-24
25-54
55-64
14%
70%
9%7%
U.S. Census Bureau (www.census.gov)Source:
Median Household Income2015
$0
$10000
$20000
$30000
$40000
$50000
$60000
$70000
$80000
CaliforniaSonoma CountyHispanic Pop. Sonoma County
U.S. Census Bureau (www.census.gov)Source:
Concentration of Hispanics in Sonoma CountyWorkforce by Occupation, 2006-2010
02000400060008000
1000012000140001600018000
20000
Scienc
e an
d Eng
inee
ring
Prote
ctive
Ser
vices
Health
care
Pra
ctiti
oners
Educat
ion
and L
egal
Busin
ess a
nd F
inan
cial
Natur
al Res
ource
Work
ers
Constru
ctio
n W
orker
s
Produc
tion
and
Tran
sporta
tion
Sales a
nd O
�ce
Work
ers
Servic
e W
orker
s
0%
20%
40%
60%
80%
100%
U.S. Census Bureau (www.census.gov)Source:
Median Household Income2015
$0
$10000
$20000
$30000
$40000
$50000
$60000
$70000
$80000
CaliforniaSonoma CountyHispanic Pop. Sonoma County
U.S. Census Bureau (www.census.gov)Source:
Hispanics in Labor Force by Age Group2015
16-19
20-24
25-54
55-64
U.S. Census Bureau (www.census.gov)Source:
Concentration of Hispanics in Sonoma CountyWorkforce by Occupation, 2006-2010
02000400060008000
1000012000140001600018000
20000
Scienc
e an
d Eng
inee
ring
Prote
ctive
Ser
vices
Health
care
Pra
ctiti
oners
Educat
ion
and L
egal
Busin
ess a
nd F
inan
cial
Natur
al Res
ource
Work
ers
Constru
ctio
n W
orker
s
Produc
tion
and
Tran
sporta
tion
Sales a
nd O
�ce
Work
ers
Servic
e W
orker
s
0%
20%
40%
60%
80%
100%
14%
70%
9%7%
U.S. Census Bureau (www.census.gov)Source:
Concentration of Hispanics in Sonoma CountyWorkforce by Occupation, 2006-2010
02000400060008000
1000012000140001600018000
20000
Scienc
e an
d Eng
inee
ring
Prote
ctive
Ser
vices
Health
care
Pra
ctiti
oners
Educat
ion
and L
egal
Busin
ess a
nd F
inan
cial
Natur
al Res
ource
Work
ers
Constru
ctio
n W
orker
s
Produc
tion
and Tr
ansp
ortatio
n
Sales a
nd O
�ce
Work
ers
Servic
e W
orker
s
0%
20%
40%
60%
80%
100%
U.S. Census Bureau (www.census.gov)Source:
Hispanics in Labor Force by Age Group2015
16-19
20-24
25-54
55-64
U.S. Census Bureau (www.census.gov)Source:
Median Household Income2015
$0
$10000
$20000
$30000
$40000
$50000
$60000
$70000
$80000
CaliforniaSonoma CountyHispanic Pop. Sonoma County
14%
70%
9%7%

PG. 14SONOMAEDB.ORG
HISPANIC DEMOGRAPHIC TRENDS
HISPANIC BUSINESS PROFILE
According to U.S. Census data, aggregate household income for Hispanics in Sonoma County is $2.1 billion. Hispanic residents of Sonoma County therefore account for an estimated $324 million in disposable income. (Disposable income calculated as 15% ofaggregate income).
On the national level, Hispanic consumers have seen a significant rise in buying power, with $1.7 trillion in buying power. Consumption is the single most direct way for individual consumers to affect the overall market. As purchasing power increases, so too will market representation in response to the increased demand.
Over the last decade, the amount of Hispanic-owned firms has increased rapidly at the national level. This same trend is present in Sonoma County. In 2012, there were 5,024 Hispanic-owned firms in Sonoma County, an increase of 24 percent from the 4,056 Hispanic-owned businesses in 2007.
Hispanics have also nationally seen a rise in the percentage of startups. According to Kauffman, the percentage of new Hispanic entrepreneurs has doubled within the last decade. In 2015, Hispanics made up nearly 21 percent of new entrepreneurs, up from 10 percent in 1996.
The expansion of Hispanic-owned firms and the purchasing power of Hispanic consumers provides an opportunity for Hispanic entrepreneurs and consumers alike to impact the local and national economies.
U.S. Census Bureau (www.census.gov)*Discretionary income calculated as 15% of aggregate income
Source:
Disposable Income of HispanicsSonoma County, 2010-2015 (In Thousands of Dollars)
$0
$50000
$100000
$150000
$200000
$250000
$300000
$350000
20152010
$258,149
$323,921
U.S. Census Bureau (www.census.gov)Source:
Aggregate Income of HispanicsSonoma County, 2010-2015 (In Thousands of Dollars)
$0
$500000
$1000000
$1500000
$2000000
$2500000
20152010
$1,720,996
$2,159,470
Kau�man Foundation (www.kau�man.org)Source:
Percentage of New Entrepreneurs by RaceUnited States, 1996-2015
0%10%20%30%40%50%60%70%80%
2015
1996
OtherAsianAfrican American
HispanicWhite
10% 20
.8%
U.S. Census Bureau (www.census.gov)Source:
Aggregate Income of HispanicsSonoma County, 2010-2015 (In Thousands of Dollars)
$0
$500000
$1000000
$1500000
$2000000
$2500000
20152010
$1,720,996
$2,159,470
U.S. Census Bureau (www.census.gov)*Discretionary income calculated as 15% of aggregate income
Source:
Disposable Income of HispanicsSonoma County, 2010-2015 (In Thousands of Dollars)
$0
$50000
$100000
$150000
$200000
$250000
$300000
$350000
20152010
$258,149
$323,921
Kau�man Foundation (www.kau�man.org)Source:
Percentage of New Entrepreneurs by RaceUnited States, 1996-2015
0%10%20%30%40%50%60%70%80%
2015
1996
OtherAsianAfrican American
HispanicWhite
10% 20
.8%
Kau�man Foundation (www.kau�man.org)Source:
Percentage of New Entrepreneurs by RaceUnited States, 1996-2015
0%10%20%30%40%50%60%70%80%
2015
1996
OtherAsianAfrican American
HispanicWhite
10% 20
.8%
U.S. Census Bureau (www.census.gov)*Discretionary income calculated as 15% of aggregate income
Source:
Disposable Income of HispanicsSonoma County, 2010-2015 (In Thousands of Dollars)
$0
$50000
$100000
$150000
$200000
$250000
$300000
$350000
20152010
U.S. Census Bureau (www.census.gov)Source:
Aggregate Income of HispanicsSonoma County, 2010-2015 (In Thousands of Dollars)
$0
$500000
$1000000
$1500000
$2000000
$2500000
20152010
$258,149
$323,921
$1,720,996
$2,159,470

PG. 15SONOMAEDB.ORG
HISPANIC DEMOGRAPHIC TRENDS
HEALTHCARE
Insurance is a key indicator of the well-being of a demographic, as it helps to understand the health of Hispanics living in Sonoma County. Nearly 37 percent of Hispanics are using Medicaid, 32 percent are using employment-based insurance, and 20 percent are uninsured. Comparatively, only 3 percent of the White population is uninsured.
The higher rate of the Hispanic uninsured population may contribute to a higher rate of Hispanics self-reporting their overall health as fair or poor. Of the Hispanic population, 7 percent self-report their overall health being fair, and 24 percent self-report their overall health as poor. Sixty-nine percent report their overall health as excellent (12%), very good (34%), or good (22%), compared to the nearly 86 percent of Whites that positively reported their health.
The trend of lower health indicators for the Hispanic population continues when examining BMI scores. Hispanics have a significantly higher percentage of overweight percentages than whites, with 42 percent of Hispanics reported as being obese, and 41 percent reported as overweight, while 21 percent of Whites reported being obese and 39 percent reported being overweight. The percentage of Hispanics in Sonoma County ranked in the normal BMI range is also significantly lower than that of Whites, with 37 percent of Whites in Sonoma County ranked in the normal BMI level and 16 percent of Hispanics ranked in the normal BMI level.
Examining healthcare for Hispanics is an important part of understanding the challenges of an evolving demographic in Sonoma County.
UCLA Center for Health Policy Research(www.healthpolicy.ucla.edu)
Source:
Types of Insurance for Hispanics and WhitesSonoma County, 2014
0%
10%
20%
30%
40%
50%
60%White
Hispanic
Privat
ely P
urch
ased
Emplo
ymen
t-bas
ed
Medica
id
Medica
re O
nly
Medica
re &
oth
ers
Medica
re
& Med
icaid
Unins
ured
20.3
%
36.9
%
31.8
%
51.7
%
UCLA Center for Health Policy Research(www.healthpolicy.ucla.edu)
Source:
Body Mass Index MeasureSonoma County, 2014
0%
10%
20%
30%
40%
50%White
Hispanic
ObeseOverweightNormalUnderweight
UCLA Center for Health Policy Research(www.healthpolicy.ucla.edu)
Source:
Overall HealthSonoma County, 2014
0%
5%
10%
15%
20%
25%
30%
35%White
Hispanic
PoorFairGoodVery Good
Excellent
12.8
%
26.3
%
33.8
%
34.7
%
22.4
% 24.8
%
24.2
%
10.9
%
6.8
%
3.3%
20.6
%
41.8
%
39.3
%
40
.5%
36.8
%
15.7
%
UCLA Center for Health Policy Research(www.healthpolicy.ucla.edu)
Source:
Body Mass Index MeasureSonoma County, 2014
0%
10%
20%
30%
40%
50%White
Hispanic
ObeseOverweightNormalUnderweight
20.6
%
41.8
%
39.3
%
40
.5%
36.8
%
15.7
%
UCLA Center for Health Policy Research(www.healthpolicy.ucla.edu)
Source:
Types of Insurance for Hispanics and WhitesSonoma County, 2014
0%
10%
20%
30%
40%
50%
60%White
Hispanic
Privat
ely P
urch
ased
Emplo
ymen
t-bas
ed
Medica
id
Medica
re O
nly
Medica
re &
oth
ers
Medica
re
& Med
icaid
Unins
ured
20.3
%
36.9
%
31.8
%
51.7
%
UCLA Center for Health Policy Research(www.healthpolicy.ucla.edu)
Source:
Overall HealthSonoma County, 2014
0%
5%
10%
15%
20%
25%
30%
35%White
Hispanic
PoorFairGoodVery Good
Excellent
12.8
%
26.3
%
33.8
%
34.7
%
22.4
% 24.8
%
24.2
%
10.9
%
6.8
%
3.3%
UCLA Center for Health Policy Research(www.healthpolicy.ucla.edu)
Source:
Overall HealthSonoma County, 2014
0%
5%
10%
15%
20%
25%
30%
35%White
Hispanic
PoorFairGoodVery Good
Excellent
12.8
%
26.3
%
33.8
%
34.7
%
22.4
% 24.8
%
24.2
%
10.9
%
6.8
%
3.3%
UCLA Center for Health Policy Research(www.healthpolicy.ucla.edu)
Source:
Types of Insurance for Hispanics and WhitesSonoma County, 2014
0%
10%
20%
30%
40%
50%
60%White
Hispanic
Privat
ely P
urch
ased
Emplo
ymen
t-bas
ed
Medica
id
Medica
re O
nly
Medica
re &
oth
ers
Medica
re
& Med
icaid
Unins
ured
20.3
%
36.9
%
31.8
%
51.7
%
UCLA Center for Health Policy Research(www.healthpolicy.ucla.edu)
Source:
Body Mass Index MeasureSonoma County, 2014
0%
10%
20%
30%
40%
50%White
Hispanic
ObeseOverweightNormalUnderweight
20.6
%
41.8
%
39.3
%
40
.5%
36.8
%
15.7
%

PG. 16SONOMAEDB.ORG
HISPANIC DEMOGRAPHIC TRENDS
SOURCES
The 2016-2017 Hispanic Demographics Trends Indicators provide a comparative study on various economic, demographic, environmental, and social aspects of the Hispanic Demographic within Sonoma County. Sonoma County Economic Development Board (EDB) research originates from information available from outside resources and previously published material. The 2016-2017 Hispanic Demographics Trends offer partial or composite representations of raw data and cite respective data sets. For more information see listed sources.
DATA SOURCESBay Area Real Estate Information Services, Inc.
California Association of Realtors
California Board of Education
California Department of Finance
California Employment Development Department
Empire College
Ewing Marion Kauffman Foundation
ESRI Business Analyst
Geoscape, American Marketspace DataStream
Moody’s Analytics
Nielsen
Santa Rosa Junior College
Sonoma State University
Sonoma County Economic Development Board
UCLA Center for Health Policy Research
United States Census Bureau
United States Bureau of Labor Statistics
PG. 17SONOMAEDB.ORG
HISPANIC DEMOGRAPHIC TRENDS
METHODOLOGY
The 2016-2017 Hispanic Demographics Trends is a product of the Sonoma County Economic Development Board (EDB). According to the Census Bureau, Hispanics are those people who classify their origin (ancestry) as Mexican, Mexican American, Chicano, Puerto Rican, Cuban, Argentinean, Colombian, Costa Rican, Dominican, Ecuadoran, Guatemalan, Honduran, Nicaraguan, Peruvian, Salvadoran, from other Spanish-speaking countries of the Caribbean or Central or South America, or from Spain. The data used by the Economic Development Board is reflective of this definition.
This report offers composite representations of raw data and cite respective source data sets on demographic trends occurring in Sonoma County. The Indicators do not provide complete in-depth analyses of all facets of Sonoma County. The EDB believes all data contained within this report to be accurate and the most current available, but does not guarantee its accuracy or completeness. Use of data from an outside source does not represent an endorsement of any product or service by the EDB, its members or affiliates.
For more information, please see the listed sources. Interested readers are encouraged to contact data source agencies or organizations for further research or visit our website at www.sonomaedb. org. Readers are also invited to suggest improvements for future reports by calling (707) 565-7170 or emailing [email protected].
ACKNOWLEDGMENTS
The 2016-2017 Hispanics Demographic Trends data was updated by Intern Justin Cox, and the report was analyzed and edited by Economic Development Project Coordinator, Kanny Morgan.

707 - 565 - 7170
SONOMAEDB.ORG
141 STONY CIRCLE, STE. 110, SANTA ROSA, CA 95401