2017 home buyer/seller satisfaction study · 2019-08-05 · 2 j.d ower 2017 home buyer/seller...
TRANSCRIPT
2017 Home Buyer/Seller Satisfaction Study
Beyond Measurejdpower.com
2
J.D. Power 2017 Home Buyer/Seller Satisfaction Study
2017 Home Buyer/Seller Satisfaction StudyPublish Date: August 1, 2017Understanding the Voice of the Customer is critical to success in today’s highly competitive marketplace. Knowing how home buyers and sellers evaluate your company’s services, compared with those of your competitors, can help your organization increase its competitive advantage by fine-tuning the practices that may drive high levels of customer satisfaction, increase loyalty and advocacy, and grow market share.
The SolutionThe J.D. Power 2017 Home Buyer/Seller Satisfaction StudySM measures satisfaction with the nation’s largest real estate companies among customers in four segments: first-time buyers; repeat buyers; first-time sellers; and repeat sellers. Overall satisfaction is measured across four factors of the home-buying experience: Agent/Salesperson; Real Estate Office; Closing Process; and Variety of Additional Services. In the home-selling experience, the same four factors are evaluated plus a fifth factor, Marketing. The study, which provides the real estate industry with insights into the evolving needs and demands of customers, includes the following objectives:
• Measure satisfaction among customers who recently bought and/or sold a home
• Provide an understanding of awareness and how customers view real estate companies
• Examine customer shopping patterns and reasons for selecting real estate company
• Obtain customer feedback about the performance of real estate companies based on the drivers of buyer and seller satisfaction
• Gauge customers’ post-close experience
• Deliver insights into the drivers of customer loyalty and commitment
How It WorksSamplingThe Home Buyer/Seller Satisfaction Study includes the largest real estate companies that represent at least 67% of market share. The 2017 study includes 5,117 evaluations from 4,170 customers who bought and/or sold a home between March 2016 and April 2017. The study was fielded in March-April 2017.
Real estate companies evaluated in the study include:
• Berkshire Hathaway HomeServices• Century 21• Coldwell Banker• Keller Williams• RE/MAX
Overall satisfaction is measured across four factors of the home-buying experience: Agent/Salesperson; Real Estate Office; Closing Process; and Variety of Additional Services.
3
J.D. Power 2017 Home Buyer/Seller Satisfaction Study
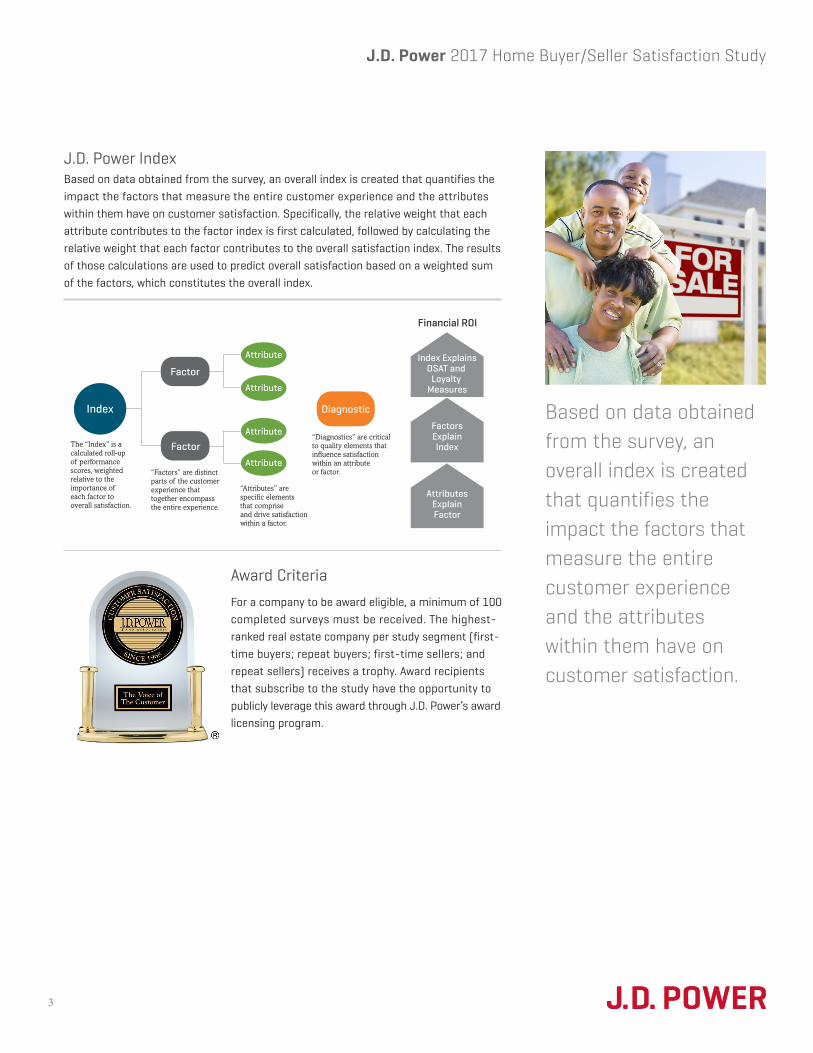
J.D. Power IndexBased on data obtained from the survey, an overall index is created that quantifies the impact the factors that measure the entire customer experience and the attributes within them have on customer satisfaction. Specifically, the relative weight that each attribute contributes to the factor index is first calculated, followed by calculating the relative weight that each factor contributes to the overall satisfaction index. The results of those calculations are used to predict overall satisfaction based on a weighted sum of the factors, which constitutes the overall index.
Award Criteria
For a company to be award eligible, a minimum of 100 completed surveys must be received. The highest-ranked real estate company per study segment (first-time buyers; repeat buyers; first-time sellers; and repeat sellers) receives a trophy. Award recipients that subscribe to the study have the opportunity to publicly leverage this award through J.D. Power’s award licensing program.
Based on data obtained from the survey, an overall index is created that quantifies the impact the factors that measure the entire customer experience and the attributes within them have on customer satisfaction.
Chart Elements Verification Timeline of Changes/Updates
Elements Yes Type of Deliverable (Report, White Paper, Case Study, etc.)
Data provided (Excel/Word/PPT): Data and/or edited chart provided on (date):
Title of chart: Illustrator/InDesign printout of chart to editing on (date):
Subtitle of chart (if any): Flag chart if it contains unanswered info on (date):
Axis titles (if any) okay: Follow-up on chart if it contains unanswered info on (date):
Second axis legend (if any) okay: Chart proofed by Rita/Sandy prior to final deliverable on (initial/date):
Legend okay: Editor’s Name Date Task
Source provided okay:
Run Spell check when final
Notes:
Name or email
Name or email
Name or email
Name or email
Name or email
Name or email
Name or email
Name or email
Date
Date
Date
Date
Date
Date
Date
Date
Brief explanation of update or change to chart
Brief explanation of update or change to chart
Brief explanation of update or change to chart
Brief explanation of update or change to chart
Brief explanation of update or change to chart
Brief explanation of update or change to chart
Brief explanation of update or change to chart
Brief explanation of update or change to chart
Power Insight
Fill in date here/name of person editing
Fill in date here/other info if needed
Name and date
Fill in date here/other info if needed
✔
✔
✔
✔
✔
✔
✔
✔
INDEX METHODOLOGY FORMULA
Source: 2013 U.S. Auto Insurance StudySM Figure OS-20
Index
The “Index” is acalculated roll-up of performance scores, weighted relative to theimportance of each factor to overall satisfaction.
“Factors” are distinctparts of the customerexperience that together encompass the entire experience.
“Attributes” are specific elements that compriseand drive satisfaction within a factor.
“Diagnostics” are criticalto quality elements that influence satisfaction within an attribute or factor.
Factor
Factor
Diagnostic
Attribute
Financial ROI
Attribute
Attribute
Attribute
Index ExplainsOSAT and
Loyalty Measures
FactorsExplainIndex
AttributesExplainFactor
4
J.D. Power 2017 Home Buyer/Seller Satisfaction Study
Leveraging J.D. Power Data to Better Understand Competitive PositionSatisfaction DriversThe index among home buyers categorizes the customer experience into four factors and 14 attributes:
• Agent/Salesperson – Courtesy – Effectiveness at showing you properties in your
price range – Helpfulness in determining price offered to seller – Skills in negotiating with seller – Timeliness of returning calls and emails – Usefulness of information provided about
neighborhoods/schools
• Real Estate Office – Cleanliness of the office – Courtesy of the office staff – Layout and design of the office – Responsiveness to your questions
• Closing Process – Ease of closing – Ease of understanding documents – Helpfulness of the agent
• Variety of Additional Services – Overall rating of the variety of additional
services offered
The index among home sellers categorizes the customer experience into five factors and 17 attributes:
• Agent/Salesperson – Courtesy – Effectiveness of screening for potential buyers – Helpfulness in determining fair market value and
a listing price – Knowledge of technology tools to market your home – Skills in negotiating with buyer – Timeliness of returning calls and emails
• Real Estate Office – Cleanliness of the office – Courtesy of the office staff – Layout and design of the office – Responsiveness to your questions
• Closing Process – Ease of closing – Ease of understanding documents – Helpfulness of the agent
• Variety of Additional Services – Overall rating of the variety of additional services offered
• Marketing – Hosting an open house to market your home – Online/Internet marketing of your home – Print and outdoor marketing of your home
5
J.D. Power 2017 Home Buyer/Seller Satisfaction Study
J.D. Power offers a proprietary oversample opportunity allowing companies that are not currently profiled in the syndicated study to obtain competitive data sets in order to benchmark their performance against competitors that are profiled in the study.
OversamplingJ.D. Power offers a proprietary oversample opportunity allowing companies that are not currently profiled in the syndicated study to obtain competitive data sets in order to benchmark their performance against competitors that are profiled in the study. This opportunity is also available for profiled companies that want to dive deeper into a specific topic covered in the study. The same questionnaire used for the syndicated study is used for the proprietary oversample study.
Subscription DetailsThe 2017 Home Buyer/Seller Satisfaction Study provides access to the insights and tools needed to gain a comprehensive, in-depth understanding of how your company is performing and to identify key areas needing improvement.
Study deliverables include:
• New online dashboard analytic tool
– Active dashboard: Data elements in the dashboard may include such items as key charts and tables that highlight rankings, verbatim reports, broadcast messages that have been shared, scorecards, and other user-uploaded documents of interest. Dashboards can be customized to contain only the information that is critical for each user, and an expandable toolbar allows users to easily conduct ad hoc analyses and reports
– Performance analysis: Allows users to easily view key metrics against multiple points of reference, providing them with more control when performing root-cause analyses and benchmarking
– Verbatim comments: Full search functionality allows rapid access to verbatims of interest
• Scorecard: Competitive performance overview by factor and attribute
• Access to a personalized competitive data set allows you to see how your company stacks up against your competitors, the industry, and the top performers across factors and attributes at the national level
– Competitive data set in SPSS and Excel file format
• An on-site executive presentation with management insights, which includes customized strategic recommendations, study results, ongoing best practices, and analyses of high-performing real estate companies
• Swoop gap analysis: Highlights improvement opportunities that have the greatest impact on customer satisfaction
• Copy of the current questionnaire

6
J.D. Power 2017 Home Buyer/Seller Satisfaction Study
Beyond Measurejdpower.com
For more information about J.D. Power products and services, please contact:
Christina Cooley at 805-279-0354 or [email protected] Tapp Nicholson at 859-428-6117 or [email protected]
080917
J.D. Power’s industry benchmarks, unique data and analytics platform, and reputation for independence and credibility has established the company as one of the world’s most well-known and trusted providers of Voice of the Customer insights.
About J.D. PowerJ.D. Power is a marketing, consumer intelligence, and data and analytics company that helps its clients measure, understand, and improve the key performance metrics that drive their growth and profitability. J.D. Power’s industry benchmarks, unique data and analytics platform, and reputation for independence and credibility has established the company as one of the world’s most well-known and trusted providers of Voice of the Customer insights. Established in 1968, J.D. Power is headquartered in Costa Mesa, California, and has offices in North/South America, Asia Pacific, and Europe.