2017 investor and analyst dayinvestor.itw.com/.../itw-2017-investor-day-presentation.pdf2017...
TRANSCRIPT

1
2017 Investor Day
December 1, 2017

2 0 1 7 I N V E S T O R D A Y |
CHRISTOPHER A. O’HERLIHY
Vice Chairman
28 YEARS WITH ITW
VICE CHAIRMAN SINCE
2015
PRESENTERS
E. SCOTT SANTI
Chairman & CEO
35YEARS WITH ITW
CEO SINCE
2012
MICHAEL M. LARSEN
SVP & CFO
5 YEARS WITH ITW
CFO SINCE
2013
2
2 0 1 7 I N V E S T O R D A Y |
FORWARD-LOOKING STATEMENTS
SAFE HARBOR STATEMENT
This presentation contains forward-looking statements within the meaning of the Private Securities Litigation Reform
Act of 1995 including, without limitation, statements regarding the expected impact and timing of enterprise initiatives
and related benefits, future financial performance, operating performance, growth in free cash flow, organic and total
revenue growth, operating margin growth, growth in diluted income per share, growth in after-tax return on invested
capital, expected total shareholder returns, restructuring expenses and related benefits, effective tax rates, exchange
rates, timing and amount of share repurchases, end-market economic conditions, and the Company’s related 2017
and 2018 guidance. These statements are subject to certain risks, uncertainties, and other factors which could cause
actual results to differ materially from those anticipated. Important risks that could cause actual results to differ
materially from the Company’s expectations include those that are detailed in ITW’s Form 10-K for 2016.
NON-GAAP MEASURES
The Company uses certain non-GAAP measures in discussing the Company’s performance. The reconciliation of
those measures to the most comparable GAAP measures is detailed in ITW’s Form 10-K for 2016 and the appendix of
this presentation, which are available at www.itw.com, together with this presentation.
3

2 0 1 7 I N V E S T O R D A Y |
2018 GUIDANCE
AGENDA
ITW’s STRATEGIC FRAMEWORK
STRATEGIC FRAMEWORK IMPLEMENTATION
PHASE I: REPOSITIONING (2013 - 2018+)
PHASE II: SUSTAINING (2018 - 2022)
ANNUAL PERFORMANCE GOALS: 2018 - 2022
SUMMARY / MOVING FORWARD
1
3
4
5
4
BREAK6
Q&A7
2

2 0 1 7 I N V E S T O R D A Y |
HIGHLY SUCCESSFUL 105 YEAR HISTORY
ITW’s Enduring Performance:
• Willing to CRITICALLY ASSESS our strategic
positioning at key points in our history…
• … and CHANGE COURSE when necessary to
sustain differentiated performance
5
17%
11%
ITW S&P 500
Chicago financier Byron Smith, ITW Founder
Total Annualized Shareholder Return
Since 1980

2 0 1 7 I N V E S T O R D A Y |
2011 - 2012: OUR MOST RECENT STRATEGIC PIVOT POINT
PLATEAUING COMPANY PERFORMANCE
6
ACQUISITION-CENTRIC
growth strategy not sustainable
Accumulated ORGANIZATIONAL
COMPLEXITY
from 600+ acquisitions
over 25 years
GLOBALIZATION =
increasingly intense
competitive environment

2 0 1 7 I N V E S T O R D A Y |
OBJECTIVES OF OUR 2011 - 2012 STRATEGY “REFRESH”:
IN AN INCREASINGLY COMPETITIVELY INTENSE AND
VOLATILE GLOBAL MARKET ENVIRONMENT
7
MAXIMIZE ITW’S
POTENTIAL TO
CONSISTENTLY DELIVER
DIFFERENTIATED
PERFORMANCE
1
BEST POSITION ITW
AS A HIGHLY VALUED
CORE HOLDING
FOR LONG-TERM
ORIENTED INVESTORS
2
AND
2 0 1 7 I N V E S T O R D A Y |
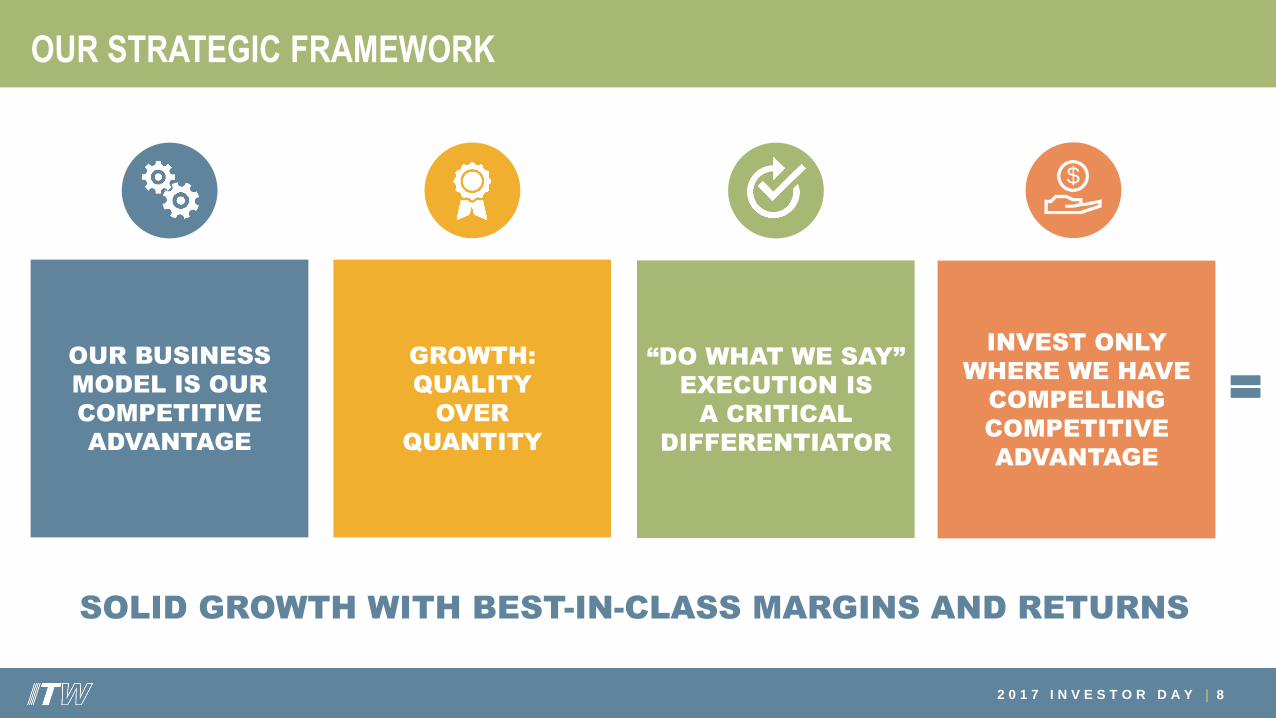
OUR STRATEGIC FRAMEWORK
8
INVEST ONLY
WHERE WE HAVE
COMPELLING
COMPETITIVE
ADVANTAGE
“DO WHAT WE SAY”
EXECUTION IS
A CRITICAL
DIFFERENTIATOR
GROWTH:
QUALITY
OVER
QUANTITY
OUR BUSINESS
MODEL IS OUR
COMPETITIVE
ADVANTAGE
$
=
SOLID GROWTH WITH BEST-IN-CLASS MARGINS AND RETURNS

2 0 1 7 I N V E S T O R D A Y |
STRATEGY FRAMEWORK IMPLEMENTATION
9
SIMPLIFY AND SCALE-UP
ITW’S OPERATING
STRUCTURE
Business Structure
Simplification
BETTER LEVERAGE ITW’S
SCALE TO ENHANCE
GLOBAL
COMPETITIVENESS
Strategic Sourcing
SHIFT PRIMARY GROWTH
FOCUS
From acquisition
to organic
1 2 3 4
NARROW THE FOCUS
AND IMPROVE THE
QUALITY OF ITW’S
BUSINESS PORTFOLIO
Sustainable differentiation
is a “must-have”
EXCELLENCE IN THE PRACTICE OF
THE ITW BUSINESS MODEL
Everywhere in the company, every day
5 6SUSTAINED ABOVE-MARKET
ORGANIC GROWTH
Through the cycle
PHASE I – REPOSITIONING (2013 - 2018+)
PHASE II – SUSTAINING DIFFERENTIATED PERFORMANCE (2018 - 2022)
10
Our Business Model is
our Competitive
Advantage
2 0 1 7 I N V E S T O R D A Y |
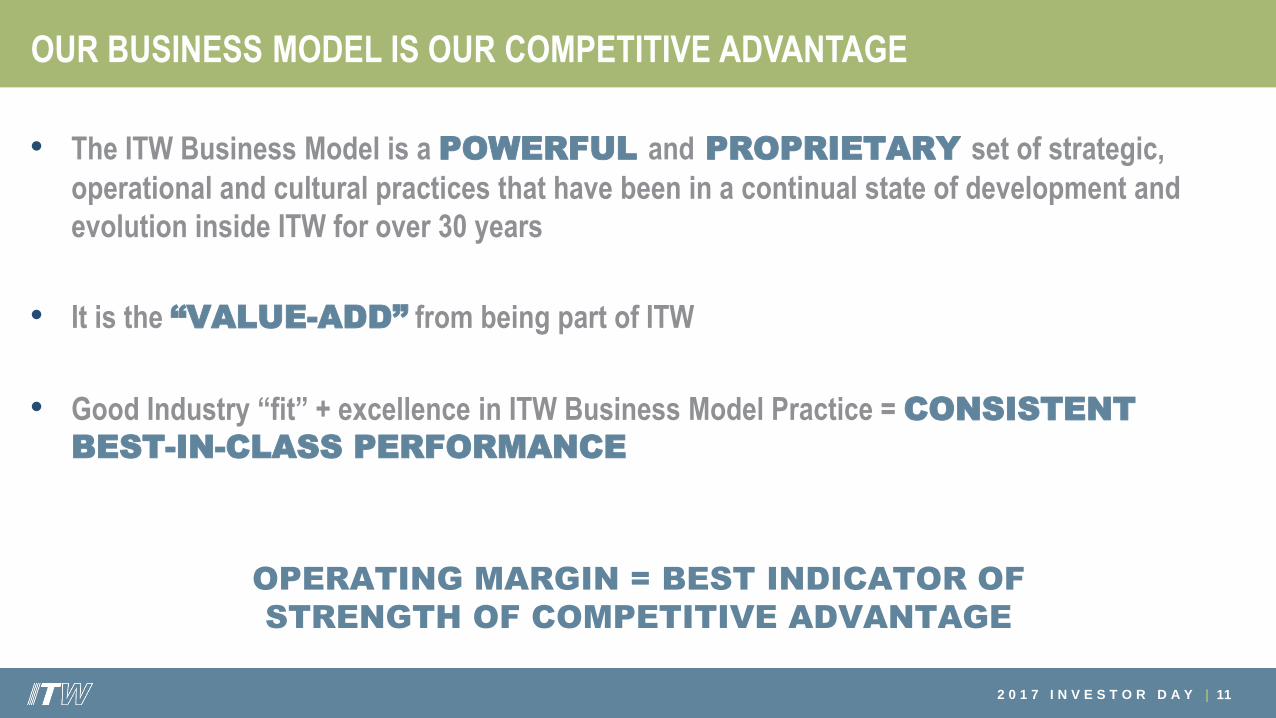
OUR BUSINESS MODEL IS OUR COMPETITIVE ADVANTAGE
OPERATING MARGIN = BEST INDICATOR OF
STRENGTH OF COMPETITIVE ADVANTAGE
11
• The ITW Business Model is a POWERFUL and PROPRIETARY set of strategic,
operational and cultural practices that have been in a continual state of development and
evolution inside ITW for over 30 years
• It is the “VALUE-ADD” from being part of ITW
• Good Industry “fit” + excellence in ITW Business Model Practice = CONSISTENT
BEST-IN-CLASS PERFORMANCE
2 0 1 7 I N V E S T O R D A Y |
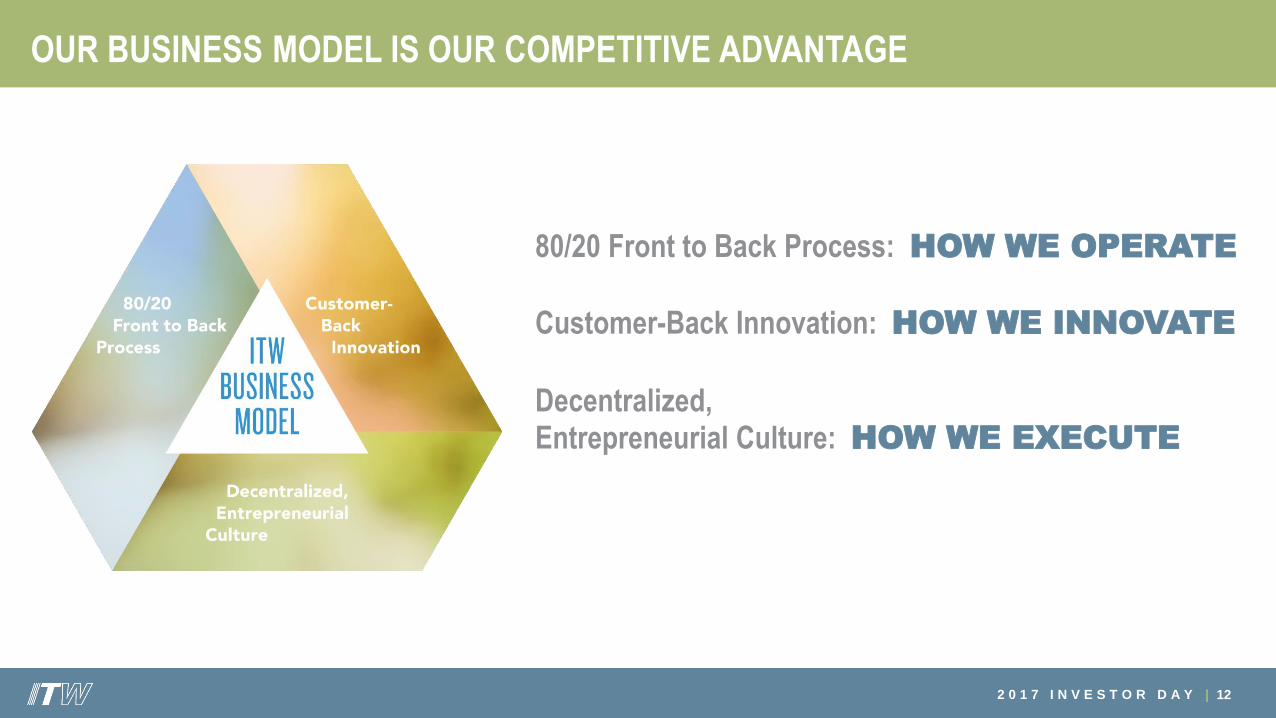
OUR BUSINESS MODEL IS OUR COMPETITIVE ADVANTAGE
12
80/20 Front to Back Process: HOW WE OPERATE
Customer-Back Innovation: HOW WE INNOVATE
Decentralized,Entrepreneurial Culture: HOW WE EXECUTE
2 0 1 7 I N V E S T O R D A Y |
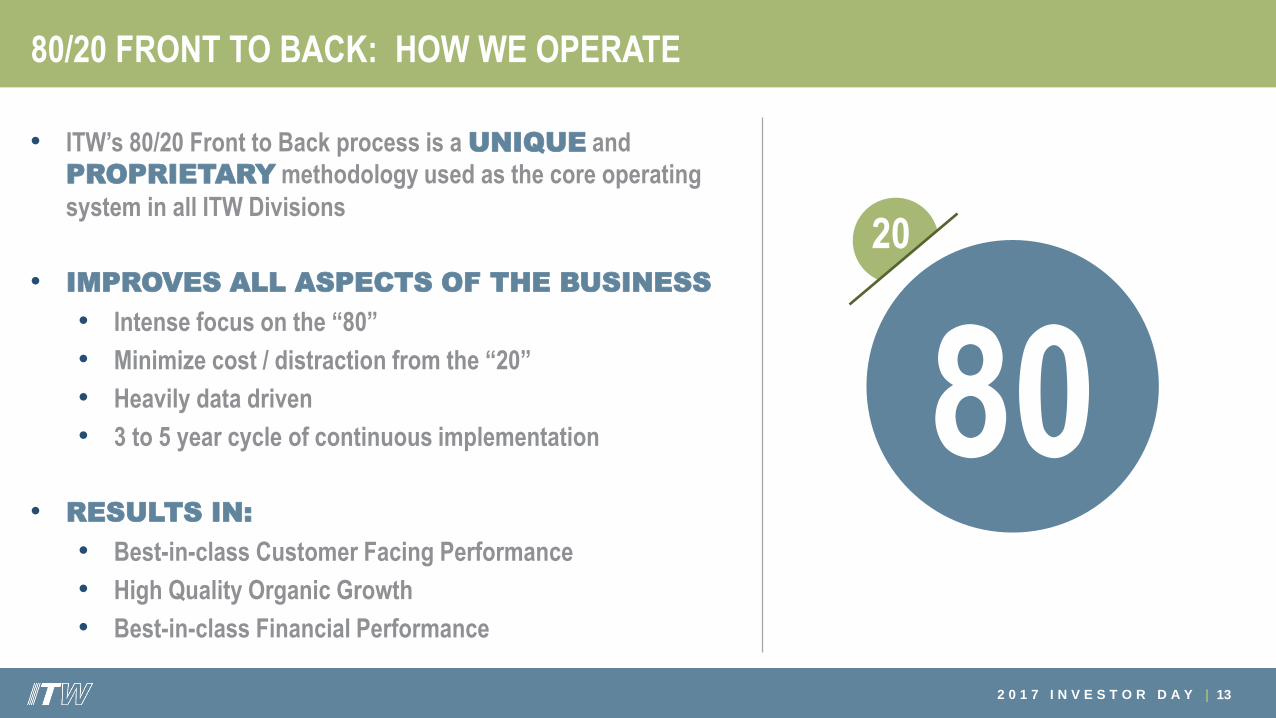
80/20 FRONT TO BACK: HOW WE OPERATE
13
• ITW’s 80/20 Front to Back process is a UNIQUE and
PROPRIETARY methodology used as the core operating
system in all ITW Divisions
• IMPROVES ALL ASPECTS OF THE BUSINESS
• Intense focus on the “80”
• Minimize cost / distraction from the “20”
• Heavily data driven
• 3 to 5 year cycle of continuous implementation
• RESULTS IN:
• Best-in-class Customer Facing Performance
• High Quality Organic Growth
• Best-in-class Financial Performance
8020

2 0 1 7 I N V E S T O R D A Y |
CUSTOMER-BACK INNOVATION: HOW WE INNOVATE
14
Customer-Back Innovation enables our divisions to deliver a STEADY FLOW OF DIFFERENTIATED NEW
PRODUCTS AND SOLUTIONS for our “80” customers
A key contributor to ITW’s ability to deliver consistentABOVE-MARKET REVENUE GROWTH
• Contributes 1+% Organic Growth annually
• 1,600+ new patent applications/year
• Over half of ITW revenues covered by patents or
proprietary trade secrets
2 0 1 7 I N V E S T O R D A Y |
ITW’S DECENTRALIZED ENTREPRENEURIAL CULTURE: HOW WE EXECUTE
15
ITW’s decentralized entrepreneurial culture is the engine
that drives the highly efficient conversion of
STRATEGY into ACTION and ACTION into RESULTS
2 0 1 7 I N V E S T O R D A Y |
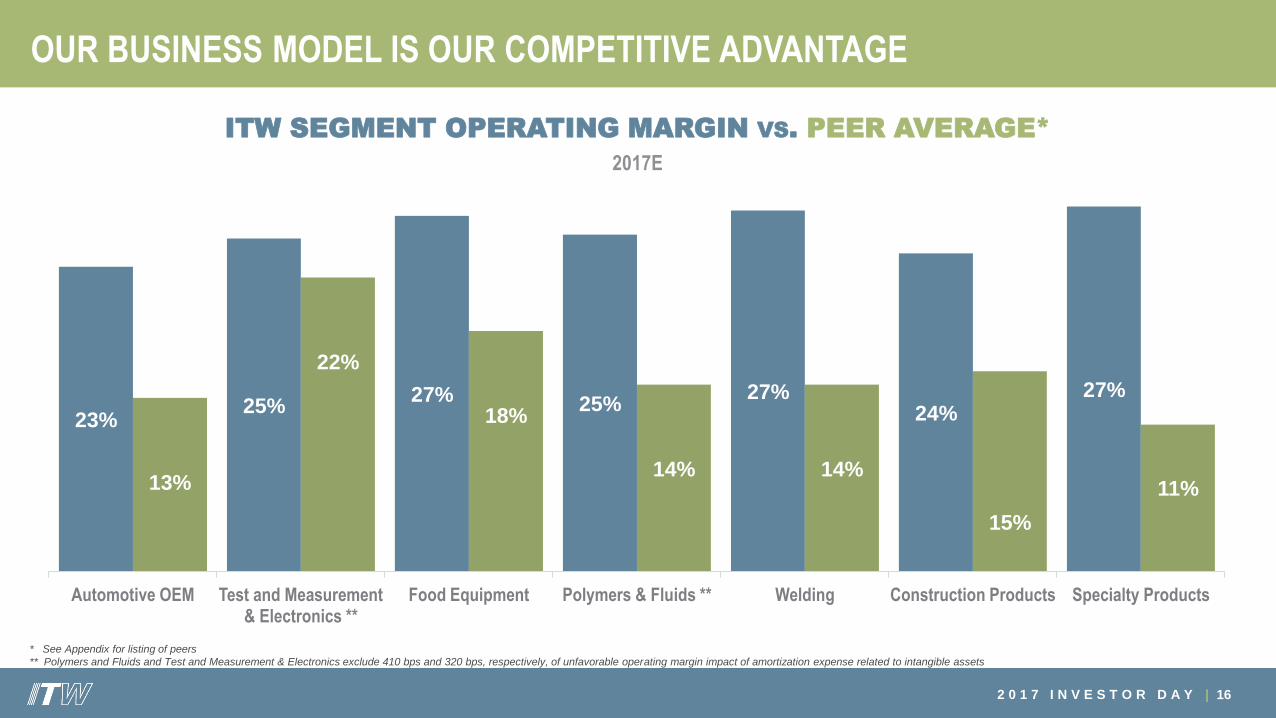
23%25%
27% 25%27%
24%27%
13%
22%
18%
14% 14%
15%
11%
Automotive OEM Test and Measurement & Electronics **
Food Equipment Polymers & Fluids ** Welding Construction Products Specialty Products
OUR BUSINESS MODEL IS OUR COMPETITIVE ADVANTAGE
16
ITW SEGMENT OPERATING MARGIN VS. PEER AVERAGE*
2017E
* See Appendix for listing of peers
** Polymers and Fluids and Test and Measurement & Electronics exclude 410 bps and 320 bps, respectively, of unfavorable operating margin impact of amortization expense related to intangible assets
2 0 1 7 I N V E S T O R D A Y |
OUR BUSINESS MODEL IS OUR COMPETITIVE ADVANTAGE
17
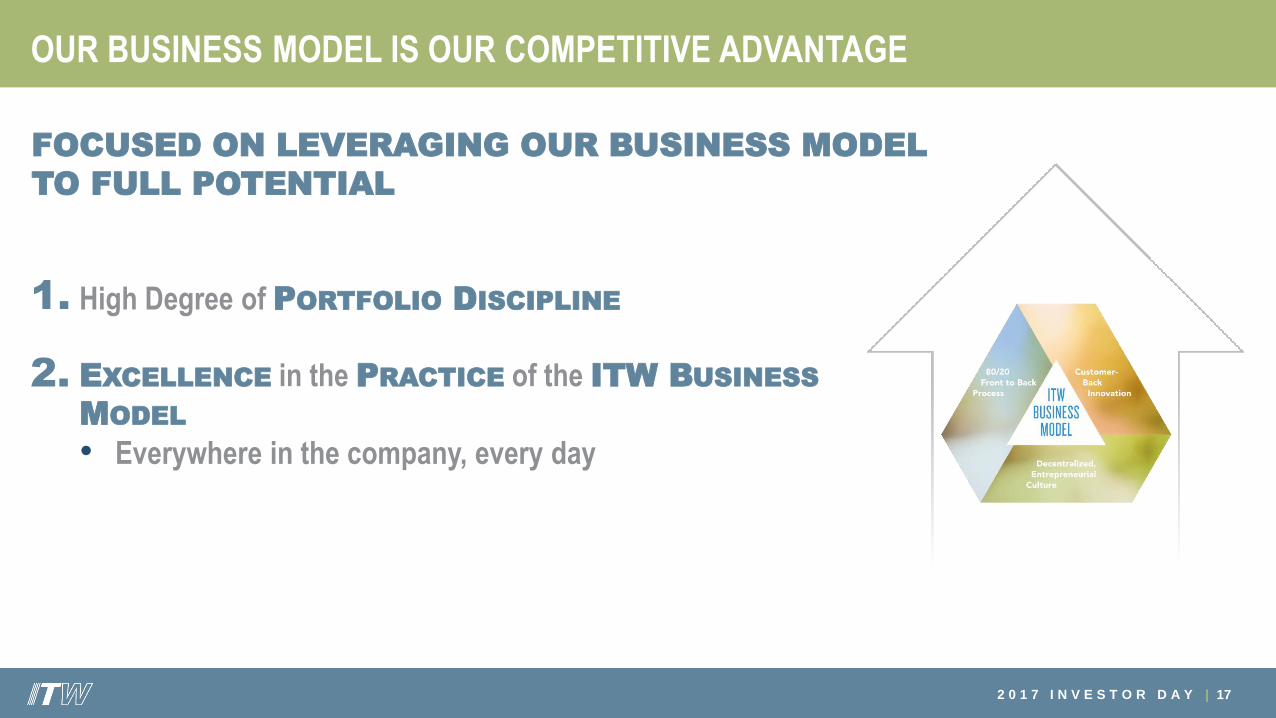
FOCUSED ON LEVERAGING OUR BUSINESS MODEL
TO FULL POTENTIAL
High Degree of PORTFOLIO DISCIPLINE
EXCELLENCE in the PRACTICE of the ITW BUSINESS
MODEL
• Everywhere in the company, every day
1.
2.
2 0 1 7 I N V E S T O R D A Y |
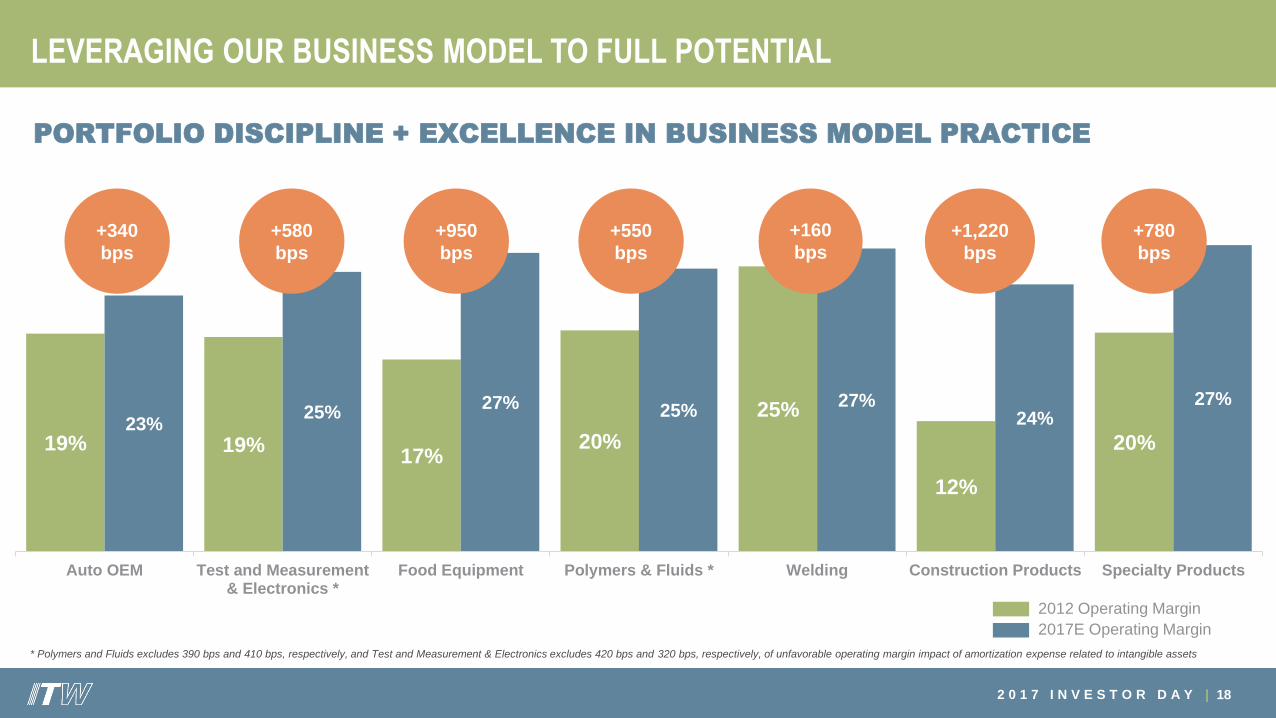
LEVERAGING OUR BUSINESS MODEL TO FULL POTENTIAL
PORTFOLIO DISCIPLINE + EXCELLENCE IN BUSINESS MODEL PRACTICE
18
19% 19%17%
20%
25%
12%
20%23%
25%27% 25%
27%24%
27%
Auto OEM Test and Measurement& Electronics *
Food Equipment Polymers & Fluids * Welding Construction Products Specialty Products
+340
bps
+580
bps
+950
bps
+550
bps
+1,220
bps
* Polymers and Fluids excludes 390 bps and 410 bps, respectively, and Test and Measurement & Electronics excludes 420 bps and 320 bps, respectively, of unfavorable operating margin impact of amortization expense related to intangible assets
+780
bps
2017E Operating Margin
2012 Operating Margin
+160
bps

2 0 1 7 I N V E S T O R D A Y |
OUR BUSINESS MODEL IS OUR COMPETITIVE ADVANTAGE
19
BUSINESS MODEL DERIVED COMPETITIVE ADVANTAGE:
Enables a HIGHLY DIVERSIFIED Business Portfolio
Provides optionality to open up NEW AVENUES of PROFITABLE GROWTH
over time
BUT, WE HAVE TO CONTINUALLY EARN THE RIGHT TO BE A
“MULTI-BUSINESS” COMPANY THROUGH OUR PERFORMANCE
THERE CAN BE NO “WEAK LINKS”
1.
2.
2 0 1 7 I N V E S T O R D A Y |
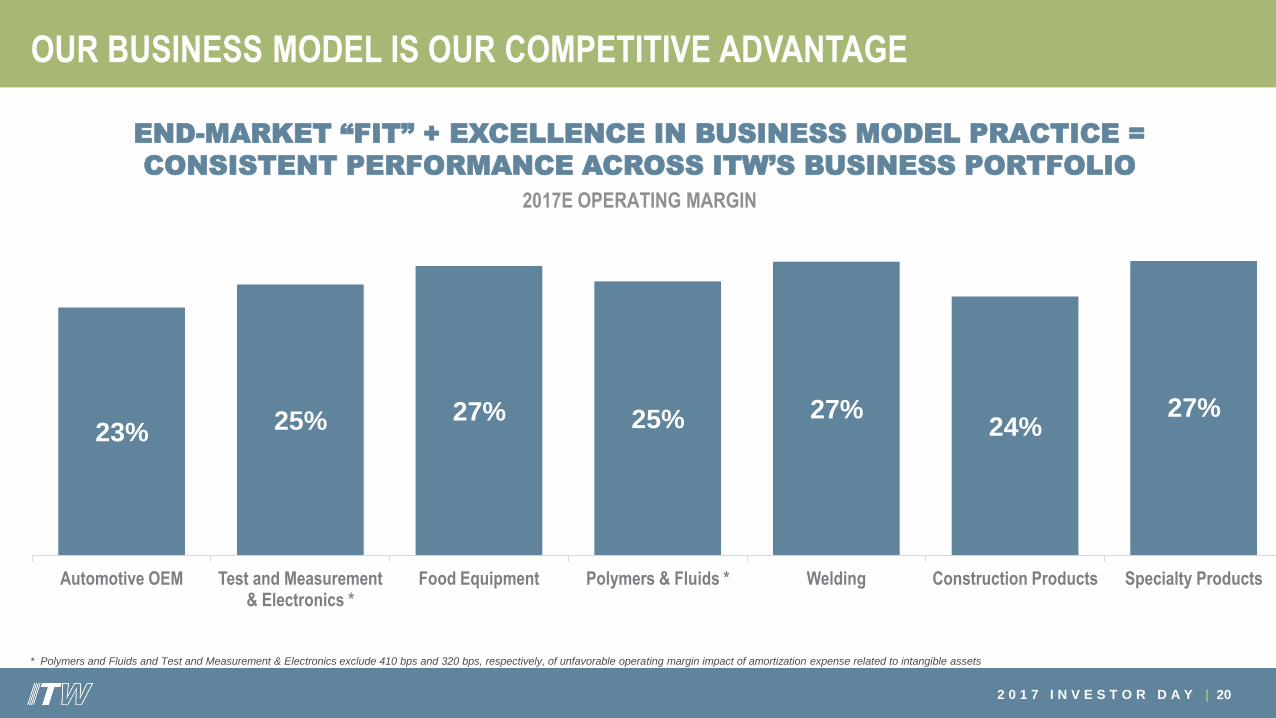
OUR BUSINESS MODEL IS OUR COMPETITIVE ADVANTAGE
END-MARKET “FIT” + EXCELLENCE IN BUSINESS MODEL PRACTICE =
CONSISTENT PERFORMANCE ACROSS ITW’S BUSINESS PORTFOLIO
2017E OPERATING MARGIN
20
23% 25% 27% 25% 27%24%
27%
Automotive OEM Test and Measurement & Electronics *
Food Equipment Polymers & Fluids * Welding Construction Products Specialty Products
* Polymers and Fluids and Test and Measurement & Electronics exclude 410 bps and 320 bps, respectively, of unfavorable operating margin impact of amortization expense related to intangible assets

21
Growth:
Quality Over
Quantity
2 0 1 7 I N V E S T O R D A Y |
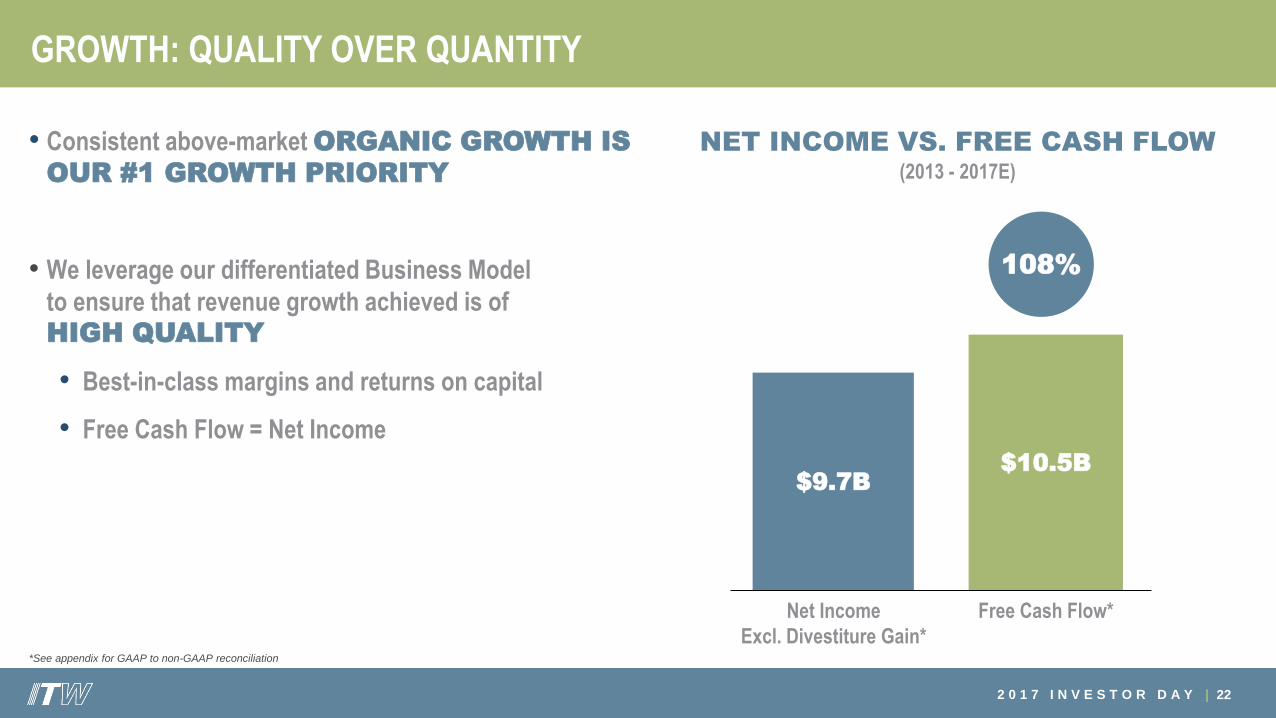
GROWTH: QUALITY OVER QUANTITY
• Consistent above-market ORGANIC GROWTH IS
OUR #1 GROWTH PRIORITY
• We leverage our differentiated Business Model
to ensure that revenue growth achieved is ofHIGH QUALITY
• Best-in-class margins and returns on capital
• Free Cash Flow = Net Income
22
$9.7B$10.5B
Net Income
Excl. Divestiture Gain*
Free Cash Flow*
NET INCOME VS. FREE CASH FLOW (2013 - 2017E)
108%
*See appendix for GAAP to non-GAAP reconciliation

2 0 1 7 I N V E S T O R D A Y |
GROWTH: QUALITY OVER QUANTITY
To enable CONSISTENT HIGH QUALITY ORGANIC GROWTH, we have to construct and maintain
a portfolio of highly DIFFERENTIATED businesses that can leverage the ITW Business Model to deliver
above-market growth across a wide range of economic scenarios:
23
STABLE
UNDERLYING
MARKET
growth
Moderate pace of TECHNOLOGY
EVOLUTION
BUSINESS
TO BUSINESS:
It’s what we know
ROOM
TO GROW:
$10B+
global markets
Sustainable
differentiation: product PERFORMANCE
MATTERS to the
customer, best
solution wins
B2B

2 0 1 7 I N V E S T O R D A Y |
GROWTH: QUALITY OVER QUANTITY
24
ITW’S HIGH QUALITY PORTFOLIO: ORGANIC GROWTH POTENTIAL
Organic
Growth
Automotive
OEM
Test &
Measurement
Electronics
Food
Equipment
Polymers
& FluidsWelding
Construction
Products
Specialty
Products
Market 1 - 2% 2 - 3% 2 - 3% 2 - 3% 2 - 3% 2 - 3% 1 - 2%
Segment 5 - 6% 4 - 5% 4 - 5% 3 - 4% 4 - 5% 3 - 4% 3 - 4%
LOTS OF ROOM TO GROW: RELEVANT MARKET SHARE RANGES FROM 15% TO 25%

2 0 1 7 I N V E S T O R D A Y |
ITW AUTOMOTIVE OEM
25
$3.3B2017E
REVENUES
23%2017E
OPERATING
MARGIN
5 - 6%ORGANIC
GROWTH
POTENTIAL
ORGANIC GROWTH DRIVERS
• ~$35/car current global penetration vs. ~$230/car potential
• Continued penetration into top tier Chinese OEMs
• Electric Vehicle growth
KEY COMPETITIVE ADVANTAGES
• Deep engineering relationships with key global Auto OEMs
• Complex injection-molding and deep metal forming
manufacturing capability
• Ability to execute “copy exact” solutions globally
2 0 1 7 I N V E S T O R D A Y |
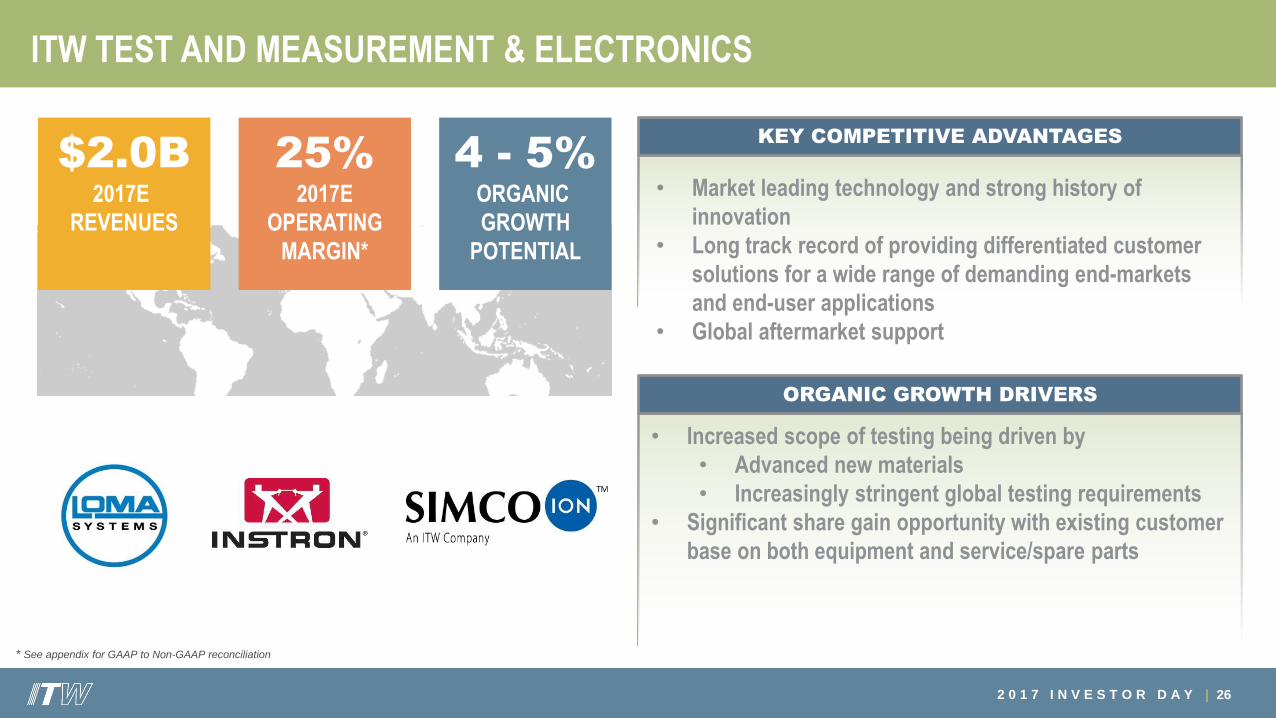
$2.0B2017E
REVENUES
25%2017E
OPERATING
MARGIN*
4 - 5%ORGANIC
GROWTH
POTENTIAL
ITW TEST AND MEASUREMENT & ELECTRONICS
26
ORGANIC GROWTH DRIVERS
• Increased scope of testing being driven by
• Advanced new materials
• Increasingly stringent global testing requirements
• Significant share gain opportunity with existing customer
base on both equipment and service/spare parts
KEY COMPETITIVE ADVANTAGES
• Market leading technology and strong history of
innovation
• Long track record of providing differentiated customer
solutions for a wide range of demanding end-markets
and end-user applications
• Global aftermarket support
* See appendix for GAAP to Non-GAAP reconciliation

2 0 1 7 I N V E S T O R D A Y |
ITW FOOD EQUIPMENT
27
ORGANIC GROWTH DRIVERS
• Significant share gain potential in both Equipment and
Service
• Full pipeline of innovation to address industry trends &
customer pain points:
• Solutions with lowest “total cost of ownership” over
entire life cycle of equipment
• Higher food safety standards and enforcement
KEY COMPETITIVE ADVANTAGES
• Widely known and respected brands
• Strong track record of differentiated innovation
• Fully integrated equipment and service solution offering
with global scale and reach
$2.1B2017E
REVENUES
27%2017E
OPERATING
MARGIN
4 - 5%ORGANIC
GROWTH
POTENTIAL
2 0 1 7 I N V E S T O R D A Y |
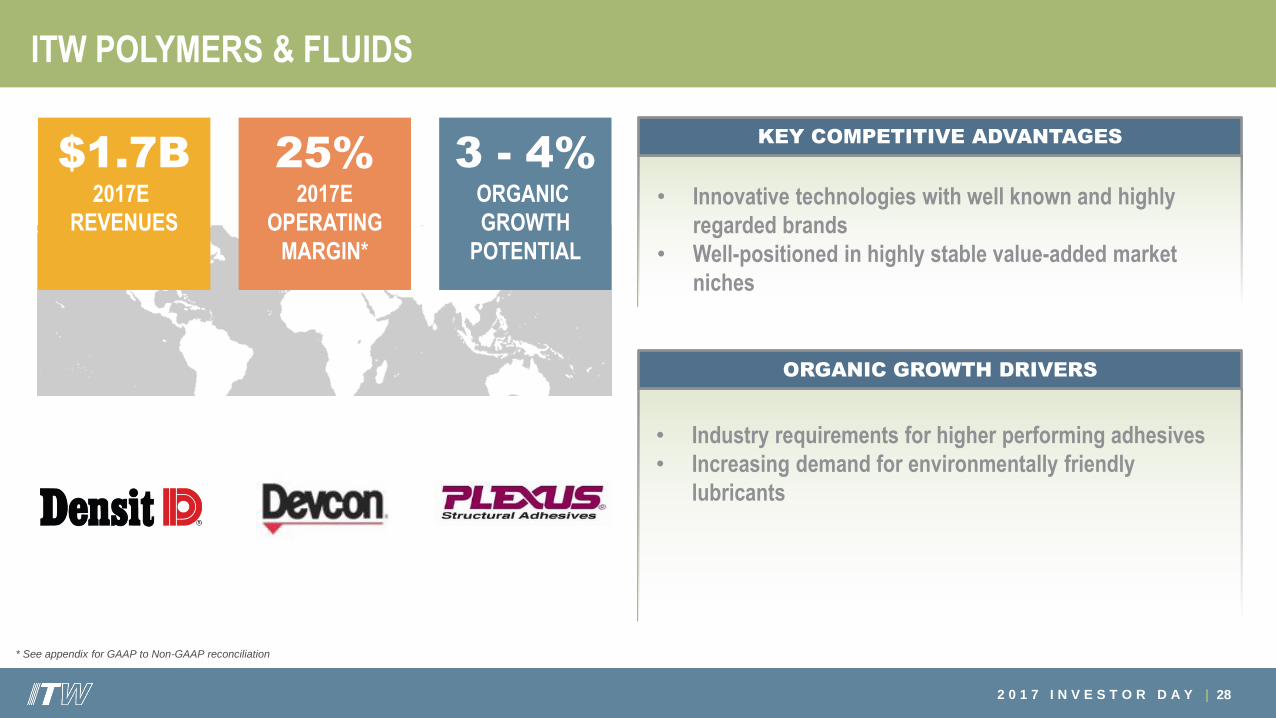
ITW POLYMERS & FLUIDS
28
KEY COMPETITIVE ADVANTAGES
• Innovative technologies with well known and highly
regarded brands
• Well-positioned in highly stable value-added market
niches
$1.7B2017E
REVENUES
25%2017E
OPERATING
MARGIN*
3 - 4%ORGANIC
GROWTH
POTENTIAL
ORGANIC GROWTH DRIVERS
• Industry requirements for higher performing adhesives
• Increasing demand for environmentally friendly
lubricants
* See appendix for GAAP to Non-GAAP reconciliation
2 0 1 7 I N V E S T O R D A Y |
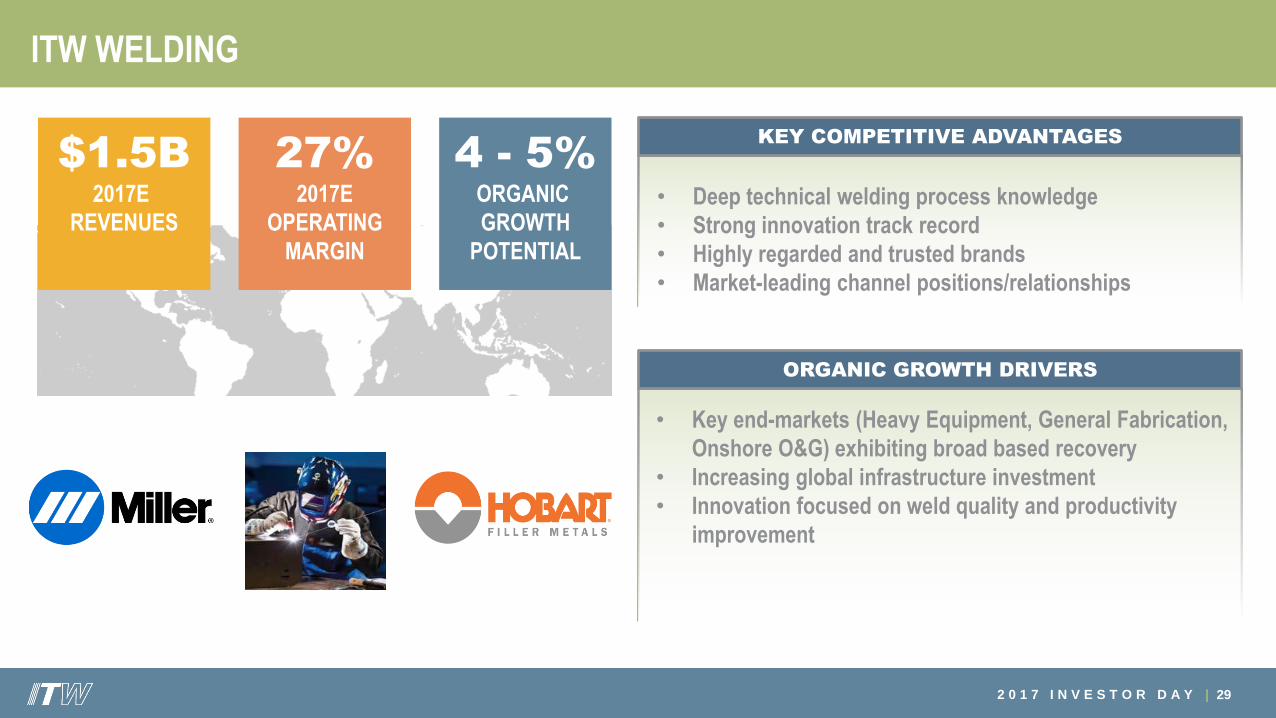
$1.5B2017E
REVENUES
27%2017E
OPERATING
MARGIN
4 - 5%ORGANIC
GROWTH
POTENTIAL
ITW WELDING
29
KEY COMPETITIVE ADVANTAGES
• Deep technical welding process knowledge
• Strong innovation track record
• Highly regarded and trusted brands
• Market-leading channel positions/relationships
ORGANIC GROWTH DRIVERS
• Key end-markets (Heavy Equipment, General Fabrication,
Onshore O&G) exhibiting broad based recovery
• Increasing global infrastructure investment
• Innovation focused on weld quality and productivity
improvement

2 0 1 7 I N V E S T O R D A Y |
$1.7B2017E
REVENUES
24%2017E
OPERATING
MARGIN
3 - 4%ORGANIC
GROWTH
POTENTIAL
ITW CONSTRUCTION PRODUCTS
30
KEY COMPETITIVE ADVANTAGES
• Deep fastening system engineering capabilities
• Highly regarded global brands
• Strong channel partnerships
• Market-leading cordless technology
ORGANIC GROWTH DRIVERS
• Continued housing recovery in United States
• Cordless technology product line expansion
• More stringent seismic and energy efficiency standards
globally

2 0 1 7 I N V E S T O R D A Y |
$1.9B2017E
REVENUES
27%2017E
OPERATING
MARGIN
3 - 4%ORGANIC
GROWTH
POTENTIAL
ITW SPECIALTY PRODUCTS
31
ORGANIC GROWTH DRIVERS
• Increasing demand for environmentally friendly flexible
packaging
• Consumer safety requirements driving demand for new
packaging solutions globally
KEY COMPETITIVE ADVANTAGES
• Proven packaging design and application capabilities
• Deep engineering and marketing relationships with major
consumer products companies

2 0 1 7 I N V E S T O R D A Y |
GROWTH: QUALITY OVER QUANTITY
• 2013 - 2015: SHIFT PRIMARY GROWTH ENGINE TO ORGANIC
• Re-align Portfolio
• Business Structure Simplification/Scale Up
• Prepare to Grow
• 2016 - 2017: ORGANIC GROWTH FRAMEWORK
• Divisions “Ready to Grow”
• Organic Growth Framework Implemented
• 2017 AND BEYOND: ACCELERATE GROWTH AND SUSTAIN
• “Operationalize” Organic Growth Process in Every Division
• Ongoing Capability Building and Investment to Sustain Growth
32
2 0 1 7 I N V E S T O R D A Y |
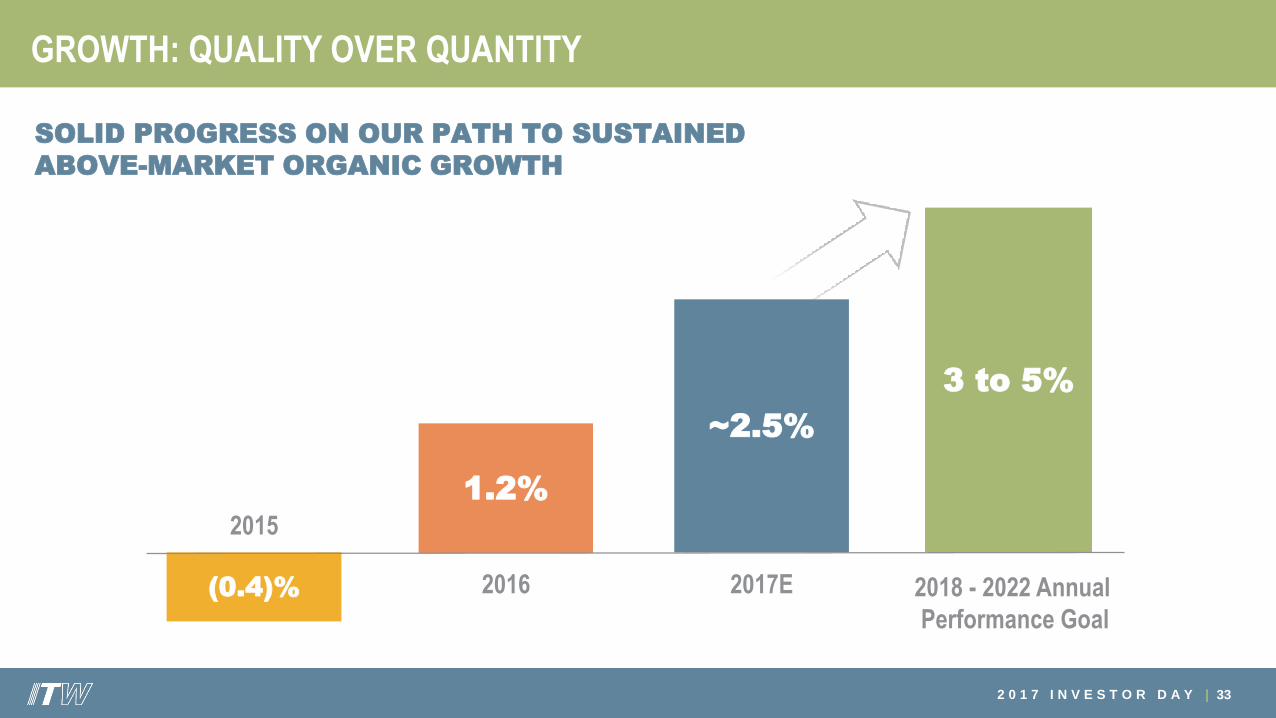
GROWTH: QUALITY OVER QUANTITY
SOLID PROGRESS ON OUR PATH TO SUSTAINED
ABOVE-MARKET ORGANIC GROWTH
33
1.2%2015
2016(0.4)%
~2.5%
2017E
3 to 5%
2018 - 2022 Annual
Performance Goal
34
“Do What We Say”
Execution is a Critical
ITW Differentiator
2 0 1 7 I N V E S T O R D A Y |
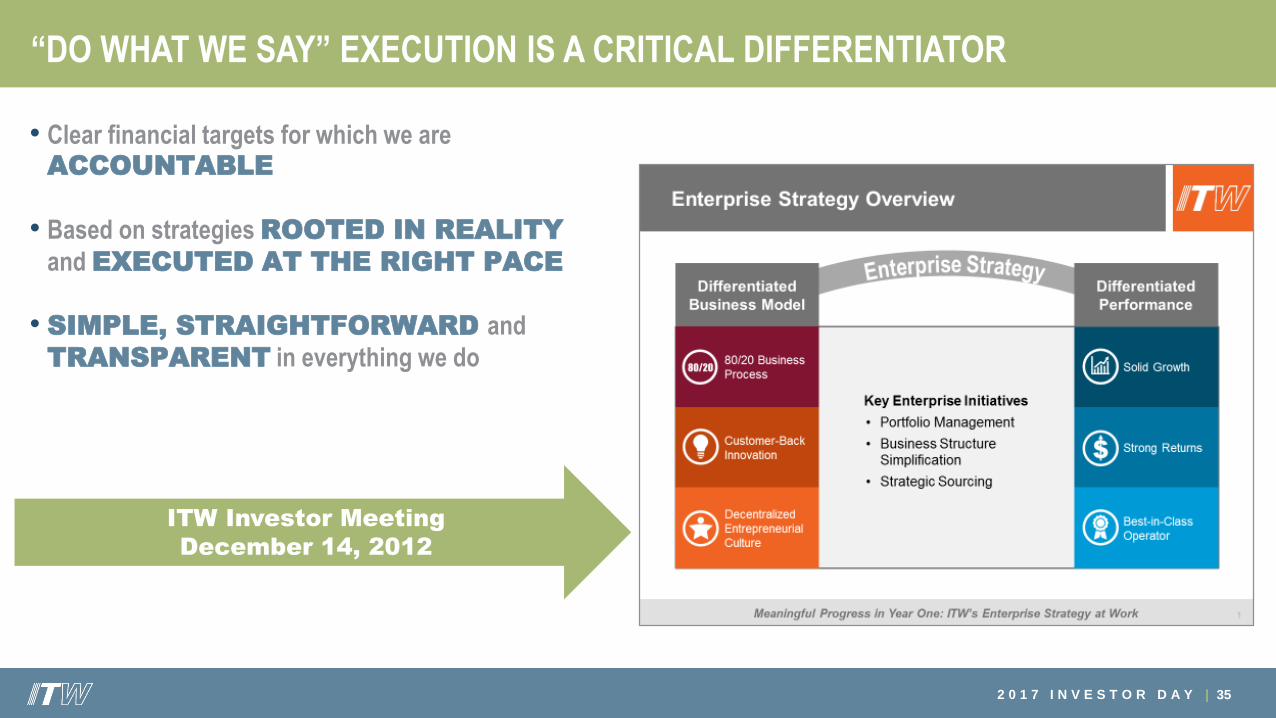
“DO WHAT WE SAY” EXECUTION IS A CRITICAL DIFFERENTIATOR
• Clear financial targets for which we are ACCOUNTABLE
• Based on strategies ROOTED IN REALITY
and EXECUTED AT THE RIGHT PACE
• SIMPLE, STRAIGHTFORWARD and
TRANSPARENT in everything we do
35
ITW Investor Meeting
December 14, 2012

2 0 1 7 I N V E S T O R D A Y |
“DO WHAT WE SAY” EXECUTION IS A CRITICAL DIFFERENTIATOR
36
ITW CULTURE: HOW WE EXECUTE
At ITW, our DECENTRALIZED,
ENTREPRENEURIAL CULTURE
is the engine that translates STRATEGY into ACTION and
ACTION into RESULTS
2 0 1 7 I N V E S T O R D A Y |
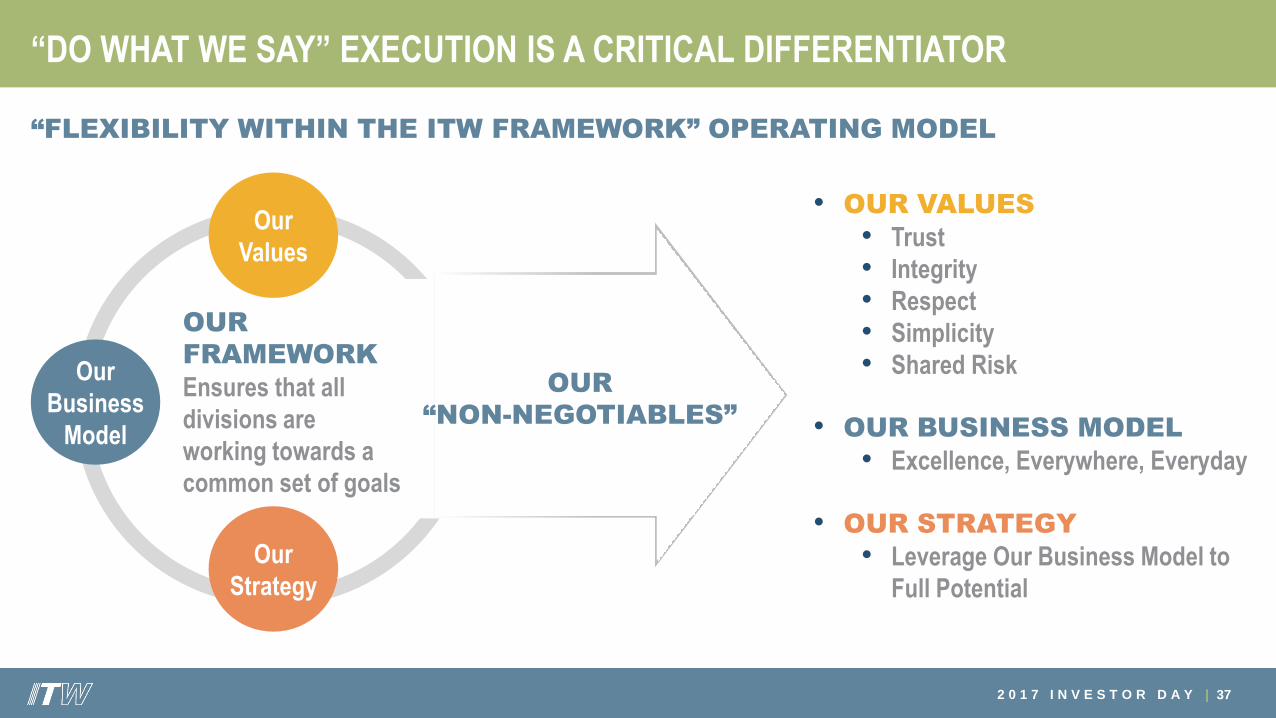
“DO WHAT WE SAY” EXECUTION IS A CRITICAL DIFFERENTIATOR
37
OUR
“NON-NEGOTIABLES”
OUR
FRAMEWORK
Ensures that all
divisions are
working towards a
common set of goals
“FLEXIBILITY WITHIN THE ITW FRAMEWORK” OPERATING MODEL
Our
Business
Model
Our
Values
Our
Strategy
• OUR VALUES
• Trust
• Integrity
• Respect
• Simplicity
• Shared Risk
• OUR BUSINESS MODEL
• Excellence, Everywhere, Everyday
• OUR STRATEGY
• Leverage Our Business Model to
Full Potential

2 0 1 7 I N V E S T O R D A Y |
“DO WHAT WE SAY” EXECUTION IS A KEY DIFFERENTIATOR
38
WITHIN OUR FRAMEWORK,
our division leaders customize the
application of ITW’s business model
and strategy to maximize impact
OUR
FRAMEWORK
Ensures that all
divisions are
working towards a
common set of goals
Our
Business
Model
Our
Values
Our
Strategy
Solid Growth
with Best-in-Class
Margins & Returns
“FLEXIBILITY WITHIN THE ITW FRAMEWORK” OPERATING MODEL

2 0 1 7 I N V E S T O R D A Y |
“DO WHAT WE SAY” EXECUTION IS A CRITICAL DIFFERENTIATOR
ENTREPRENEURIAL:
39
Within our DECENTRALIZED divisional structure
our leaders run REAL BUSINESSES
They are empowered to THINK AND ACT LIKE OWNERS
• Full Functional Control (No Matrix Structures)
• Real P&L Ownership and Accountability
2 0 1 7 I N V E S T O R D A Y |
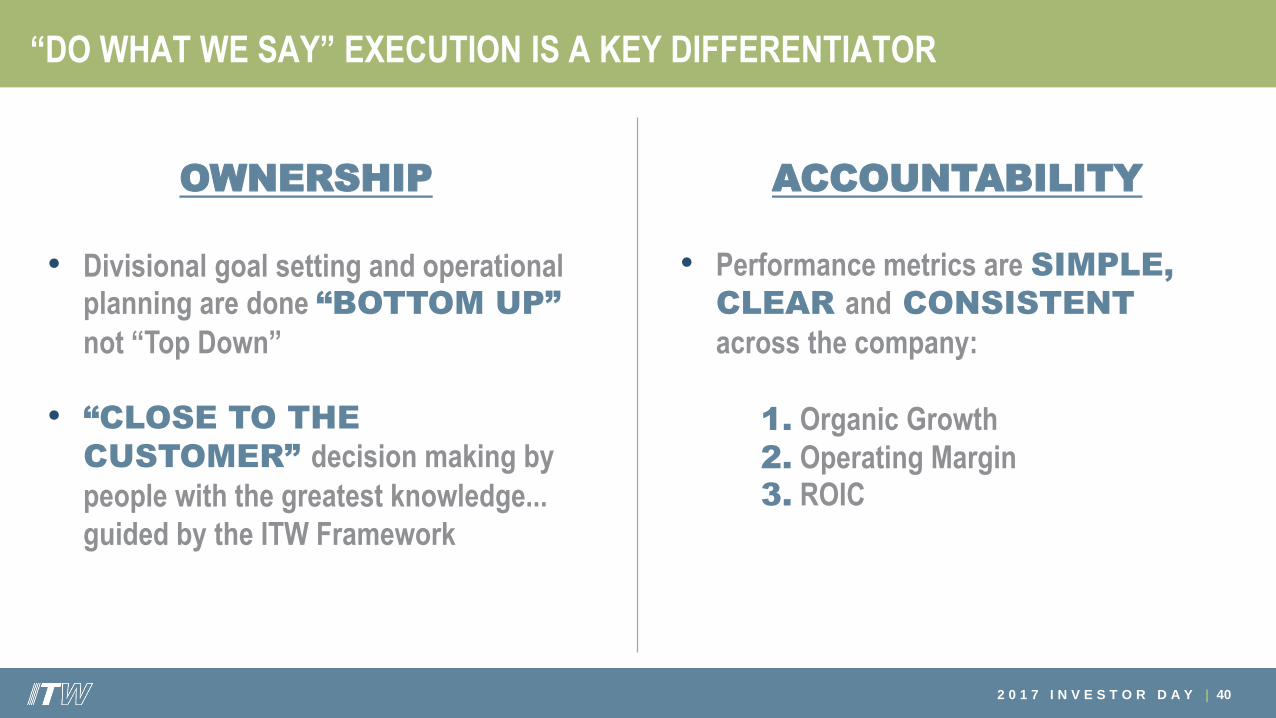
“DO WHAT WE SAY” EXECUTION IS A KEY DIFFERENTIATOR
40
OWNERSHIP
• Divisional goal setting and operational planning are done “BOTTOM UP”
not “Top Down”
• “CLOSE TO THE
CUSTOMER” decision making by
people with the greatest knowledge...
guided by the ITW Framework
ACCOUNTABILITY
• Performance metrics are SIMPLE,
CLEAR and CONSISTENT
across the company:
Organic Growth
Operating Margin ROIC
1.
2.
3.

41
Invest Only Where We
Have Compelling
Competitive Advantage

2 0 1 7 I N V E S T O R D A Y |
INVEST ONLY WHERE WE HAVE COMPELLING COMPETITIVE ADVANTAGE
Underpinning our Enterprise Strategy is a HIGHLY FOCUSED and DISCIPLINED
Approach to Capital Allocation:
• We only invest in areas of opportunity where we can leverage the ITW Business Model to create a compelling COMPETITIVE ADVANTAGE and deliver
DIFFERENTIATED FINANCIAL PERFORMANCE
• INVESTMENT is MORE than CAPITAL
• Rather than pursue lower-return, higher-risk opportunities that reside outside of our core strengths and capabilities, we choose to RETURN SURPLUS CAPITAL TO
OUR SHAREHOLDERS
42
2 0 1 7 I N V E S T O R D A Y |
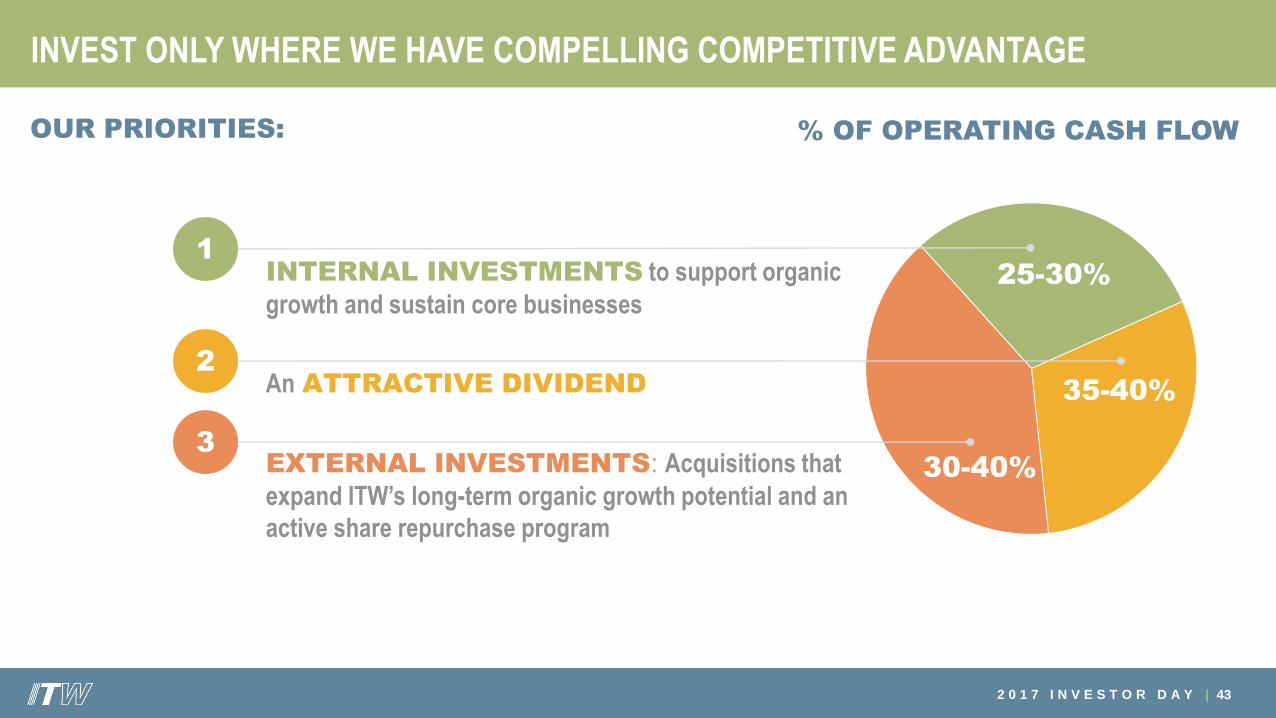
INVEST ONLY WHERE WE HAVE COMPELLING COMPETITIVE ADVANTAGE
43
25-30%
35-40%
30-40%
% OF OPERATING CASH FLOW
INTERNAL INVESTMENTS to support organic
growth and sustain core businesses
An ATTRACTIVE DIVIDEND
EXTERNAL INVESTMENTS: Acquisitions that
expand ITW’s long-term organic growth potential and an
active share repurchase program
1
2
3
OUR PRIORITIES:
2 0 1 7 I N V E S T O R D A Y |
INVEST ONLY WHERE WE HAVE COMPELLING COMPETITIVE ADVANTAGE
INTERNAL INVESTMENTS that support organic growth and sustain our core
businesses are OUR NUMBER ONE capital allocation PRIORITY
•All internal investments that meet our criteria are FULLY FUNDED
•Capital is allocated to DISCRETE PROJECTS and strategies, not “lump sum” to the
businesses
•The percentage of our annual operating cash flow allocated to internal investments is an OUTCOME of how we run the businesses, not a target
•Since 2012, we have INVESTED ~$3.1B in capital expenditures, customer-back
innovation and simplification projects
44
2 0 1 7 I N V E S T O R D A Y |
INVEST ONLY WHERE WE HAVE COMPELLING COMPETITIVE ADVANTAGE
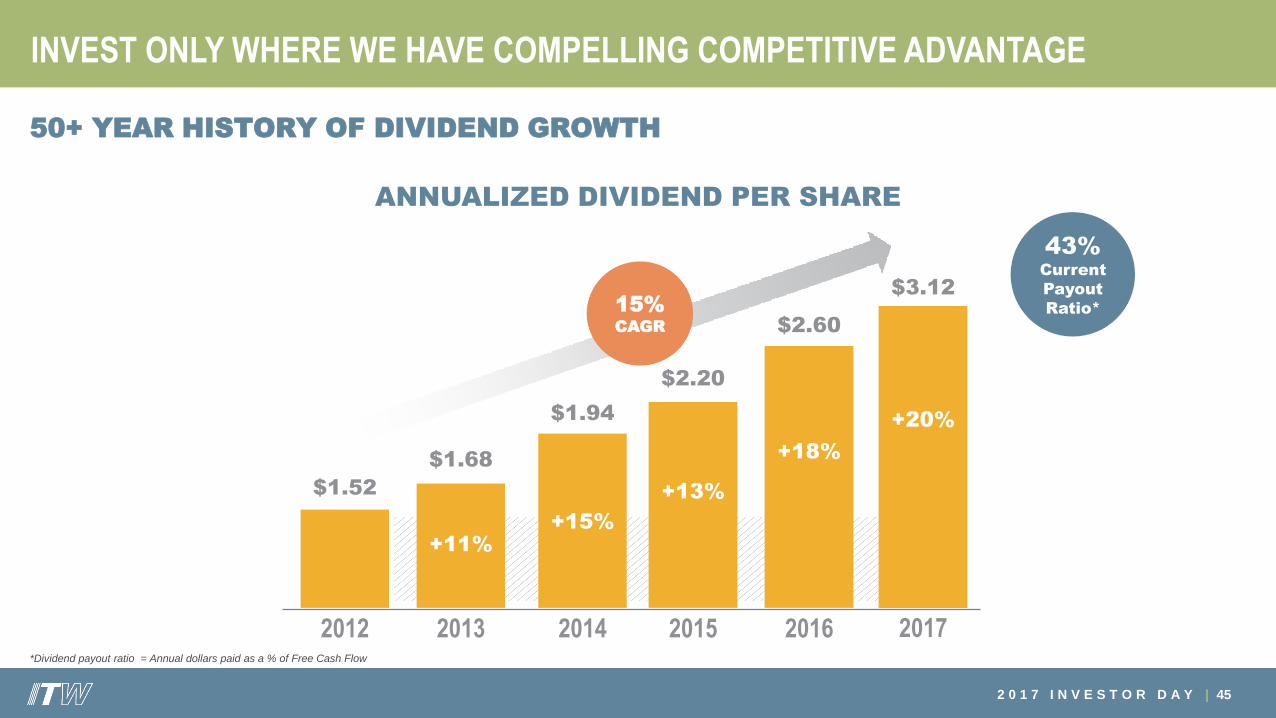
50+ YEAR HISTORY OF DIVIDEND GROWTH
45
ANNUALIZED DIVIDEND PER SHARE
15% CAGR
2016
$2.60
+18%
2014
$1.94
+15%
2013
$1.68
+11%
2012
$1.52
2015
$2.20
+13%
$3.12
+20%
2017
43% Current
Payout
Ratio*
*Dividend payout ratio = Annual dollars paid as a % of Free Cash Flow

2 0 1 7 I N V E S T O R D A Y |
ON TRACK TO DELIVER LONG-TERM ORGANIC
GROWTH AND MARGIN EXPANSION
INVEST ONLY WHERE WE HAVE COMPELLING COMPETITIVE ADVANTAGE
46
~11%OPERATING
MARGIN*
~20%OPERATING
MARGIN
REVENUE
REVENUE
2017E
$575M+
~$500M
2021E
TIGHT STRATEGIC FIT: Only acquisitions
that expand a segment’s long-term organic growth
potential
AND …
80/20 IMPACT: Has the potential to generate
significant margin improvement from the
application of 80/20 Front to Back Process
EF&C ACQUISITION
1
2
0 TO 3 PER YEAR, TYPICAL REVENUES
IN THE $100-$500M RANGE
BOLT-ON ACQUISITIONS
* Excludes unfavorable operating margin impact of amortization expense related to intangible assets

2 0 1 7 I N V E S T O R D A Y |
INVEST ONLY WHERE WE HAVE COMPELLING COMPETITIVE ADVANTAGE
47
•$11.4 BILLION of ”Surplus Capital” including
divestiture proceeds and overseas cash allocated
to share repurchases since 2013
• Share count reduced by 28% at an average
purchase price of ~$89 = 24+% IRR
• Normalized annual share repurchase run rate is $750M TO $1.25B … depends on acquisition
activity
• Significant CAPACITY for additional share
repurchases in a market downturn2015
$2B
2014
$4.3B
2013
$2.1B
2016
$2B
Normalized
Run-rate
$0.9B$1.1B
$0.8B$0.6B
$1.1B
$3.2B
$1.2B$1.5B
Avg. Purchase
Price$95$85 $107$73
2017E
~$1B
~$136
SURPLUS CAPITAL RETURNED TO SHAREHOLDERS through Share Repurchases
2 0 1 7 I N V E S T O R D A Y |
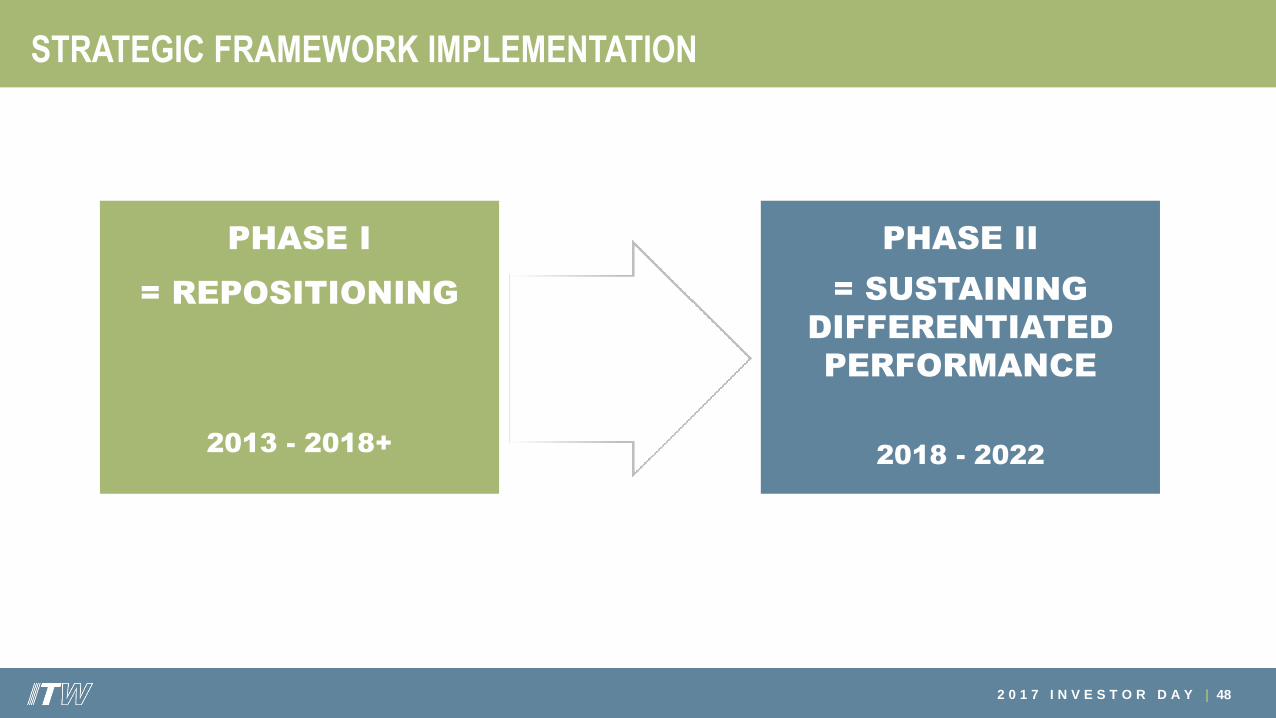
= REPOSITIONING
2013 - 2018+
STRATEGIC FRAMEWORK IMPLEMENTATION
48
= SUSTAINING
DIFFERENTIATED
PERFORMANCE
2018 - 2022
PHASE I PHASE II
2 0 1 7 I N V E S T O R D A Y |
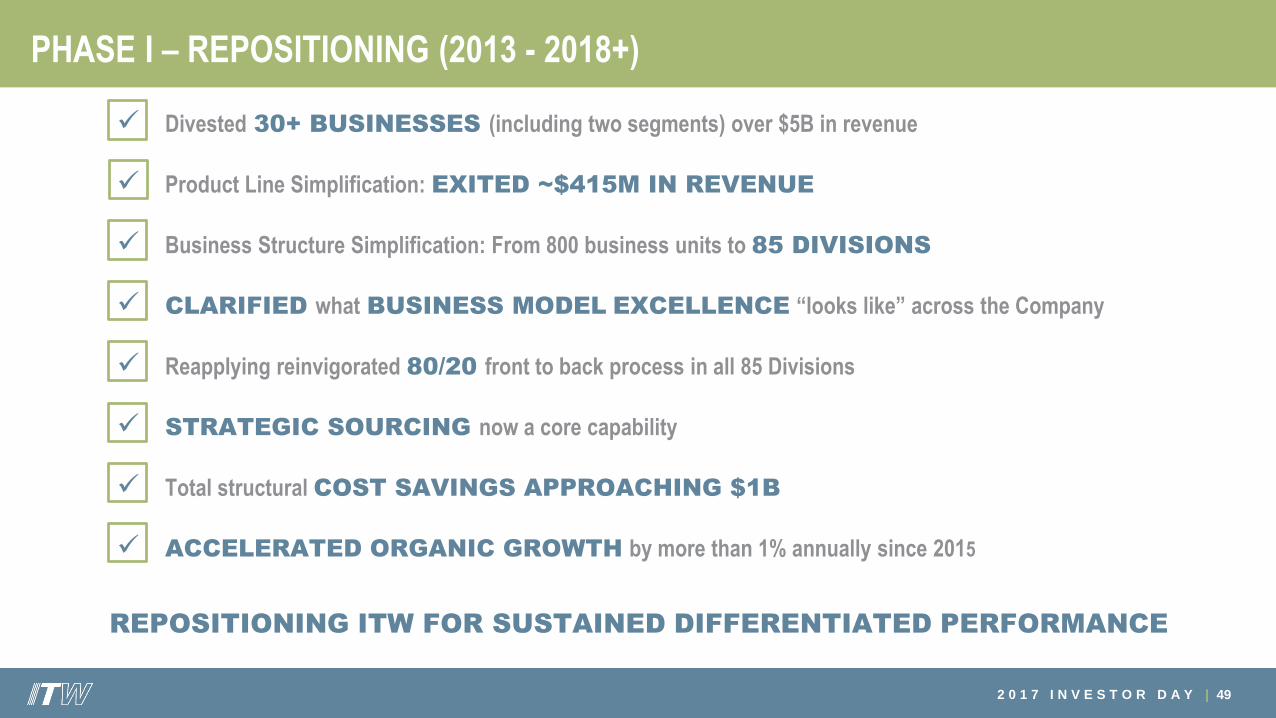
PHASE I – REPOSITIONING (2013 - 2018+)
✓ Divested 30+ BUSINESSES (including two segments) over $5B in revenue
✓ Product Line Simplification: EXITED ~$415M IN REVENUE
✓ Business Structure Simplification: From 800 business units to 85 DIVISIONS
✓ CLARIFIED what BUSINESS MODEL EXCELLENCE “looks like” across the Company
✓ Reapplying reinvigorated 80/20 front to back process in all 85 Divisions
✓ STRATEGIC SOURCING now a core capability
✓ Total structural COST SAVINGS APPROACHING $1B
✓ ACCELERATED ORGANIC GROWTH by more than 1% annually since 2015
49
REPOSITIONING ITW FOR SUSTAINED DIFFERENTIATED PERFORMANCE

2 0 1 7 I N V E S T O R D A Y |
ENTERPRISE STRATEGY PERFORMANCE SINCE 2012
50
OPERATING MARGIN
2012*
~24.5%
15.9%
+860 bps
2017E 2012**
14.5%
+950 bps
2017E 2012**
$6.67
$3.21
16% CAGR
2017E
AFTER-TAX ROIC EARNINGS PER SHARE
~24%
* As reported in the 2012 Form 10-K
** See Appendix for GAAP to non-GAAP reconciliation
2 0 1 7 I N V E S T O R D A Y |
PHASE I – REPOSITIONING (2013 - 2018+)
51
EXPECT ADDITIONAL IMPROVEMENT IN 2018 FOR SURE,
AND PROBABLY IN 2019
• Additional ~100 BASIS POINTS of MARGIN EXPANSION from
Enterprise Initiatives in 2018
2 0 1 7 I N V E S T O R D A Y |
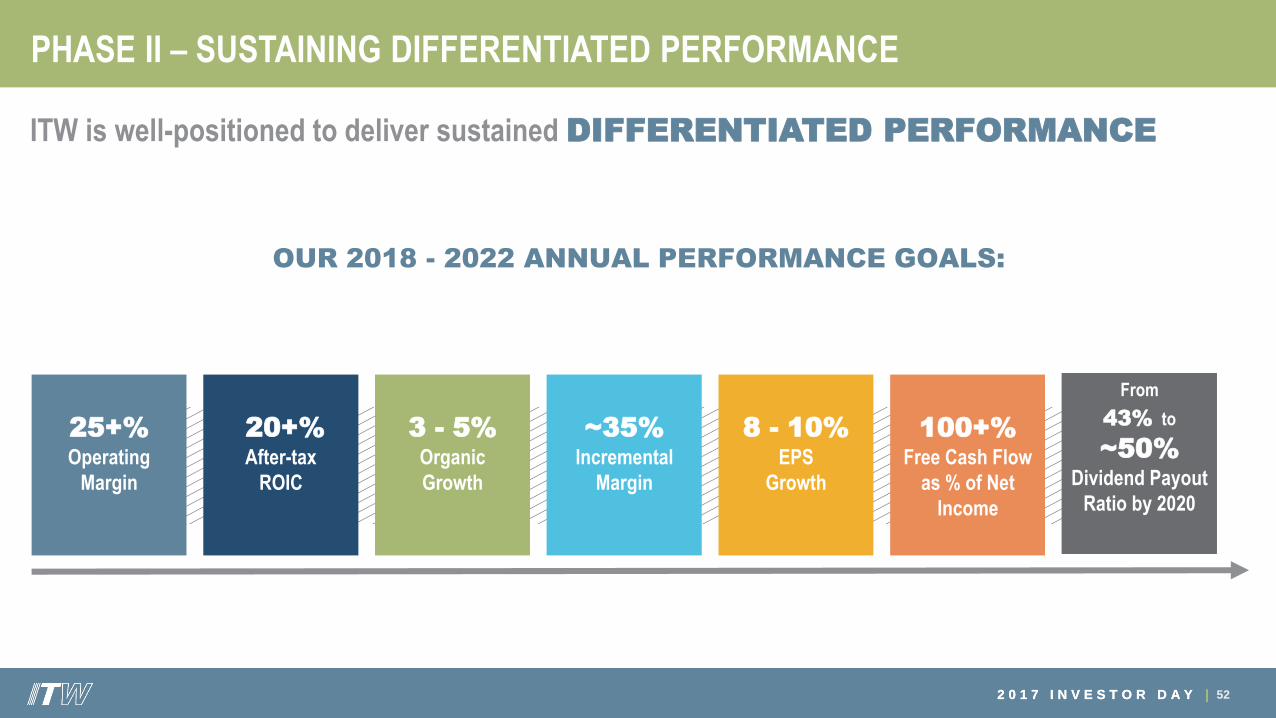
PHASE II – SUSTAINING DIFFERENTIATED PERFORMANCE
52
3 - 5%Organic
Growth
20+%After-tax
ROIC
25+%Operating
Margin
100+%Free Cash Flow
as % of Net
Income
8 - 10%EPS
Growth
ITW is well-positioned to deliver sustained DIFFERENTIATED PERFORMANCE
From
43% to
~50%Dividend Payout
Ratio by 2020
~35%Incremental
Margin
2 0 1 7 I N V E S T O R D A Y |
OUR 2018 - 2022 ANNUAL PERFORMANCE GOALS:

53
2018 Guidance

2 0 1 7 I N V E S T O R D A Y |
2017 GUIDANCE: ON TRACK
54
ANOTHER STRONG YEAR
• EPS of $6.45 - $6.55, an increase of 14%
• Revenue growth of 4.5 - 5.5%, organic of 2 - 3%
• More than 1%-point organic improvement year-on-year
• Key performance metrics at all-time record levels
• Operating margin of ~24%, an increase of ~150 bps with Enterprise Initiatives contributing ~100 bps
• After-tax ROIC of ~23.5%, an increase of ~150 bps
• Free Cash Flow 100%+ of Net Income
• $1.9 billion to shareholders: 20% dividend increase and ~$1 billion share repurchases
GAAP GUIDANCE INCL. LEGAL ITEM
*See ITW’s 2016 Form 10-K
22.5%
2016
$5.70
~24.5%
2017E
$13.6B~$14.3B
22.1% ~24%
HIGHLIGHTS EXCL. LEGAL ITEM
$6.62 - $6.72
Revenue
GAAP EPS
Operating Margin
After-tax ROIC*

2 0 1 7 I N V E S T O R D A Y |
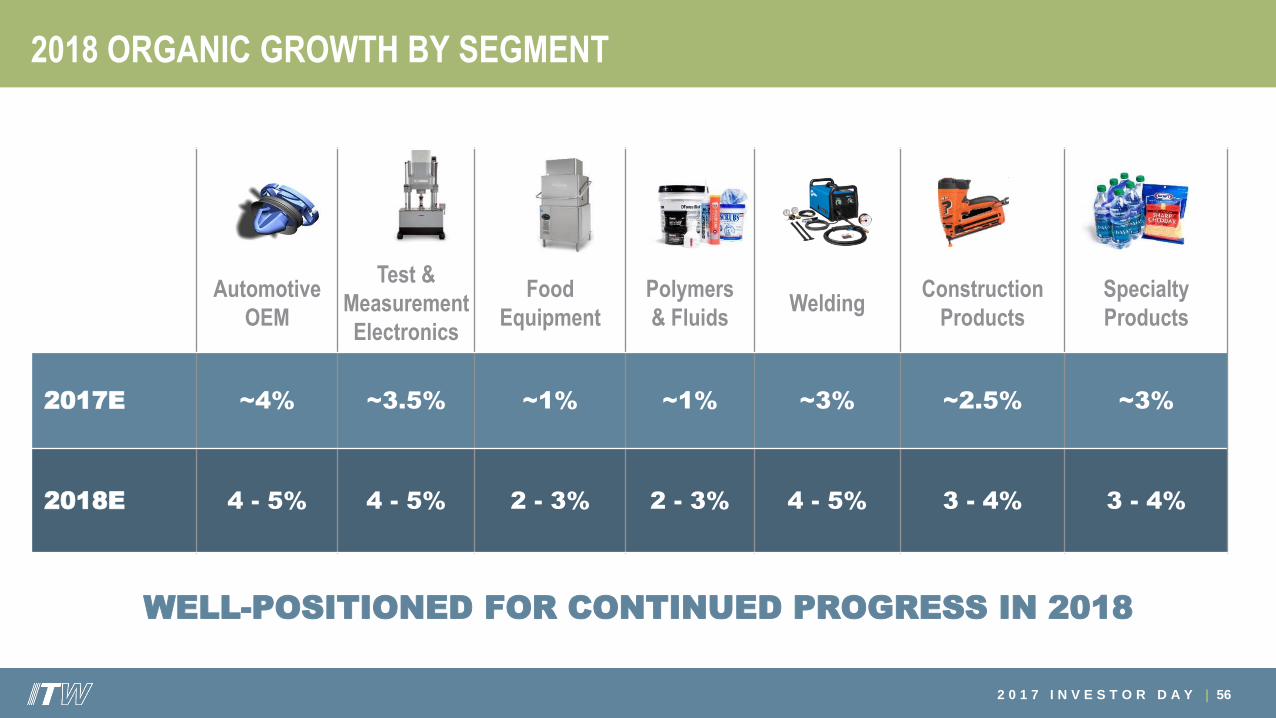
2018 ORGANIC GROWTH RATE
55
CONTINUED PROGRESS ON OUR PATH TO SUSTAINED ABOVE-MARKET
ORGANIC GROWTH IN 2018
1.2%2015
2016(0.4)%
~2.5%
2017E
3 to 4%Includes
~0.5% PLS
2018 Guidance
2 0 1 7 I N V E S T O R D A Y |
Automotive
OEM
Test &
Measurement
Electronics
Food
Equipment
Polymers
& FluidsWelding
Construction
Products
Specialty
Products
2017E ~4% ~3.5% ~1% ~1% ~3% ~2.5% ~3%
2018E 4 - 5% 4 - 5% 2 - 3% 2 - 3% 4 - 5% 3 - 4% 3 - 4%
2018 ORGANIC GROWTH BY SEGMENT
56
WELL-POSITIONED FOR CONTINUED PROGRESS IN 2018
2 0 1 7 I N V E S T O R D A Y |
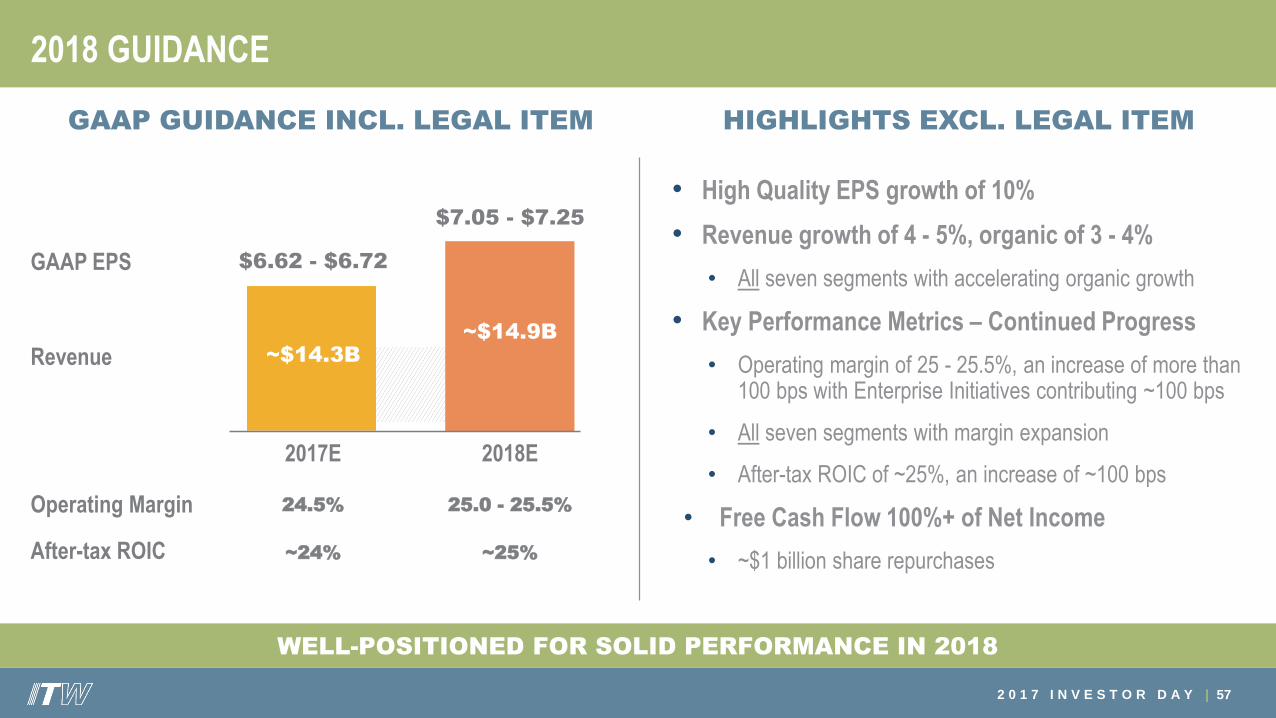
2018 GUIDANCE
57
WELL-POSITIONED FOR SOLID PERFORMANCE IN 2018
• High Quality EPS growth of 10%
• Revenue growth of 4 - 5%, organic of 3 - 4%
• All seven segments with accelerating organic growth
• Key Performance Metrics – Continued Progress
• Operating margin of 25 - 25.5%, an increase of more than 100 bps with Enterprise Initiatives contributing ~100 bps
• All seven segments with margin expansion
• After-tax ROIC of ~25%, an increase of ~100 bps
• Free Cash Flow 100%+ of Net Income
• ~$1 billion share repurchases
Revenue
24.5%
2017E
$6.62 - $6.72GAAP EPS
25.0 - 25.5%
2018E
~$14.3B~$14.9B
~24% ~25%
$7.05 - $7.25
GAAP GUIDANCE INCL. LEGAL ITEM HIGHLIGHTS EXCL. LEGAL ITEM
Operating Margin
After-tax ROIC
2 0 1 7 I N V E S T O R D A Y |
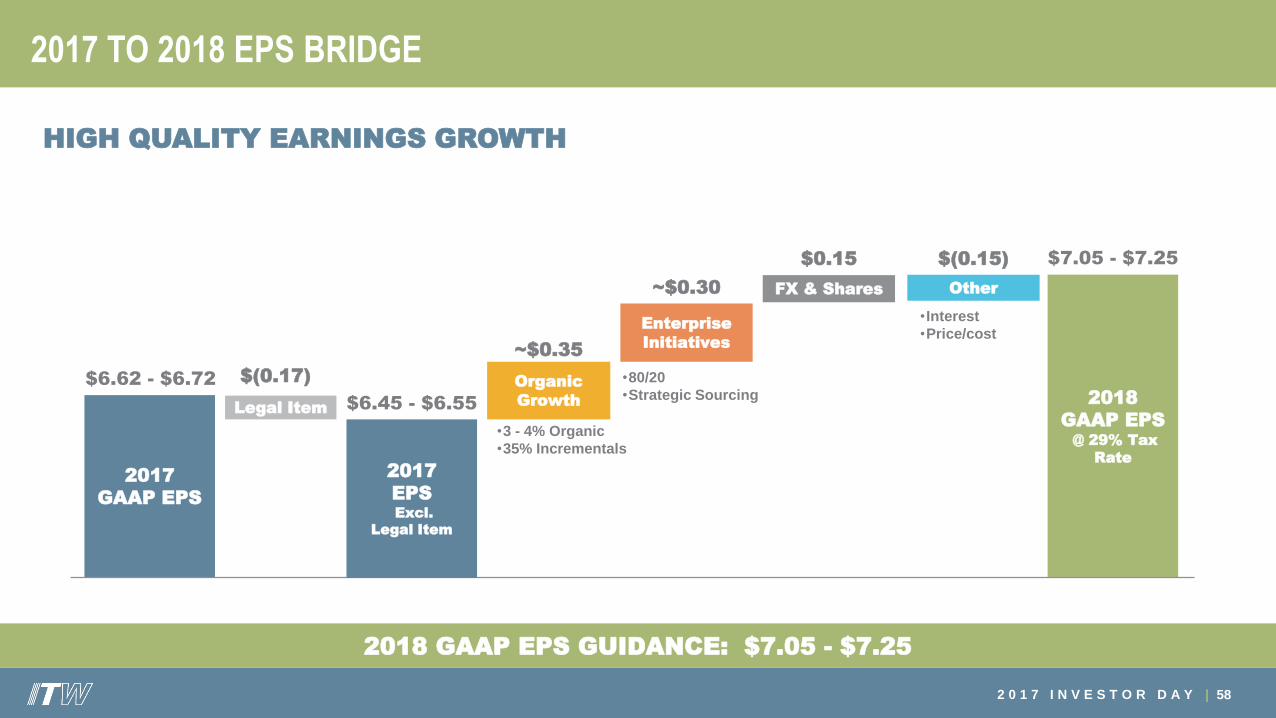
2017 TO 2018 EPS BRIDGE
58
2018 GAAP EPS GUIDANCE: $7.05 - $7.25
2017
GAAP EPS
2018
GAAP EPS@ 29% Tax
Rate
Legal Item
$(0.17) Organic
Growth
Enterprise
Initiatives
$6.62 - $6.72
~$0.35
~$0.30 FX & Shares
$0.15
2017
EPSExcl.
Legal Item
$6.45 - $6.55
$7.05 - $7.25
Other
$(0.15)
•Interest
•Price/cost
HIGH QUALITY EARNINGS GROWTH
•3 - 4% Organic
•35% Incrementals
•80/20
•Strategic Sourcing

59
Summary /
Moving Forward
2 0 1 7 I N V E S T O R D A Y |
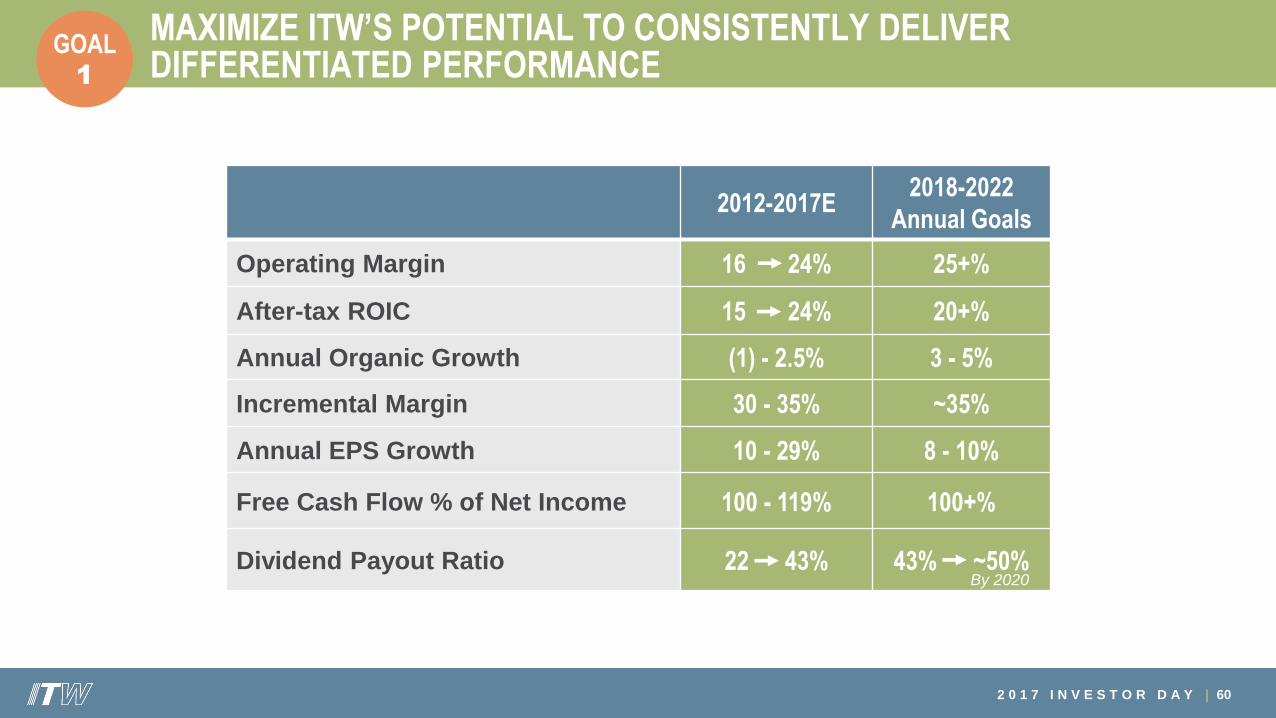
MAXIMIZE ITW’S POTENTIAL TO CONSISTENTLY DELIVER DIFFERENTIATED PERFORMANCE
60
2012-2017E2018-2022
Annual Goals
Operating Margin 16 24% 25+%
After-tax ROIC 15 24% 20+%
Annual Organic Growth (1) - 2.5% 3 - 5%
Incremental Margin 30 - 35% ~35%
Annual EPS Growth 10 - 29% 8 - 10%
Free Cash Flow % of Net Income 100 - 119% 100+%
Dividend Payout Ratio 22 43% 43% ~50%
GOAL1
By 2020

2 0 1 7 I N V E S T O R D A Y |
ADDITIONAL GROWTH OPTIONALITY FROM NEW SEGMENT ADDITIONS
PARAMETERS:
1. GREAT “RAW MATERIAL”: Market characteristics a strong long-term fit with our business model
2. STRONG POTENTIAL FOR SUSTAINED ABOVE-MARKET ORGANIC GROWTH
3. SUBSTANTIAL MARGIN IMPROVEMENT POTENTIAL FROM 80/20
4. “SEGMENT SIZED”: $1 - $3B in revenue
5. WOULD NOT CAUSE US TO REDUCE OUR 2018-2022 ANNUAL
PERFORMANCE GOALS
61
3-5%
Organic
Growth
20+%
After-tax
ROIC
25+%
Operating
Margin
100+%
Free Cash Flow
as % of Net Income
8-10%
EPS
Growth
From43% to ~50%
Dividend Payout
Ratio by 2020
~35%
Incremental
Margin
• 0-2 “segment sized” acquisitions every 3-5 years
• High degree of valuation discipline
Which means:

2 0 1 7 I N V E S T O R D A Y |
THAT SAID…
62
• We remain intensely focused on ORGANIC GROWTH ACCELERATION and
high quality organic growth remains our #1 GROWTH PRIORITY
• We DO NOT NEED ACQUISITIONS to achieve our 2018-2022 performance goals
2 0 1 7 I N V E S T O R D A Y |
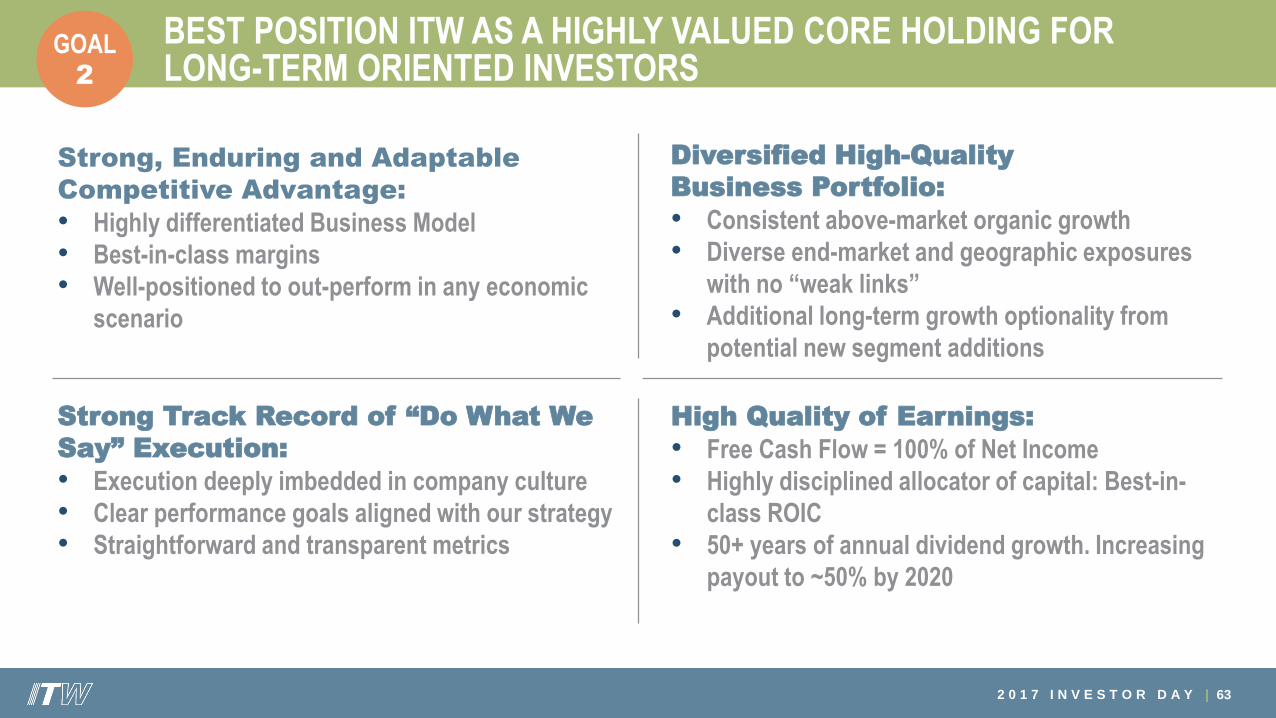
BEST POSITION ITW AS A HIGHLY VALUED CORE HOLDING FOR LONG-TERM ORIENTED INVESTORS
63
GOAL2
Strong, Enduring and Adaptable
Competitive Advantage:
• Highly differentiated Business Model
• Best-in-class margins
• Well-positioned to out-perform in any economic
scenario
Diversified High-Quality
Business Portfolio:
• Consistent above-market organic growth
• Diverse end-market and geographic exposures
with no “weak links”
• Additional long-term growth optionality from
potential new segment additions
Strong Track Record of “Do What We
Say” Execution:
• Execution deeply imbedded in company culture
• Clear performance goals aligned with our strategy
• Straightforward and transparent metrics
High Quality of Earnings:
• Free Cash Flow = 100% of Net Income
• Highly disciplined allocator of capital: Best-in-
class ROIC
• 50+ years of annual dividend growth. Increasing
payout to ~50% by 2020

64
15 Minute Break

65
Q&A
66
Appendix
2 0 1 7 I N V E S T O R D A Y | 67
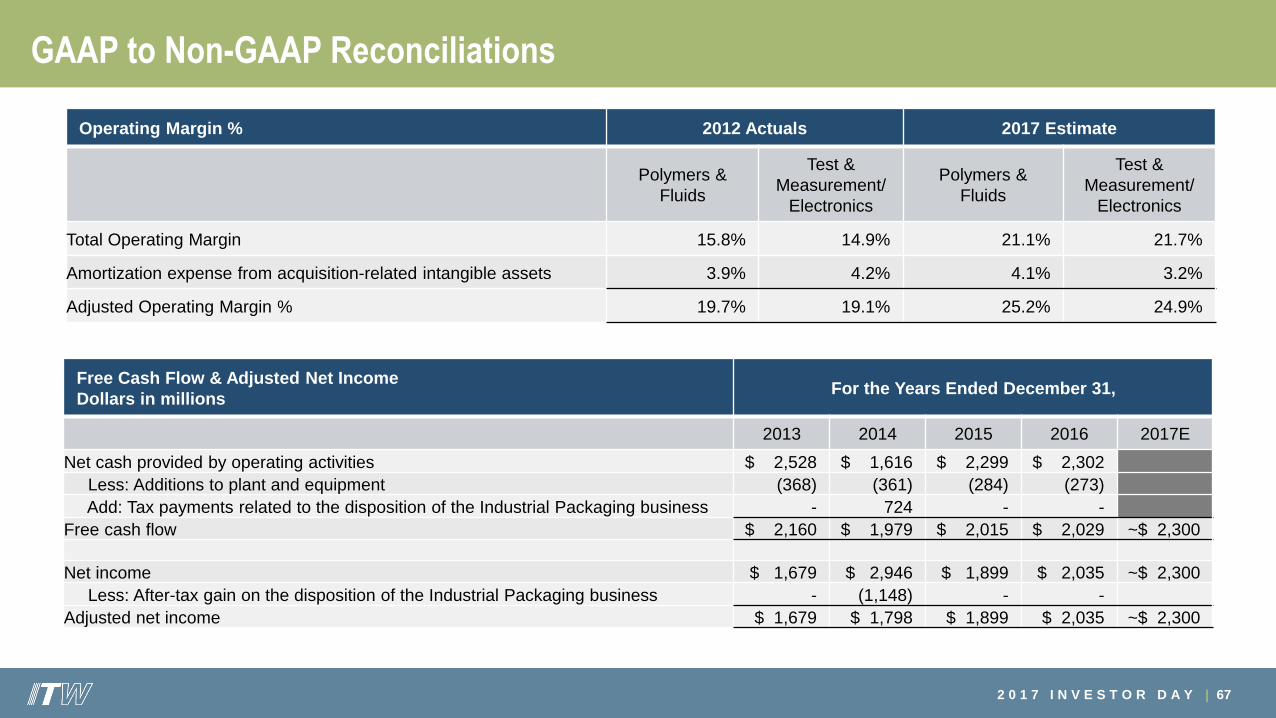
GAAP to Non-GAAP Reconciliations
Free Cash Flow & Adjusted Net Income
Dollars in millionsFor the Years Ended December 31,
2013 2014 2015 2016 2017E
Net cash provided by operating activities $ 2,528 $ 1,616 $ 2,299 $ 2,302
Less: Additions to plant and equipment (368) (361) (284) (273)
Add: Tax payments related to the disposition of the Industrial Packaging business - 724 - -
Free cash flow $ 2,160 $ 1,979 $ 2,015 $ 2,029 ~$ 2,300
Net income $ 1,679 $ 2,946 $ 1,899 $ 2,035 ~$ 2,300
Less: After-tax gain on the disposition of the Industrial Packaging business - (1,148) - -
Adjusted net income $ 1,679 $ 1,798 $ 1,899 $ 2,035 ~$ 2,300
Operating Margin % 2012 Actuals 2017 Estimate
Polymers &
Fluids
Test &
Measurement/
Electronics
Polymers &
Fluids
Test &
Measurement/
Electronics
Total Operating Margin 15.8% 14.9% 21.1% 21.7%
Amortization expense from acquisition-related intangible assets 3.9% 4.2% 4.1% 3.2%
Adjusted Operating Margin % 19.7% 19.1% 25.2% 24.9%
2 0 1 7 I N V E S T O R D A Y | 68
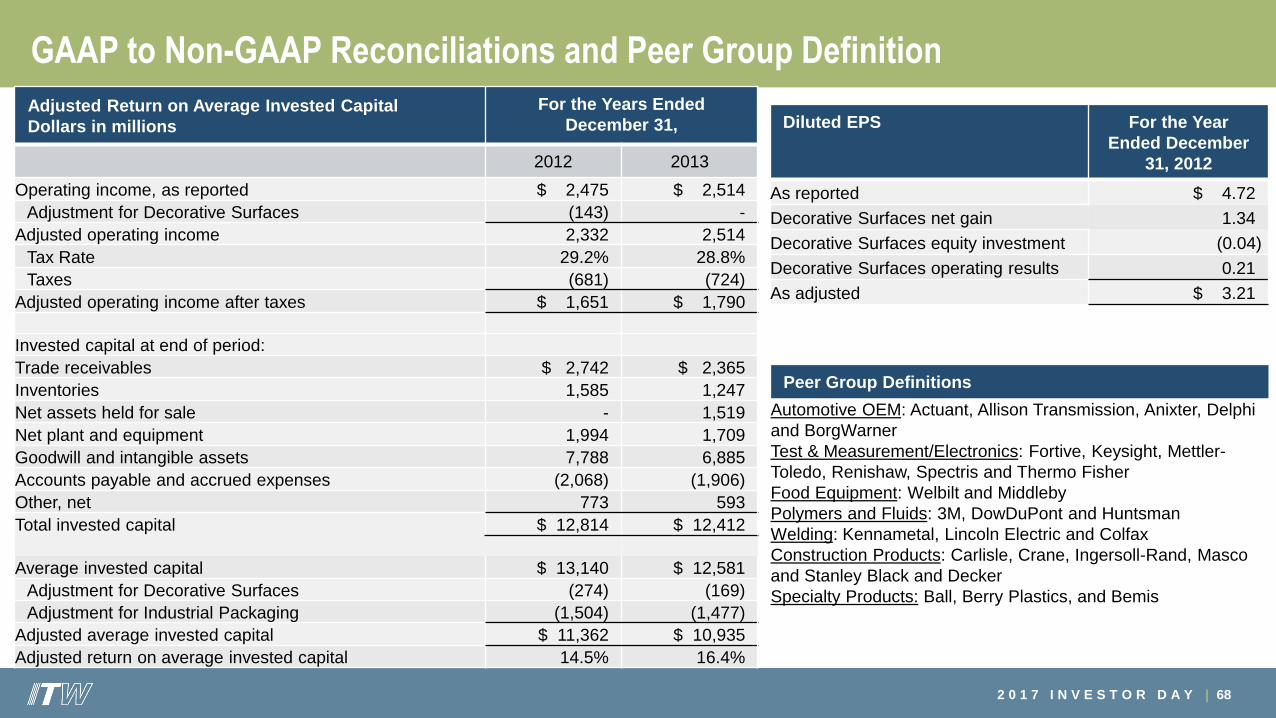
GAAP to Non-GAAP Reconciliations and Peer Group Definition
Adjusted Return on Average Invested Capital
Dollars in millions
For the Years Ended
December 31,
2012 2013
Operating income, as reported $ 2,475 $ 2,514
Adjustment for Decorative Surfaces (143) -
Adjusted operating income 2,332 2,514
Tax Rate 29.2% 28.8%
Taxes (681) (724)
Adjusted operating income after taxes $ 1,651 $ 1,790
Invested capital at end of period:
Trade receivables $ 2,742 $ 2,365
Inventories 1,585 1,247
Net assets held for sale - 1,519
Net plant and equipment 1,994 1,709
Goodwill and intangible assets 7,788 6,885
Accounts payable and accrued expenses (2,068) (1,906)
Other, net 773 593
Total invested capital $ 12,814 $ 12,412
Average invested capital $ 13,140 $ 12,581
Adjustment for Decorative Surfaces (274) (169)
Adjustment for Industrial Packaging (1,504) (1,477)
Adjusted average invested capital $ 11,362 $ 10,935
Adjusted return on average invested capital 14.5% 16.4%
Peer Group Definitions
Automotive OEM: Actuant, Allison Transmission, Anixter, Delphi
and BorgWarner
Test & Measurement/Electronics: Fortive, Keysight, Mettler-
Toledo, Renishaw, Spectris and Thermo Fisher
Food Equipment: Welbilt and Middleby
Polymers and Fluids: 3M, DowDuPont and Huntsman
Welding: Kennametal, Lincoln Electric and Colfax
Construction Products: Carlisle, Crane, Ingersoll-Rand, Masco
and Stanley Black and Decker
Specialty Products: Ball, Berry Plastics, and Bemis
Diluted EPS For the Year
Ended December
31, 2012
As reported $ 4.72
Decorative Surfaces net gain 1.34
Decorative Surfaces equity investment (0.04)
Decorative Surfaces operating results 0.21
As adjusted $ 3.21