2017 investor conference - emerson this presentation we will discuss some non-gaap measures (denoted...
TRANSCRIPT

1

2

3
2017 Investor Conference
Business Update
David N. Farr
Chairman and Chief Executive Officer
February 16, 2017
Non-GAAP Measures
In this presentation we will discuss some non-GAAP measures (denoted with an *) in talking about our company’s performance, and the reconciliation of those measures to the most comparable GAAP measures is contained within this presentation or is available at our website www.emerson.com under the investors tab.
Safe Harbor Statement
Our commentary and responses to your questions may contain forward-looking statements, including our outlook for the
remainder of the year, and Emerson undertakes no obligation to update any such statement to reflect later developments.
Factors that could cause actual results to vary materially from those discussed today are provided in our most recent Annual
Report on Form 10-K and subsequent reports as filed with the SEC.

4
2017 Investor Conference
Business Update
David N. Farr
Chairman and Chief Executive Officer
February 16, 2017
Non-GAAP Measures
In this presentation we will discuss some non-GAAP measures (denoted with an *) in talking about our company’s performance, and the reconciliation of those measures to the most comparable GAAP measures is contained within this presentation or is available at our website www.emerson.com under the investors tab.
Safe Harbor Statement
Our commentary and responses to your questions may contain forward-looking statements, including our outlook for the
remainder of the year, and Emerson undertakes no obligation to update any such statement to reflect later developments.
Factors that could cause actual results to vary materially from those discussed today are provided in our most recent Annual
Report on Form 10-K and subsequent reports as filed with the SEC.

5
8:30 – 10:00 Business Overview / Strategic Update David Farr
10:00 – 10:15 Break
10:15 – 11:15 Automation Solutions Mike Train
11:15 – 12:15 Commercial & Residential Solutions Bob Sharp
12:15 – 12:45 Questions & Answers
12:45 – 2:00 Lunch
Thursday 16 February, 2017
2017 Emerson Investor ConferenceNew York City, NY

6
8:30 – 10:00 Business Overview / Strategic Update David Farr
10:00 – 10:15 Break
10:15 – 11:15 Automation Solutions Mike Train
11:15 – 12:15 Commercial & Residential Solutions Bob Sharp
12:15 – 12:45 Questions & Answers
12:45 – 2:00 Lunch
Thursday 16 February, 2017
2017 Emerson Investor ConferenceNew York City, NY

7
Investor Conference – Emerson Attendees
David Farr Chairman and Chief Executive Officer
Ed Monser President
Frank Dellaquila Senior Executive Vice President and Chief Financial Officer
Ed Purvis Executive Vice President and Chief Operating Officer
Steve Pelch Executive Vice President, Organization Planning and Development
Bob Sharp Executive President, Emerson Commercial & Residential Solutions
Mike Train Executive President, Emerson Automation Solutions
Sara Bosco Senior Vice President, Secretary and General Counsel
Mark Bulanda Senior Vice President, Acquisition Planning and Development
Kathy Button Bell Senior Vice President and Chief Marketing Officer
Craig Rossman Director, Investor Relations
David Bersaglini Vice President, Planning

8
Investor Conference – Emerson Attendees
David Farr Chairman and Chief Executive Officer
Ed Monser President
Frank Dellaquila Senior Executive Vice President and Chief Financial Officer
Ed Purvis Executive Vice President and Chief Operating Officer
Steve Pelch Executive Vice President, Organization Planning and Development
Bob Sharp Executive President, Emerson Commercial & Residential Solutions
Mike Train Executive President, Emerson Automation Solutions
Sara Bosco Senior Vice President, Secretary and General Counsel
Mark Bulanda Senior Vice President, Acquisition Planning and Development
Kathy Button Bell Senior Vice President and Chief Marketing Officer
Craig Rossman Director, Investor Relations
David Bersaglini Vice President, Planning

9
Agenda
1 2016 Review
2 2017 Performance Expectations
3 2021 Vision for Value Creation

10
Agenda
1 2016 Review
2 2017 Performance Expectations
3 2021 Vision for Value Creation

11
2016 February Investor Day Versus 2016 Actual Performance
Step 1:
Restructure
• Continue restructuring with cost reductions in line with a challenging global economy, and a smaller, more focused Emerson
• Global economies are struggling to generate any growth acceleration. Therefore, moderate growth expectations persist through fiscal 2017
• Maintain year-to-date profitability, cash flow
Action: Initiated February 2015 and ongoing through 2016 – 2017, until global growth returns
Step 2:
Reposition
• Complete sales of the Network Power, and Motors & Drives / Power Generation businesses -- Plan to sell ClosetMaid business in 2017
Action: Initiated June 2015 -- Targeted to be completed before
Dec 31st, 2016
Step 3:
Acquire
• Aggressively pursue acquisitions to rebuild the new core, focused
Emerson to ~$20B -- Intent is to reinvest repositioning cash proceeds
within two businesses platforms to rebuild sales, earnings, and cash flow
Action: Ongoing and increasing focus
2016 Costs: $96M1; 2017E Costs $50 – 75M (Including Initial Pentair V&C
Integration)
Both Signed July 30th, 2016 -- And Both Closed -- $5.2B Gross Proceeds
$3.15B Bid Accepted for ~$1.6B Revenue Pentair V&C -- August 2nd 2016
2017 Investor
Day Status:
Excellent
Progress -- more
to be done in
2017
Excellent
Progress with
Network Power
and Motors &
Drives / Power
Generation --
Both Sold
Excellent
Progress with
Valves & Controls
Expected Close
3/31/2017
1From Continuing Ops

1212
Emerson’s 2016 Financial Performance:Continuing Operations Basis
Results Continued to Be Challenged by Relatively Weak Underlying Global Markets in 2016 -- But Our Repositioned Company Is Poised to Benefit From Market Improvements in a 2nd Half Recovery in Fiscal 2017 -- Already Underway!
2015 20162015-16Change
Sales $16.2B $14.5B (11%)
Underlying* (7%)
GP % 43.1% 43.1% -
EBIT % Adjusted* 18.1%1 17.2% (90 bps)
Operating Cash Flow2 $2.5B $2.9B 14%
Shareholder Payout Ratio 149% 63%
EPS Reported2 $3.99 $2.52 (37%)
EPS Adjusted1 * $2.81 $2.45 (13%)
Dividends per share $1.88 $1.90 1%
1Excludes gains from divestitures of $1,039M pretax, or $0.90 per share in 2015, and discontinued operations in both years2Includes Discontinued Operations

1313
$7M
$30M
$18M
$91M
$7M$11M $13M
$65M
$11M $14M$14M
$10M
$0M
$20M
$40M
$60M
$80M
$100M
$120M
Q1 Q2 Q3 Q4 Q1 Q2 Q3 Q4 Q1 Q2E Q3E Q4E
Restructuring Update -- Costs2015 – 2017E
Restructuring Is Being Implemented on Plan: Base Company Restructuring Spend Expected to Decline in 2017 --
Still Work to Be Done in 2017 and 2018 With Addition of the Pentair V&C Business
Costs
2015 2016
Total Costs: $96M Total Costs: $146M Total Costs: ~$50M
2017E
(+ ~$25M Pentair V&C)
$11M
$15M

1414
$3M
$15M
$31M
$51M$54M
$61M$70M
$85M$87M $89M
$94M
$0M
$20M
$40M
$60M
$80M
$100M
$120M
Q1 Q2 Q3 Q4 Q1 Q2 Q3 Q4 Q1 Q2E Q3E Q4E
Restructuring Update -- Benefits2015 – 2017E
Savings Are Flowing Through --Forming the Foundation for Profitable Growth in the Future -- Assuming Minimal
Benefits in 2017 From Initial Pentair V&C Restructuring
Benefits
2015 2016
Total O.P. Benefits: ~$235M
~$185M Increase Over 2015Total O.P. Benefits: ~$50M Total O.P. Benefits: ~$355M
~$120M Increase Over 2016
2017E

15
Emerson Global Presence 2016 -- As We Start 2017 With the New Emerson
Latin America
Sales $834 million
Employees 13,000
Locations 19
Asia
Sales $2.9 billion
Employees 24,000
Locations 39Middle East and Africa
Sales $957 million
Employees 1,000
Locations 5
United States and Canada
Sales $7.5 billion
Employees 22,000
Locations 59
Europe and Russia
Sales $2.3 billion
Employees 14,000
Locations 33
“Locations” include manufacturing locations only
Global Sales $14.5 billion Employees 74,000 Locations 155

1616
Emerson New Business Focus and Market Growth Opportunities
Two Strong, Global, Market Leading Business Platforms
Market Growth Drivers
Automation Solutions
• Lifecycle Services
• Hybrid and Discrete Automation
• Wireless Solutions
• Pipeline Management
• Integrated Coordination and Control
• Pervasive Sensing
• Industrial Internet of Things
• Energy Management, Reliability and Safety
Commercial & Residential Solutions
• HVAC, Refrigeration Lifecycle Services
• Environmentally Friendly Refrigerants
• Sensors, Controlsand Connectivity
• Global Disposer Adoption
• E-commerce
• Food and Pharma Transport Solutions
• Food Waste to Energy
Automation
Solutions
~ $200B
Commercial
& Residential
Solutions
~ $30B
$9B $5.5B

17
Agenda
1 2016 Review
2 2017 Performance Expectations
3 2021 Vision for Value Creation

18
Agenda
1 2016 Review
2 2017 Performance Expectations
3 2021 Vision for Value Creation

1919
Next Steps: 2017 Game Plan and Priorities
Perform as
“New Emerson”
• Finish executing on restructuring plans to right-size cost structure given global macroeconomic trends and smaller two platform business footprint
• Use cash proceeds and strong cash flow / balance sheet to aggressively acquire and enable organic growth
• Position company to fully capitalize on pending global energy market recovery
1. Fully Integrate
Acquisitions
• Aggressively execute on initial cost and revenue synergy plans
• Explore additional synergy opportunities as they emerge
2. Continue
Rationalizing Base
• Continue rationalization and restructuring of our 2 core platforms -- Perfect Execution
• Boost profitability, creating a leaner organization positioned for premium growth and premium valuation -- Key to Controlling Our Own Destiny
3. Position and
Execute for Growth
• Pursue both organic growth opportunities and acquisitions, especially in Process / Hybrid / Discrete Automation and Commercial & Residential areas
• Execute deals worth ~$3B, adding ~$2B to total sales by 2021, in addition to the acquisition of Pentair V&C
• Potential for additional $1-2B strategic acquisition for another ~$1B of sales
• Regrow Emerson to $20+B in annual revenues by 2021, recover lost earnings and cash flow
In 2017, Our Organization Will Be Aligned Towards Executing on These Strategic Priorities as We Benefit From Improvement in Our Core Markets and the Critical
Integration of the Pentair V&C Acquisition
Critical for
Pentair V&C
20
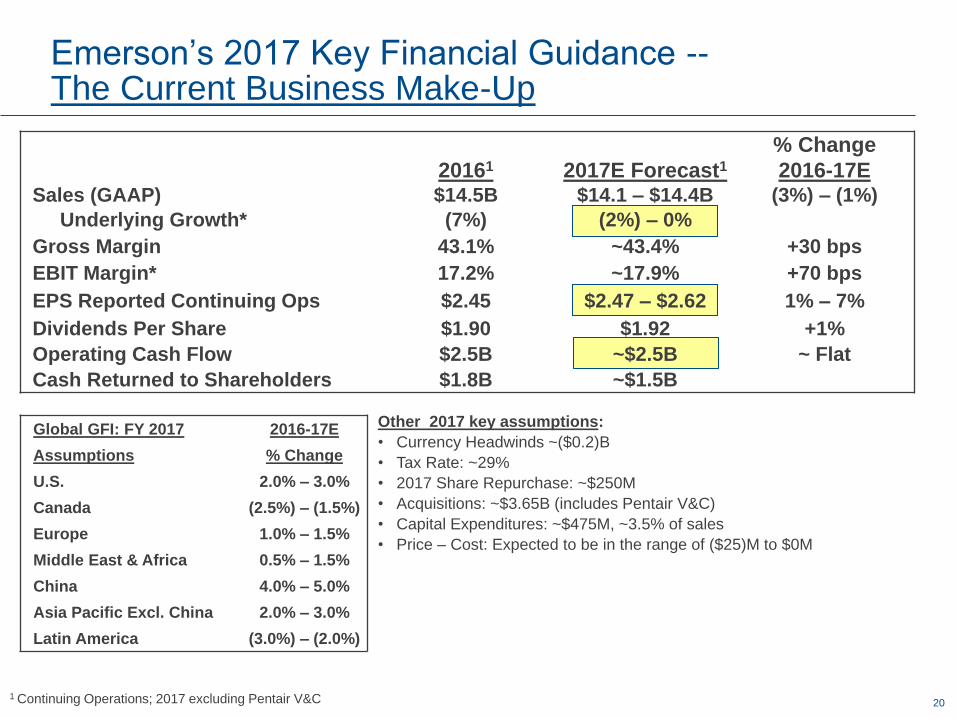
Emerson’s 2017 Key Financial Guidance --The Current Business Make-Up
% Change
20161 2017E Forecast1 2016-17ESales (GAAP) $14.5B $14.1 – $14.4B (3%) – (1%)
Underlying Growth* (7%) (2%) – 0%
Gross Margin 43.1% ~43.4% +30 bps
EBIT Margin* 17.2% ~17.9% +70 bps
EPS Reported Continuing Ops $2.45 $2.47 – $2.62 1% – 7%
Dividends Per Share $1.90 $1.92 +1%
Operating Cash Flow $2.5B ~$2.5B ~ Flat
Cash Returned to Shareholders $1.8B ~$1.5B
Other 2017 key assumptions:
• Currency Headwinds ~($0.2)B
• Tax Rate: ~29%
• 2017 Share Repurchase: ~$250M
• Acquisitions: ~$3.65B (includes Pentair V&C)
• Capital Expenditures: ~$475M, ~3.5% of sales
• Price – Cost: Expected to be in the range of ($25)M to $0M
Global GFI: FY 2017 2016-17E
Assumptions % Change
U.S. 2.0% – 3.0%
Canada (2.5%) – (1.5%)
Europe 1.0% – 1.5%
Middle East & Africa 0.5% – 1.5%
China 4.0% – 5.0%
Asia Pacific Excl. China 2.0% – 3.0%
Latin America (3.0%) – (2.0%)
1 Continuing Operations; 2017 excluding Pentair V&C

2121
Quarterly Underlying Sales* Growth
Emerson and Many of Our Core Markets Entered an Industrial Capital Spend Recession in the 2nd Quarter of 2015. However, We Are Starting to See Some Signs
of Stabilization and Recovery in Early 2017
8%
1%
(3%)
(7%)
(10%)
(5%)
(8%)
(5%)
(3%)
(10%)
(8%)
(6%)
(4%)
(2%)
0%
2%
4%
6%
8%
10%
Q1 Q2 Q3 Q4 Q1 Q2 Q3 Q4 Q1
Emerson underlying sales growth (year over year change by quarter)
2+ Year “Industrial Recession” Driven by Dramatic Declines in Oil & Gas, Strong U.S. Dollar, and Weak U.S. and Emerging Market Business Spend
• But it is Turning Back Up!
2016: (7%)2015: (1%)Note: All data shows Emerson continuing operations
2017
2222
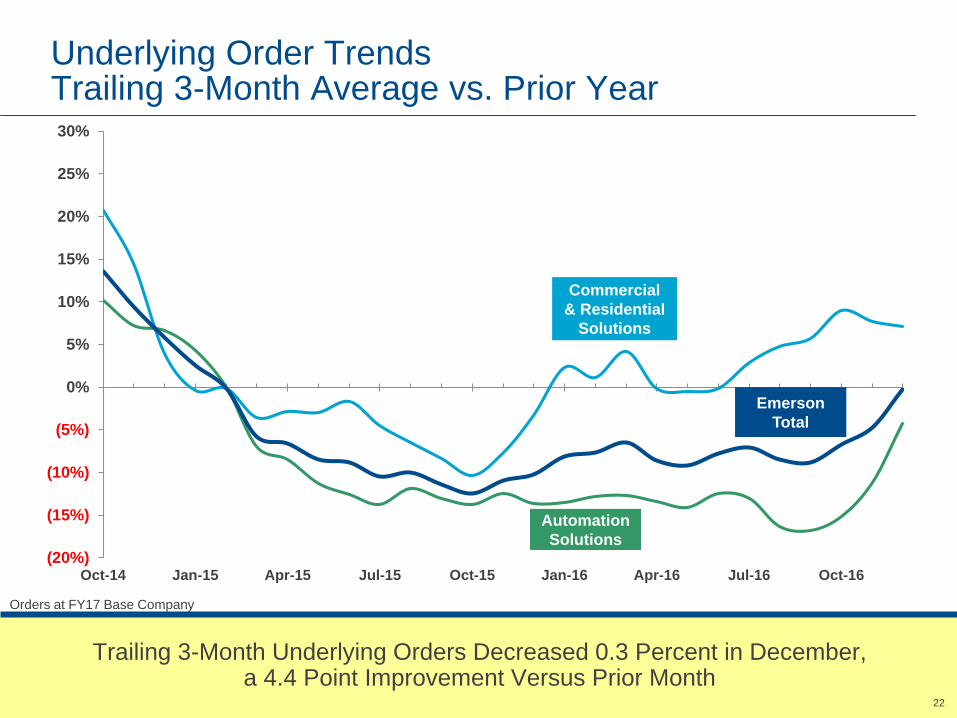
Underlying Order TrendsTrailing 3-Month Average vs. Prior Year
Trailing 3-Month Underlying Orders Decreased 0.3 Percent in December, a 4.4 Point Improvement Versus Prior Month
(20%)
(15%)
(10%)
(5%)
0%
5%
10%
15%
20%
25%
30%
Oct-14 Jan-15 Apr-15 Jul-15 Oct-15 Jan-16 Apr-16 Jul-16 Oct-16
Orders at FY17 Base Company
Commercial
& Residential
Solutions
Automation
Solutions
Emerson
Total

2323
World Gross Fixed Investment (GFI) Trends2017 Expectations for Mature Markets
We Expect Mature Market Growth to Be ~1.7% in 2017And Total World GFI Growth of ~2.2%!
Canada
• Improved outlook for commodity
prices driving GFI growth
• Low Canadian Dollar will bolster
exports
2016: (4.4%)
2017E: (2.0%)
Source: IHS Economics and Emerson Management Assessment
United States
• Pickup in non-residential market and
energy sector driving improved 2017
GFI
• Expected tax and regulation reforms
driving improved business outlook
2016: 1.4%
2017E: 2.5%
Europe
• Brexit-related uncertainties, political
instability, and banking problems will
restrain Western European growth
• Russia’s economy stabilizing
2016: 2.2%
2017E: 1.0%
World 2016: 1.4%
2017E: 2.2%

2424
World Gross Fixed Investment (GFI) Trends2017 Expectations for Emerging Markets
Middle East & Africa
• Low oil prices, fiscal tightening, and
regional instability, have restrained
growth
• Rising commodity prices are helping
to revive growth -- some investments
are starting to happen
2016: (0.5%)
2017E: 1.0%
Latin America
• Mexico’s economy depends on U.S.
trade and immigration policies -- But
the only real growth chance in 2017
• Brazil’s recession is abating, but
recovery / growth is far from certain
2016: (7.4%)
2017E: (2.5%)
Asia Pacific (Excluding China)
• India expected to outpace China
despite liquidity shortages
• Indonesia growing 5%+
• SE Asia -- positive growth
2016: 0.5%
2017E: 2.5%
China
• Expected to slow further due to
imbalances in credit, housing, and
industrial markets -- excess capacity
• Input costs and output prices rising
• Still see pockets of growth for
Emerson sectors
2016: 4.5%
2017E: 4.0%
We Expect Emerging Market Growth to Be ~2.7% in 2017And Total World GFI Growth of ~2.2%!
Source: IHS Economics and Emerson Management Assessment

2525
Oil & Gas Industry Capital Expenditures Priorities and Outlook
Oil & Gas Customers Will Focus on Operational Efficiency and Cash Maximization in the Near Term -- As Oil Prices Stabilize, MRO Investment Will Pick Up, and Customers
Will Begin Reviving Previously Shelved Exploration and Production Projects
2010-2014
2015-2016
2017-2021
~$3.6T
~$1.1T
~$3.2T
Source: IHS Economics and Emerson Estimates
Total Industry
CapEx During the “investment boom” in a high oil price environment, many oil and gas customers executed capital projects very quickly, often sacrificing execution to bring projects online as fast as possible – Speed was paramount to deliver increased revenue, not efficiency or operational excellence
In the “industry reset” low oil price environment, new capital projects were delayed and poor performing assets were closed, as customers instead focused on maximizing efficiency of their higher performing assets
In the “new normal” paradigm, we expect many customers to maintain caution with their new project spending, but maintenance and replacement will grow roughly in line with demand growth. Meanwhile, remaining producers can operate profitably at $50-60 oil
Wall Street Journal
“U.S. Oil Producers
Ramp Up Spending”
20 Jan 2017
• “Preliminary capital
spending plans
released in recent
weeks…show an
average of 60%
budget increase for
the group.”
• “Several U.S. oil
producers…have said
that advanced
technology and
efficiency gains
implemented during
the downturn will
allow them to not just
survive but thrive.”

2626
2017 Outlook For Oil & Gas Capital Spending
We Expect the Capital Spending for Our Large Customers to Be Mixed in 2017, But Stabilizing, after 2 Years of Sustained Heavy Reductions, Due to Increased
Confidence in the Price of Oil Between $50 – $60+
$B
2016 2017E
7%
2015
20%
Source: Barclays Sept 2016 Report, Worldwide E&P Capital Spending 2013 – 2017E, Capital IQ, Emerson Assessment
International
Oil Company
Customer
National Oil
Company
Customer
N.A.
Independent
Customer
Global Exploration and Production (E&P) Capital Spend
Key Customers Capital Expenditures
$177 $205$126
$78 $98
$458$460
$367
$299$306
$0
$200
$400
$600
$800
2013 2014 2015 2016 2017E
$635$665
$492
5%
(26%)
Int’l 0% (20%) (18%) ~2%
North
America16% (39%) (38%) ~27%
$377
(23%)$405
Up
3% - 8% 7%
17%21% 13%
54%25% 18%

27
Automation Solutions -- 2017 End Markets Outlook
Increase in investment led by North American onshore projects;
international spending flat, offshore uptick still on hold
Favorable feedstock costs continue further expansion of ethylene and
methanol capacity in the U.S.
Regulatory standards, increase in emerging market demand generating project activity
Declining margins to slow projects but activate maintenance spending
Aging population and growing middle class driving Life Sciences demand; weak commodity pricing
persists in Metals & Mining
Emerging market urbanization and industrialization
SOURCE: IIR, Barclay’s, IHS, HPI, BMI 2017 Outlook Reports
Note: Spending on Automation Equipment tends to lag overall capital spending by at least 6-12 months
O&G Exploration
& Production
2017E: (5%) – (6%)
Chemical
2017E: 0% – 2%
Power
2017E: 0% – 1%
Refining
2017E: (2%) – (4%)
Hybrid
Industries
2017E: 0% – 2%
Discrete
Industries
2017E: 1% – 3%
Continued investment in LNG storage and pipeline constructions
and expansions
O&G
Midstream
2017E: (3%) – (5%)

28
Commercial & Residential Solutions --2017 End Markets Outlook
Source: IHS Economics and Emerson Management Assessment. DOE: Department of Energy. EPA: Environmental Protection Agency
Residential
A/C
Commercial
Refrigeration
2017E: 4% – 5%
Solid housing starts; summer
weather is key driver
2016E: 3% – 5%
New efficiency standards drive
modulation technology adoption
2017E: 1% – 3%
DOE & EPA regulations creating
widespread redesigns
Transport
Retail
Solutions
2017E: 2% – 3%
Rising energy costs, food quality
management & profitability
Commercial
A/C
2017E: 2% – 4%
Asia rail, truck & trailer driving
market demand
U.S. Residential
Construction
2017E: 5% – 7%
Increased housing starts and private residential spending
2017E: 5% – 7%
Aided by growth in manufacturing construction
U.S.Housing
Starts
U.S. Non-Residential
Construction
2017E: ~ 7%
Robust building permits, and elevated homebuilder optimism fuel
the growth
U.S. Home Improvements
2017E: ~ 5%
Driven by improved consumer wealth and increase in spending

2929
Expected
8%
1%
(3%)
(7%)
(10%)
(5%)
(8%)
(5%)
(3%)
(2%) – (1%)
0% – 1%0% – 2%
(10%)
(8%)
(6%)
(4%)
(2%)
0%
2%
4%
6%
8%
10%
Q1 Q2 Q3 Q4 Q1 Q2 Q3 Q4 Q1 Q2 Q3 Q4
Quarterly Underlying Sales* Growth --Finally Turning Positive
Emerson and Many of Our Core Markets Entered an Industrial Capital Spend Recession in the 2nd Quarter of 2015. However, We Are Starting to See Some Signs
of Stabilization, Recovery, and Increased Investments in 2017
Emerson underlying sales growth (year over year change by quarter)
• 2+ Year “Industrial Recession” Driven by Dramatic Declines in Oil & Gas, Strong U.S. Dollar, and Weak U.S. and Emerging Market Business Spend
• But It is Turning Back Up!
2016: (7%)2015: (1%)
Note: All data shows Emerson continuing operations
2017E: (2%) – 0%

3030
Expected
Underlying Order TrendsTrailing 3-Month Average vs. Prior Year
We Anticipate the Recent Recovery in Automation Solutions Orders to Continue to be Positive for 2nd Half of 2017. Combined with Strong Commercial & Residential Solutions Orders, We Should See Positive Overall Orders Momentum Through the End of 2017!
Note: Orders at FY17 Base Company
Commercial
& Residential
Solutions
Automation
Solutions
Emerson
Total
(20%)
(15%)
(10%)
(5%)
0%
5%
10%
15%
20%
25%
Oct-14 Jan-15 Apr-15 Jul-15 Oct-15 Jan-16 Apr-16 Jul-16 Oct-16 Jan-17 Apr-17 Jul-17

31
This Slide Intentionally Omitted

32
This Slide Intentionally Omitted

33
This Slide Intentionally Omitted

34
This Slide Intentionally Omitted

3535
New Presidential Administration: Mixed Outlook --- The Next 180 Days Will Be Telling
The New Administration’s Prioritization and Sequencing of Policy Initiatives Will Be Very Important -- Emerson Must Be Nimble in Our Approach to this Dynamic Regulatory
Environment -- We Are Ready for Anything but Planning Many Scenarios Right Now --Net, Net it Will Be Positive for U.S. Multinationals
Shelving of Trans Pacific
Partnership (TPP)
By relinquishing its role as a trade leader in the region, the U.S. might possibly be opening the door for Chinese influence -- Need to re-engage our trade strategy
Repeal of ObamacareExpected to consume a significant amount of the government’s time and effort -- May delay other business policy priorities
Infrastructure SpendingAn organized effort to repair roads, bridges, and undertake other infrastructure projects will bolster industrial investment
Corporate Tax Overhaul Simplification and reduction in the corporate tax rate will likely positively impact corporate earnings
Cash Repatriation
HolidayOpportunity to free up “trapped cash” abroad and re-deploy within the U.S.
Personal Pressure On
Outsourcing and Imports
New administration has set a strong precedent for publicly engaging companies that have plans to migrate production to Mexico or other low cost countries
Business Impact CommentaryInitiative

36
This Slide Intentionally Omitted

3737
2017 Expectations
• Continue to see slightly better economic activity in the U.S., Europe, and Asia-Pacific -- But do see some negative headwinds from Washington D.C. rhetoric around protectionism and new tax policies
• OPEC production cuts will support oil prices spurring a modest recovery in our core Automation Solutions End Markets -- Also improved global economic activity helps higher oil prices / output
– Orders will flatten and turn positive by 2nd half of fiscal 2017 (maybe even Q2), driving underlying sales* of (2%) – 0% for the year
• Continued margin benefit from restructuring efforts during the downturn improved EBIT margin, solid operating margin, and better cash flow
• Completed repositioning efforts will enable the more focused Emerson to make value added investments and acquisitions for sales and earnings growth
Sales and Earnings Will Turn up as Emerson Key Strategic Actions Position Our Company for an Improvement in Core Markets in 2017 -- Will Improve Quarter by
Quarter Based on Current Trends

38
Emerson’s 2017 Key Financial Guidance --The Current Business Make-Up
% Change
20161 2017E Forecast1 2016-17ESales (GAAP) $14.5B $14.1 – $14.4B (3%) – (1%)
Underlying Growth* (7%) (2%) – 0%
Gross Margin 43.1% ~43.4% +30 bps
EBIT Margin* 17.2% ~17.9% +70 bps
EPS Reported Continuing Ops $2.45 $2.47 – $2.62 1% – 7%
Dividends Per Share $1.90 $1.92 +1%
Operating Cash Flow $2.5B ~$2.5B ~ Flat
Cash Returned to Shareholders $1.8B ~$1.5B
Other 2017 key assumptions:
• Currency Headwinds ~($0.2)B
• Tax Rate: ~29%
• 2017 Share Repurchase: ~$250M
• Acquisitions: ~$3.65B (includes Pentair V&C)
• Capital Expenditures: ~$475M, ~3.5% of sales
• Price – Cost: Expected to be in the range of ($25)M to $0M
Global GFI: FY 2017 2016-17E
Assumptions % Change
U.S. 2.0% – 3.0%
Canada (2.5%) – (1.5%)
Europe 1.0% – 1.5%
Middle East & Africa 0.5% – 1.5%
China 4.0% – 5.0%
Asia Pacific Excl. China 2.0% – 3.0%
Latin America (3.0%) – (2.0%)
1 Continuing Operations; 2017 excluding Pentair V&C

3939
Emerson Has a History of Strong Cash Flow Generation
We Will Continue to Generate Strong Cash Flow as the New Emerson to Fund Internal Investments, Increasing Dividends, Share Repurchases, and Acquisitions
$1.7 $1.8 $1.7
$2.2 $2.2
$2.5
$3.0
$3.3
$3.1
$3.3$3.2
$3.1
$3.6 $3.7
$2.51
$0
$1
$2
$3
$4
2001 2002 2003 2004 2005 2006 2007 2008 2009 2010 2011 2012 2013 2014 2015 2016 2017E
$B Operating Cash Flow
11% 13% 12% 14% 13% 12% 13% 13% 15% 16% 13% 13% 15% 15% 11% 17%% of
Sales
Total Cash Generated: $21.6B Total Cash Generated: $21.9B
2001 - 2009 2010 - 2016
~$2.51
Factors of the Decline:
• ~$500M taxes paid on divestitures
• ~$600M lower earnings
$2.5
$0.5
$0.6
~17%
1Continuing Ops

40
This Slide Intentionally Omitted

4141
Repositioning Nearly Complete: Acquisitions & Divestitures Update Financial Impact
Two Large Divestitures Are Done -- We Have $5.2B in Gross Proceeds From Divestitures -- $1.6B Repatriation in 2017 -- Remaining Depends on New Tax Policies
-- Pentair V&C Should be Closed by End of March 20172
Divestiture Closures
Pentair V&C Deal Closure
Repatriation Efforts
The sale of Network Power, Leroy-Somer and Control
Techniques are done -- cash received. Final cash repatriation
will occur later this year and all closing transactions will be
completed in our 2nd quarter
We expect to see the deal closure delay until end of March and
be slightly EPS dilutive including restructuring and intangible
amortization but excluding one time purchase accounting
impact -- Cash flow accretive!
Q1 and Q2 tax bookings ~$100M1, but we expect to hold off on
~$900M of repatriation efforts in Fiscal Year 2017 until
comprehensive tax reform or a repatriation holiday is announced --
later 2017
Continuing OperationsWe now expect earnings from continuing operations to be $2.47
– $2.62 per share for Fiscal Year 2017 -- up from $2.45 per
share in 2016
1Reported in discontinued operations2Subject to conclusion of ongoing regulatory reviews
Note: Outlook excludes Pentair V&C

4242
Net Debt Reduced to $2.4B by End of Fiscal 2017
Our Balance Sheet Supports Additional Acquisitions and Is Very Liquid and Flexible for the Right Strategic Moves
($2)
($1)
$0
$1
$2
$3
$4
$2.0B
$4.4B
$0.3B
$2.0B
Net Debt
$B
Sept. 30,
2016
Net
Divestiture
Proceeds
Pentair
Valves &
Controls
Sept. 30,
2017E
$3.5B
Dividend2017 FCF Share
Repurchase
& Other
$0.5B
$0.4B$2.3B
$0.8B
2017
Acquisitions
($0.9)B
$3.2B$1.2B
$2.4B $2.4B
Balance Sheet 9/30/2017E
Cash1 $2.0B
Debt1 $4.4B
Debt / EBITDA 1.4x
1 Assumes full repatriation of divestiture cash
2017 assumes full
repatriation of
divestiture cash

4343
• Acquisition is projected to be cash accretive -- ~$75M Operating & ~$45M Free Cash Flow
• EPS is slightly dilutive including ~$25M of restructuring spend & intangible amortization of ~$50M
• Excludes one-time purchase accounting actions at closing -- estimate of $225M to $275M,
($0.25) to ($0.30) per share
– Profit in inventory and backlog hurts 2017 / 2018 P&L. Expected to be recognized within 6 to 12 months
after close
• Continued intangible amortization of ~$100M per year, ($0.11) per share
• Additional restructuring spend of ~$175M over the next 24 months
• Synergy opportunity is ~$200M, net of SG&A investments
• Year 5 sales target of ~$2B including synergies on the acquired business
Pentair Valves & Controls Acquisition Update
V&C Acquisition Is Projected to Be Cash Accretive Immediately and EPS Accretive in Year 2. Sales Synergy Opportunity Represents Significant Upside
Fiscal 20171
Years 2 Through 5
1 Assumes six months of contribution from Pentair V&C acquisition

4444
Delivering Pentair Valves & Controls Acquisition Success Through Integration
We Have Identified the Synergies and Know How to Get Them --And the Team and Consolidated Organization Will Be in Place on Day 1
• We picked the right target, that fits the Emerson DNA and growth strategy
– We know the industry, we know the products, we know the channel, we know the customers. Emerson has done this before -- similar to the Fisher Valves Acquisition
• The Synergy Board Plan for Final Control + Pentair V&C is heavily focused on cost in the early years, then on growth synergies as we move past Year 2
• The identified cost actions are known, achievable and begin immediately upon deal closure
– Pre-close period focuses on “Day One” readiness
• Synergy sales coincide with expected market recovery (2018)
• Valves & Controls’ Balance Sheet / Working Capital provides an opportunity to drive early cash accretion
• We continue to identify additional synergies
• Dedicated focused resources for critical activities such as integration

4545
After Completing Multiple Major Accomplishments in 2016, 2017 Requires Executing the Final Critical Details
Timeline for Key Strategic Actions
2017
2016 Was the “Transition” Year -- 2017 Will Be the “Foundation” Building Year as Our Two Platforms Return to Growth, We Begin the Integration of Pentair V&C, and
We Build a Stronger, More Focused Emerson
November 30, 2016:
Closed Network
Power Sale
January 31, 2017:
Closed LS-CT Sale4th Quarter, Fiscal Year:
Divest ClosetMaid
March 31, 2017: Expected Pentair V&C Acquisition Closing
Execute on Cost Synergies
Day One Readiness:
Ensure Emerson Core Principles
Business Continuation
Value Capture
Explore additional synergy opportunities
Structural Integration Planning
Antitrust Filings
Communication Planning
Complete another ~$500M
of Bolt-on Acquisitions

46
This Slide Intentionally Omitted

47
Agenda
1 2016 Review
2 2017 Performance Expectations
3 2021 Vision for Value Creation

48
Agenda
1 2016 Review
2 2017 Performance Expectations
3 2021 Vision for Value Creation

4949
2016 Investor Conference (Austin, TX)Bridge to 2019 Sales Compared to Current Expectations
The Rebased Emerson Has Solid Internal Growth Opportunities Along With Smaller Bolt-On Acquisitions and Potential Larger Strategic Acquisitions (Like Pentair V&C)
$0
$20
2016E 2016 StrategicActions
2016 Base ProForma
Underlying Growth TransformationalAcquisition(s)
2019 Target
~$14.5B
~($6B)
~$1.7B
Pentair V&C
~$18B
2016
Adjusted Basis*1
Strategic
Divestitures
2016
Continuing
Ops
Larger Market
Expanding
Acquisition(s)
2019
Target
~$20B
~3% Underlying Growth
+ ~2% Growth from
Bolt-on Acquisitions
Underlying Growth &
Bolt-On Acquisitions
~$21B
~$15B
~$2-3B
~$3-6B ~$20+B
Feb 2016 Expectations
(Austin, TX)
Legend:
Feb 2017 Expectations
(New York, NY)
~$1.8B
• ~$1B reduction
from organic sales
• ~$1B reduction
from acquisitions
1Includes results of discontinued operations
$B

5050
$0
$20
2016E 2016 StrategicActions
Continuing Ops1 Underlying Growth Pentair V&C 2021 Target
~$4B
2017 Investor Conference (New York, NY) Bridge to 2021 Sales
The Rebased Emerson Has Solid Internal Growth Opportunities Along With Smaller Bolt-On Acquisitions and Potential Larger Strategic Acquisitions (Like Pentair V&C)
~$14.5B
~($6B) ~$2B
$B
2016
Adjusted Basis*1
Strategic
Divestitures
2016
Continuing
Ops
Large
Acquisition(s)
2021
Target
~$20B
Underlying Growth &
Bolt-On Acquisitions
~$20B
~3% Underlying Growth
+ ~2% Growth from
Bolt-on Acquisitions
Pentair V&C
1Includes results of discontinued operations
Upside ~$1B ~$21B
5151
$2.00
$2.50
$3.00
$3.50
$4.00
2016E 2016 StrategicActions
2016 Base ProForma
UnderlyingGrowth
Repo TransformationalAcquisition(s)
2019 Target
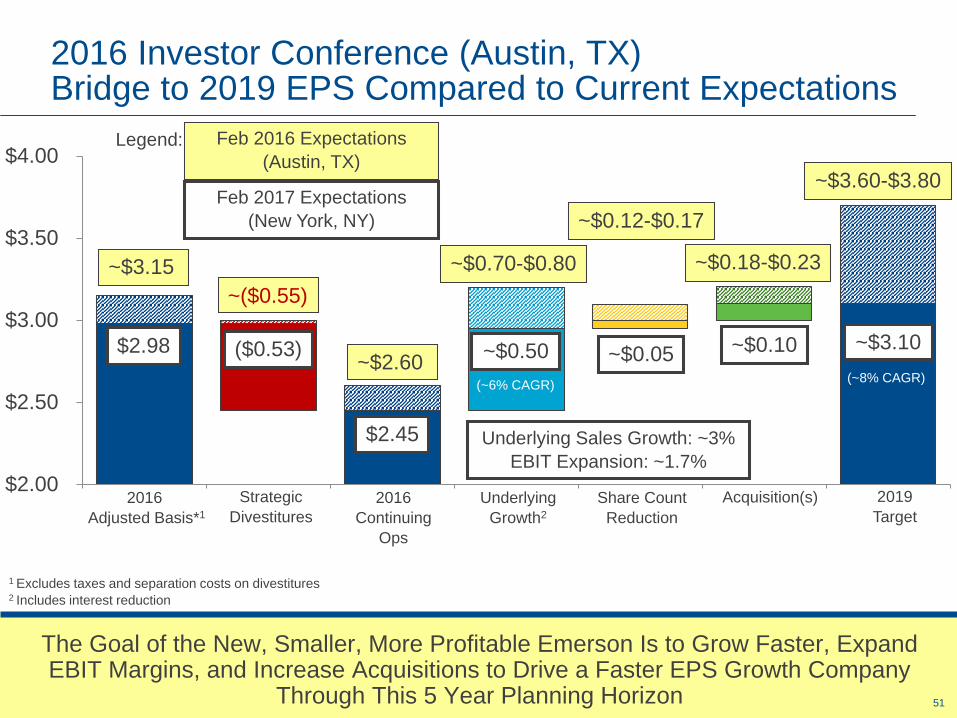
2016 Investor Conference (Austin, TX)Bridge to 2019 EPS Compared to Current Expectations
The Goal of the New, Smaller, More Profitable Emerson Is to Grow Faster, Expand EBIT Margins, and Increase Acquisitions to Drive a Faster EPS Growth Company
Through This 5 Year Planning Horizon
$2.45
($0.53) ~$0.05
(~6% CAGR)
~$0.10
(~8% CAGR)
Strategic
Divestitures
2016
Continuing
Ops
Underlying
Growth2
Share Count
Reduction
Acquisition(s) 2019
Target
2016
Adjusted Basis*1
$2.98
Underlying Sales Growth: ~3%
EBIT Expansion: ~1.7%
~$3.15
~($0.55)
~$2.60
~$0.70-$0.80
~$0.12-$0.17
~$0.18-$0.23
~$3.60-$3.80
Legend:
~$0.50 ~$3.10
Feb 2016 Expectations
(Austin, TX)
Feb 2017 Expectations
(New York, NY)
1 Excludes taxes and separation costs on divestitures2 Includes interest reduction

5252
$2.00
$2.50
$3.00
$3.50
$4.00
2016E 2016 StrategicActions
2016 Base ProForma
Organic Growth Margin Expansion Share Repo Acquisitions 2019 Target
2017 Investor Conference (New York, NY) Bridge to 2021 EPS
The Goal of the New, Smaller, More Profitable Emerson Is to Grow Faster, Expand EBIT Margins, and Increase Acquisitions to Drive a Faster EPS Growth Company
Through This 5 Year Planning Horizon
$2.45
($0.53)~$0.45
~$0.10
Strategic
Divestitures
2016
Continuing
Ops
Organic
Growth
Share
Count
Reduction
2021
Target
2016
Adjusted Basis*1
$2.98
5-year CAGR
~9.5%
Underlying Sales Growth: ~3.5%
Base EBIT Expansion: ~2.3 pts.
1 Excludes taxes and separation costs on divestitures2 Includes interest reduction
$2,5371 $2,052FCF*($M) ~$2,700
Target Is 9+% EPS Growth from New Emerson Base
Margin
Expansion2
~$0.45
~$0.40
Acquisitions
~$3.85

5353
Gross Fixed Investment (GFI) Trends2017 - 2021 Expectations for Mature Markets
Canada
• Prices of oil and other commodities expected
to rise, sparking a recovery in the Canadian
dollar
2017E – 2021F: ~2.5%
United States
• Sustained improved growth depends on
timing and extent of regulatory and tax
reforms as well as productivity gains
• Fiscal stimulus, accelerating prices and
wages, and strengthening loan demand will
lead to higher interest rates
2017E – 2021F: ~3.0%
Europe
• Aggressive monetary stimulus and a weaker
euro will support growth in Western Europe
• Political stability will determine whether that
growth is sustained
• Sluggish export markets in Western Europe
and adverse demographic trends will restrain
growth in Emerging Europe
2017E – 2021F: ~2.1%
Source: IHS Economics and Emerson Management Assessment
World 2017E – 2021F: ~3.2%
We Expect Mature Market Growth to Be ~2.2% for 2017 - 2021 and The World GFI to Grow ~3.2%
5454
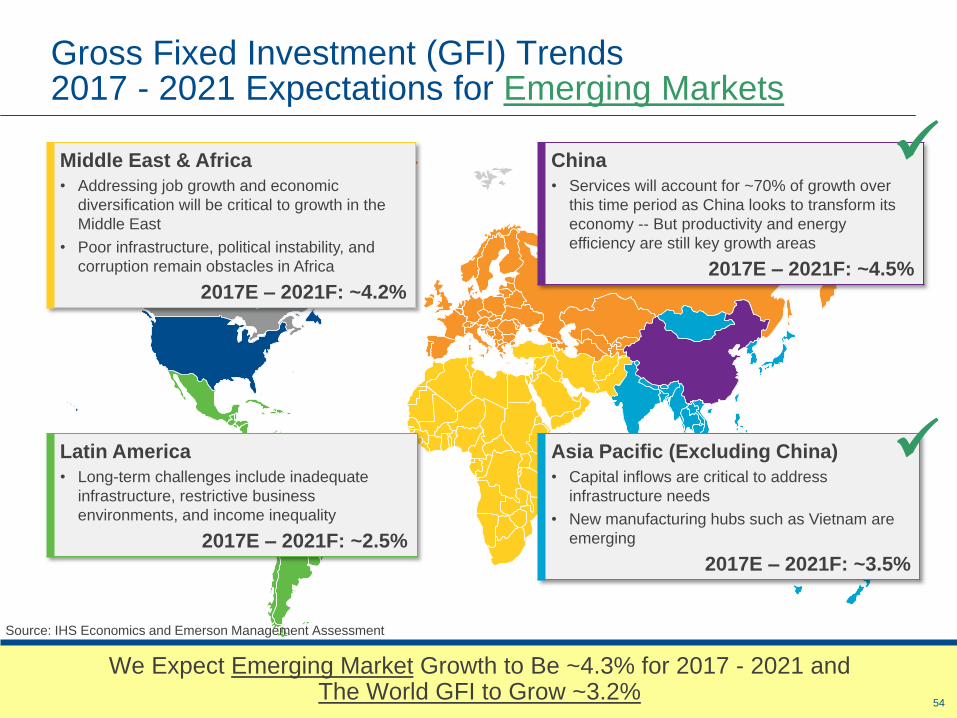
Gross Fixed Investment (GFI) Trends2017 - 2021 Expectations for Emerging Markets
Middle East & Africa
• Addressing job growth and economic
diversification will be critical to growth in the
Middle East
• Poor infrastructure, political instability, and
corruption remain obstacles in Africa
2017E – 2021F: ~4.2%
Latin America
• Long-term challenges include inadequate
infrastructure, restrictive business
environments, and income inequality
2017E – 2021F: ~2.5%
Asia Pacific (Excluding China)
• Capital inflows are critical to address
infrastructure needs
• New manufacturing hubs such as Vietnam are
emerging
2017E – 2021F: ~3.5%
China
• Services will account for ~70% of growth over
this time period as China looks to transform its
economy -- But productivity and energy
efficiency are still key growth areas
2017E – 2021F: ~4.5%
Source: IHS Economics and Emerson Management Assessment
We Expect Emerging Market Growth to Be ~4.3% for 2017 - 2021 and The World GFI to Grow ~3.2%

5555
Emerson’s Core Platform Growth Through the Cycle Targets
Emerson Must Expand Upon It’s History of Beating Market GrowthWithin Automation Solutions and Establish a Sustainable Market Growth Premium
Within Commercial & Residential Solutions
2000 – 2015 Served Market
Emerson Platform Growth
~3%
~6%
~3%
~3%
2016 – 2021F Served Market
Emerson Platform Growth
1% - 3%
~3%
3% - 5%
3.5% - 5.5%
2017E – 2021F Served Market
Emerson Platform Growth
3% - 5%
3.5% - 6%
3% - 5%
3.5% - 5.5%

5656
2017 – 2021 Growth Expectations and Market Trends / Drivers
• U.S. Presidential Administration – Mixed economic outcome which will largely depend on whether traditional pro-growth deregulation and fiscal stimulus initiatives outweigh the potential protectionist agenda items -- This will unfold throughout 2017 and likely be positive for U.S. multinationals
• Energy Outlook – Should see a positive inflection point in 2017 or early 2018 with spending starting with MRO and brownfield projects, and slowly migrating into previously delayed greenfield projects
• Industrial Internet of Things – There will be broader adoption by 2020 as companies begin to accurately measure and implement the value of their data streams and associated savings -- A significant opportunity for both Emerson Platforms
• Residential and Non-Residential Construction – We should see investment pick up in both single family and multi-family as the U.S. market sees slightly better GDP growth and family incomes rise
• Regulations – After a brief resetting of environmental and efficiency standards early in the new Administration, the trend will ultimately reset a course towards increasing regulation across our end markets -- But a much more balanced approach for business investments
• U.S. Dollar Strength – The U.S. will likely remain the world’s most attractive location for foreign investment, especially as interest rates rise -- the dollar will remain relatively strong, but maybe not as strong as we have seen the last 12 months
Emerson Will Be Positioned to Capitalize on These Trends -- Targeting to Deliver Above Market Growth in Sales and Earnings Through This Cycle!

5757
Automation Solutions and Commercial & Residential Solutions -- A Strong Foundation Off of Which to Build!
The Combined 2 Platform Portfolio Creates a Lean, Global Enterprise With Superb Financial Footing, Leveraging Unparalleled Technology, Poised for Above Market
Growth in Markets Critical to Modern Life and Industry -- A True Solutions Organization That Is Positioned for Unique Global Growth Opportunities
Emerson
Technology and
InnovationMarkets and
Customers
Best Practices and
Global Enterprise

58
Strategic Rationale for Maintaining and Leveraging Emerson’s Two Platform Portfolio
1. Leverage Global Innovation
Centers Across Both
Platforms
2. Scale Sensing Technologies
and Development
Knowledge Across Portfolio
of Intelligent Devices
3. Drive Synergies Across
Common Hardware and
Software Development
4. Develop Common Internet
of Things Application
Foundation to Enable
Industry Specific Solutions
1. Share Best Practices and
Management Processes
i.e. Perfect Execution
2. Leverage and Share Talent
Development
3. Maximize Shared Services
and Shared Facilities
4. Achieve World Area
Penetration, Share Local
Trends, Government
Relations, and Labor
Insights
1. Share Domain Knowledge
Across Common End
Markets (Life Sciences and
Food & Beverage)
2. Leverage E-business and
Digital Customer Experience
Capabilities Across All
Markets and Customers
3. New Business Model
Synergies – Installed Base,
Services, Solutions, Asset
Management / Monitoring,
Reliability, Energy
4. Pursue Common Adjacent
Spaces for New Growth
Technology and
InnovationBest Practices and
Global Enterprise
Markets and
Customers

5959
AMS Ares Sensi
Fisher Rosemount PakSense Copeland
Cross-Platform Collaboration Opportunities On Multiple Layers of the Technology “Stack”
Emerson Will Leverage Technologies and CommonalitiesAcross Our Two Platforms
Application
Platform
Intelligent
Devices
Advanced
Services
Technology
and Innovation
Industry Specific Services
Market Specific Apps
Function Specific Sensing
Sensi Comfort
Monitoring
ProAct
Cross
Platform
Collaboration
On Common
Application
Backbone
Devices
Specific to
Customer
Application
Synergies
Among
Hardware
& Software
Design and
Interface
Advisor & Insight
Apps

6060
Leverage Domain Knowledge Across Common End Markets
Customer Insights and “Know-How” Span Across Common End Markets in Automation Solutions and Commercial & Residential Solutions
Markets and
Customers
Key Trends:
Life Sciences / Pharmaceuticals
Food & Beverage
• Pharma 4.0
• Temperature Sensitive Biopharma
• Continuous Manufacturing
• Single Use Technologies
• Regulatory Reform
• Flexible Manufacturing
• Food Safety
• Product Traceability and
Reliability
• Packaging Proliferation
Technology:
Common End
Markets:
Emerson
Automation Solutions
Emerson Commercial
& Residential Solutions

6161
Share Best Practices in Emerson Management Process
Our Portfolio Structure Allows Us to Leverage Best Practices Within the Emerson Management Process
Planning Conference
(Growth Focus)
Profit Review(Margin Focus)
• Market Assessment
• Competition
• Technology Trends
• Sales Growth Initiatives
• Acquisitions
Perfect Execution Review
(Speed Focus)
• New Products
• Price Initiatives
• Regionalization
• Customer Satisfaction
• Delivery Performance
• Asset Management
• Quality & Safety
• Cost Reductions
• Supply Chain
• Operations Footprint
• Material Containment
• Investments
• Margin Expansion
Best Practices and
Global Enterprise

62
Perfect Execution Facilitates Leveraging Unique Business Model Learnings Across Platforms
Best Practices and
Global Enterprise
Discrete &
Industrial
Sensors &
Controls
Flow
SolutionsRefrigeration
Systems &
Solutions
Tools &
Home
Products
Business Group:
Auto. Sol.
Comm. & Res. Sol.
Product / Service
Example:
Make-To-OrderEngineer &
Configure-To-OrderSolutions & Services
Understand• Lead Time Stratification
• Sales & Operations Planning
• Front-End Processes
• Demand Shaping & Product
Configurators
• Customer Collaboration
Through Business Process
Excellence
• CRM Tools
Design• Design for Manufacturability
• Preferred SKUs
• Complexity Reduction
• Modular Platforms
• Late Customization
• Design for Serviceability
• Flexible Delivery Models
Plan• Delivery Frequency on High
Volume Parts
• Supply Regionalization
• Supply Regionalization
• Parts Management
• Supply Regionalization
• Reliable Flow of Materials
Execute• Continuous Flow
• Pull Systems
• Global Project Management
• Insource High Variation
• Quick Changeovers
• Operational Excellence
• Pull Systems for Service
Parts
Business Models
6363
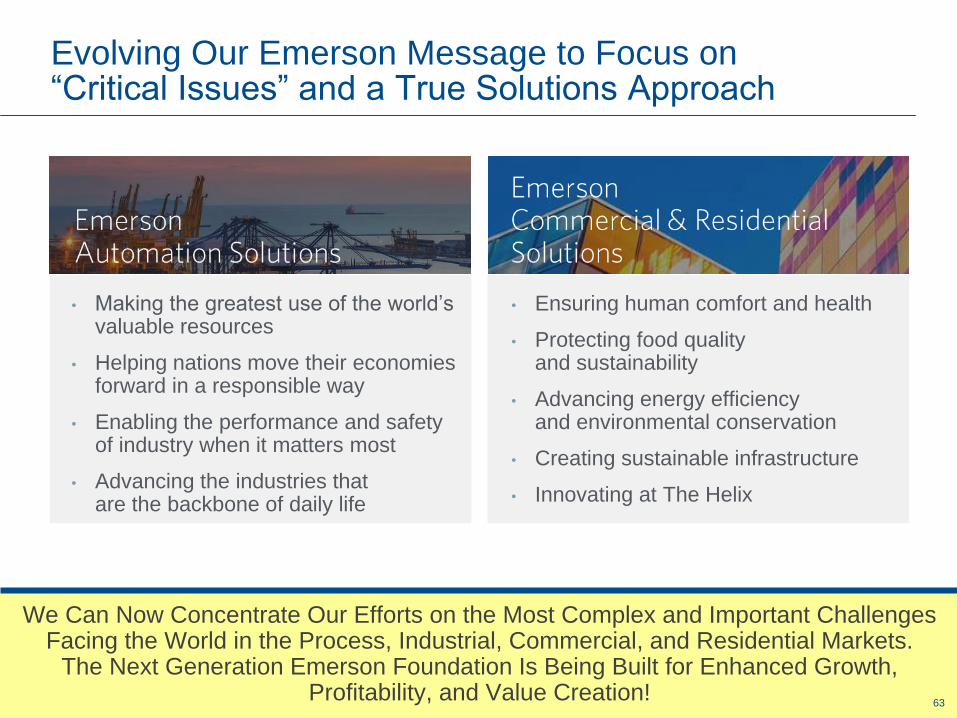
Evolving Our Emerson Message to Focus on “Critical Issues” and a True Solutions Approach
We Can Now Concentrate Our Efforts on the Most Complex and Important Challenges Facing the World in the Process, Industrial, Commercial, and Residential Markets.
The Next Generation Emerson Foundation Is Being Built for Enhanced Growth, Profitability, and Value Creation!
63
• Making the greatest use of the world’s valuable resources
• Helping nations move their economies forward in a responsible way
• Enabling the performance and safety of industry when it matters most
• Advancing the industries that are the backbone of daily life
• Ensuring human comfort and health
• Protecting food quality and sustainability
• Advancing energy efficiency and environmental conservation
• Creating sustainable infrastructure
• Innovating at The Helix

6464
Introducing the New Emerson.com --An Industries Solution Focus for Our Global Customers
Going Forward, the One Emerson Website Will Be Cohesive, Clear, and Intuitive -- Facilitating Visibility and Understanding for
Our Customers, Investors, and Employees
Automation Solutions Commercial & Residential Solutions
Automotive Mining, Minerals &Metals Commercial Buildings & Construction
Chemical Oil & Gas Energy & Utilities
Downstream Packaging Facility Management & Maintenance
Food & Bev Power Generation Food Retail
Industrial Energy Pulp & Paper Food Service & Hospitality
Life Sciences Water & Wastewater Residential Construction
Marine

65
This Slide Intentionally Omitted

6666
Automation Solutions Market Outlook
• Successful implementation of OPEC production cuts and stable oil
prices will support increased customer spending within our core
process markets in late 2017 and into 2018
– We expect a strong rebound in 2018 driven by increased maintenance,
repair, and overhaul activity -- which had been deferred
– We expect a return to moderate growth through 2021 after an initial
growth spike in 2018
• We continue to see strong market fundamentals in our Hybrid and
Discrete market segments
• Asia will continue to be a significant source of market growth followed
closely by North America
Markets Are Turning in Our Favor -- We Are Well Positioned to Take Advantage of These Improving Markets and Drive Above Market Growth

67
This Slide Intentionally Omitted

68
This Slide Intentionally Omitted

69
Acquire
Create Solutions Perform
Invest
Key Priorities for Automation Solutions Through 2021
• Continue critical internal investment in technology to exit industrial recession in a strong position
• Add product & solution competency through acquisition-- diversify into non-oil & gas markets
• Focus on solving the customers’
biggest problems --- productivity
improvement required in today’s
$50-$60 per barrel oil price
• We must perform better in the next
two years and separate from the
market now!
Plantweb digital ecosystem is the
foundation for further investments!
Pending acquisition of Pentair V&C is a
strong start!
Top Quartile Performance is a foundation
for broader solutions engagement with
customers!
History of outperformance -- We know how
to outperform the market!

70
This Slide Intentionally Omitted

71
This Slide Intentionally Omitted

7272
Commercial & Residential Solutions Market Outlook
• Stronger U.S. economy should fuel U.S. Residential and Commercial
construction
– We expect to continue to benefit from the strong performance of these
markets through 2021
– Focus will be on increasing profitability and cash flow as we grow sales
• Emerging markets (especially China and India) offer a great growth
opportunity in the Food Quality / Cold Chain arenas
• Increasing focus on energy efficiency, sustainability, and comfort allows us
to further solidify our presence in our served markets globally!
– Global Variable Speed Residential Solutions
– Global VRF Commercial Solutions
Commercial & Residential Solutions Markets Offera Resilient Source of Growth and Profits

73
This Slide Intentionally Omitted

74
This Slide Intentionally Omitted

75
Invest in Technology
Expand in Served Markets Maintain Industry Stewardship
Perform in Core Markets
Priorities for Commercial & Residential Solutions Through 2021
• Exploit our industry leading technology to further penetrateexisting and adjacent markets
• Invest in and acquire technologies that have potential to scale in our ecosystem
• Aggressively acquire to enable
robust solutions and expand
market definition and participation
• Lead our customers through
change as the industry steward
Rebased company enables focus on core
markets -- Enabling above market growth!
Minority investments in 7AC and
Transformative Wave -- Recent examples
of successful efforts -- More will happen
Acquired PakSense and Locus Traxx to
expand served market in cold chain
transport -- Will find further opportunities
Engaging with governments and customers
around the world to lead through refrigerant
changes!

76
This Slide Intentionally Omitted

77
This Slide Intentionally Omitted

78
This Slide Intentionally Omitted

7979
$0
$20
2016E 2016 StrategicActions
Continuing Ops1 Underlying Growth Pentair V&C 2021 Target
~$4B
2017 Investor Conference (New York, NY) Bridge to 2021 Sales
The Rebased Emerson Has Solid Internal Growth Opportunities Along With Smaller Bolt-On Acquisitions and Potential Larger Strategic Acquisitions (Like Pentair V&C)
~$14.5B
~($6B) ~$2B
$B
2016
Adjusted Basis*1
Strategic
Divestitures
2016
Continuing
Ops
Large
Acquisition(s)
2021
Target
~$20B
Underlying Growth &
Bolt-On Acquisitions
~$20B
~3% Underlying Growth
+ ~2% Growth from
Bolt-on Acquisitions
Pentair V&C
1Includes results of discontinued operations
Upside ~$1B ~$21B

8080
$2.00
$2.50
$3.00
$3.50
$4.00
2016E 2016 StrategicActions
2016 Base ProForma
Organic Growth Margin Expansion Share Repo Acquisitions 2019 Target
2017 Investor Conference (New York, NY) Bridge to 2021 EPS
The Goal of the New, Smaller, More Profitable Emerson Is to Grow Faster, Expand EBIT Margins, and Increase Acquisitions to Drive a Faster EPS Growth Company
Through This 5 Year Planning Horizon
$2.45
($0.53)~$0.45
~$0.10
Strategic
Divestitures
2016
Continuing
Ops
Organic
Growth
Share
Count
Reduction
2021
Target
2016
Adjusted Basis*1
$2.98
5-year CAGR
~9.5%
Underlying Sales Growth: ~3.5%
Base EBIT Expansion: ~2.3 pts.
1 Excludes taxes and separation costs on divestitures2 Includes interest reduction
$2,5371 $2,052FCF*($M) ~$2,700
Target Is 9+% EPS Growth from New Emerson Base
Margin
Expansion2
~$0.45
~$0.40
Acquisitions
~$3.85

8181
Operating Capital Efficiency DrivesSignificantly Higher Cash Flow and Returns
The Long-Range Targets Include the New Pentair V&C Acquisition, so We Will Learn More After 18 - 24 Months -- But in the Near-Term the Pentair V&C Acquisition Takes
Our Trade Working Capital Over 20%
17.5% 17.7% 17.3% 17.9% 18.2% ~17.1%
Average Trade Working Capital (% of Sales)
$3.1B$3.6B $3.7B
$3.0B1* $3.1B1*
~$2.5B
$2.4B$3.0B $2.9B
$2.3B1 $2.5B1
~$2.0B
2012 2013 2014 2015 2016 2017E
$4.0B
12.5%
$3.7B
14.8%
$4.3B $4.4B
13% - 16%
of Sales
Long Term
Targets
< 16%
of Sales
11% - 14%
of Sales
Free Cash Flow*
Operating Cash Flow
96%1 116%1 110%1 105%1 131%1 ~122%1
FCF* /Net
Earnings
9.8%12.0% 11.9%
10.2%
$4.2B
15.0%13.2%
Note: TWC using a 4-point average; TWC for 2012-2016 includes the discontinued businesses1Excludes impact of repositioning items in 2015 and 2016, divestiture gains in 2015, and impairments in 2012 through 2014; 2Continuing Ops
12.5%
~17.6%
~14.1%
~$2.4B
15.1%
Common
Stockholders
2
8282
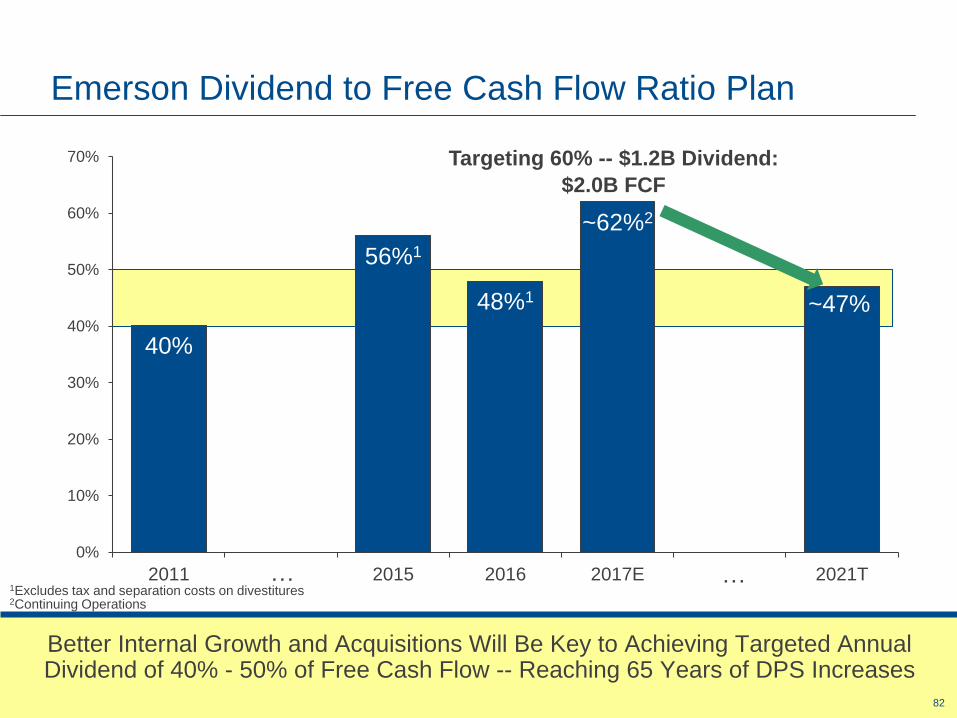
40%
56%1
48%1
~62%2
~47%
0%
10%
20%
30%
40%
50%
60%
70%
2011 2015 2016 2017E 2021T
Emerson Dividend to Free Cash Flow Ratio Plan
Better Internal Growth and Acquisitions Will Be Key to Achieving Targeted Annual Dividend of 40% - 50% of Free Cash Flow -- Reaching 65 Years of DPS Increases
… …
Targeting 60% -- $1.2B Dividend:
$2.0B FCF
1Excludes tax and separation costs on divestitures2Continuing Operations

8383
The New Emerson’s Roadmap to Creating Value Through 2021
As We Move Through 2017, We Will Drive Higher Profit Margins and Higher Returns on Capital for Emerson’s Shareholders -- Driving EPS Growth by 8% - 10% Annually
Sales Growth
Target: 2% - 4% Underlying
+3% - 4% Through Acquisitions
Consolidated: 5% - 8%
Free Cash Flow
(% of Sales)
Target: 11% – 14%
Operating
Margin
18% - 20+%
ROTC
Target: 18% - 25%
EBIT
Margin
16% - 19+%
8484
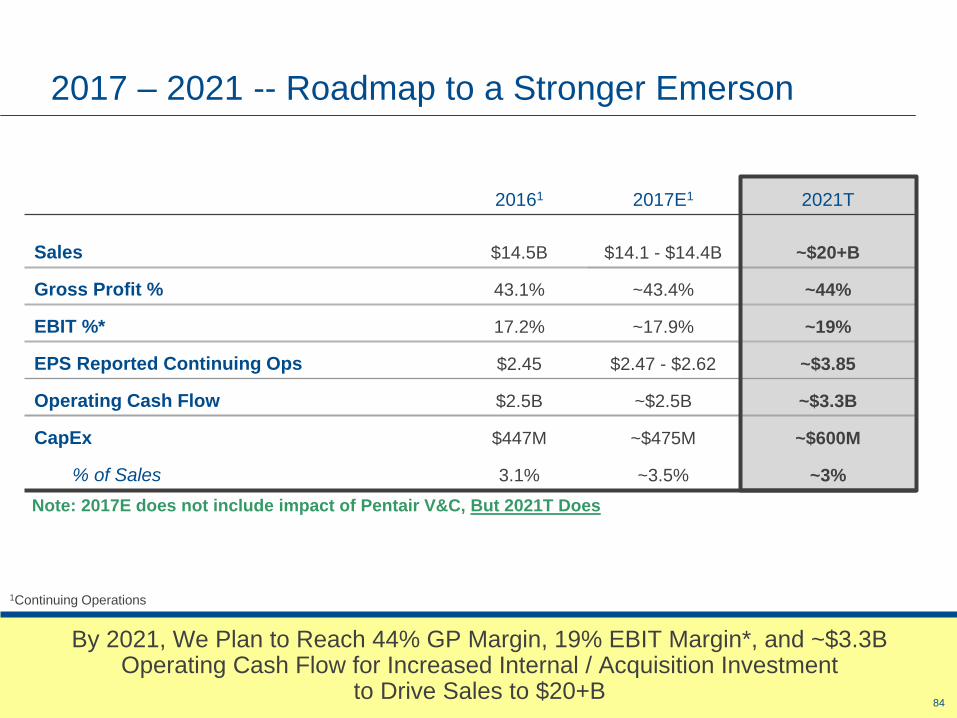
20161 2017E1 2021T
Sales $14.5B $14.1 - $14.4B ~$20+B
Gross Profit % 43.1% ~43.4% ~44%
EBIT %* 17.2% ~17.9% ~19%
EPS Reported Continuing Ops $2.45 $2.47 - $2.62 ~$3.85
Operating Cash Flow $2.5B ~$2.5B ~$3.3B
CapEx $447M ~$475M ~$600M
% of Sales 3.1% ~3.5% ~3%
2017 – 2021 -- Roadmap to a Stronger Emerson
By 2021, We Plan to Reach 44% GP Margin, 19% EBIT Margin*, and ~$3.3B Operating Cash Flow for Increased Internal / Acquisition Investment
to Drive Sales to $20+B
Note: 2017E does not include impact of Pentair V&C, But 2021T Does
1Continuing Operations

8585
Next Steps: 2017 Game Plan and Priorities
Perform as
“New Emerson”
• Finish executing on restructuring plans to right-size cost structure given global macroeconomic trends and smaller two platform business footprint
• Use cash proceeds and strong cash flow / balance sheet to aggressively acquire and enable organic growth
• Position company to fully capitalize on pending global energy market recovery
1. Fully Integrate
Acquisitions
• Aggressively execute on initial cost and revenue synergy plans
• Explore additional synergy opportunities as they emerge
2. Continue
Rationalizing Base
• Continue rationalization and restructuring of our 2 core platforms -- Perfect Execution
• Boost profitability, creating a leaner organization positioned for premium growth and premium valuation -- Key to Controlling Our Own Destiny
3. Position and
Execute for Growth
• Pursue both organic growth opportunities and acquisitions, especially in Process / Hybrid / Discrete Automation and Commercial & Residential areas
• Execute deals worth ~$3B, adding ~$2B to total sales by 2021, in addition to the acquisition of Pentair V&C
• Potential for additional $1-2B strategic acquisition for another ~$1B of sales
• Regrow Emerson to $20+B in annual revenues by 2021, recover lost earnings and cash flow
In 2017, Our Organization Will Be Aligned Towards Executing on These Strategic Priorities As We Benefit From Improvement in Our Core Markets and the Critical
Integration of the Pentair V&C Acquisition
Critical for
Pentair V&C

86
Emerson’s 2017 Key Financial Guidance --The Current Business Make-Up
% Change
20161 2017E Forecast1 2016-17ESales (GAAP) $14.5B $14.1 – $14.4B (3%) – (1%)
Underlying Growth* (7%) (2%) – 0%
Gross Margin 43.1% ~43.4% +30 bps
EBIT Margin* 17.2% ~17.9% +70 bps
EPS Reported Continuing Ops $2.45 $2.47 – $2.62 1% – 7%
Dividends Per Share $1.90 $1.92 +1%
Operating Cash Flow $2.5B ~$2.5B ~ Flat
Cash Returned to Shareholders $1.8B ~$1.5B
Other 2017 key assumptions:
• Currency Headwinds ~($0.2)B
• Tax Rate: ~29%
• 2017 Share Repurchase: ~$250M
• Acquisitions: ~$3.65B (includes Pentair V&C)
• Capital Expenditures: ~$475M, ~3.5% of sales
• Price – Cost: Expected to be in the range of ($25)M to $0M
Global GFI: FY 2017 2016-17E
Assumptions % Change
U.S. 2.0% – 3.0%
Canada (2.5%) – (1.5%)
Europe 1.0% – 1.5%
Middle East & Africa 0.5% – 1.5%
China 4.0% – 5.0%
Asia Pacific Excl. China 2.0% – 3.0%
Latin America (3.0%) – (2.0%)
1 Continuing Operations; 2017 excluding Pentair V&C

87
Break

88
Break

89
2017 Investor Conference Automation Solutions Business Overview
Mike Train
Executive President
February 16, 2017

90
2017 Investor Conference Automation Solutions Business Overview
Mike Train
Executive President
February 16, 2017

91
Automation Solutions2016 Summary
2015 2016
2015 – 2016
Change
Sales $10.2B $9.0B (12%)
EBIT $1.8B $1.5B (21%)
% of Sales 18.2% 16.2% (200 bps)
ROTC 22% 17%
44%
22%
20%
6%8%
Asia
Europe
Latin AmericaNorth America
2016 Major Markets Served 2016 Sales by Geography
Middle East & Africa
21%
12%
14% 13%
9%
9%
11%
11%
Upstream
Oil & Gas
Refining
Power Chemical
Other
Midstream
Oil & Gas
Hybrid
Discrete

9292
Key Messages
Automation Solutions Is Positioned for Growth Through Expanding Relevance in
Process and Building Leadership Positions in Hybrid and Discrete Industries
• Our problem solving strategy has driven strong growth through the cycle,
and is the foundation for Emerson’s continued industry leadership
• Global process markets remained challenging in 2016 led by the Oil & Gas reset
• Made significant strides to position Automation Solutions for stronger long-term
growth based on a deep understanding of our customers and investment trends
• Our customers must aggressively pursue Top Quartile project and operational
performance to deliver results in this challenging business environment
• Emerson has launched Operational Certainty enabled by the Plantweb Digital
Ecosystem to help customers achieve Top Quartile operational performance
• Valves & Controls acquisition greatly expands our ability to serve customers
through new project and operational certainty offerings
• As Automation Solutions, Emerson is building off its strength in process automation
to penetrate hybrid and discrete markets

93
Emerson Automation Solutions Trusted Advisor When it Matters Most
Taking on the industry’s toughest challenges,
and bringing predictable success
any time, any place.
Measure
Real-time
insights to bring
clarity to all
aspects of your
entire operation
Control
Control your
process and your
business with
precision,
certainty and
safety
Optimize
The decision
integrity to
confidently run
your business at
its maximum
potential
Power
Safe, productive
and reliable
installations, even
in harsh
environments
Solve
Achieve your
performance goals
through dependable
definition, execution
and support of your
automation vision
The most complete portfolio of products, services & expertise in the industry

9494
Automation Solutions Has Consistently Outperformed the Market and Is Well Positioned for the Future
Automation Solutions Grew +3.2 Points Above Market Through the Cycleand Gained 1.9 pts of Participation
1992 2009 2014 2016Market Acquisitions Penetration
Market Growth
2009 – 2016: -0.5%
Automation Solutions Growth
2009 – 2016: 2.7%
$10.9B
$9.0B
$7.5B
Automation Solutions Market Separation
$1.9B
Growth Drivers
• Industries & Regions
– Oil & Gas
• Floating Liquefied Natural Gas, Shale, Middle East, North Sea, Russia, Mexico
– Power
• North America, China, Eastern Europe
– Life Sciences and Food & Beverage
• UK, India, China
– Automotive
• Asia Pacific
• Strategic Acquisitions
– Non-intrusive Corrosion
– Blending & Transfer Systems
– Pipeline Management Software
– Engineered On/Off Valves
– Flame & Gas Detection
9595
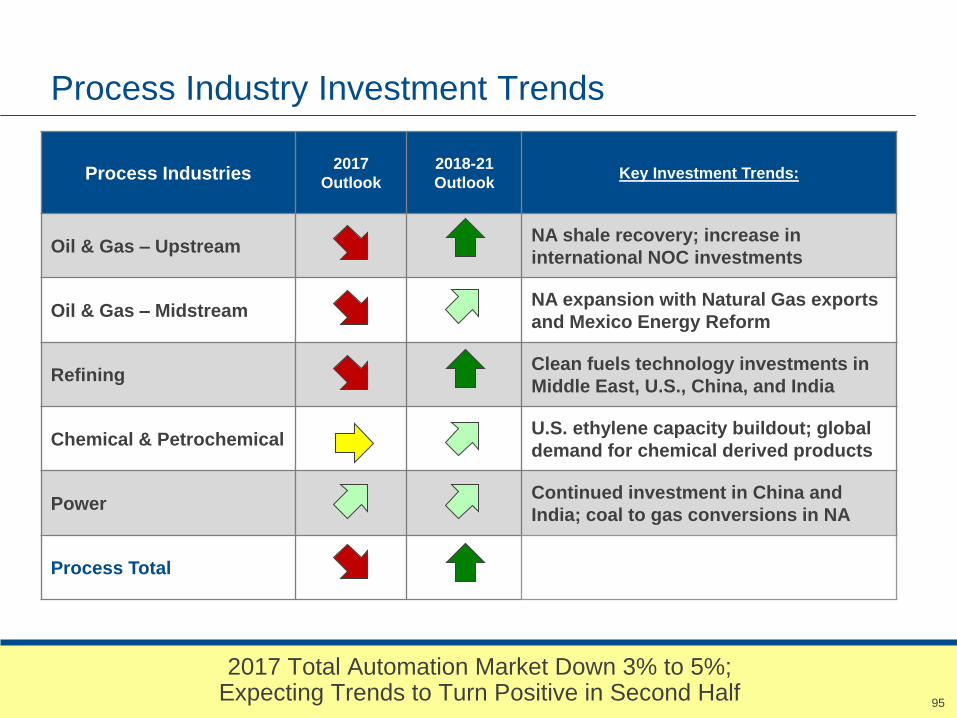
Process Industry Investment Trends
2017 Total Automation Market Down 3% to 5%; Expecting Trends to Turn Positive in Second Half
Process Industries2017
Outlook
2018-21
OutlookKey Investment Trends:
Oil & Gas – UpstreamNA shale recovery; increase in
international NOC investments
Oil & Gas – MidstreamNA expansion with Natural Gas exports
and Mexico Energy Reform
RefiningClean fuels technology investments in
Middle East, U.S., China, and India
Chemical & PetrochemicalU.S. ethylene capacity buildout; global
demand for chemical derived products
PowerContinued investment in China and
India; coal to gas conversions in NA
Process Total

96
Hybrid and Discrete Industry Investment Trends
Hybrid Industries2017
Outlook
2018-21
OutlookKey Investment Trends:
Life SciencesSignificant biotech investments in
Ireland; generics growth in AP and NA
Food & BeverageGlobal increase in operational
improvement and food safety spend
Metals & MiningGold and copper recovery spurring
project spend in LA and EUR
Pulp & PaperBio-product capacity additions in
EUR; strong packaging demand in AP
Hybrid Total
Discrete Industries2017
Outlook
2018-21
OutlookKey Investment Trends:
Industrial MachineryContinued automation across
industrial manufacturing segments
AutomotiveGrowth in production and new model
programs in NA, Emerging Markets
Consumer GoodsConvenience segment growth in U.S.;
emerging middle class in China
Discrete Total

97
Operational Improvements Will Take Priority Over New Construction as Markets Recover
Automation Solutions Market by Type of Business
Note: Chart is illustrative
Growth Downturn Recovery Growth
KOB3: Maintenance and Repair
KOB2: Brownfield Projects
KOB1: Greenfield Projects
2nd
3rd
1st
A bottom-up market
recovery offers
strong margin and
growth opportunity
Customers’ spend
will be focused on
efficiently running,
expanding and
optimizing their
existing assets

98
Industry Research Confirms Process Manufacturers Are Prioritizing Operational Performance Investments
“There is a sense of needing to be
in the top quartile to survive.”
Source: IHS Markit, Operational Excellence VOC
Research: 20 Industry Experts. August 22, 2016
“The challenge is knowing if there
will be a real benefit... definitely
the trend in the industry is to
not invest unless there is
certainty it will improve things.”
Operational Excellence Research
“…we're focused on expanding margins
by increasing efficiencies in our
operations and on capturing maximum
value from the resource base.”
Bruce NiemeyerChevron Corporation
Vice President, Mid-Continent
Key Customer Strategies
“We are advancing our strategic capital
investments and maintaining our focus
on operational excellence and value to
our customers.”
Lynn GoodDuke Energy Corporation
Chairman, President and CEO
Source: Q3 2016 Earnings Calls
PROCESS
99
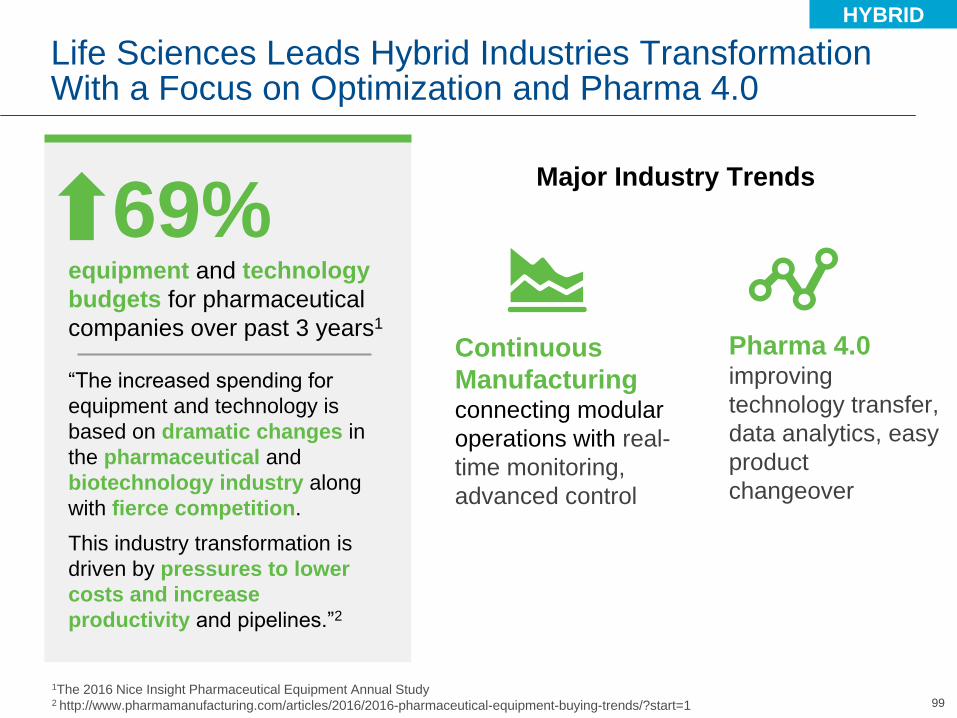
Life Sciences Leads Hybrid Industries Transformation With a Focus on Optimization and Pharma 4.0
69%equipment and technology
budgets for pharmaceutical
companies over past 3 years1
“The increased spending for
equipment and technology is
based on dramatic changes in
the pharmaceutical and
biotechnology industry along
with fierce competition.
This industry transformation is
driven by pressures to lower
costs and increase
productivity and pipelines.”2
HYBRID
Continuous
Manufacturing connecting modular
operations with real-
time monitoring,
advanced control
Major Industry Trends
Pharma 4.0 improving
technology transfer,
data analytics, easy
product
changeover
1The 2016 Nice Insight Pharmaceutical Equipment Annual Study2 http://www.pharmamanufacturing.com/articles/2016/2016-pharmaceutical-equipment-buying-trends/?start=1

100
Discrete Industries Are Rapidly Increasing Automation
Source: PwC’s 2016 Global Industry 4.0 Survey
“With our vision of Industry 4.0, we are
digitizing the entire value creation
process — from design and development
to production, sales and service.”Daimler 2015 Annual Report
“Henkel will leverage Industry 4.0 to
better plan, source, produce and
deliver its products and solutions.”Henkel 2020+ 2016 Investor & Analyst Conference
Smart manufacturing is promising to yield profitability and high
efficiency, but 87% of US manufacturers are yet to adopt it.Brian Kennell, CEO Tetra Pak North America
Industry 4.0 adoption will more than double
global level of digitalization by 2020
33%
72%
DISCRETE

101101
Top Quartile Programs Enable Peer-Leading Results in Capital Investments & On-Going Operations
Launched Project Certainty in 2016 to Help Customers Achieve Top Quartile Project Performance
Capital Efficiency
1 to 5 years
Project Certainty
Eliminate Cost
Transformational Technology Enabling Methodologies
Lowest Compliant Price
Select BestPractices
ExecuteAppraise StartupFront End
Engineering & Design
Reduce Complexity
AccommodateChange
Expert Partnering
$430B
Opportunity
Customer
Objectives
Customer
Activities
Emerson
Offering
Supporting
Programs

102102
Top Quartile Programs Enable Peer-Leading Results in Capital Investments & On-Going Operations
Launching Operational Certainty in 2017 to Help Customers Achieve Top Quartile Operational Performance
Optimize Production
Improve Reliability
Minimize Emissions
Operational Certainty
EnsureSafety
Maintenance & Repair
Shutdowns, Turnarounds,
& Outages
Optimize, Expand &Upgrade
Lifecycle Services
Expert Partnering
Industry Solutions
Customer
Objectives
Customer
Activities
Emerson
Offering
Supporting
Programs
Operational Efficiency
20 to 60 years
$1T+
Opportunity

103
Top Quartile Manufacturers Significantly Outperform Their Average Peers
Sources: Refining and Petrochemical Benchmarks,API, Solomon, OSHA, IHS Markit and Company Reports

104
Source: Internal Estimates; EBITDA has been used as a proxy for Business Performance
(Earnings)
Operational Business PerformanceRefining and Petrochemical Industries
For a Typical Facility
Average
Performer
Top Quartile
Performer
Average
Range
Optimal
Range
Reliability
Production &
Emissions
(Earnings)
Safety
Top Quartile Manufacturers Utilize Advanced Technology and Processes to Drive Long Term Results
15% Earnings
Improvement
Opportunity
• Utilize integrated information
management, production
and logistics
• Run proactive maintenance
programs supported by
condition based monitoring
• Implement automatic
process control
• Optimize processes with
real-time data
• Make investment decisions
for sustainable value
Behaviors of Top Quartile
Operational Performers

105
Logic
Analytics
Modeling
Actionable
InsightsSensors
Continuously
improving expertise
and efficiency
To Achieve Top Quartile Results, Customers Must Continuously Measure, Analyze & Decide, and Act
Diverse, rich data sets
(big data)
“Unlimited” storage
and processing (cloud)
Modeling, embedded
domain expertise
Securely distributed
to anyone, anywhere
Not just control
Energy, Reliability,
Safety, Optimization

106106
Industrial IoT Enables New Deployment Models for Operational Excellence Applications and Expertise
What Customers Need Is an Approach and an Architecture that Leverages All These Deployments
3rd Party Expert ServicesCloud Hosted
Centralized ExpertiseOn Premise or Cloud Hosted
Local ExpertsOn Premise
Customer Center
Integrated Operations Center
Monitoring and Diagnostics Center
3rd Party Monitoring
and Analysis
Platform
Diagnosis
or Work
Instructions
Customer Data
CustomerCustomer Data

107
Introducing The Plantweb Digital Ecosystem:Industry's Most Comprehensive Industrial IoT Portfolio
Data
Applications
Security
Services
Emerson Connected
Services
Plantweb
Insight
Secure
First Mile
Pervasive
Sensing
Gas
Monitor
Radar
Level
Electrical
MonitoringX-Well
Steam
TrapsVibration
Valve
Position
Monitor
Tank Safety
Valve
Monitor
Standalone
PUMPS
Rich Tools
HEAT EXCHANGER
STEAM TRAP
VALVE HEALTH
Pressure
Gauge
PERFORMANCE HEALTH ENERGY
Always
MobilePlantweb
Advisor
Technology
Partnership
Services &
Consulting
Control &
Safety
Systems,
Asset
Management
Intelligent
Field Devices
FOUNDATIONAL
SOLUTIONS
NEW
SOLUTIONS
Traditional Data Pathways IIoT Application Gateways
107
Non-Intrusive
Corrosion
Monitor

108108
Business Planning and Logistics, ERP
The Plantweb Digital Ecosystem Expands Our Original Plantweb to Connect Operational Technology and IT
From Intranet to Internet of Things: Advanced Technologies Have Altered the Cost-Benefit Equation for Access to Expertise and Efficiency
Production
Operations
Management
Supervisory
Control
Field
Devices
Equipment, Field Devices
& Control
Control, Safety Systems, and
Asset Management
Production Management, Reliability, Safety, Energy,
Digital Infrastructure, Information Distribution

109109
Pervasive Sensing Is the Foundation of Plantweb, Building off Industry Leading Presence and Experience
Hundreds of Thousands of Wireless Devices Installed Across>3500 Customer Sites Worldwide Totaling Over 8 Billion Operating Hours
Customers can now
collect data that’s never
been possible before
Devices are easily
deployed and
maintained at a
fraction of the cost
Supported by industry
leading wireless
expertise and services
40+ unique devices and growing
65%
less time
to install
60%
lower installed
cost
90%
smaller rack
room footprint

110
Our Secure First Mile™ Architecture Is a Simpler and Safer Approach for Connecting OT and IT Systems
The Industrial IoT
Challenge
Asset
Management
Wireless
Networks
Secure OT Environment
Control
Systems
RTUs &
SCADA
Secure IT Environment
Private
Clouds
Field
Gateway
Data
Diode
Edge
Gateway
Emerson Solution:
Secure First Mile™
How to Securely Bridge
OT and IT Environments?
Secure OT Environment
Secure IT Environment
Edge Gateway
• Converts protocols and provides secure data transfer to the IT Systems
Data Diode
• Physically disables the inbound path, creating an air gap for inbound communication
Field Gateway
• Collects data from OT systems and converts into protocols that support unidirectional data flow
Three Key Components
Asset
Management
Wireless
Networks
Control
Systems
RTUs &
SCADA

111
A Scalable Suite of Applications that Delivers Actionable Information
Plantweb Insight™ Plantweb Advisor™
Lightweight, asset-specific apps providing pre-built analytics with minimal configuration
Integrated suite of enterprise software providing robust, statistical analytics
• Low barrier proof-of-concept / ROI
• Minimal business system integration
• Intuitive design and consistent user interface
• Tight business system integration
• Leverages existing investments
• Easily scalable to thousands of assets
across multiple facilities
CORROSIONSTEAM TRAPSPUMPS VALVES HEALTH PERFORMANCEENERGY

112
Emerson Connected Services
Connected Services Deliver Insights and Outcomes Through New Monitoring Solutions
Customer Site
Repair Recommendations,
Collaboration, or Services
Emerson Monitoring
Expert Analysis
Decide
ActSee
Automation System
Health Monitoring
Steam Trap
Monitoring
Control Valve
Condition Monitoring
Machinery Condition
Monitoring
Customer Site
On-Premises Sensing
and Data Collection

113113
Our Customers Have Been Investing in Operational Excellence Technologies for Years
Bringing Engineering Expertise and Technology Together,Emerson Has Solved This Challenge
The challenge has been that point solutions lead to disconnected, underperforming silos…
...and bringing them all together has been a major challenge
Reliability
Engineers
Control Room
Operator
Production
Supervisors
Operations
Management
Process
Engineers
HistorianAdvanced
Analytics
Operations
Intelligence
Multivariate
Data Analysis
Machinery
Health
Asset
Condition
Equipment
Health
Turbo-
Machinery
Asset
Performance
ERP
Maintenance
Technicians

114114
Plantweb Digital Ecosystem Is Designed With a Deep Understanding of Our Customers’ Operations
By Partnering With Emerson, Our Customers Can Be Confident They Will Achieve Results
Emerson works with customers to,
• Understand their operations and technology investments
• Design an architecture that leverages Emerson and 3rd party technologies
• Plan and Execute an implementation to drive top quartile performance
Advanced
Analytics
Operations
Intelligence
Multivariate
Data Analysis
Machinery
Health
Asset
Condition
Equipment
Health
Turbo-
Machinery
Asset
PerformanceERPHistorian
DELTAV OVATION
AMS
Site Mgr.
AMS
Mach. Mgr.
Rosemount
Smart WirelessAMS Asset
Health Monitors

115
Customer: National Refining
Company
Customer: International Oil &
Gas Company
Customer: International
Chemical Company
Pain: Unknown vibration,
cavitation, and seal fluid
issues on rotating pumps
were causing shutdowns
Pain: Heat exchanger fouling
and heat duty error were
causing process interruptions
and energy losses
Pain: 25% of steam
traps were in failed state,
customer didn’t have visibility
Solution: Pump health
monitoring
Solution: Enterprise wide
heat exchanger monitoring
Solution: Emerson cloud
based steam trap monitoring
services
17% savings in
maintenance costs
9-month investment payback
7% steam savings
Emerson Enables Customers to Make IoT a Reality Today, Whether Monitoring a Single Asset…
Plantweb AdvisorPlantweb Insight Connected Services

116
• Automated intelligence
• Model-based control
• Expert systems
• Plantweb Advisor
… Or Creating a Completely Virtual Plant
Solutions Impact Benefit
• Digital asset twins
• Plantweb InsightAsset
Reliability
Safety
ProcessEfficiency
Precision
Self-learning
PlantAvailability
Flexibility
Compliance
PeopleExpertise
Utilization
Productivity
• Integrated plant
control & simulation
• Cybersecurity
• Decision support
• Plant wide
optimization
Asset Availability
Process Optimization
Plant Virtualization

117117
Top Quartile Projects Significantly Outperform Their Average Peers
Project Certainty Can Make Projects Viable That Are Currently On Hold
Project Costs
Project Schedules
4th 1stQuartiles
54% Lower Cost for top quartile
projects
49% Shorter
Schedulesfor top quartile
projects4th 1stQuartiles
>50% above budget
>25% over schedule
65%of projects
over $1B
are…
Capital Project Crisis
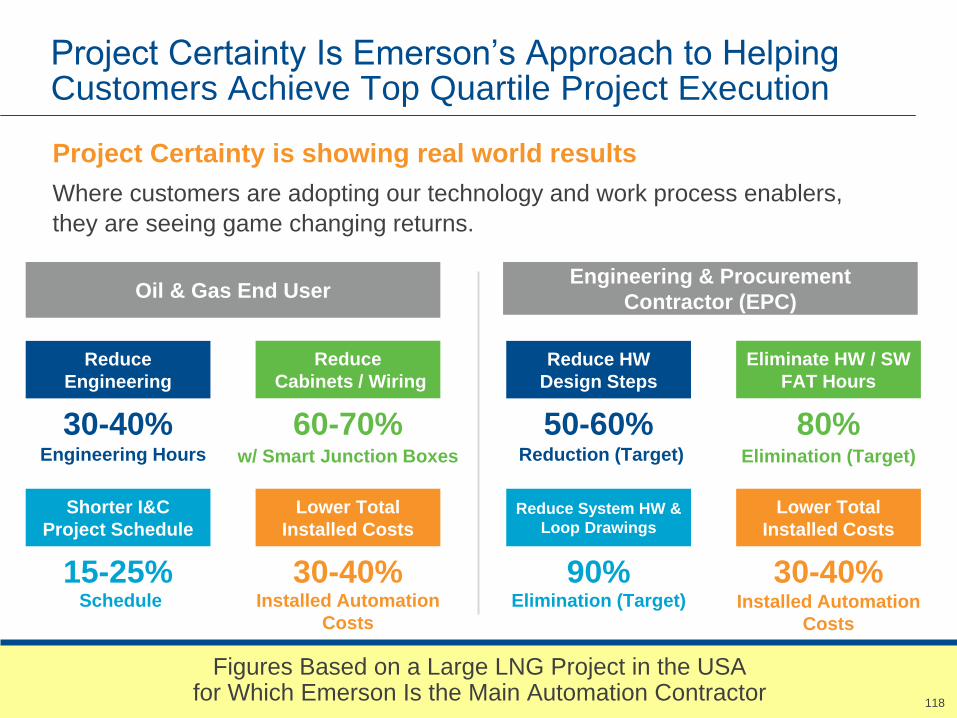
118118
Project Certainty Is Emerson’s Approach to Helping Customers Achieve Top Quartile Project Execution
Figures Based on a Large LNG Project in the USA for Which Emerson Is the Main Automation Contractor
Project Certainty is showing real world results
Where customers are adopting our technology and work process enablers,
they are seeing game changing returns.
Shorter I&C
Project Schedule
Lower Total
Installed Costs
Reduce
Cabinets / Wiring
Reduce
Engineering
30-40%
15-25% 30-40%
60-70%Engineering Hours
Schedule Installed Automation
Costs
w/ Smart Junction Boxes
Reduce System HW &
Loop Drawings
Lower Total
Installed Costs
Eliminate HW / SW
FAT Hours
Reduce HW
Design Steps
50-60%
90% 30-40%
80%Reduction (Target)
Elimination (Target) Installed Automation
Costs
Elimination (Target)
Oil & Gas End UserEngineering & Procurement
Contractor (EPC)

119
This Slide Intentionally Omitted

120
This Slide Intentionally Omitted

121
Valves & Controls Expands Emerson’s Operational Certainty Capabilities
• Long-term service
agreements ensure
on-time repair &
upgrades to all valves
• Diagnostics on critical
valves increases uptime
and lowers onsite
inventory
One Global Manufacturer
Servicing All Valves
Control Valves Pressure Management and Isolation Valves
Valves in a
typical plant Expanded
valve service revenue
opportunity per site
2-3x
New
Existing

122
Lower Procurement
Costs
Standardized
Products
Compatibility
guaranteed
Original Equipment
Manufacturer
Expertise
at Front End
Engineering &
Design
>1000 Certified
Service Engineers
for commissioning
One call for all valve
support
Valves & Controls Expands Project Certainty Capabilities With Transformational Approaches to Valve Projects
Main Valve Partner Automated Isolation Valve Opportunity
Traditional Approach
• Offers components- Instrument
- Actuator
- Isolation valve
• Ships separately
• Requires engineering, assembly,
configuration, and testing on site
Integrated Emerson Solution
• Industry first capability to
deliver a fully engineered,
integrated, configured and tested
valve solution from a single supplier
• Reduce risk of incompatibility
• Minimize ordering and commissioning
complexity
• Improve change order management

123
Emerson Has Enabled Major Shifts in the Life Sciences Industry Through Innovative Technologies & Services
Systems Validation
ConsultingPartnering with
customers to reduce
FDA validation period
DeltaV Discovery
Control solution for R&D
applications enabling
improved technology transfer
Batch Recipe Software
Ensuring right-first-time
manufacturing for batch
operations
Electronic
Records
Management
Accelerating
Product Pipelines
Increasing
Regulatory
Compliance
Recent Industry Focus: Optimizing Manufacturing Capabilities

124
We Will Continue to Lead the Industry With Forward Thinking Innovations to Maximize Business Results
PK Controller
Skid control solution for
modular applications
Pharma 4.0Improving technology transfer, data
analytics, easy product changeover
Future Industry Focus: Maximizing Enterprise Performance
Expanding Hygienic
Instrumentation Portfolio
Improving data coverage of the
entire operation for better control
and optimization
Elevating Software Capabilities
Providing advanced Operations
Management capabilities unique to
Life Sciences industries
Continuous Manufacturing Connecting modular operations
with real-time monitoring,
advanced control

125
Pneumatics
Material
Joining
Electrical
Sensors &
Analyzers
Emerson Has an Established Product Portfolio Serving Discrete Industries
Proportional
ValvesCylinders & Actuators Grippers
Directional
Valves
Air
Preparation
Vibration
Joining
Infrared
Joining
Laser
Joining
Ultrasonic
Joining
Power Supplies Lighting Electrical
Apparatus
Leak Detection Flame Detection Proximity

126
Our Existing Capabilities Provide Unique and Differentiated Solutions
AutomotivePackaging Aerospace
Paint Shop• Lighting and power• Flow Control
Press Room & Stamping• Gripping and transfer• Pressure control
Plastic Joining• Bumpers and taillights• Engine covers• Dashboard and consoles
Tire & Ride Control• Tire making• Air ride systems
Metal Joining• Battery and wiring
Precision Cleaning
Filling & Sealing• Filling control• Container sealing
Material Handling• Sorting• Loading / unloading
Inspection• Leak detection
Secondary Packing & End of Line• Motion control• Product grippers• Compressed air
Ground Support Equipment
Automated Testing Systems
On & Off Valves
Pressure Control
Rocket Fueling Control

127
Enhancing Our Position in the Smart Factory Will Complement Our Strong Process Market Leadership
Process Hybrid Discrete
Pumps Robotics &
Specialty
On / Off
Valves
Solenoids &
Pneumatics
Electrical &
Infrastructure
Operations Management
Automation Platform
Measurement & Control
Enterprise & Other
Equipment &Infrastructure
SensorsMotionControl
ValvesInstruments
Process
Control
Machine
Control
ExistingCapabilities
Become a trusted partner for machine builders and end-users
• Build upon our history as a leader in sensing andcontrol
• Enable operational improvement through smart, connected technologies

128
We Have Identified Target Markets With Strong Growth, Differentiated Technologies and Viable Entry Points
Focus segments:
• High growth and high innovation
• High value to design of machines
• Industry 4.0 enablers
• Presence of available partners and acquisitions
Capitalize on Industry 4.0and diversify served markets
0
2
4
6
8
10
12
Product Innovation
Low High
16%
Growth
CAGR (%)
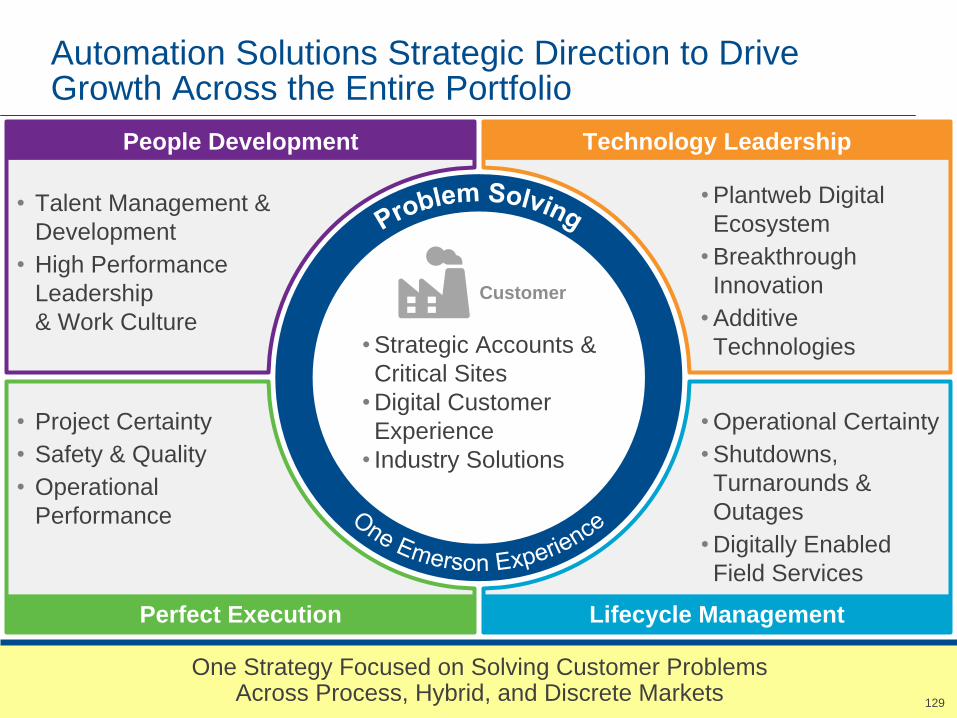
129129
Automation Solutions Strategic Direction to Drive Growth Across the Entire Portfolio
One Strategy Focused on Solving Customer Problems Across Process, Hybrid, and Discrete Markets
• Talent Management &
Development
• High Performance
Leadership
& Work Culture
People Development
• Plantweb Digital
Ecosystem
• Breakthrough
Innovation
• Additive
Technologies
Technology Leadership
• Operational Certainty
• Shutdowns,
Turnarounds &
Outages
• Digitally Enabled
Field Services
Lifecycle Management
• Project Certainty
• Safety & Quality
• Operational
Performance
Perfect Execution
• Strategic Accounts &
Critical Sites
• Digital Customer
Experience
• Industry Solutions
Customer

130
This Slide Intentionally Omitted

131
Automation Solutions2016 Summary & 2017 Guidance
2015 2016 2017E
Sales $10.2B $9.0B(5%) - (3%)
Underlying Growth*
EBIT $1.8B $1.5B
% of Sales 18.2% 16.2% 17% - 18%
ROTC 22% 17%
44%
22%
20%
6%8%
Asia
Europe
Latin AmericaNorth America
2016 Major Markets Served 2016 Sales by Geography
Middle East & Africa
21%
12%
14% 13%
9%
9%
11%
11%
Upstream
Oil & Gas
Refining
Power Chemical
Other
Midstream
Oil & Gas
Hybrid
Discrete

132
This Slide Intentionally Omitted

133

134

135
2017 Investor ConferenceCommercial & Residential Solutions Business Overview
Bob Sharp
Executive President
February 16, 2017

136
2017 Investor ConferenceCommercial & Residential Solutions Business Overview
Bob Sharp
Executive President
February 16, 2017

137
Commercial & Residential Solutions2016 Summary
2015 2016
2015 – 2016
Change
Sales $5.6B $5.5B (1%)
EBIT $1.2B $1.3B 7%
% of Sales 21.3% 23.2% 190 bps
ROTC 42% 45%
2016 Sales by Market 2016 Sales by Geography
65%17%
9%
Asia
Europe
Latin America
North America
Middle East & Africa
31%
10%
20%
17%
4%
18%
Commercial
AC
Cold
Chain
Non-Residential
Construction
Residential
Construction
Residential
AC
Other Commercial
and Industrial5%4%
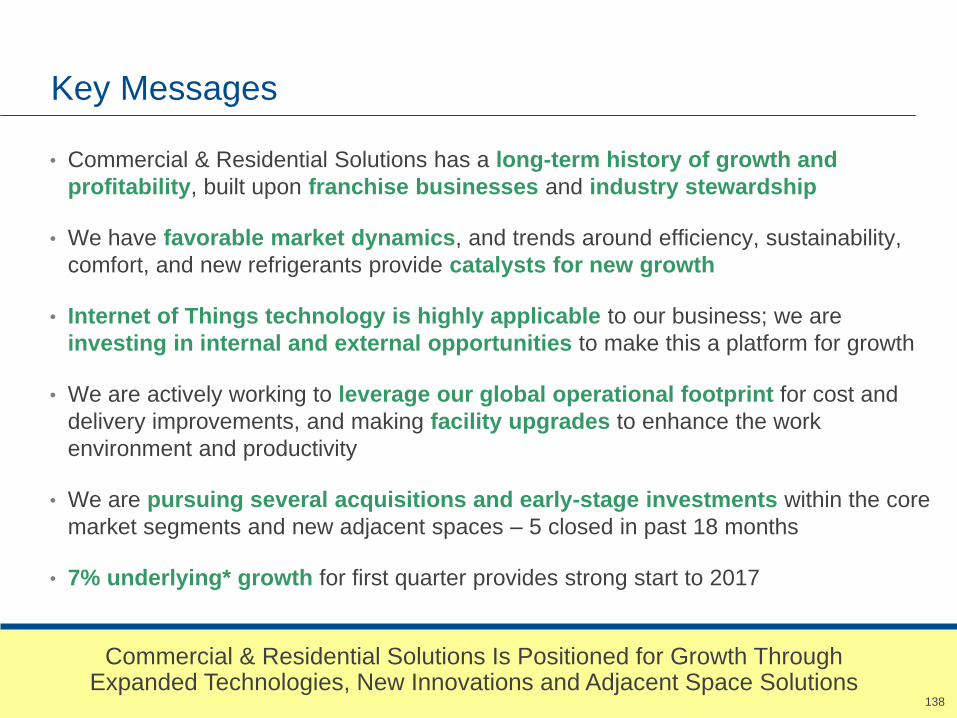
138138
Key Messages
• Commercial & Residential Solutions has a long-term history of growth and
profitability, built upon franchise businesses and industry stewardship
• We have favorable market dynamics, and trends around efficiency, sustainability,
comfort, and new refrigerants provide catalysts for new growth
• Internet of Things technology is highly applicable to our business; we are
investing in internal and external opportunities to make this a platform for growth
• We are actively working to leverage our global operational footprint for cost and
delivery improvements, and making facility upgrades to enhance the work
environment and productivity
• We are pursuing several acquisitions and early-stage investments within the core
market segments and new adjacent spaces – 5 closed in past 18 months
• 7% underlying* growth for first quarter provides strong start to 2017
Commercial & Residential Solutions Is Positioned for Growth Through Expanded Technologies, New Innovations and Adjacent Space Solutions

139
Core Business Platforms
• Making the greatest use of the world’s valuable resources
• Helping nations move their economies forward in a responsible way
• Enabling the performance and safety of industry when it matters most
• Advancing the industries that are the backbone of daily life
• Ensuring human comfort and health
• Protecting food quality and sustainability
• Advancing energy efficiency and environmental conservation
• Creating sustainable infrastructure
• Continuing momentum through our Helix Innovation Network
We concentrate on the most complex and important challenges facing the world in the process, industrial, commercial and residential markets
EMERSON AUTOMATION SOLUTIONS EMERSON COMMERCIAL & RESIDENTIAL SOLUTIONS

140

141
Increased Collaboration as Commercial & Residential Solutions Can Unleash Greater Value Creation

142
Tools & Home
Products
Air
Conditioning Refrigeration
Sensors &
Controls
Electronics &
Solutions
Mobile App Development
Marquee Accounts
Internal, Channel, and Customer Facing Synergy Programs Are Underway
Core
Functions
Capabilities
Channels
Customers
Logistics
Warehousing
Human Centered Design
Cloud Computing / Monitoring
Analytics
Service
Software Development
Digital Engagement / Social
Electronics Design
Sales Force AutomationCustomer Intelligence
eCommerceIndustrial / Wholesale
Home Centers / Retail
Food Retail / Service
OEMs
Consumers / End UsersContractors / Facilities
Engineers
Government / Utilities
Information Technology
Finance & Legal
Research & Technology
Operations & Supply Chain
Marketing
Human Resources

143
Industry Forward Market Trends
Residential 2%-5%• Energy efficiency / conservation
• Home automation / wireless
• Channel dynamics
Commercial 2%-5%• Emerging market & population growth
• Energy scarcity & regulations
• Building automation & indoor air quality
Food Retail /
Services2%-3%
• Rising energy costs and regulations
• Food Safety Modernization Act (FSMA)
• Organic waste disposal requirements
Transport 2%-4%• Perishable shipments by marine container
• Emerging market public transportation
• Emission standards in truck / trailer
Growth Summary by Key Market Space
Cold Chain

144
This Slide Intentionally Omitted

145

146
Bringing Comfort and Convenience to Homes

147
Enabling High Performance Buildings

148
Keeping Food Fresh Throughout the Cold Chain

149
This Slide Intentionally Omitted

150150
Growing Base of Sensi Comfort Monitoring Installations
Monitoring Delivers Quality Install and Service Support Provides Advanced Warning and Diagnostics for Any Issues
• Sensi Comfort Monitoring and Smart Service
• Improves customer experience and ensures quality installation
• Provides ongoing relationship with customer
• Reliable new installs and service agreements
• Partnering with large national contractors
• Remote data access and improved productivity
• Targeting 15+M basic service agreements that exist today
• 7 sensors, with 50 algorithms
providing real-time system checks
• New installation verification
• Smart service agreements with 24/7
monitoring service
• Early notification of developing
problems before comfort is impacted
Big Box Channel a Key Opportunity
Contractor Install & Maintenance Support

151
This Slide Intentionally Omitted

152
This Slide Intentionally Omitted

153153
Heat Pump
Rural
Coal Boiler
Our Scroll Technology Supports China Clean Air Initiatives Including Home and District Heat Pumps
Supporting Chinese Government and System OEMs With Emerson Solutions Expertise
Municipal
Heating
District
Heating
Gas Heating
Urban
Coal Boiler
China Heating Coverage• Government actively
working to address air quality issues
• Air source heat pump recognized as the best solution versus coal boiler heating systems
• Emerson scroll has technology advantage in low ambient environment
• Rapid growth today, with increasing number of local subsidy programs

154154
Leveraging Industry Stewardship Position to Engage With Entire Value Chain
We’re Leveraging Expertise, Relationships, and Capabilities for Solutions,Even in the Most Competitive Global Markets
COMPRESSOR
Core component and
application specific
solutions
OEM
Providing technical
training for installation
and ongoing service
CONTRACTOR
Understanding needs
and supporting
ease of use
END USER
Participating with industry
associations to make
recommendations on policy
and regulations
STANDARD BODIES
Traditional Relationship
Increased Engagement

155
Our Components and Solutions Are the Backbone of HVAC and Refrigeration Systems
Residential HeatingRefrigeration Commercial AC & Heating
System
Level
Cases, Racks, Units Chillers Heat Pumps
Application
Specific
Solutions
Core
Components

156156
Example of Solutions Partnership With European Refrigerated Display Case Producer
Integral Display Case Infrastructure Delivers 21% Savings to the RetailerDriven by Service and Maintenance Reductions
Central Plant Architecture Requires Mechanical Room and Extensive Piping
Integral Cases Provide Flexibility and More Selling Space

157
Expanding Our Portfolio of Commercial AC Efficiency Solutions
Replace
HVAC
Equipment
- New HVAC equipment with higher efficiency
- High first cost competes with lower operating costs
- Capital outlay may be impediment
- Retrofit existing equipment to improve efficiency
- Rebate incentives drive retrofit actions
- Upgrades improve building comfort
- Visibility of system health and fault detection
- Virtual “building controls” via connectivity and cloud
- System complexity varies depending on building size
- High first cost, high refrigerant charge and technically complex
- Applicability to US market is still being determined
- Compressor and electronics are well-suited to Emerson offering
Upgrade
Installed
Equipment
Base
Building
Management
System
(BMS)
Variable
Refrigerant
Flow
(VRF)

158
Delivery of Commercial Building Solutions Through New Technologies and Helix Innovation
+ +
ProAct
Copeland ScrollVariable Speed
Site
Supervisor
CoreSense
Communications
Catalyst LiteVariable speed drive
for rooftop units
Copeland ScrollTwo-Stage
Copeland ScrollVariable Speed
Catalyst eIQVariable speed drive
plus sensors, controller
and connectivity
eIQ PlatformCloud-based
monitoring and
diagnostics
Copeland ScrollTwo-Stage

159
This Slide Intentionally Omitted

160
This Slide Intentionally Omitted

161
Refrigeration Industry Also Facing Many Complex Challenges

162
90K Industry Touchpoints
E360 Industry Program Helps Make Sense of the Most Pressing Issues in Refrigeration
NAFEM ShowOrlando, FL
AHR ExpoLas Vegas, NV
Oct
E360 ForumTucson, AZ
DOE Compliance
Webinar
SNAP Ruling & Refrigerants
Webinar
March
E360 ForumRaleigh, NC
Participants recognize our domain expertise
• 97% rated content highly valuable
• 94% would recommend to a colleague9K Live Event Participants

163163
The Importance of Serving Contractors Extends to Plumbing – RIDGID Is a Leader in the Space
Contractor Education Contractor Efficiency
RIDGID Customer Experience Focused on Contractor Efficiency
• Extensive use of YouTube for
contractor education
- 200k hours of RIDGID video watched
• Hands-on tool demonstrations to
contractors
- 75k tools demonstrated
• Communicating with customers
via social media
- 800k followers
• RIDGID Net Promoter Score is 73
- Customers highly satisfied and loyal
to brand
- Similar NPS as Apple, Amazon and
Netflix
Solder Joining- Drain line
- Prep tube
- Apply flux
- Heat with flame
- Melt solder
- Can be up to 40 mins / joint
Press Joining- Fast and easy
- No flame or fire watch
- Use on wet systems
- ½” to 4” fitting in 5 secs

164164
IoT Solutions Extend Throughout the Commercial & Residential Solutions Platform
Connected Solutions Helping Contractors Navigate Changes
CrossChek Thermal ImagingSmart Drain Cleaning
Cable Distance: 40’
Speed: 254 RPM
DEVICE
RIDGID R889
Battery Life: 45%
Wi-Fi Signal: Strong
Runtime: 2:48Algorithms
Machine Learning

165165
Increased Attention to Cold Chain for Both Traceability and Loss Prevention
Stakeholders Across the Cold Chain Need Energy Efficiency, Food Safety and Sustainable Waste Management Solutions
Space constraints and local regulations
are restricting food waste in landfills
Big, high-stakes impact areas for
participants and retailers

166
Emerson Solutions Are Helping Stakeholders at Multiple Points Across the Cold Chain
Delivering Benefits to Our Customers
• End-to-end food quality
• Reduced food shrinkage
• Shelf life strategies
• Robust supply
• Regulation compliance
• Predictive equipment alerts
Delivered major sustainability impact in 2016:
• Diverted 7K tons of food waste
• Scheduled 1,200 pump outs of disposed food waste
• Reduced greenhouse gas emissions equal to 12M car miles
• Slurry produced 2.5M kWh of power
Grind2EnergyConnected Solutions

167
- Alarms
- Food quality reports
- Smart dispatch
- Energy monitoring
We Now Have an End to End Monitoring Presence Across the Cold Chain
- Real-time monitoring, tracking & control of container
- Monitoring system for vessels at sea
- Container fleet asset management & maintenance
- Food temperature sensors
- Remote food monitoring
- Compliance reporting
Focus from grower-forward Focus from retailer-back
Monitoring the
facility
Monitoring the
container
Monitoring the
cargo

168168
Grind2Energy Solving Food Waste Management Challenges for Retail and Commercial Kitchens
Grind2Energy Solutions Have Diverted 7,400 Tons of Food Waste From Landfills, Equivalent to 12M Car Miles
• No upfront costs. Monthly subscription service:
- Installation- Maintenance- Monitoring- Pickups / delivery
• Emerson monitors tank levels in real-time via sensors
- Partnering with AT&T on IoT connectivity
- Data analytics to customers
• Pump-out scheduling and coordination
• Predictive maintenance and remote service visibility

169
Industry and Customer Response to the Helix Center Has Been Tremendous

170
This Slide Intentionally Omitted

171
This Slide Intentionally Omitted

172
This Slide Intentionally Omitted

173
Commercial & Residential Solutions2016 Summary & 2017 Guidance
2015 2016 2017E
Sales $5.6B $5.5B +3 to 5%Underlying* Growth
EBIT $1.2B $1.3B
% of Sales 21.3% 23.2% ~23.5%
ROTC 42% 45%
2016 Sales by Market 2016 Sales by Geography
31%
10%
20%
17%
4%
18%
Commercial
AC
Cold
Chain
Non-Residential
Construction
Residential
Construction
Residential
AC
Other Commercial
and Industrial
65%17%
9%
Asia
Europe
Latin America
North America
Middle East & Africa
5%4%

174174
Key Messages
• Commercial & Residential Solutions has a long-term history of growth and
profitability, built upon franchise businesses and industry stewardship
• We have favorable market dynamics, and trends around efficiency, sustainability,
comfort, and new refrigerants provide catalysts for new growth
• Internet of Things technology is highly applicable to our business; we are
investing in internal and external opportunities to make this a platform for growth
• We are actively working to leverage our global operational footprint for cost and
delivery improvements, and making facility upgrades to enhance the work
environment and productivity
• We are pursuing several acquisitions and early-stage investments within the core
market segments and new adjacent spaces – 5 closed in past 18 months
• 7% underlying* growth for first quarter provides strong start to 2017
Commercial & Residential Solutions Is Positioned for Growth Through Expanded Technologies, New Innovations and Adjacent Space Solutions

175

176

177

178

179
Reconciliation of Non-GAAP Measures
Sales % chg. vs. PY Q1 Q2 Q3 Q4 FY
Sales change (GAAP) 1% (6%) (11%) (15%) (8%)
Acq/Div/FX 7% 7% 8% 8% 7%
Underlying* 8% 1% (3%) (7%) (1%)
Sales % chg. vs. PY Q1 Q2 Q3 Q4 FY
Sales change (GAAP) (17%) (9%) (10%) (6%) (11%)
Acq/Div/FX 7% 4% 2% 1% 4%
Underlying* (10%) (5%) (8%) (5%) (7%)
2017
Sales % chg. vs. PY Q1 Q2 Q3 Q4 FY
Sales change (GAAP) (4%) (3) - (2%) (1) - 0% (1) - 1% (3) - (1%)
Acq/Div/FX 1% ~1% ~1% ~1% ~1%
Underlying* (3%) (2) - (1%) 0 - 1% 0 - 2% (2) - 0%
Auto
Sols
2017 2017E 2017E
Sales % chg. vs. PY Q1 FY FY
Sales change (GAAP) 6% 3 - 5% (7) - (5%)
Acq/Div/FX 1% - ~2%
Underlying* 7% 3 - 5% (5) - (3)%
2015
2016
2017E
Comm & Res Sols
In this presentation non-GAAP measures (denoted with an *) are used when talking about the Company's performance, and a reconciliation of
those measures to the most comparable GAAP measures is contained below.

180
Reconciliation of Non-GAAP Measures
EBIT Margin 2015 2016 2017E 2021T 15 vs '16 16 vs '17E
Pretax margin (GAAP) 23.4% 16.0% ~16.7% ~18% (740) bps 70 bps
Interest expense, net 1.1% 1.2% ~1.2% ~1% 10 bps -
EBIT margin* 24.5% 17.2% ~17.9% ~19% (730) bps 70 bps
Divestiture gains (6.4%) - - - 640 bps -
EBIT margin adjusted* 18.1% 17.2% ~17.9% ~19% (90) bps 70 bps
Earnings Per Share 2015 2016 Change
Diluted earnings per share (GAAP) 3.99$ 2.52 (37%)
Repositioning items and divestiture gains (0.82) 0.46
Adjusted basis diluted earnings per share* 3.17 2.98 (6%)
Discontinued operations (0.36) (0.53)
Diluted earnings per share continuing ops. adjusted* 2.81$ 2.45 (13%)
Free Cash Flow 2016
Operating cash flow (GAAP) 2,881$
Impact of repositioning items 179
Operating cash flow adjusted* 3,060
Capital expenditures including discontinued operations (523)
Free cash flow* 2,537
Impact of discontinued operations (485)
Free cash flow continuing operations* 2,052$
Free Cash Flow 2012 2013 2014 2015 2016 2017E 2021T
Operating cash flow (GAAP) 3.1$ 3.6 3.7 2.5 2.9 ~2.5 ~3.3
Impact of taxes on divestiture gains and repositioning items - - - 0.5 0.2 - -
Operating cash flow adjusted* 3.1 3.6 3.7 3.0 3.1 ~2.5 ~3.3
Capital expenditures (0.7) (0.6) (0.8) (0.7) (0.6) ~(0.5) ~(0.6)
Free cash flow* 2.4$ 3.0 2.9 2.3 2.5 ~2.0 ~2.7
In this presentation non-GAAP measures (denoted with an *) are used when talking about the Company's performance, and a reconciliation of
those measures to the most comparable GAAP measures is contained below.

181
Reconciliation of Non-GAAP Measures
Free Cash Flow to Net Earnings Common Stockholders 2012 2013 2014 2015 2016 2017E
Operating cash flow to net earnings (GAAP) 155% 182% 172% 93% 176% ~153%
Capital expenditures & impact of divestiture gains
(& taxes paid), repositioning items & impairments (59%) (66%) (62%) 12% (45%) ~31%
Free cash flow to net earnings adjusted* 96% 116% 110% 105% 131% ~122%
Dividend to Free Cash Flow Ratio 2011 2015 2016 2017E 2021T
Dividends to operating cash flow (GAAP) 32% 50% 43% ~49% ~38%
Capital expenditures & impact of taxes on divestiture gains &
repositioning items 8% 6% 5% ~13% ~9%
Dividends to free cash flow* 40% 56% 48% ~62% ~47%
Operating Cash Flow % of Sales 2016
Operating cash flow continuing ops. % of sales (GAAP) 17.2%
Discontinued operations (2.1%)
Operating cash flow % of adjusted basis sales* 15.1%
Debt / EBITDA 2017E
Debt / Net earnings (GAAP) ~2.7
Impact of depreciation and amortization, net interest expense
and income taxes ~(1.3)
Debt / EBITDA* ~1.4
In this presentation non-GAAP measures (denoted with an *) are used when talking about the Company's performance, and a reconciliation of
those measures to the most comparable GAAP measures is contained below.