2017 investor day - generac power systems
TRANSCRIPT

2017 Investor DaySeptember 7, 2017

Forward Looking Statements
Certain statements contained in this presentation, as well as other information provided from time to time by Generac Holdings Inc. or its employees, may contain forward-looking statements that involve risks and uncertainties that could cause actual results to differ materially from those in the forward-looking statements.
Forward-looking statements give Generac’s current expectations and projections relating to the Company’s financial condition, results of operations, plans, objectives, future performance and business. You can identify forward-looking statements by the fact that they do not relate strictly to historical or current facts. These statements may include words such as “anticipate,” “estimate,” “expect,” “forecast,” “project,” “plan,” “intend,” “believe,” “confident,” “may,” “should,” “can have,” “likely,” “future,” “optimistic” and other words and terms of similar meaning in connection with any discussion of the timing or nature of future operating or financial performance or other events.
Any such forward-looking statements are not guarantees of performance or results, and involve risks, uncertainties (some of which are beyond the Company’s control) and assumptions. Although Generac believes any forward-looking statements are based on reasonable assumptions, you should be aware that many factors could affect Generac’s actual financial results and cause them to differ materially from those anticipated in any forward-looking statements, including: frequency and duration of power outages impacting demand for Generac products; availability, cost and quality of raw materials and key components used in producing Generac products; the impact on our results of possible fluctuations in interest rates and foreign currency exchange rates; the possibility that the expected synergies, efficiencies and cost savings of our acquisitions will not be realized, or will not be realized within the expected time period; the risk that our acquisitions will not be integrated successfully; difficulties Generac may encounter as its business expands globally; competitive factors in the industry in which Generac operates; Generac's dependence on its distribution network; Generac's ability to invest in, develop or adapt to changing technologies and manufacturing techniques; loss of key management and employees; increase in product and other liability claims or recalls; and changes in environmental, health and safety laws and regulations.
Should one or more of these risks or uncertainties materialize, Generac’s actual results may vary in material respects from those projected in any forward-looking statements. A detailed discussion of these and other factors that may affect future results is contained in Generac’s filings with the Securities and Exchange Commission (“SEC”), particularly in the Risk Factors section of our 2016 Annual Report on Form 10K and in its periodic reports on Form 10Q. Stockholders, potential investors and other readers should consider these factors carefully in evaluating the forward-looking statements. Any forward-looking statement made by Generac in this presentation speaks only as of the date on which it is made. Generac undertakes no obligation to update any forward-looking statement, whether as a result of new information, future developments or otherwise, except as may be required by law.
2

9:30am Registration
10:00-11:30am Prepared Remarks
11:30-12:00pm Working Lunch and Q&A
12:00-12:45pm Travel to Whitewater Facility
12:45-1:30pm Tour Whitewater Facility
1:30-2:00pm Travel to Eagle Facility
2:00-2:45pm Tour Eagle Facility
2:45-3:00pm Travel to Waukesha Headquarters
3:00-4:00pm Innovation Experience
3
Agenda

Overview &
InternationalAaron Jagdfeld, CEO
4

About Generac
2017 LTM Sales: $1.518 billion
5
Leading designer and manufacturer of a wide range of power generation equipment and other engine powered products
Variety of end markets include residential, light commercial and industrial
Global distribution network of independent dealers, distributors, retailers, wholesalers and equipment rental companies, and also sold direct to certain end users
Approx. 4,500 employees(as of 1/1/2017)
Global manufacturing, distribution, fulfillment and commercial footprint with facilities located in the U.S., Latin America, Europe and Asia.
Ten acquisitions completed since 2011, including recent strategic acquisitions of Pramac and Motortech
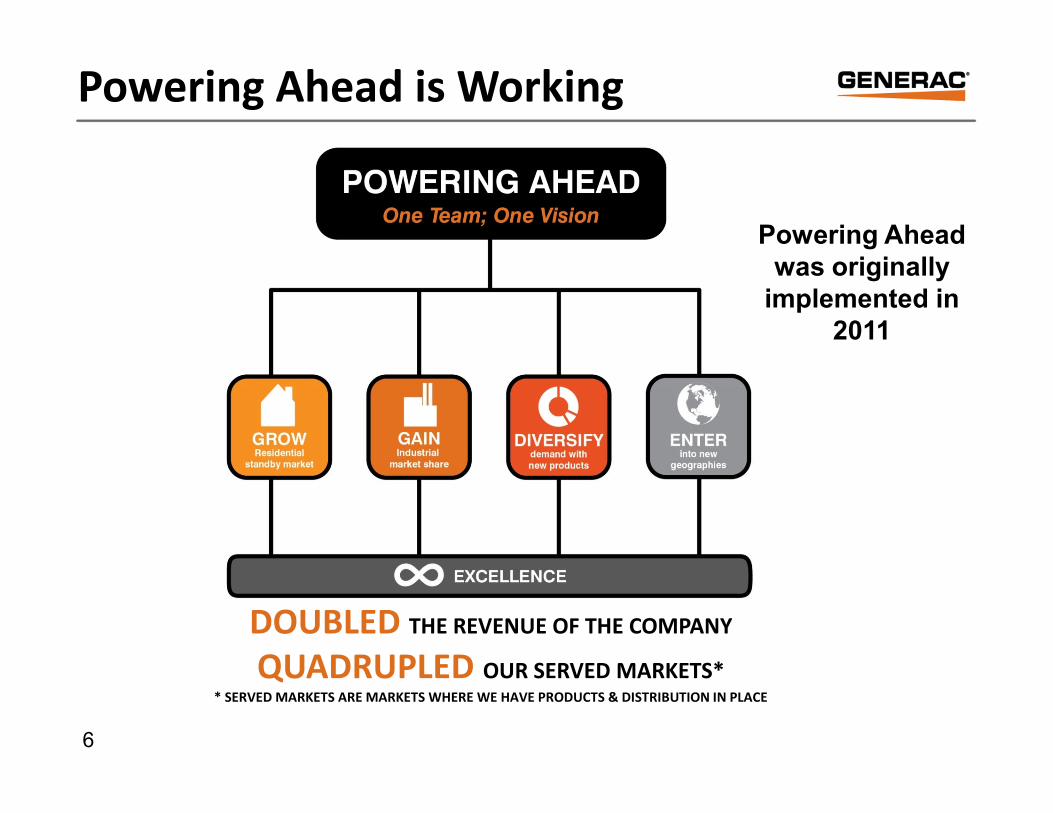
DOUBLED THE REVENUE OF THE COMPANY
QUADRUPLED OUR SERVED MARKETS** SERVED MARKETS ARE MARKETS WHERE WE HAVE PRODUCTS & DISTRIBUTION IN PLACE
Powering Ahead was originally
implemented in 2011
Powering Ahead is Working
6

7
Diversifying Products & Geography
Region
Product Platform

De-emphasize “Diversify” as a strategic pillarOutage dependent revenues now less than 45%
Addition of “Lead Gas” as a new pillarExpand on position as the world’s largest gas generator company – new products & markets
Refinement of Our Strategy
“Grow” and “Gain” remain
Still enormous opportunities in both pillars
9/7/2017 8
Modify “Enter” New Geography pillar to “Expand” – focus on established markets
Evolution of “Excellence” foundation to four specific areas of focus:
8

Refinement of Our Strategy
1% INCREASE IN PENETRATION EQUATES TO A
$2B SALES OPPORTUNITY
1% INCREASEIN MARKET SHARE EQUATES TO A
$35M SALES OPPORTUNITY
GLOBAL FOOTPRINT
TO SERVE A $13.5B MARKET OUTSIDE OF THE US &
CANADA
$5B MARKETGLOBAL GAS MARKET
OPPORTUNITY OF WHICH WE
CURRENTLY SERVE ~$2B
9

10

Lead Gas
PAST PRESENT FUTURE
North America
• Emergency StandbyNorth America
• Standby & Prime
• Demand Response
North America
• Emergency Standby
• Prime Power
• Demand Response
~$2.0B ~$3.0B ~$5.0B
Up to 200kW + MPS
60Hz only
Up to 500kW + MPS
50Hz & 60Hz
Up to 1MW + MPS
50Hz & 60Hz
ROW/International
• Standby & Prime
ROW/International
• Standby & Prime
Global
• Continuous,
Combined Heat &
Power (CHP)
Increase Served Market
Product Line Expansion
Geographic
Market Access
Technology &
Application Expertise
11

Growing Global Footprint
SingaporePramac Asia
United Arab EmiratesPramac Middle East
RomaniaPramac Generators
ChinaPramac Fu Lee Foshan
Power Equipment
RussiaPramac Russia
PolandPramac SP. ZO.O
GermanyPramac GMBH
United KingdomPramac UK
FrancePramac France
ItalyPR Industrial
ItalyGenerac Mobile Products
SpainPramac Iberica
BrazilPramac Brasil Equipamentos
Dominican RepublicPramac CaribeMexico
Generac
Wisconsin, USA Generac
Eagle
Jefferson
Oshkosh
Waukesha (HQ)
Whitewater
Generac Mobile Products
Berlin
Vermont, USACountry Home Products
Production and
commercial branch
Commercial branch
Headquarters
Generac
Pramac
BrazilGenerac
OVER 2.7M FT² OF VERTICALLY INTEGRATED MANUFACTURING CAPACITY
SERVING A GLOBALLY DIVERSE COMMERCIAL FOOTPRINT
MoroccoPramac France SAS
12
GermanyMotortech

Top Generator OEMs – 2011 Top 10 Generator OEMs - Current
Building a Global Tier 1 Generator Company
13

Latin America Rest of World
International Growth & Initiatives
• Grow Natural Gas Market
• New product line
<200kW - improved
competitiveness
• Expanded Telecom and
Data Center focus
• Grow Mexican residential
standby market
opportunity
• Continue to position for
return of large projects in
the region
• Grow Natural Gas Market
• Expand in new
geographies (AUZ)
• Expanded Telecom and
Data Center focus
• Create residential
standby market globally
• Execute consolidation of
UK operations & mobile
recovery plan
• Continue to focus on
large project
opportunities
Expected CAGR of 6-7% for 2017-202014

15
Targeting margin expansion of ≈ 150bps through 2020
Profitability Enhancement Program
Profitable
Mix
VA / VE
Continuous
Improvement
Ops Vertical
IntegrationFreight /
Logistics
Discretionary
OPEX Spend
M&A
Integration
Price /
Promo
Global
Sourcing
New Product
Introductions
Leverage SAP
Platform
• Cross-functional
• Cross-company
• Project
managed
• Resourced
• Measured
• Accountable
• Value-oriented
culture
Operational
Excellence

Residential ProductsNorth AmericaRuss Minick, EVP & CMO
16

Our “Higher Mission”:
Protecting people, property and fundamental
lifestyle amenities in an increasingly uncertain
world
17
LIGHTS
REFRIGERATION
HVAC COOKING PHONE
INTERNET/TV
WELL WATER
MEDICAL DEVICES
TOILETS
WASHING CLOTHES
SUMP PUMP GARAGE DOOR

Consumer Power Market Overview
Air-cooled
Home
Standby
Generators
Liquid-cooled
Home
Standby
Generators
Portable &
Inverter
Generators
≈$850M
Retail Consumer Power Market: ≈ $1.55B
≈$700MHome
• ~55% of the portable mkt $
• Home back-up, power during outages
• Retailers dominate
• Market: Outage Driven
Play
• ~30% of the portable mkt $
• Recreational applications: hunting, camping, tailgating
• Independent retail, specialty retail, online
• Market: Growing
Work
• ~15% of the portable mkt $
• Contractor & jobsite use
• Rental, pro retailers, catalog, online
• Market: Steady
#1
#1
#1 GENERAC
MARKET SHARE (2016 EST)
#1 GENERAC
MARKET SHARE(2016 EST)
18

• Availability: Omni channel with thousands of partners participating in category growth, easy to find
• Affordability: Research shows exponential category growth as “all-in” price declines
• Awareness: Drive category and brand awareness through highly targeted advertising approaches
• Control the Ends: Dominate search and build the dealer network (IHC, install and support)
• Fill the Funnel: Leverage AMP data and sales process for best-in-class HSB lead generation and conversion of portable owners into HSB prospects
• Expand: Grow HSB outside of NAM
19
HSB Market Creation Strategies

RESIDENTIAL DISTRIBUTION
Distribution Dominance
Largest
Authorized
Dealer network
for in-home
selling,
installation and
service.
Differentiated
distribution
through private
label
agreements.
Partnerships with
the most
recognizable
industry
ecommerce sites
and catalogs
Product
placement in the
largest DIY
Retailers.
Partnership with
the most robust
network of EW’s
focused on
customer service,
training and
inventory.
Product
placement across
the leading
regional retailers.
OVER 25,000 POINTS OF LIGHT IN NORTH AMERICA
RESIDENTIAL
DEALERS
ELECTRICAL
WHOLESALERS
NATIONAL
RETAILERS
REGIONAL
RETAILERS
PRIVATE LABEL
PARTNERS
CATALOG AND
E-COMMERCE
E-Commerce,
Catalog & D2C
Private Label
Partners
20

HOME STANDBY DEMAND
CREATION
21

Leveraging Data
Real-time
Dashboard
Content/KPIs
We have the most comprehensive data set in the industry to help identify and
target the most likely consumers.
• With ≈ 75% share of
the residential Home
Standby market, no
one can match
Generac’s scale in the
marketplace
• Daily tracking of local
power outages across
the country allows us
to quickly assess
market potential
• Ability to target
custom consumer
segmentations and
key consumer groups
• Custom capability to
merge historical sales,
recent power outages, and
key consumer
demographics to drive
local targeting efforts
HSB Heat Map Power Outage Tracking Top Psychographic
Targets
Custom Dashboards
Activations/IHC’s Outage Tracking Proprietary Segmentation Lead Generation Targeting+ + =
Generac’s “Big Data” Team
Consumer
Segmentation
Daily
Power Outage
Tracking
Industry
Scale
22

HSB Demand Creation Process
DIGITAL MKTG
INFOMERCIAL
SOCIAL MEDIA
TV & RADIO ADS
DIRECT MAIL
PRINT ADS
WEBSITE TOOLS
BUYER’S GUIDE
888-GENERAC
LEAD
GENERATIONQUALIFICATION
& SCHEDULING
TYPE OF HOME
COVERAGE OPTIONS
BUDGET
OUTAGE HISTORY
PAIN POINTS
SCHEDULING OPTIONS
(ONE OR TWO)
IN HOME
CONSULTATION
SITE WALK THROUGH
ASSESSMENT OF NEEDS
SIMULATION
FINANCING OPTIONS
GOOD, BETTER, BEST
PROPOSAL OPTIONS
CLOSED SALE
GLT FOLLOW-UP
FOLLOW-UP CALLS
FOLLOW-UP EMAILS
STORM & OUTAGE CALLS
STORM & OUTAGE EMAIL
REBATES
2ND LOOK IHC
INSTALLATION
- SITE PREP
- INSTALLATION
OPTIONS
FOR IMPROVED
EFFICIENCY
- HOMEOWNER DEBRIEF
23

Redefining the Home Standby Sales Process!
� The Comprehensive PowerPlay Sales Process:
• Drives pre-qualified leads to our dealers
• Tracks and nurtures leads from
beginning to end of the sales funnel
• Creates a platform for dealer-aided
presentation tools
• Assists with dealer development
• Provides critical metrics
• Creates demand outside of storms
• Improves category awareness
• Drives Home Standby penetration
Innovative Industry
Leading Sales Tool
Innovative Industry
Leading Sales Tool
24

1-2 new releases each year
Investment level high
25

SIGNIFICANT INVESTMENT. PROVEN PERFORMANCE.
GENERATING GROWTH.
Continuous Evolution of PowerPlay
Program Launch
Infomercial Debuted
Dedicated Team Created
Consumer
Financing
and Sales
Processes
Formalized
IHCU Launched
Significant app upgrades
Tested new lead gen methods
Developed daily detailed conversion metrics
Close rate improvement
Core algorithm launched
Launched 2nd
IHC process
IHCU 2.0
Filled in all zip codes
1st national promo
National & regional campaigns with dealer participation
Increased emphasis on digital and social
Full PowerPlay App update
$5,000 “all-in” test
2014
2012
2015
2013
2016
2017
26
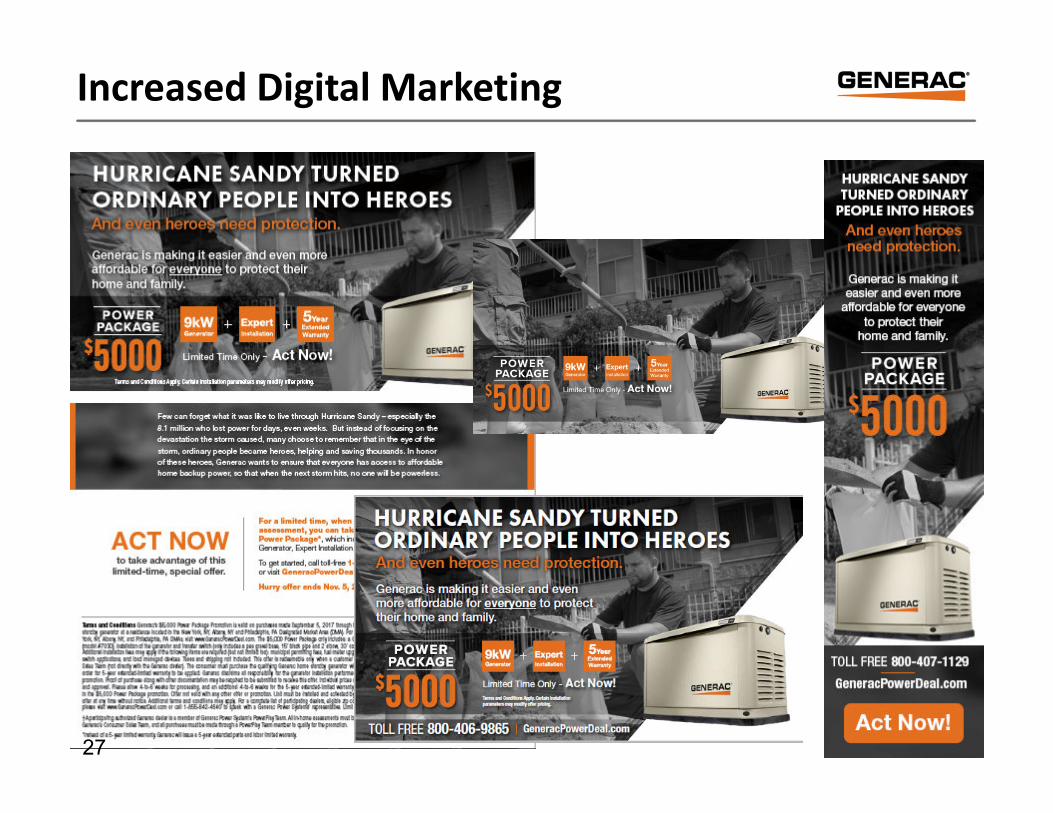
Increased Digital Marketing
27

KEY HOME STANDBY GROWTH
INITIATIVES
28

2018 HSB Growth Initiatives
Drive enhanced Affordability
Connectivity
Commercial market growth
Special channel penetration
Sales funnel optimization
Expand to global markets
Reduce installation costs via new technology, process
improvements and enhanced market forces
Enhance post sale customer relationship and drive
superior CSAT via standardizing Mobile Link
Expand Commercial product range to residential dealers
nationally
Drive meaningful growth with new Home Builders and
Utility companies via specialized products and programs
Transition to “campaigns” and incent dealers to improve
close rates
Invest and focus on target Regions with new global
product range
29

Mobile Link remote monitoring lets you access
important information such as current operating
status, maintenance schedule, historical
information, and more directly from your
smartphone, tablet, or computer. It’s easy,
affordable and best of all ensures you will
always have power.
MOBILE LINK™
30

Real-time information on Dealer’s installed generator fleet:
• Increases customer satisfaction
• Enables improved service experience and efficiency
• Adds value to preventative maintenance plans
MOBILE LINK™
31

Excellent tool to help dealers
with generator fleet
management. Making
service calls successful the
first time.
The generator always is
ready, especially when you
need it most.
Tiered business model adds
revenue and profit to the entire
value chain.
ENABLING DEALERS
OWNERSHIP EXPERIENCE REOCCURRING REVENUE
Leading the industry with
connectivity technology and
options.
MARKET LEADERSHIP
ANALYTICS
Over the air electronics
updates and ability to leverage
energy management
functionality.
TECHNOLOGY LEADERSHIP
Build Data to improve
products, retain customers and
offer additional products and
services. A gateway to the
consumer and the home.
Mobile Link will be STANDARDIZED on all units starting in Q1 ‘18!
MOBILE LINK™
32

Engine Powered Tools 33

Engine Powered Tools
Chore-Related
Outdoor
Power
Equipment:�Pressure
washers
�Water pumps
�Field & brush
mowers
�Trimmer
mowers
�Chippers &
shredders
�Log splitters
�Lawn & leaf
vacuums
�Stump grinders
Wide variety of
applications:�Premium
residential
�Larger-acreage
residential
�Light
commercial
�Pro &
contractors
�Municipal
�Farm
34
Long-Term Growth Themes
� Diversification with “chore” products: expanding line of other engine-powered products that is not dependent on power outage activity
� CHP acquisition: significantly expands power equipment platform and provides additional scale to better optimize production and supply chain
� Revenue synergies: attractive cross-selling opportunities for CHP products with current customers, plus expanded D2C capabilities for legacy residential products
� D2C marketing best practices: leverage CHP’s consumer marketing expertise to further broaden the appeal of home standby generators
(1) Source: Generac estimates; based on sales price to Generac customers
Estimated Potential Annual Market
~$3B(1)

Differentiated EPT Approach
• Use category analysis to target high-end and/or niche segments of EPT
• Leverage consumer ethnographic research to understand “Pain Points”
• Deliver products that address Pain Points with “unique selling
propositions”… USP’s
• Superior product execution:
– Better, more robust materials
– More powerful, higher quality engines
– Made in Wisconsin
– Better warranties
– Rapid response customer service
– Strong brand portfolio
• Distribute these products through:
– Independent dealer network (Hardware, outdoor power dealers, farm & ranch stores)
– Regional retailers who value being differentiated vs big box
– E-Comm and Direct to Consumer
35

Industrial ProductsNorth AmericaErik Wilde, EVP
36

NAM INDUSTRIAL STATIONARY
PRODUCTS
37

NAM Industrial Stationary Market
• Approximate market size of $3.2 billion in 2016 and
expected to grow to $3.8 billion by 2021 – 3.5% CAGR
• Diesel gensets expected to grow 2.5% over the period
• Gas gensets expected to grow 5.0% over the period
38

Industrial Stationary Products
Gas Bi Fuel Diesel
Telecom MPSModular Power System
Gemini
22kW ~ 750kW 500/600kW10kW ~ 3.25MW
10kW ~ 75kW260kW ~ 9MW 1 MW
39

NAM Industrial Channel
GES
Generac Enterprise Solutions
Telecom Other OEM
C&I
Commercial & Industrial
IDC
Industrial Distributor
GAINAlliance Dealer
• 30 Independent
• Sales
• Service
• GES Support
• Junior IDC
• Mkt. coverage
• Complimentary
• Current
Residential
Dealer
• Telecom
• Towers
• Cable
• Private
Label
• Healthcare
• Retail
• Farm to Table
40

NAM Industrial Initiatives
• Distribution Upgrades & Expansion
- Key market upgrades
- Expanded factory deployed salesforce
• Opportunity Management and Communication Tools:
- Enhanced GenConnect platform
- Deeper KPI’s to better manage distribution
• Natural Gas Product Line Extensions
- Emergency backup
- Demand response & other non-emergency applications
• Customized Telecom Solutions
- Small shadow line products
- DC output platform
41

GenConnect Dashboard
42

GenConnect Interactive Sales Process
43

GenConnect Campaign Playbook & Asset Mgmt
Asset Management
44

NAM INDUSTRIAL MOBILE
PRODUCTS
45

NAM Rental Market
• American Rental Association (ARA)
forecasts North American equipment
rental growth of 4.5% through 2021
• Continuing shift from ownership to
rental is fueling growth
• Infrastructure spending expected to
drive rental opportunities higher
• Highly fragmented industry with 80%
of market traded through Regional,
smaller independent and specialty
rental companies
• Consolidation by larger national
accounts continues - NES & NEFF most
recent examples
NAM Rental Market Projected Growth
Source: United Rentals 2Q ‘17
NAM Rental Company Share
46

Light Towers Diesel Generator Gas Generator
Flameless, Hydronic & Indirect
Heaters
Trash Pump
Water Carts
NAM Mobile Products
8.1kVA ~ 629 kVA
Prime 165kVA ~ 450 kVA
Prime
210,000 ~ 4,200,000 BTU’s
Plug in ~ 20kWLED and Metal Halide
47

NAM Mobile Channel
Independent
Dealers Contractors
National
Rental Companies
Specialty Divisions
• Multi-State
• Multi-Country
• Centralized
Purchasing
• Oil & Gas
• Site Services
• Water
• HVAC
• Industrial
Distributors
• Private Label
• Regional or
Local Rental
House
• Specialty
rental houses
(i.e. energy)
• Large scale
contractors
• Nationwide
• Multi-
National
48

NAM Mobile Products Growth
• Expanded Tier 4 Generator Line
- Line-up through 250kW completed
- Tier transition models ending - playing field leveled
• Light Tower Innovation and Leadership
- Rapid LED and technology adoption
- Improved life cycle cost to drive higher customer return on
invested capital
• Manufacturing Demand Response
- Robotics incorporated to improve speed and consistent
quality
- Optimized production flow to reduce bottlenecks and allow
for quicker response to demand changes
49

Domestic Oil & Gas Market
• Overall rig counts are recovering but still well below previous levels
• Mobile equipment inventory levels remain high but fleet utilization is
increasing as compared to last year
North America Oil Rig Count Source: Baker Hughes
North America Gas Rig Count Source: Baker Hughes
50

Positioned to Support Oil & Gas
• Extended Run Light Towers
- Reduces the need for refueling
- Maintenance intervals extended – improves overall ROI
- Dusk to Dawn start and stop
• Expanded Gas Generator Line
- New Gas Gen model launch designed to deliver unrivaled
performance on well head gas and other prime applications
• Enhanced Mobile Heater Capability
- Relocated Heat production to Berlin, WI
- Improved quality and speed to produce
51

Financial TargetsYork Ragen, CFO
52

Sales Growth Target
$0
$100
$200
$300
$400
$500
$600
$700
$800
$900
$1,000
$1,100
$1,200
$1,300
$1,400
$1,500
$1,600
$1,700
$1,800
$1,900
$2,000
'95 '97 '99 '01 '03 '05 '07 '09 '11 '13 '15 '17E '20E
Note: $ amounts in millions. Represents gross sales excluding freight revenue. Excludes “Portable Product” sales prior to the division’s divestiture in 1998. Figures include results from acquisitions completed during 2011 – 2017.
Key Assumptions:
� Baseline power outages = longer term average
� No major outages in base case
� No acquisitions included in base case
� Oil goes from ~$50/barrel in 2017 to $65/barrel in 2020
� Continued recovery and expansion in key markets
� Execution of key sales & marketing initiatives as previously outlined
53
2017E – 2020E CAGR
Base Case Target:
5-6% organic sales growth
Avg. major outage
Average major event could conservatively add ~$50M
or +1% net sales

Three-Year Sales CAGRs: 2017–2020B a s e C a s e ( 1 )
54
By Segment By Segment
3-Year Sales CAGR
Domestic
International
5-6%
6-7%
By Product ClassBy Product Class
Residential
C&I
4-5%
7-8%
(1) Excludes Major Outages and M&A activity
3-Year Sales CAGR
Key Initiatives:
� Consumer Power: Improve HSB close
rate/affordability; new products; new
home penetration; expand “Play”
segment; grow dealers
� EPT: Grow B2B; expand DR-branded
Generac products in OPE & hardware;
new products/ better OPP
� C&I Stationary: Grow nat gas market;
increase market coverage via direct sales
force and opportunity management;
telecom penetration; optimize dealers;
new products
� C&I Mobile: Execute oil & gas rental
capex recovery; new products; grow
independents channel; improve heater
penetration
� International: Grow nat gas markets
(Resi and C&I); telecom/datacom
market opportunity; new products;
expand geographies (Australia, China,
Russia); focused efforts on large projects
as a tier 1 supplier

55
2017 Guidance vs. 2020 Targets
Financial Metric 2017 Guidance(1)
Net Sales
Adj EBITDA Margin(2)
Cash Taxes(3)
Capital Spending
$1.55 billion
~18.5%
~14.0%
~2.0% of sales
Free Cash Flow > 90% Adj Net Income
2020 Targets
~$1.85 billion
~21.0%
~20.0%
2.0 – 2.5% of sales
> 90% Adj Net Income
(1) Assumes midpoint of guidance range given for sales growth as reported on August 2, 2017.(2) Calculated using adjusted EBITDA before deducting for non-controlling interest.(3) Annual tax shield of $50 million remains in place through 2020, with $41 million for stub period in 2021.
Average Major Outage Adds ~$50 Million Net Sales @ ~40% Incremental Margin
“Base Case”

~8% ~12%
2017E 2020E
56
Corporate-wide focus on margin improvement to accelerate profitability from cycle lows
Adjusted EBITDA Margin Bridge2017 to 2020
Domestic Segment International Segment
~22% ~24%
2017E 2020E
Consolidated
• Price to offset inflationary cost pressures
• PEP Program to drive +150 bps margin
improvement by 2020
• Expect +100 bps operating leverage on 5-6%
organic growth
• Unfavorable Mix given higher mobile &
international growth
Synergies drive doubling of
margin since 2016
Average major event could add ~50 bps impact to margin

Historical Free Cash Flow - 2014 thru 2016
57Significant Free Cash Flow leads to attractive capital deployment
Diversified
Platform
Attractive
EBITDA
Margins
Low Cost
Debt;
Refinanced
in May 2017
(Ba3/BB-)
Annual
Tax Shield
Asset-lite
Model
Strong
cumulative
FCF
$1.4B sales / year
20+% L+225$49
million
Cap Ex ~2.3% of sales
~$600mm
~95% conversion of Adjusted Net Income
&
9% Best-in-class Free Cash Flow Yield

Historical Uses of Capital – 2014 thru 2016
58
~$750mm of
special
dividends in
2012 & 2013
Average
price paid =
$34.57 per
share
Powermate NA;
MAC;
Country Home;
Pramac;
Motortech
R&D and
capacity
expansion;
global ERP
systems
$(1.05) Billion $(986) million
2014 - 2016
Operating
Cash Flow
$(96)mm
Cap Ex $(212)mm
+$695mm M&A $(287)mm
$(39)mm
Share Assumed12/31/2013 Repurchases* M&A Debt 12/31/2016
Net Debt & Other Net Debt
= 2.6x Leverage = 3.5x Leverage
* Includes taxes paid related to net
share settlement of equity awards

Priority Uses of Capital:
59 Disciplined capital deployment creates value for shareholders
Projected Capital Deployment Priorities
Organic growth
• Invest in technology, innovation, and R&D capabilities
• Capacity expansion; Global systems; High ROI automation
Pay down debt
• Target 2-3x leverage
• Excess cash flow sweep in term loan; Matures 2023; No covenants
• $500mm notional swapped fixed
M&A
• Demonstrated ability to execute; 10 deals since 2011
• Accelerates “Powering Ahead” strategic plan
• Seek high synergy opportunities with above WACC returns
Return of Capital
• As future cash flow permits, will evaluate options opportunistically
• $170mm remaining on current share repurchase authorization
= Asset Lite
= Deleveraging story
= Evaluate the funnel
= Opportunistic

60
Investment Highlights
� Long-term organic sales growth of 5-6% (without events)
� “Powering Ahead” strategy targeted to capitalize on numerous secular growth opportunities
� PEP program targeted to improve margins by ~150bp
� Leading technology and innovation in the marketplace
� Building a global Tier 1 power equipment company
� Free cash flow over $800 million expected from 2017-2020
� Market leader with significant barriers to entry
� Flexible operating model to execute on next step-function increase in demand
Leading “Industrial Technology” Company

Q&A