2017 job market & employment survey - cdha · pdf file2017 job market and employment...
TRANSCRIPT

2017 JOB MARKET & EMPLOYMENT SURVEY EXECUTIVE SUMMARY

2
EXECUTIVE SUMMARYPay & Employment Rates
The Canadian Dental Hygienists Association (CDHA) retained Framework Partners Inc. to conduct the 2017 Job Market and Employment Survey to obtain key labour force information about the profession from dental hygienists across Canada. The response to the survey was very strong. Framework Partners received 6,315 completed questionnaires through a secure website that was promoted via email to CDHA members. The survey ran from May 15 until June 19, 2017; analysis and reporting were completed in August 2017.
Pay & Employment Rates
Pay• The average hourly rate for respondents’ first job setting is
$41.69, which is an increase over the average hourly rate in 2015 ($41.36) and in 2013 ($40.18).2
• The average hourly rate for second ($42.56) and third jobs ($41.97) is slightly higher than first job settings.
• Respondents with less than one year of experience earn $35.08 per hour on average compared with $44.05 per hour on average earned by those with more than five years of experience.
• Consistent with previous years, Alberta has the highest hourly rate at $53.99 and New Brunswick has the lowest hourly rate at $32.31.
Hours of Work• Satisfaction with the number of hours of work per week is
increasing. 71% of respondents are satisfied with the number of hours per week they are working in dental hygiene, which is higher than in 2015 (65%).
• Saskatchewan (82%) and New Brunswick (80%) have the highest percentage of respondents who are satisfied with the number of hours they work.
• 17% of respondents would prefer to be working more hours each week in dental hygiene.
• 48% of respondents work 30 hours or less per week; 47% of respondents work 31–40 hours per week; the remainder work 41–60+ hours per week. The median for all respondents is 30 hours per week.
Employment Rate• The unemployment rate among respondents is 1.3%, which is
well below the current Canadian unemployment rate of 6.5% (as of June 2017).3
2013
2015
2017
$40.18$41.36$41.69
∆ Average hourly rates: 2013–2017
48%30 hours/week or less
47%31–40 hours/week
5%41–60 hours /
week
0
10
20
30
40
50
Less than 1 year ($35.08)More than 5 years ($44.05)
∆ Hourly rates by years of experience
The change in hourly pay rate from 2013 to 2017 represents a 0.93% annual compound increase. This increase is slightly behind the average annual rate of inflation from 2013 to 2017 (1.45%), as reported by the Bank of Canada.1
1http://www.bankofcanada.ca/rates/related/inflation-calculator/2Respondents were able to list their workplaces and employment conditions for up to three jobs. The highest number of respondents reported on only a single job.3http://www.statcan.gc.ca/tables-tableaux/sum-som/l01/cst01/lfss01a-eng.htm

3
EXECUTIVE SUMMARYWorkplace & Environment
• 72% of respondents work for a single employer, consistent with 2015 (74%) and 2013 (75%).
• The number of respondents with written contracts has increased slightly from 40% in 2015 to 44% in 2017, although the majority of respondents still work without a written contract.
• 39% of respondents report that their employer undertakes an annual performance review, which is consistent with the 2015 and 2013 levels (38% and 34%, respectively).
• The majority of respondents who collaborate with another professional do so with dentists (82%), followed by denturists (28%) and physicians (26%).
• The majority of respondents working in specialty practice state that they work in orthodontic (34%) and periodontic (37%) practices.
• In their primary place of employment, respondents are most satisfied with infection control practices (86%), colleagues and staff (80%) and location (78%).
Workplace & EnvironmentProfessional Setting
• 92% of respondents work in a clinical private practice setting, followed by public health (3%) and education (2%).
CONTRACT2015
40%CONTRACT
2017
44%
3%work in public
health
2%work in
education
92%work in a
clinical private practice
67%neck area
65%shoulders
49%lower back
Work-related pain0 20 40 60 80 100
dentists (82%) denturists (28%) physicians (26%)
∆ Interprofessional collaboration
∆ Dental hygiene work settings
86%satisfied with
infection control
80%satisfied with
colleagues and staff
78%satisfied with
location
∆ Rates of satisfaction in the workplace
• The most frequently reported work-related pain is in the neck area (67%), followed by shoulders (65%) and the lower back (49%).
• Dental hygienists report feeling most valued by their clients (91%), an increase of 2% since 2015 (89%). While only 61% of dental hygienists report feeling valued by their employers, this percentage has also increased since 2015 (58%).
4
EXECUTIVE SUMMARYWorkplace & Environment
Professional Setting (cont’d)• The most frequently reported work-related medical issue is
back/neck injuries (42% each); 75% of these cases have affected the respondents’ ability to work in dental hygiene.
• 59% of respondents (excluding independent practitioners) say they are consulted when ordering supplies and equipment for dental hygiene services.
• 92% of respondents agree they have decision-making authority over implementing dental hygiene services.
• Respondents report having the least decision-making authority over making referrals to other health professionals (66%).
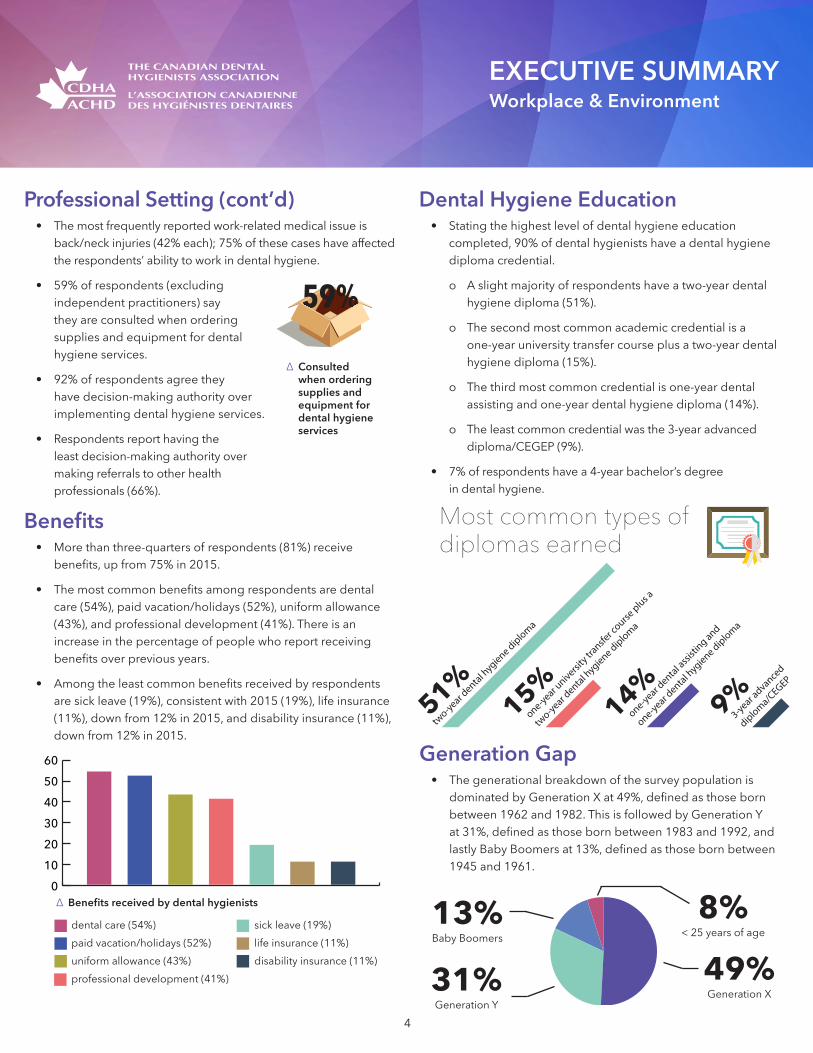
Benefits• More than three-quarters of respondents (81%) receive
benefits, up from 75% in 2015.
• The most common benefits among respondents are dental care (54%), paid vacation/holidays (52%), uniform allowance (43%), and professional development (41%). There is an increase in the percentage of people who report receiving benefits over previous years.
• Among the least common benefits received by respondents are sick leave (19%), consistent with 2015 (19%), life insurance (11%), down from 12% in 2015, and disability insurance (11%), down from 12% in 2015.
Dental Hygiene Education• Stating the highest level of dental hygiene education
completed, 90% of dental hygienists have a dental hygiene diploma credential.
о A slight majority of respondents have a two-year dental hygiene diploma (51%).
о The second most common academic credential is a one-year university transfer course plus a two-year dental hygiene diploma (15%).
о The third most common credential is one-year dental assisting and one-year dental hygiene diploma (14%).
о The least common credential was the 3-year advanced diploma/CEGEP (9%).
• 7% of respondents have a 4-year bachelor’s degree in dental hygiene.
49%Generation X
13%Baby Boomers
31%Generation Y
0
10
20
30
40
50
60
dental care (54%)paid vacation/holidays (52%)uniform allowance (43%)professional development (41%)
sick leave (19%)life insurance (11%)disability insurance (11%)
∆ Benefits received by dental hygienists
51%15%
14%9%
two-year d
ental hygiene diploma
one-year universi
ty transfe
r course
plus a
two-year d
ental hygiene diploma
one-year dental a
ssisti
ng and
one-year dental h
ygiene diploma
3-year advance
d
diploma/CEGEP
51%15%
14%9%
two-year d
ental hygiene diploma
one-year universi
ty transfe
r course
plus a
two-year d
ental hygiene diploma
one-year dental a
ssisti
ng and
one-year dental h
ygiene diploma
3-year advance
d
diploma/CEGEP
Most common types of diplomas earned
∆ Consulted when ordering supplies and equipment for dental hygiene services
Generation Gap• The generational breakdown of the survey population is
dominated by Generation X at 49%, defined as those born between 1962 and 1982. This is followed by Generation Y at 31%, defined as those born between 1983 and 1992, and lastly Baby Boomers at 13%, defined as those born between 1945 and 1961.
8%< 25 years of age
5
EXECUTIVE SUMMARYWorkplace & Environment Independent Practice Owners
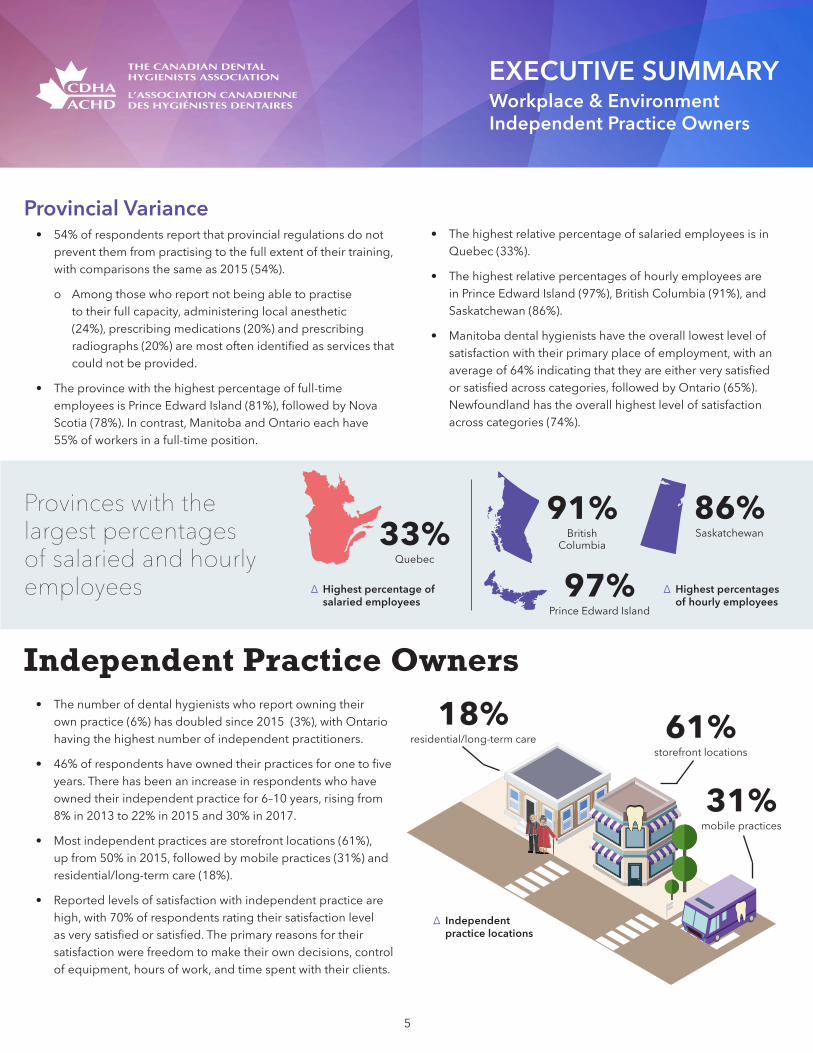
• The highest relative percentage of salaried employees is in Quebec (33%).
• The highest relative percentages of hourly employees are in Prince Edward Island (97%), British Columbia (91%), and Saskatchewan (86%).
• Manitoba dental hygienists have the overall lowest level of satisfaction with their primary place of employment, with an average of 64% indicating that they are either very satisfied or satisfied across categories, followed by Ontario (65%). Newfoundland has the overall highest level of satisfaction across categories (74%).
Provincial Variance• 54% of respondents report that provincial regulations do not
prevent them from practising to the full extent of their training, with comparisons the same as 2015 (54%).
о Among those who report not being able to practise to their full capacity, administering local anesthetic (24%), prescribing medications (20%) and prescribing radiographs (20%) are most often identified as services that could not be provided.
• The province with the highest percentage of full-time employees is Prince Edward Island (81%), followed by Nova Scotia (78%). In contrast, Manitoba and Ontario each have 55% of workers in a full-time position.
Independent Practice Owners• The number of dental hygienists who report owning their
own practice (6%) has doubled since 2015 (3%), with Ontario having the highest number of independent practitioners.
• 46% of respondents have owned their practices for one to five years. There has been an increase in respondents who have owned their independent practice for 6–10 years, rising from 8% in 2013 to 22% in 2015 and 30% in 2017.
• Most independent practices are storefront locations (61%), up from 50% in 2015, followed by mobile practices (31%) and residential/long-term care (18%).
• Reported levels of satisfaction with independent practice are high, with 70% of respondents rating their satisfaction level as very satisfied or satisfied. The primary reasons for their satisfaction were freedom to make their own decisions, control of equipment, hours of work, and time spent with their clients.
18%residential/long-term care
31%mobile practices
61%storefront locations
∆ Independent practice locations
33%Quebec
97%Prince Edward Island
91%British
Columbia
86%Saskatchewan
∆ Highest percentages of hourly employees
∆ Highest percentage of salaried employees
Provinces with the largest percentages of salaried and hourly employees
6
EXECUTIVE SUMMARYThe Future
The Future
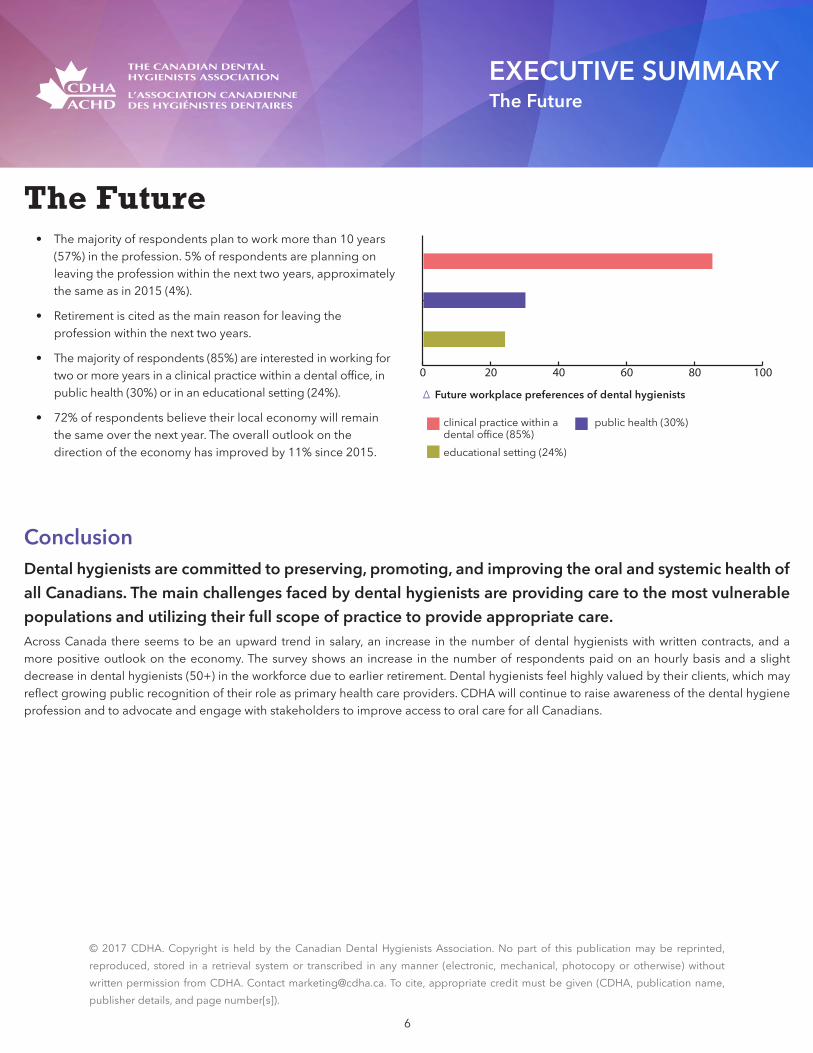
∆ Future workplace preferences of dental hygienists
0 20 40 60 80 100
clinical practice within a dental office (85%)educational setting (24%)
public health (30%)
ConclusionDental hygienists are committed to preserving, promoting, and improving the oral and systemic health of all Canadians. The main challenges faced by dental hygienists are providing care to the most vulnerable populations and utilizing their full scope of practice to provide appropriate care. Across Canada there seems to be an upward trend in salary, an increase in the number of dental hygienists with written contracts, and a more positive outlook on the economy. The survey shows an increase in the number of respondents paid on an hourly basis and a slight decrease in dental hygienists (50+) in the workforce due to earlier retirement. Dental hygienists feel highly valued by their clients, which may reflect growing public recognition of their role as primary health care providers. CDHA will continue to raise awareness of the dental hygiene profession and to advocate and engage with stakeholders to improve access to oral care for all Canadians.
© 2017 CDHA. Copyright is held by the Canadian Dental Hygienists Association. No part of this publication may be reprinted, reproduced, stored in a retrieval system or transcribed in any manner (electronic, mechanical, photocopy or otherwise) without written permission from CDHA. Contact [email protected]. To cite, appropriate credit must be given (CDHA, publication name, publisher details, and page number[s]).
• The majority of respondents plan to work more than 10 years (57%) in the profession. 5% of respondents are planning on leaving the profession within the next two years, approximately the same as in 2015 (4%).
• Retirement is cited as the main reason for leaving the profession within the next two years.
• The majority of respondents (85%) are interested in working for two or more years in a clinical practice within a dental office, in public health (30%) or in an educational setting (24%).
• 72% of respondents believe their local economy will remain the same over the next year. The overall outlook on the direction of the economy has improved by 11% since 2015.