2017 kentucky fact book - the jockey · pdf filekentucky fact book - table of contents...
TRANSCRIPT

2018
KENTUCKY
FACT BOOK
A statistical guide to the Thoroughbred industry
in Kentucky
Prepared by The Jockey Club

Preface This report has been compiled as an industry service by The Jockey Club with the intent of shedding some statistical light on theThoroughbred industry in KENTUCKY and, in particular, trends that have evolved over the past two decades. It contains sectionson breeding, racing and auction sales. Statistics within the breeding section and those pertaining to racing performance byfoaling year are updated on a regular basis. Statistics contained herein are provided courtesy of The Jockey Club, The JockeyClub Information Systems Inc. and Equibase Company LLC. Information pertaining to stallions, mares bred and foal crops aremaintained in The Jockey Club's pedigree database and reflect information submitted to the Registry by owners and breedersthroughout North America as of the date listed on the page. Information pertaining to races, purses, starters, starts and field sizeare maintained in the Equibase Company database as collected and reported by chartcallers at tracks throughout North America.Information pertaining to the number of weanlings, yearlings and 2-year-olds sold at auction, gross sales, average price andmedian price are maintained in the equineline.com database of The Jockey Club Information Systems. Since 2005, Canadianpurses have been converted to their equivalent amount in U.S. funds.
Many other statistics about the Thoroughbred industry can be found in The Jockey Club's Online Fact Book(jockeyclub.com/factbook.asp). The Jockey Club is dedicated to the improvement of Thoroughbred breeding and racing andserves as the breed registry for North American Thoroughbreds.
Page 2

Kentucky Fact Book - Table of Contents Breeding Section Annual Mares Bred to Kentucky Stallions 4Annual Kentucky Registered Foal Crop 5Foaling Area of Kentucky-Sired Registered Foals 6Conception Area of Kentucky-Bred Registered Foals 7
Racing Section Kentucky Racing Overview 8Kentucky-Bred Racing Statistics by Racing Year 9Kentucky-Bred Racing Statistics by Foaling Year 10Kentucky-Bred Starters and Starts: In-State/Out-of-State 11 Percentage of Kentucky-Bred Earnings by Racing Area 12
Sales Section Auction Results for Kentucky-Bred Weanlings 13 Auction Results for Kentucky-Bred Yearlings 14 Auction Results for Kentucky-Bred 2-Year-Olds 15 Bred (Area Foaled): The term "bred" is sometimes used to describe the location where a foal was born,e.g., Kentucky bred (born in Kentucky) or New York bred (born in New York).
Copyright © 2018 The Jockey Club. All rights reserved.
No part of this publication may be reproduced, stored in a retrieval system, or transmitted in any form or bymeans electronic, mechanical, photographic, magnetic or otherwise, without prior written permission ofthe publisher.
Data provided or compiled by The Jockey Club generally are accurate, but occasionally errors occur as aresult of incorrect data received from others, mistakes in processing, and other causes. Therefore, TheJockey Club makes no representations or warranties, expressed or implied, including those ofmerchantability, accuracy, timeliness or fitness for a particular purpose as to any matter whatsoever,including, but not limited to, the accuracy of any information, product, program or service furnishedhereunder. By using the information, product, program or service furnished hereunder, you accept theinformation, product, program or service "AS IS." Your use of the information, product, program or serviceCONTAINED HEREIN is at your own risk and you assume full responsibility and risk of loss resulting fromuse thereof. THE JOCKEY CLUB SHALL NOT HAVE ANY RESPONSIBILITY OR LIABILITY ARISINGFROM THE USE OF THE INFORMATION, PRODUCTS, PROGRAMS OR SERVICES FURNISHEDHEREUNDER.
Page 3
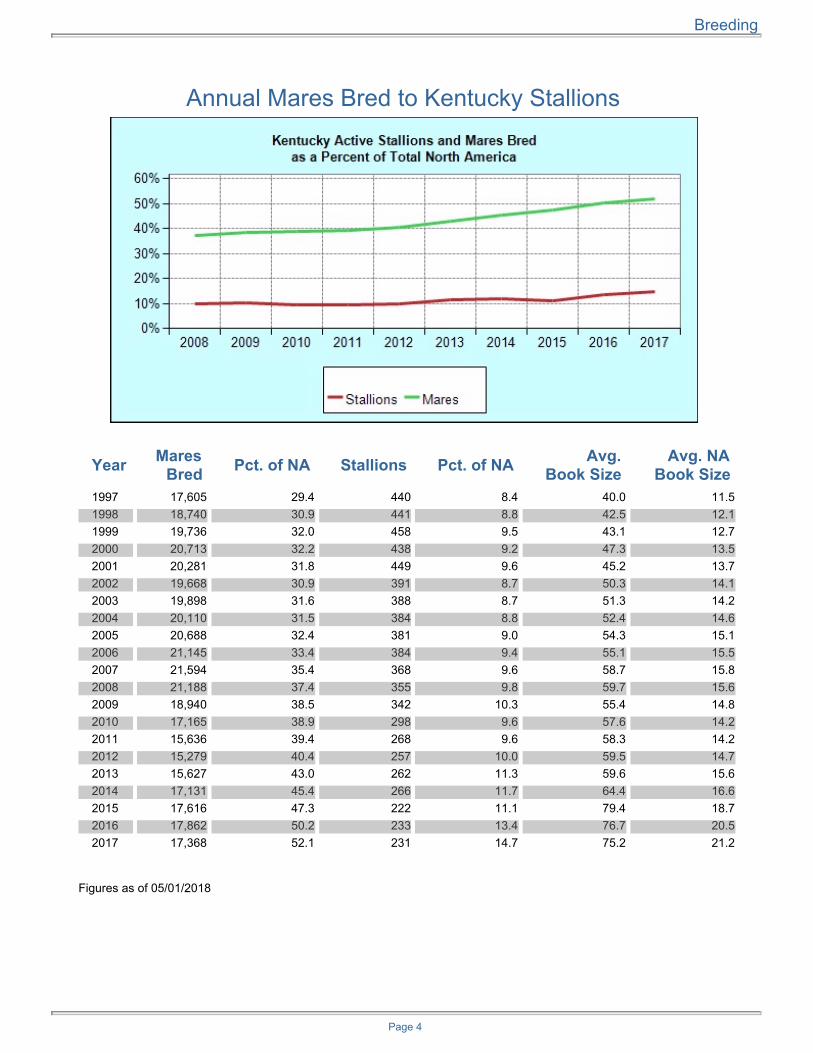
Annual Mares Bred to Kentucky Stallions
Year Mares Bred Pct. of NA Stallions Pct. of NA Avg.
Book Size Avg. NA
Book Size 1997 17,605 29.4 440 8.4 40.0 11.51998 18,740 30.9 441 8.8 42.5 12.11999 19,736 32.0 458 9.5 43.1 12.72000 20,713 32.2 438 9.2 47.3 13.52001 20,281 31.8 449 9.6 45.2 13.72002 19,668 30.9 391 8.7 50.3 14.12003 19,898 31.6 388 8.7 51.3 14.22004 20,110 31.5 384 8.8 52.4 14.62005 20,688 32.4 381 9.0 54.3 15.12006 21,145 33.4 384 9.4 55.1 15.52007 21,594 35.4 368 9.6 58.7 15.82008 21,188 37.4 355 9.8 59.7 15.62009 18,940 38.5 342 10.3 55.4 14.82010 17,165 38.9 298 9.6 57.6 14.22011 15,636 39.4 268 9.6 58.3 14.22012 15,279 40.4 257 10.0 59.5 14.72013 15,627 43.0 262 11.3 59.6 15.62014 17,131 45.4 266 11.7 64.4 16.62015 17,616 47.3 222 11.1 79.4 18.72016 17,862 50.2 233 13.4 76.7 20.52017 17,368 52.1 231 14.7 75.2 21.2
Figures as of 05/01/2018
Page 4
Breeding
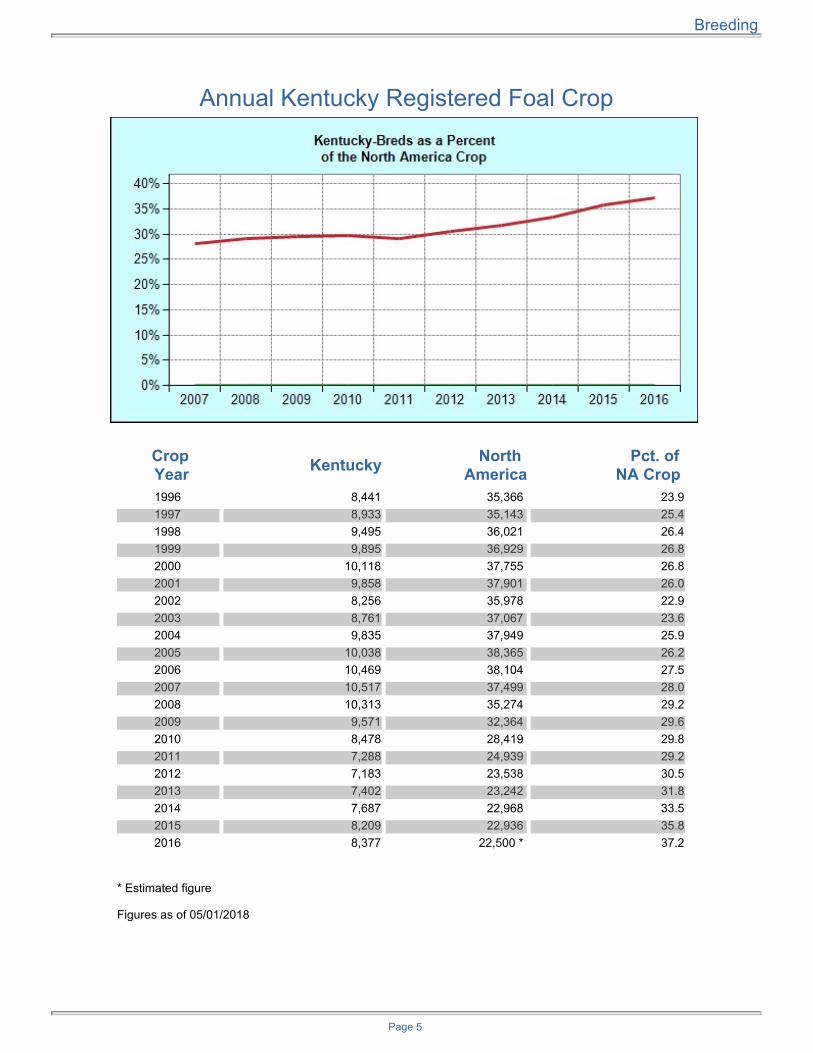
Annual Kentucky Registered Foal Crop
Crop Year Kentucky North
AmericaPct. of
NA Crop 1996 8,441 35,366 23.91997 8,933 35,143 25.41998 9,495 36,021 26.41999 9,895 36,929 26.82000 10,118 37,755 26.82001 9,858 37,901 26.02002 8,256 35,978 22.92003 8,761 37,067 23.62004 9,835 37,949 25.92005 10,038 38,365 26.22006 10,469 38,104 27.52007 10,517 37,499 28.02008 10,313 35,274 29.22009 9,571 32,364 29.62010 8,478 28,419 29.82011 7,288 24,939 29.22012 7,183 23,538 30.52013 7,402 23,242 31.82014 7,687 22,968 33.52015 8,209 22,936 35.82016 8,377 22,500 * 37.2
* Estimated figure
Figures as of 05/01/2018
Page 5
Breeding
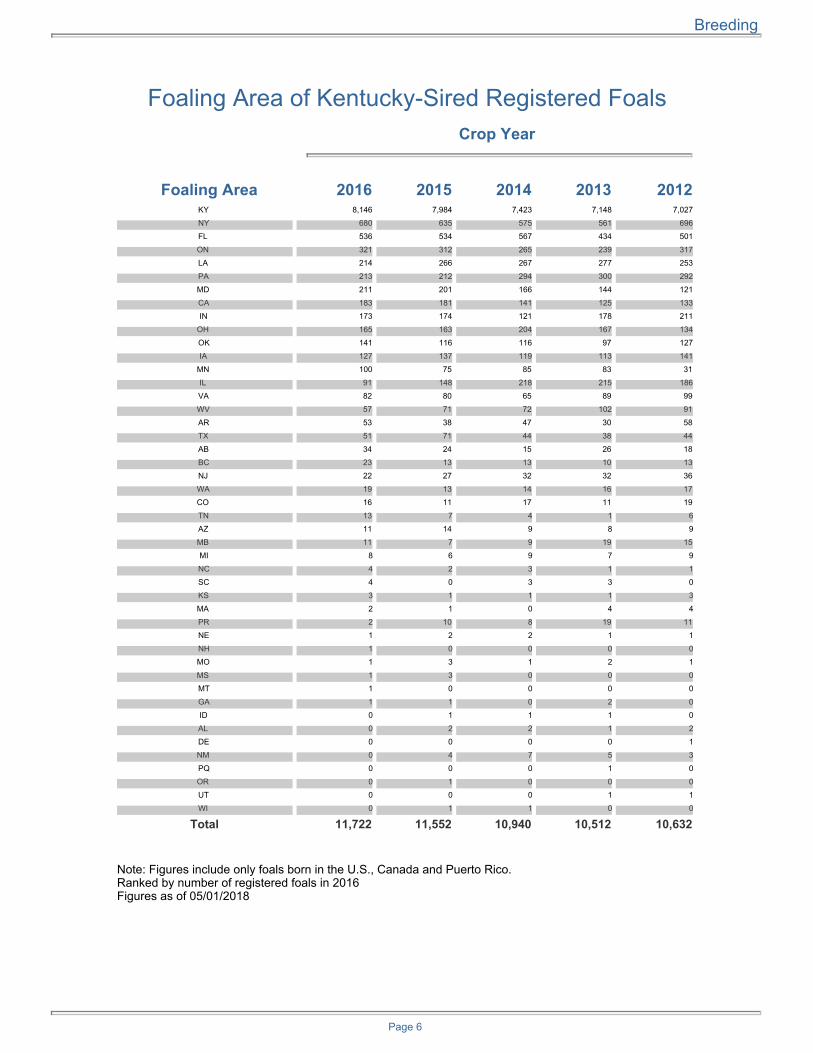
Foaling Area of Kentucky-Sired Registered Foals
Crop Year
Foaling Area 2016 2015 2014 2013 2012KY 8,146 7,984 7,423 7,148 7,027
NY 680 635 575 561 696
FL 536 534 567 434 501
ON 321 312 265 239 317
LA 214 266 267 277 253
PA 213 212 294 300 292
MD 211 201 166 144 121
CA 183 181 141 125 133
IN 173 174 121 178 211
OH 165 163 204 167 134
OK 141 116 116 97 127
IA 127 137 119 113 141
MN 100 75 85 83 31
IL 91 148 218 215 186
VA 82 80 65 89 99
WV 57 71 72 102 91
AR 53 38 47 30 58
TX 51 71 44 38 44
AB 34 24 15 26 18
BC 23 13 13 10 13
NJ 22 27 32 32 36
WA 19 13 14 16 17
CO 16 11 17 11 19
TN 13 7 4 1 6
AZ 11 14 9 8 9
MB 11 7 9 19 15
MI 8 6 9 7 9
NC 4 2 3 1 1
SC 4 0 3 3 0
KS 3 1 1 1 3
MA 2 1 0 4 4
PR 2 10 8 19 11
NE 1 2 2 1 1
NH 1 0 0 0 0
MO 1 3 1 2 1
MS 1 3 0 0 0
MT 1 0 0 0 0
GA 1 1 0 2 0
ID 0 1 1 1 0
AL 0 2 2 1 2
DE 0 0 0 0 1
NM 0 4 7 5 3
PQ 0 0 0 1 0
OR 0 1 0 0 0
UT 0 0 0 1 1
WI 0 1 1 0 0
Total 11,722 11,552 10,940 10,512 10,632
Note: Figures include only foals born in the U.S., Canada and Puerto Rico.Ranked by number of registered foals in 2016 Figures as of 05/01/2018
Page 6
Breeding
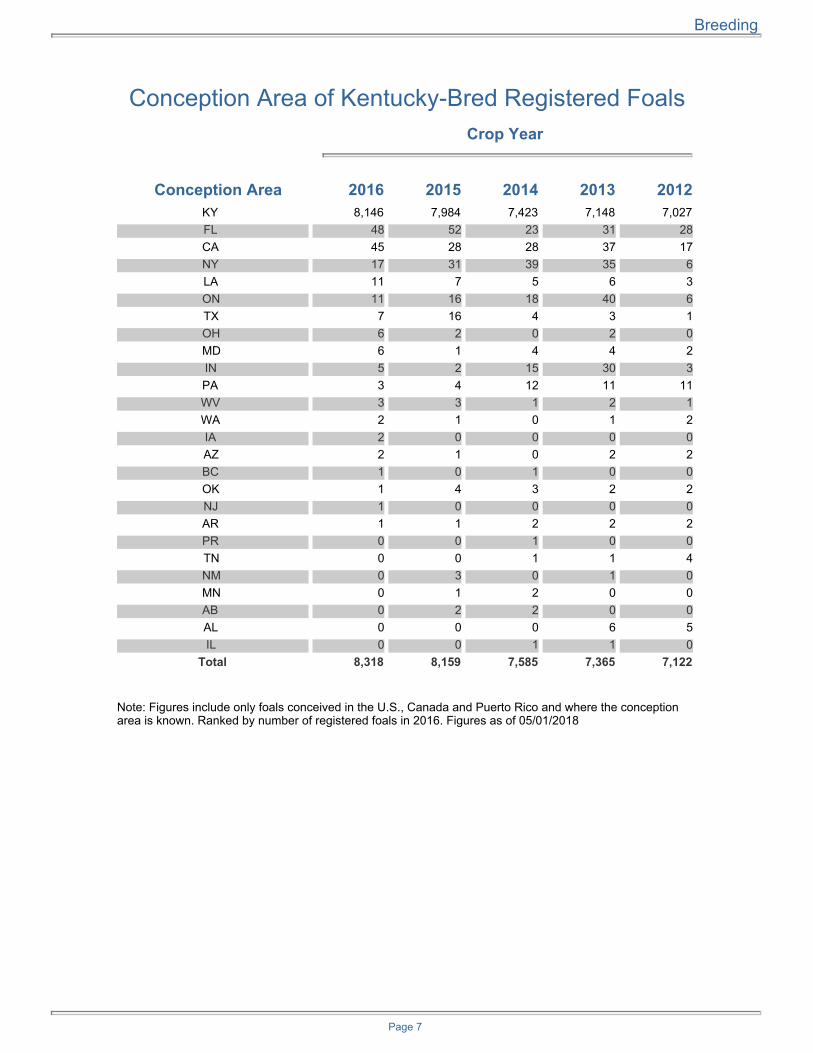
Conception Area of Kentucky-Bred Registered Foals
Crop Year
Conception Area 2016 2015 2014 2013 2012KY 8,146 7,984 7,423 7,148 7,027FL 48 52 23 31 28CA 45 28 28 37 17NY 17 31 39 35 6LA 11 7 5 6 3ON 11 16 18 40 6TX 7 16 4 3 1OH 6 2 0 2 0MD 6 1 4 4 2IN 5 2 15 30 3PA 3 4 12 11 11WV 3 3 1 2 1WA 2 1 0 1 2IA 2 0 0 0 0AZ 2 1 0 2 2BC 1 0 1 0 0OK 1 4 3 2 2NJ 1 0 0 0 0AR 1 1 2 2 2PR 0 0 1 0 0TN 0 0 1 1 4NM 0 3 0 1 0MN 0 1 2 0 0AB 0 2 2 0 0AL 0 0 0 6 5IL 0 0 1 1 0
Total 8,318 8,159 7,585 7,365 7,122
Note: Figures include only foals conceived in the U.S., Canada and Puerto Rico and where the conceptionarea is known. Ranked by number of registered foals in 2016. Figures as of 05/01/2018
Page 7
Breeding
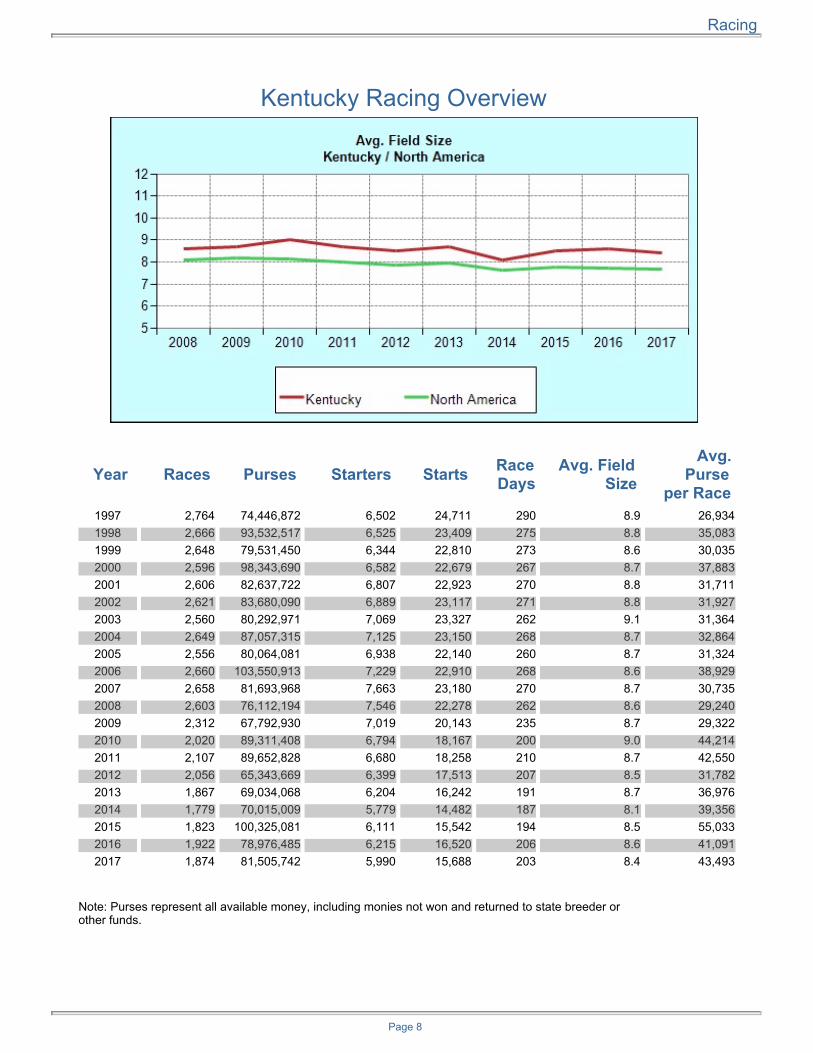
Kentucky Racing Overview
Year Races Purses Starters Starts RaceDays
Avg. Field Size
Avg.Purse
per Race 1997 2,764 74,446,872 6,502 24,711 290 8.9 26,9341998 2,666 93,532,517 6,525 23,409 275 8.8 35,0831999 2,648 79,531,450 6,344 22,810 273 8.6 30,0352000 2,596 98,343,690 6,582 22,679 267 8.7 37,8832001 2,606 82,637,722 6,807 22,923 270 8.8 31,7112002 2,621 83,680,090 6,889 23,117 271 8.8 31,9272003 2,560 80,292,971 7,069 23,327 262 9.1 31,3642004 2,649 87,057,315 7,125 23,150 268 8.7 32,8642005 2,556 80,064,081 6,938 22,140 260 8.7 31,3242006 2,660 103,550,913 7,229 22,910 268 8.6 38,9292007 2,658 81,693,968 7,663 23,180 270 8.7 30,7352008 2,603 76,112,194 7,546 22,278 262 8.6 29,2402009 2,312 67,792,930 7,019 20,143 235 8.7 29,3222010 2,020 89,311,408 6,794 18,167 200 9.0 44,2142011 2,107 89,652,828 6,680 18,258 210 8.7 42,5502012 2,056 65,343,669 6,399 17,513 207 8.5 31,7822013 1,867 69,034,068 6,204 16,242 191 8.7 36,9762014 1,779 70,015,009 5,779 14,482 187 8.1 39,3562015 1,823 100,325,081 6,111 15,542 194 8.5 55,0332016 1,922 78,976,485 6,215 16,520 206 8.6 41,0912017 1,874 81,505,742 5,990 15,688 203 8.4 43,493
Note: Purses represent all available money, including monies not won and returned to state breeder orother funds.
Page 8
Racing
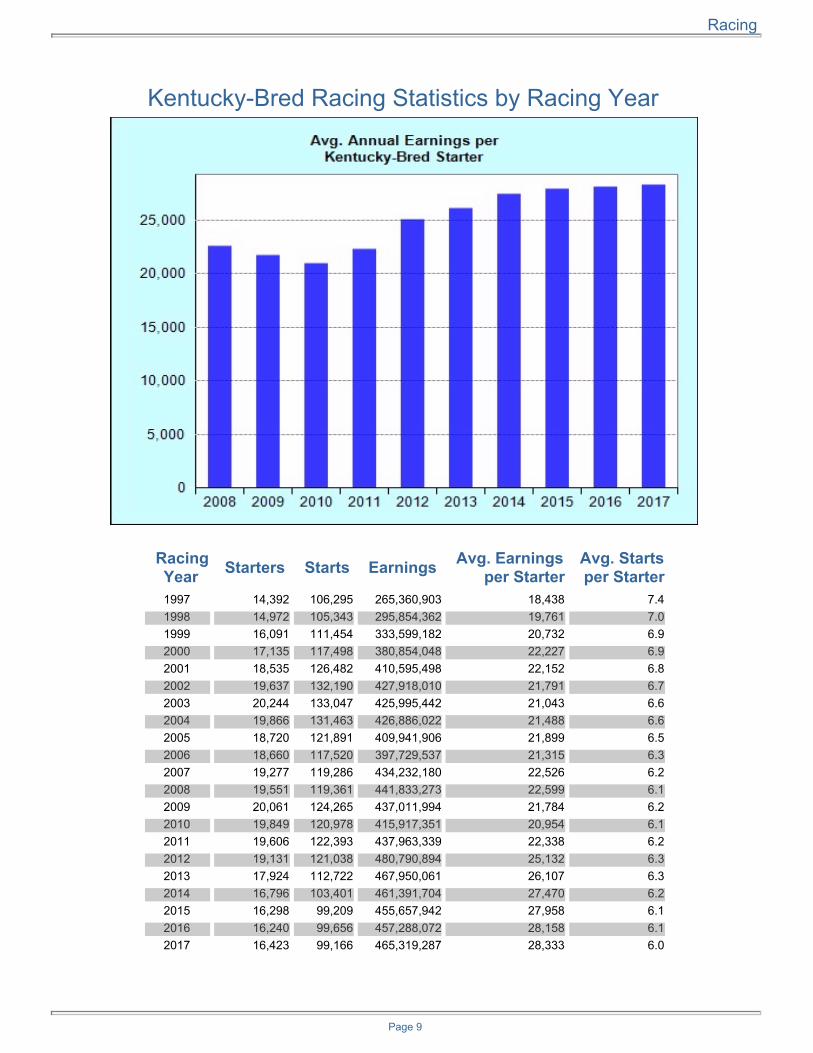
Kentucky-Bred Racing Statistics by Racing Year
RacingYear Starters Starts Earnings Avg. Earnings
per StarterAvg. Startsper Starter
1997 14,392 106,295 265,360,903 18,438 7.41998 14,972 105,343 295,854,362 19,761 7.01999 16,091 111,454 333,599,182 20,732 6.92000 17,135 117,498 380,854,048 22,227 6.92001 18,535 126,482 410,595,498 22,152 6.82002 19,637 132,190 427,918,010 21,791 6.72003 20,244 133,047 425,995,442 21,043 6.62004 19,866 131,463 426,886,022 21,488 6.62005 18,720 121,891 409,941,906 21,899 6.52006 18,660 117,520 397,729,537 21,315 6.32007 19,277 119,286 434,232,180 22,526 6.22008 19,551 119,361 441,833,273 22,599 6.12009 20,061 124,265 437,011,994 21,784 6.22010 19,849 120,978 415,917,351 20,954 6.12011 19,606 122,393 437,963,339 22,338 6.22012 19,131 121,038 480,790,894 25,132 6.32013 17,924 112,722 467,950,061 26,107 6.32014 16,796 103,401 461,391,704 27,470 6.22015 16,298 99,209 455,657,942 27,958 6.12016 16,240 99,656 457,288,072 28,158 6.12017 16,423 99,166 465,319,287 28,333 6.0
Page 9
Racing

Kentucky-Bred Racing Statistics by Foaling Year
Foaling Year
Reg.Foals Starters Lifetime
StartsLifetime
EarningsAvg. Earnings
per Starter Avg. Startsper Starter
1996 8,441 5,753 120,264 362,864,696 63,074 20.91997 8,933 6,111 132,001 415,458,386 67,985 21.61998 9,495 6,551 134,107 457,484,489 69,834 20.51999 9,895 6,843 132,754 418,824,125 61,205 19.42000 10,118 6,995 132,958 425,201,846 60,787 19.02001 9,858 6,897 133,181 440,024,529 63,799 19.32002 8,256 5,553 100,302 346,907,870 62,472 18.12003 8,761 5,952 109,639 397,584,877 66,799 18.42004 9,835 6,864 123,595 450,196,593 65,588 18.02005 10,038 6,796 122,017 440,272,638 64,784 18.02006 10,469 6,910 124,544 436,078,409 63,108 18.02007 10,517 6,986 126,691 461,821,817 66,107 18.12008 10,313 6,843 125,152 459,032,333 67,081 18.32009 9,571 6,462 116,532 478,112,063 73,988 18.02010 8,478 5,731 97,605 460,262,822 80,311 17.02011 7,288 4,846 72,361 372,795,627 76,929 14.92012 7,183 4,978 63,238 352,101,262 70,731 12.72013 7,407 5,110 60,604 337,562,116 66,059 11.92014 7,687 5,328 47,849 268,653,975 50,423 9.02015 8,209 4,343 18,469 108,972,643 25,092 4.32016 8,377 97 114 646,033 6,660 1.2
Figures as of 05/01/2018
Page 10
Racing

Kentucky-Bred Starters and Starts: In-State/Out-of-State
Foaling Year
Total Starters
In-StateStarters
Pct. ofIn-State
Starters
Total Starts
In-State Starts
Pct. ofIn-State
Starts 1996 5,753 2,313 40.2 120,264 17,026 14.21997 6,111 2,400 39.3 132,001 17,703 13.41998 6,551 2,499 38.1 134,107 17,514 13.11999 6,843 2,595 37.9 132,754 17,906 13.52000 6,995 2,725 39.0 132,958 18,199 13.72001 6,897 2,761 40.0 133,181 19,445 14.62002 5,553 2,233 40.2 100,302 14,637 14.62003 5,952 2,406 40.4 109,639 15,074 13.72004 6,864 2,757 40.2 123,595 16,859 13.62005 6,796 2,671 39.3 122,017 15,750 12.92006 6,910 2,686 38.9 124,544 15,049 12.12007 6,986 2,686 38.4 126,691 14,655 11.62008 6,843 2,708 39.6 125,152 14,573 11.62009 6,462 2,563 39.7 116,532 13,279 11.42010 5,731 2,266 39.5 97,605 11,339 11.62011 4,846 1,943 40.1 72,361 9,224 12.72012 4,978 1,983 39.8 63,238 8,656 13.72013 5,110 2,026 39.6 60,604 8,556 14.12014 5,303 2,035 38.4 45,880 7,332 16.02015 4,098 1,418 34.6 16,214 3,297 20.3
Note: In-state starters include any Thoroughbred that made at least one start in its native state.
Figures as of 05/01/2018
Page 11
Racing
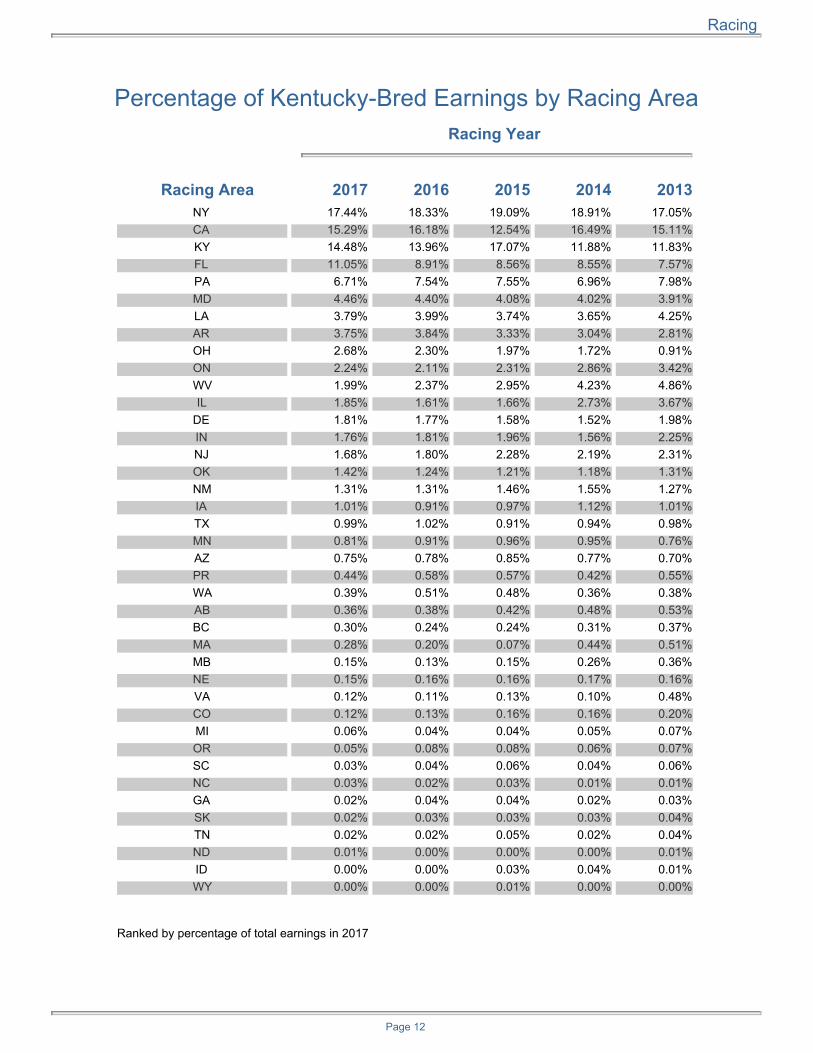
Percentage of Kentucky-Bred Earnings by Racing Area
Racing Year
Racing Area 2017 2016 2015 2014 2013NY 17.44% 18.33% 19.09% 18.91% 17.05%CA 15.29% 16.18% 12.54% 16.49% 15.11%KY 14.48% 13.96% 17.07% 11.88% 11.83%FL 11.05% 8.91% 8.56% 8.55% 7.57%PA 6.71% 7.54% 7.55% 6.96% 7.98%MD 4.46% 4.40% 4.08% 4.02% 3.91%LA 3.79% 3.99% 3.74% 3.65% 4.25%AR 3.75% 3.84% 3.33% 3.04% 2.81%OH 2.68% 2.30% 1.97% 1.72% 0.91%ON 2.24% 2.11% 2.31% 2.86% 3.42%WV 1.99% 2.37% 2.95% 4.23% 4.86%IL 1.85% 1.61% 1.66% 2.73% 3.67%
DE 1.81% 1.77% 1.58% 1.52% 1.98%IN 1.76% 1.81% 1.96% 1.56% 2.25%NJ 1.68% 1.80% 2.28% 2.19% 2.31%OK 1.42% 1.24% 1.21% 1.18% 1.31%NM 1.31% 1.31% 1.46% 1.55% 1.27%IA 1.01% 0.91% 0.97% 1.12% 1.01%TX 0.99% 1.02% 0.91% 0.94% 0.98%MN 0.81% 0.91% 0.96% 0.95% 0.76%AZ 0.75% 0.78% 0.85% 0.77% 0.70%PR 0.44% 0.58% 0.57% 0.42% 0.55%WA 0.39% 0.51% 0.48% 0.36% 0.38%AB 0.36% 0.38% 0.42% 0.48% 0.53%BC 0.30% 0.24% 0.24% 0.31% 0.37%MA 0.28% 0.20% 0.07% 0.44% 0.51%MB 0.15% 0.13% 0.15% 0.26% 0.36%NE 0.15% 0.16% 0.16% 0.17% 0.16%VA 0.12% 0.11% 0.13% 0.10% 0.48%CO 0.12% 0.13% 0.16% 0.16% 0.20%MI 0.06% 0.04% 0.04% 0.05% 0.07%OR 0.05% 0.08% 0.08% 0.06% 0.07%SC 0.03% 0.04% 0.06% 0.04% 0.06%NC 0.03% 0.02% 0.03% 0.01% 0.01%GA 0.02% 0.04% 0.04% 0.02% 0.03%SK 0.02% 0.03% 0.03% 0.03% 0.04%TN 0.02% 0.02% 0.05% 0.02% 0.04%ND 0.01% 0.00% 0.00% 0.00% 0.01%ID 0.00% 0.00% 0.03% 0.04% 0.01%WY 0.00% 0.00% 0.01% 0.00% 0.00%
Ranked by percentage of total earnings in 2017
Page 12
Racing
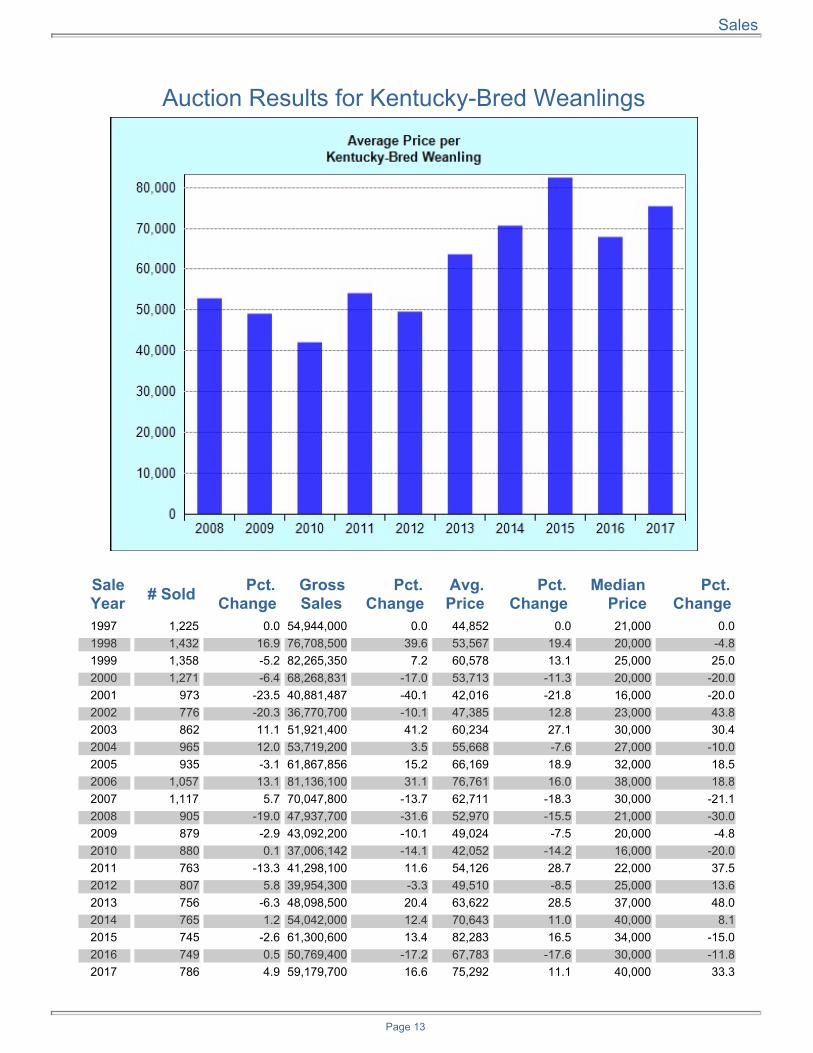
Auction Results for Kentucky-Bred Weanlings
SaleYear # Sold Pct.
Change GrossSales
Pct. Change
Avg. Price
Pct. Change
Median Price
Pct. Change
1997 1,225 0.0 54,944,000 0.0 44,852 0.0 21,000 0.01998 1,432 16.9 76,708,500 39.6 53,567 19.4 20,000 -4.81999 1,358 -5.2 82,265,350 7.2 60,578 13.1 25,000 25.02000 1,271 -6.4 68,268,831 -17.0 53,713 -11.3 20,000 -20.02001 973 -23.5 40,881,487 -40.1 42,016 -21.8 16,000 -20.02002 776 -20.3 36,770,700 -10.1 47,385 12.8 23,000 43.82003 862 11.1 51,921,400 41.2 60,234 27.1 30,000 30.42004 965 12.0 53,719,200 3.5 55,668 -7.6 27,000 -10.02005 935 -3.1 61,867,856 15.2 66,169 18.9 32,000 18.52006 1,057 13.1 81,136,100 31.1 76,761 16.0 38,000 18.82007 1,117 5.7 70,047,800 -13.7 62,711 -18.3 30,000 -21.12008 905 -19.0 47,937,700 -31.6 52,970 -15.5 21,000 -30.02009 879 -2.9 43,092,200 -10.1 49,024 -7.5 20,000 -4.82010 880 0.1 37,006,142 -14.1 42,052 -14.2 16,000 -20.02011 763 -13.3 41,298,100 11.6 54,126 28.7 22,000 37.52012 807 5.8 39,954,300 -3.3 49,510 -8.5 25,000 13.62013 756 -6.3 48,098,500 20.4 63,622 28.5 37,000 48.02014 765 1.2 54,042,000 12.4 70,643 11.0 40,000 8.12015 745 -2.6 61,300,600 13.4 82,283 16.5 34,000 -15.02016 749 0.5 50,769,400 -17.2 67,783 -17.6 30,000 -11.82017 786 4.9 59,179,700 16.6 75,292 11.1 40,000 33.3
Page 13
Sales

Auction Results for Kentucky-Bred Yearlings
SaleYear # Sold Pct.
Change GrossSales
Pct. Change
Avg. Price
Pct. Change
Median Price
Pct. Change
1997 3,847 0.0 237,162,648 0.0 61,649 0.0 22,000 0.01998 4,059 5.5 278,233,873 17.3 68,547 11.2 22,000 0.01999 4,296 5.8 342,622,309 23.1 79,754 16.4 23,000 4.62000 4,648 8.2 407,627,666 19.0 87,700 10.0 22,000 -4.42001 4,278 -8.0 374,402,440 -8.2 87,518 -0.2 20,000 -9.12002 4,307 0.7 304,125,453 -18.8 70,612 -19.3 24,000 20.02003 3,807 -11.6 319,001,949 4.9 83,794 18.7 28,000 16.72004 3,953 3.8 361,355,269 13.3 91,413 9.1 32,000 14.32005 4,625 17.0 420,565,862 16.4 90,933 -0.5 30,000 -6.32006 4,763 3.0 445,607,266 6.0 93,556 2.9 30,000 0.02007 4,960 4.1 439,281,843 -1.4 88,565 -5.3 32,000 6.72008 4,577 -7.7 372,779,212 -15.1 81,446 -8.0 30,000 -6.32009 4,113 -10.1 247,331,150 -33.7 60,134 -26.2 18,000 -40.02010 3,977 -3.3 238,280,473 -3.7 59,915 -0.4 20,000 11.12011 3,909 -1.7 257,639,623 8.1 65,909 10.0 25,000 25.02012 3,525 -9.8 258,532,200 0.4 73,342 11.3 32,000 28.02013 3,676 4.3 328,956,116 27.2 89,488 22.0 40,000 25.02014 3,772 2.6 322,294,440 -2.0 85,444 -4.5 38,000 -5.02015 3,714 -1.5 341,788,135 6.1 92,027 7.7 40,000 5.32016 3,953 6.4 334,807,439 -2.0 84,697 -8.0 30,000 -25.02017 3,983 0.8 384,291,941 14.8 96,483 13.9 35,000 16.7
Page 14
Sales
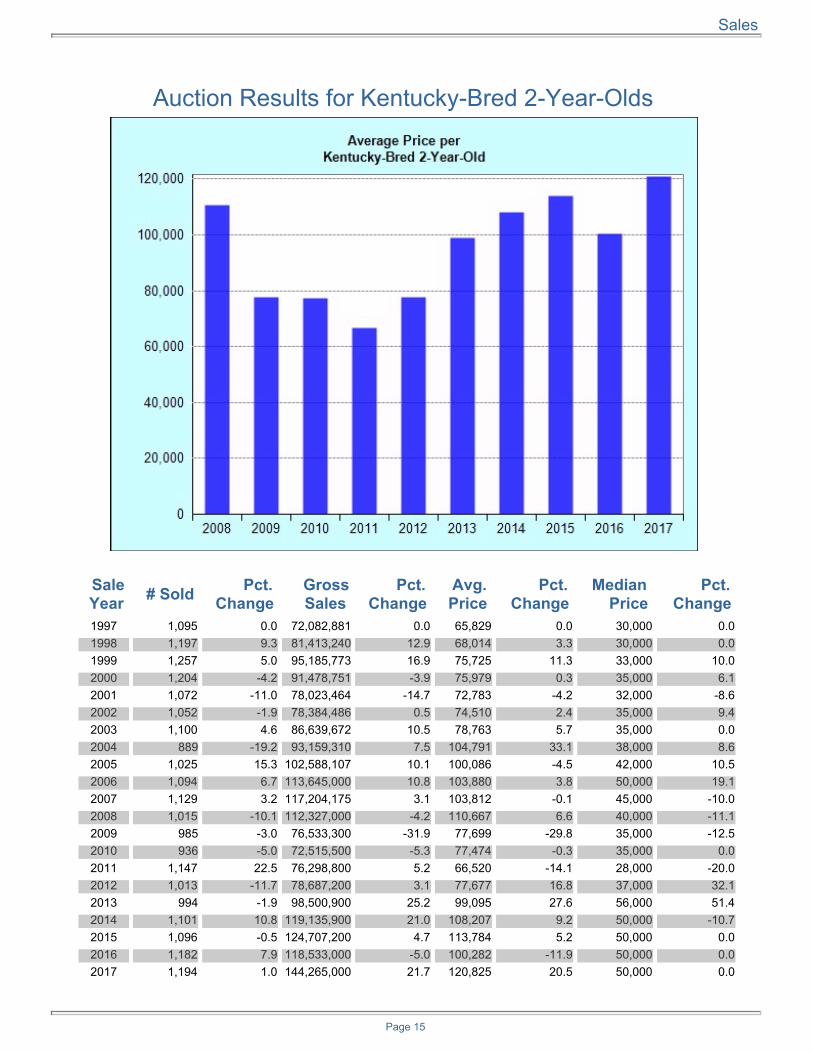
Auction Results for Kentucky-Bred 2-Year-Olds
SaleYear # Sold Pct.
Change GrossSales
Pct. Change
Avg. Price
Pct. Change
Median Price
Pct. Change
1997 1,095 0.0 72,082,881 0.0 65,829 0.0 30,000 0.01998 1,197 9.3 81,413,240 12.9 68,014 3.3 30,000 0.01999 1,257 5.0 95,185,773 16.9 75,725 11.3 33,000 10.02000 1,204 -4.2 91,478,751 -3.9 75,979 0.3 35,000 6.12001 1,072 -11.0 78,023,464 -14.7 72,783 -4.2 32,000 -8.62002 1,052 -1.9 78,384,486 0.5 74,510 2.4 35,000 9.42003 1,100 4.6 86,639,672 10.5 78,763 5.7 35,000 0.02004 889 -19.2 93,159,310 7.5 104,791 33.1 38,000 8.62005 1,025 15.3 102,588,107 10.1 100,086 -4.5 42,000 10.52006 1,094 6.7 113,645,000 10.8 103,880 3.8 50,000 19.12007 1,129 3.2 117,204,175 3.1 103,812 -0.1 45,000 -10.02008 1,015 -10.1 112,327,000 -4.2 110,667 6.6 40,000 -11.12009 985 -3.0 76,533,300 -31.9 77,699 -29.8 35,000 -12.52010 936 -5.0 72,515,500 -5.3 77,474 -0.3 35,000 0.02011 1,147 22.5 76,298,800 5.2 66,520 -14.1 28,000 -20.02012 1,013 -11.7 78,687,200 3.1 77,677 16.8 37,000 32.12013 994 -1.9 98,500,900 25.2 99,095 27.6 56,000 51.42014 1,101 10.8 119,135,900 21.0 108,207 9.2 50,000 -10.72015 1,096 -0.5 124,707,200 4.7 113,784 5.2 50,000 0.02016 1,182 7.9 118,533,000 -5.0 100,282 -11.9 50,000 0.02017 1,194 1.0 144,265,000 21.7 120,825 20.5 50,000 0.0
Page 15
Sales