2017 philadelphia venture report · the data in this report comes from the pitchbook platform–our...
TRANSCRIPT

Data provided by
2017 PHILADELPHIA
VENTURE REPORT

Credits & ContactPitchBook Data, Inc.
JOHN GABBERT Founder, CEO
ADLEY BOWDEN Vice President,
Market Development & Analysis
ContentKYLE STANFORD Analyst
REILLY HAMMOND Data Analyst
JENNIFER SAM Senior Graphic Designer
Contact PitchBook pitchbook.com
RESEARCH
SALES
COPYRIGHT © 2017 by PitchBook Data, Inc. All rights reserved. No part of this publication may be reproduced in any form or by any means—graphic, electronic, or mechanical, including photocopying, recording, taping, and information storage and retrieval systems—without the express written permission of PitchBook Data, Inc. Contents are based on information from sources believed to be reliable, but accuracy and completeness cannot be guaranteed. Nothing herein should be construed as any past, current or future recommendation to buy or sell any security or an offer to sell, or a solicitation of an offer to buy any security. This material does not purport to contain all of the information that a prospective investor may wish to consider and is not to be relied upon as such or used in substitution for the exercise of independent judgment.
Introduction 3
Philadelphia Venture Overview 4-5
Spotlight: Angel Investment 6
Corporate VC Activity 7
Impact Investing 8
Exits & Fundraising 9
Capital, Coaching & Customers 10-11
The PitchBook PlatformThe data in this report comes from the PitchBook Platform–our data software for VC, PE and M&A.
Contact [email protected] to request a free trial.
Contents
Release Date: 11/2/2017
Data as of: 9/30/2017 Note: This report covers the Philadelphia-Camden-Wilmington Metropolitan Statistical Area (Philadelphia), which includes parts of Pennsylvania, New Jersey, Delaware and Maryland. All data and charts cited throughout the report are based on companies and/or investors headquartered in this region.
2 2017 PHILADELPHIA VENTURE REPORT

Philadelphia is thriving in many ways—from our millennial population growth to our increased
college graduate retention rates, the future is bright as the next generation increasingly calls
Philadelphia home and looks to build an inclusive, innovation-focused community of thinkers,
designers and builders. Investment capital will be critical, and on that front Philadelphia
has seen a positive trajectory over the past ten years. While 2017 data shows a decrease
in activity, the fall-off has been consistent across the nation. We remain full of hope in a
continued path toward growth in Philadelphia, including more capital at all stages investing in
an increasingly diverse entrepreneurial base. Please join me in thanking our sponsors of this
report. PACT looks forward to working with them and all of you to elevate Philadelphia!
Dean Miller, President & CEO
REPORT SPONSORS:
INTRODUCTION
3 2017 PHILADELPHIA VENTURE REPORT

$50
7.8
$50
7.9
$56
5.6
$4
50
.9
$6
72.3
$4
55.3
$8
42.2
$8
82.5
$1,0
10.7
$529
.6
9095
116
141154
164
196
174 178
121
2008 2009 2010 2011 2012 2013 2014 2015 2016 2017*
Deal Value ($M)
# of Deals Closed
Recent growth hits setback in 2017 Overview of VC activity in Philadelphia MSA
VC activity in Philadelphia MSA
Historically, the economic background
of the Philadelphia metropolitan
statistical area (MSA) is rooted in
industries that until recently hadn’t
been traditional venture capital
targets. Manufacturing and traditional
healthcare have long been major parts
of the area—roughly 500 medical
institutions are located throughout
greater Philadelphia. The growth of
tech within the region—which the
Chamber of Commerce of Greater
Philadelphia estimates at 4.4% annually
since the turn of the century—as well
as their increasing focus on innovation
into tech-enabled arenas, has provided
investors with a diverse market of
opportunities.
VC activity in the Philadelphia region
has grown rapidly over the past
decade, cementing itself as a top-20
market in the US in terms of both the
overall volume and value. Last year
more than $1 billion was invested
throughout the MSA—ranking the
region just outside the top 10 in dollars
invested—representing the highest
figure the MSA has achieved over the
past decade. While it was bolstered by
several outsized deals, those late-stage
fundings are predicated on the overall
growth and maturation of the domestic
VC ecosystem, from the earliest stages
on. The industrial makeup of the
economy also presents an opportunity
for the VC ecosystem to continue its
growth moving forward, especially
as manufacturing moves toward
automation and the region’s healthcare
sector continues to develop into one of
the more innovative markets in the US.
Since 2008, both yearly deal counts
and values have grown in almost lock
step. Each figure had nearly doubled
through 2016, even when considering
that deal count in 2016 was lower than
2014’s total. Similar to what we have
seen across the US VC market, a high
proportion of the growth in volume can
be traced to an increasing number of
angel and seed rounds. The proximity
of Philadelphia to several universities
also leads to an influx of talent entering
the entrepreneurial ecosystem that
can manifest in a greater population
of fledgling startups. The University of
Pennsylvania, for example, has ranked
near the top of universities producing
startup founders over the past decade,
graduating almost 800 founders
since 2006—Drexel University, Temple
University and Villanova University
have together graduated an additional
225 founders. Though many of those
companies are launched outside of
Philadelphia, the MSA as a whole
certainly benefits from the high density
of colleges and universities.
85
49
60
48 33
24
0
20
40
60
80
100
120
2008 2009 2010 2011 2012 2013 2014 2015 2016 2017*
Angel/Seed Early VC Late VC
VC activity in Philadelphia MSA (#) by stage
Source: PitchBook. *As of 9/30/2017
Source: PitchBook. *As of 9/30/2017
4 2017 PHILADELPHIA VENTURE REPORT

0%
10%
20%
30%
40%
50%
60%
70%
80%
90%
100%
2008 2009 2010 2011 2012 2013 2014 2015 2016 2017*
Energy
IT Hardware
Media
Consumer Goods &Recreation
Commercial Services
HC Services & Systems
Pharma & Biotech
HC Devices & Supplies
Other
Software
VC activity in Philadelphia MSA (#) by sector
Median round size ($M) by stage in Philadelphia MSA
$0.4$0.4
$1.4$0.9
$11.1
$3.4
$0.0
$2.0
$4.0
$6.0
$8.0
$10.0
$12.0
2008 2009 2010 2011 2012 2013 2014 2015 2016 2017*
Angel/Seed Early Stage
Late Stage
Unique investors (#) in Philadelphia MSA VC deals
Source: PitchBook. *As of 9/30/2017
Source: PitchBook. *As of 9/30/2017
Source: PitchBook. *As of 9/30/2017
The largest area of VC investment
overall is the robust healthcare
industry throughout the Philadelphia
metro, which is comprised of research
universities, hospitals and major
pharmaceutical corporations. More
than 40% of completed VC rounds
this year have been made into
healthcare. The capital-intensive nature
of many healthcare investments has
also funneled nearly 80% of all 2017
deal value for Philadelphia into the
sector. Pharma and biotech alone has
registered 43% of all capital invested
into the MSA this year. Five companies
have raised at least $25 million this
year, and, in fact, the five largest
financings completed in Philadelphia
this year have been by healthcare firms.
Particularly given these larger deals,
the relative shortage of dry powder
held by investors headquartered in the
MSA can make it more challenging for
companies to raise investment. The
proximity of the MSA to other major
hubs can, however, enable outside
investor participation, filling late-
stage voids. In Complexa’s $62 million
Series C in July, the largest VC deal
of the year, not one of the investors
was headquartered in the MSA. New
Enterprise Associates and Pfizer
Venture Investments co-led the round,
with three firms headquartered outside
the US filling out the deal.
The VC ecosystem in Philadelphia has
developed the ability to attract outside
investment, but the reliance on that
capital will play a part in its ability
to keep talented entrepreneurs and
startups. Of the 136 unique investors
that have completed at least one
deal in Philadelphia this year, 110 are
headquartered outside the metro area.
While the proximity of New York allows
Philadelphia startups to leverage New
York investors, its proximity likely also
lures entrepreneurs and their startups
away altogether. This highlights
the need for Philadelphia to better
market its own billing as a flourishing
ecosystem to its entrepreneurs.
143
113
169
136
0
50
100
150
200
250
2008 2009 2010 2011 2012 2013 2014 2015 2016 2017*
0
50
100
150
200
250
2008 2009 2010 2011 2012 2013 2014 2015 2016 2017*
# of investors HQ’d outside Philadelphia
# of total investors
5 2017 PHILADELPHIA VENTURE REPORT
$0.40 $0.40
$1.01
$1.15
$0.00
$0.20
$0.40
$0.60
$0.80
$1.00
$1.20
$1.40
2008 2009 2010 2011 2012 2013 2014 2015 2016 2017*
Median Average
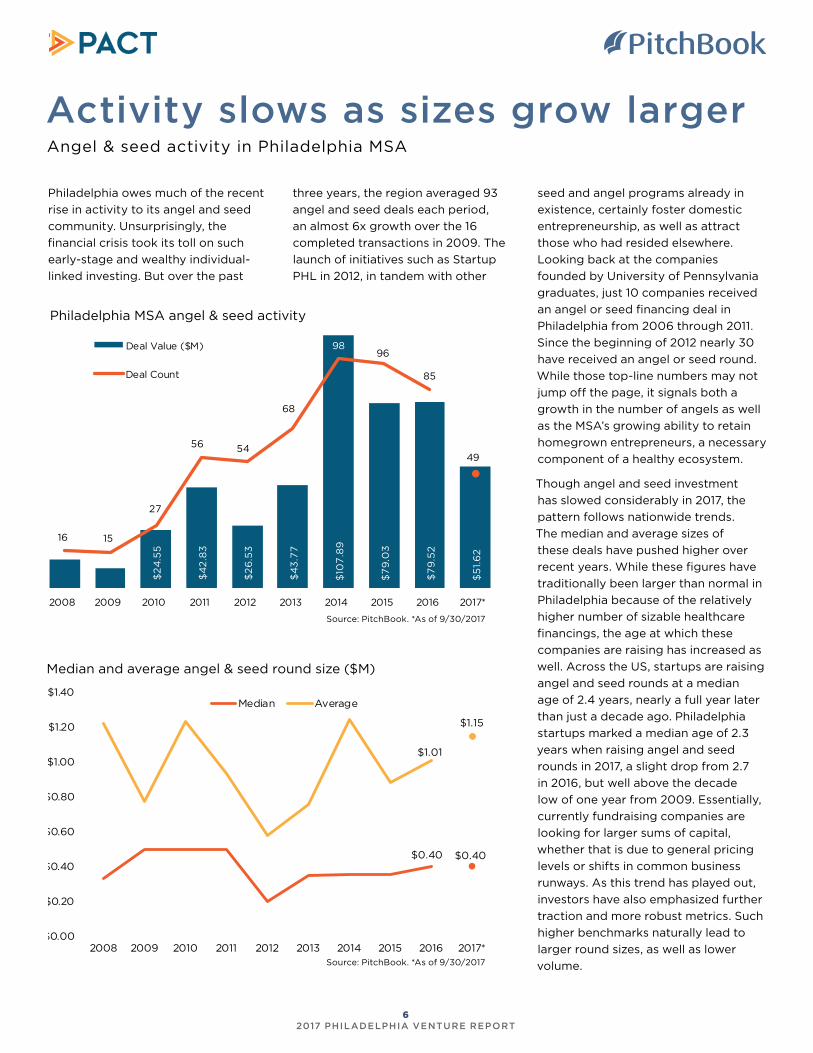
Activity slows as sizes grow larger Angel & seed activity in Philadelphia MSA
$2
4.5
5
$4
2.8
3
$2
6.5
3
$4
3.7
7
$10
7.8
9
$7
9.0
3
$7
9.5
2
$5
1.6
2
16 15
27
56 54
68
9896
85
49
2008 2009 2010 2011 2012 2013 2014 2015 2016 2017*
Deal Value ($M)
Deal Count
Philadelphia MSA angel & seed activity
Source: PitchBook. *As of 9/30/2017
Philadelphia owes much of the recent
rise in activity to its angel and seed
community. Unsurprisingly, the
financial crisis took its toll on such
early-stage and wealthy individual-
linked investing. But over the past
three years, the region averaged 93
angel and seed deals each period,
an almost 6x growth over the 16
completed transactions in 2009. The
launch of initiatives such as Startup
PHL in 2012, in tandem with other
seed and angel programs already in
existence, certainly foster domestic
entrepreneurship, as well as attract
those who had resided elsewhere.
Looking back at the companies
founded by University of Pennsylvania
graduates, just 10 companies received
an angel or seed financing deal in
Philadelphia from 2006 through 2011.
Since the beginning of 2012 nearly 30
have received an angel or seed round.
While those top-line numbers may not
jump off the page, it signals both a
growth in the number of angels as well
as the MSA’s growing ability to retain
homegrown entrepreneurs, a necessary
component of a healthy ecosystem.
Though angel and seed investment
has slowed considerably in 2017, the
pattern follows nationwide trends.
The median and average sizes of
these deals have pushed higher over
recent years. While these figures have
traditionally been larger than normal in
Philadelphia because of the relatively
higher number of sizable healthcare
financings, the age at which these
companies are raising has increased as
well. Across the US, startups are raising
angel and seed rounds at a median
age of 2.4 years, nearly a full year later
than just a decade ago. Philadelphia
startups marked a median age of 2.3
years when raising angel and seed
rounds in 2017, a slight drop from 2.7
in 2016, but well above the decade
low of one year from 2009. Essentially,
currently fundraising companies are
looking for larger sums of capital,
whether that is due to general pricing
levels or shifts in common business
runways. As this trend has played out,
investors have also emphasized further
traction and more robust metrics. Such
higher benchmarks naturally lead to
larger round sizes, as well as lower
volume.
Median and average angel & seed round size ($M)
Source: PitchBook. *As of 9/30/2017
6 2017 PHILADELPHIA VENTURE REPORT

Corporate VC on pace for record Corporate VC activity in Philadelphia MSA
$9
6.2
$2
10.0
$15
4.5
$2
77.1
$8
3.9
$19
8.3
$2
29
.1
$14
4.6
$2
12.2
1
9
12
13
11 11
14
12
16
15
2008 2009 2010 2011 2012 2013 2014 2015 2016 2017*
Deal Value ($B)
# of Deals Closed
Corporate VC activity in Philadelphia MSA
Corporate VC (CVC) activity in
Philadelphia has continued its recent
growth throughout this year. After
nine months, 2017 has almost matched
the decade high for number of deals
with CVC participation (16), and
is pacing to also surpass the high-
water mark for accompanying deal
value. The area is home to 15 Fortune
500 companies, including one of the
most active corporations in terms
of CVC investments (Comcast). That
said, much of CVC participation is
due to corporations headquartered
outside the Philadelphia region—
eight of the top 10 CVC investors are
headquartered outside the MSA.
CVC has become a popular form of
research and development for large
corporations, especially for healthcare
companies. Novo, Pfizer and Novartis
each lay claim to a spot in the top
six most active CVC investors in
Philadelphia startups since 2010.
During that time healthcare has
accounted for roughly 52% of all CVC
deals in the MSA. CVC offers relatively
cheap exposure to newer technologies
for corporations with an eye toward
acquisition in the future. As the average
cost of developing a new drug reaches
$1 billion—though that figure is claimed
to be higher or lower depending on
different sides of the argument, the
range is high regardless—potential
savings via funding outside R&D in
an emerging company are enormous,
especially considering many drugs will
never make it to market.
The recent upsurge in US CVC has
been bolstered by the entrance of
new corporations. Many would also
not be generally thought to engage
venture, but, faced with disruption, are
being forced to find new methods of
innovation. Philadelphia MSA-based
Campbell Soup Company launched its
Source: PitchBook. *As of 9/30/2017
0%
10%
20%
30%
40%
50%
60%
70%
80%
90%
100%
2008 2009 2010 2011 2012 2013 2014 2015 2016 2017*
Consumer Goods& Recreation
Energy
HC Services &Systems
Media
CommercialServices
IT Hardware
Other
Software
Pharma &Biotech
HC Devices &Supplies
Corporate VC activity (#) by sector
Source: PitchBook. *As of 9/30/2017
Acre Venture Fund last year to invest in
food startups and trends. The vehicle
is managed by outside management
and has completed nine investments,
including in a food management
platform, organic food providers and a
cold press juice machine. Though none
were within the Philadelphia ecosystem,
Campbell Soup epitomizes this need
for corporations to innovate, having
fallen 40 spots on the Fortune 500
since 2010.
7 2017 PHILADELPHIA VENTURE REPORT

VC making an impact Impact investment activity in Philadelphia MSA
Impact VC investing activity
Source: PitchBook. *As of 9/30/2017
$6
.5
$5
.4
$2
6.2
$2
7.1
$3
4.3
$2
7.6
$17
3.0
$14
.9
$15
1.4
$3
5.5
67
9
13
1615
28
33
37
18
2008 2009 2010 2011 2012 2013 2014 2015 2016 2017*
Deal Value ($M)
# of Deals Closed
Commercial Services
Energy
HC Devices & Supplies
HC Services & Systems
IT Hardware
Media
Other
Pharma & Biotech
Software
6 7
45
24
35
27
31
34
$5.9$152.0
$57.0
$13.1$1.6
$14.5
$203.8
$53.4
$0.7
Source: PitchBook. *As of 9/30/2017
Impact investing since 2006 (#) by sector
While its exact parameters are difficult
to pin down, impact investing has
become a growing point of focus
for the venture industry over recent
years. Especially in the wake of recent
scandals and continued criticism
that too much money is flowing
into products catered to high-end
user markets, there has been more
emphasis on backing enterprises
that focus on enabling positive social
changes in addition to returns. In the
end, whether a company matches the
common concept of impact investing
or not matters less than if it can prove
it provides a net benefit; producing
change for the better. Philadelphia
has been a frontrunner in encouraging
the development of a social impact
investment community. Programs in
Philadelphia such as ImpactPHL and
Benjamin’s Desk (recently merged with
1776 of Washington DC) are highly
relevant examples.
Analyzing associated venture financing
activity, impact investment in
Philadelphia has grown by more than
6x since 2008. 37 investments were
completed in 2016 for total investment
of more than $150 million. The
aggregate value of impact investments
is generally much smaller than for other
VC deal types, with the median round
size yet to cross $1 million within the
MSA for any year in the past decade—
though the 2017 median currently
stands at $980,000. Energy, usually
lower on many VCs’ list, has received
30% of the impact capital invested
in the region, and edtech companies
make up a sizable portion of the
software investments. While impact
investment may not tip the scales
for Philadelphia VC as a whole, the
commitment the region has made to
realizing a social impact is noticeable.
Impact investing since 2006 ($M) by sector
8 2017 PHILADELPHIA VENTURE REPORT

The final piece of the ecosystem Fundraising and exit activity in Philadelphia MSA
$5
68
.6
$5
81.8
$15
.0
$10
0.0
$76
.9
$14
3.6
$10
.1
$25
9.4
$18
4.0
$9
4.0
3
5
1 1
3
2 2
6
4
2
2008 2009 2010 2011 2012 2013 2014 2015 2016 2017*
Capital Raised ($M)
# of Funds Closed
Source: PitchBook. *As of 9/30/2017
If there is one thing that may be
holding back the Philadelphia
ecosystem, it would be fundraising.
There has been $534 million in
commitments made to 12 VC funds
since the beginning of 2015, a small
number relative to larger VC hubs.
VC fundraising activity in Philadelphia
More than the amount raised, the low
number of funds makes it difficult for
startups to raise local cash at certain
developmental points. This can cause
promising startups to look elsewhere
for capital. Proximity to New York, DC
and Boston allows young companies
and entrepreneurs to raise money
outside the Philadelphia region, but it
can also drive some to relocate. While
there is plenty of capital available
for younger startups, there is a need
for more large, late-stage vehicles to
enable domestic development along
the full capital stack so that companies
are able to continue growth through
to an exit and recycle more capital and
talent.
Hampering fundraising, few exits
have been achieved in the MSA. 151
companies have completed an exit
since 2010, an average of about 20
each year during that time. While
more than $7 billion in exit value has
been realized, almost 30% of that is
represented by just three exits. A high
percentage of the top exits have also
happened in the healthcare sector,
which sees less serial entrepreneurship
than tech because of lengthened
development timelines and initial costs.
Altogether $783 million in exit value
has been created since the beginning
of 2016, including $430 million in 3Q of
this year.
$1,
06
7.8
$7
.5
$1,
33
4.3
$6
67
.0
$3
88
.2
$6
15.0
$1,
163
.9
$2
,29
2.5
$2
23
.9
$5
60
.0
18
7
15
1718
2120
28
23
11
2008 2009 2010 2011 2012 2013 2014 2015 2016 2017*
Exit Value ($M)
# of Exits Closed
0
5
10
15
20
25
30
2008 2009 2010 2011 2012 2013 2014 2015 2016 2017*
Acquisition Buyout IPO
VC-backed exit activity VC-backed exit activity (#) by type
Source: PitchBook. *As of 9/30/2017 Source: PitchBook. *As of 9/30/2017
9 2017 PHILADELPHIA VENTURE REPORT

CAPITAL is the fuel for emerging
technology companies. This report
highlights how the growth in
entrepreneurial activity in our region
correlates with increased fundraising
by entrepreneurs over the past decade,
both in terms of the number of deals
closed and the size of the investment
rounds. In addition, the report reveals
a consistent and significant number of
investors from outside of the Greater
Philadelphia region. Is this a problem?
Not inherently, as money is portable
and will go wherever there are the best
opportunities for returns. However,
seed and early stage capital is less
portable and an increasing local supply
of these dollars is critical to the growth
and health of a venture ecosystem.
From a peak in 2014, the region has
witnessed a decrease in the number of
seed stage deals completed.
At PACT, we watch the data closely
and align our resources and energy to
increase the flow of capital, particularly
at the seed and early stages. PACT,
in partnership with Ben Franklin
Technology Partners of SE PA, led
the creation of Innovate in PA, a $100
million bipartisan insurance premium
tax credit bill. Since 2015, funds from
the sale of these tax credits have been
directed through Pennsylvania’s four
Ben Franklin Technology Partners,
three Life Sciences Greenhouses,
and the BFTDA’s Venture Investment
Program into seed and early-stage
companies in Pennsylvania, as well
as funds focused on the investment
sector. Despite the macro level
data, these entities have deployed
increasing amounts of capital to seed
and early-stage companies in the past
three years. Is this enough? Definitely
not.
Dean Miller President & CEO
“ Seed and early stage
capital is less portable
and an increasing local
supply of these dollars
is critical to the growth
and health of a venture
ecosystem.”
A healthy and growing base of
individual angel investors and angel
groups is another critical success
factor for a growing entrepreneurial
ecosystem. In this regard, Philadelphia
is witnessing an increased, palpable
energy among a growing and more
visible group of angels and angel
groups. The creation of Broad Street
Angels in 2017 is just one example
of an effort to organize the desires
of a growing number of individual
investors to fund seed and early stage
technology companies. At PACT, we
launched the PACT/TiE Pitch Series
in collaboration with the newly
established Philadelphia Chapter of
“In the first two editions
of the Lion’s Den, 4
of 6 companies have
collectively raised over
$1 million.”
TiE to provide entrepreneurs more
opportunity to connect with, pitch
to, and raise capital from qualified
angel investors. We also introduced
the Lion’s Den, an annual event within
our Capital Conference where the top
three featured companies pitch to five
angel investors and compete live for
on-the-spot commitments of capital. In
the first two editions of the Lion’s Den,
4 of 6 companies have collectively
raised over $1 million.
Capital, coaching & customers
10 2017 PHILADELPHIA VENTURE REPORT

With all of this activity, why are the
numbers for seed and early-stage
investments down over the past three
years? Unfortunately, since 2010 there
has been a significant decrease in the
number of new institutional venture
funds raised as well as the dollars
raised by those closing new funds.
And, of those that closed new funds,
the majority are directing capital
away from seed and early-stage
investments. We can certainly do more
as a community to reverse this trend.
What will it take? It is not just about
capital availability. Remember that
capital will find good opportunities.
We at PACT, along with others in the
region, recognize that while capital
is critical, coaching can help make a
promising entrepreneur great, and
early customers can take a good idea
and make it a great investment.
PACT has invested heavily in two
new programs, MentorConnect and
CustomerConnect, to grow and
strengthen our region’s entrepreneurial
leaders and companies to increase
the number of attractive investment
opportunities. We launched
MentorConnect in partnership with
Ben Franklin Technology Partners of
Southeastern Pennsylvania in June
2016 to provide teams of experienced
entrepreneurs to emerging CEOs.
CustomerConnect was launched
the same year to provide more
opportunities for young companies
to pitch to and navigate enterprise
customers. Both of these programs
recognize that while capital is critical,
experienced management and early
customers will help to attract more
capital and ultimately grow the base
of local capital.
Interested in getting connected
to or helping us with any of these
programs? Visit
www.philadelphiapact.com
and send us an email.
“While capital is
critical, experienced
management and early
customers will help to
attract more capital and
ultimately grow the base
of local capital.”
REPORT SPONSORS:
11 2017 PHILADELPHIA VENTURE REPORT

See how the PitchBook Platform can
help VCs invest smarter.
We do pre-money valuations,cap tables,series terms,custom search,growth metrics.
You invest in the next big thing.