2017 q3 furniture retail - cogent...
TRANSCRIPT

The disclosures and limitations of this research on this page are an integral part of this report. Copyright © 2017 Cogent Valuation. All Rights Reserved. COGENTVALUATION.COM The disclosures and limitations of this research on this page are an integral part of this report. Copyright © 2017 Cogent Valuation. All Rights Reserved. COGENTVALUATION.COM
AS OF September 30, 2017
Q3: Quarterly Industry Update
Furniture Retail
Median 52-Week Return
17.1% Median 3-Year CAGR Return
6.3% Median EV/Revenue Multiple
.9x Median EV/EBITDA Multiple
8.6x Median Price/Earnings Multiple
18.4x Median EV/Gross CF Multiple
15x
Public Company Key Statistics
INDUSTRY SUMMARY
COGENT VALUATION identified Furniture Retail publicly traded companies, IPOs, and recent M&A transactions within the Furniture Retail industry, which provides a basis for market and transaction pricing that can be used by your firm in estimating market sentiment and its impact on your firm's value. Over the last year since September 30, 2016, the median 52-week share price return of the Furniture Retail industry was 17.1%. Between September 30, 2015 and September 30, 2017, the median EV/EBITDA multiple decreased from 8.7 to 8.6. Furthermore, the median price-to-earnings multiple decreased from 19.2 to 18.4 over the same period.
| 1

The disclosures and limitations of this research on this page are an integral part of this report. Copyright © 2017 Cogent Valuation. All Rights Reserved. COGENTVALUATION.COM
Comparable Public Company Market Price Returns as of September 30, 2017
INDUSTRY: Q3 2017 FURNITURE RETAIL
YTD 3 Month 1 Year 2 Year 3 Year 2016 2015 2014
Aaron's, Inc. 36.4% 12.2% 71.6% 9.9% 21.5% 42.9% -26.8% 4.0%
Bassett Furniture Industries 24.0% -0.7% 62.2% 16.3% 40.3% 21.2% 28.5% 27.7%
Conn's, Inc. 122.5% 47.4% 172.8% 8.2% -2.4% -46.1% 25.6% -76.2%
Ethan Allen Interiors Inc. -12.1% 0.3% 3.6% 10.8% 12.4% 32.5% -10.2% 1.8%
Flexsteel Industries, Inc. -17.8% -6.3% -2.0% 27.4% 14.6% 39.6% 37.0% 4.9%
Haverty Furniture Companies, Inc. 10.3% 4.2% 30.5% 5.5% 6.3% 10.5% -2.6% -29.7%
hhgregg, Inc. -98.9% 23.1% -99.1% -94.3% -86.4% -60.9% -51.7% -45.8%
Hooker Furniture Corporation 25.8% 16.0% 95.0% 42.4% 46.4% 50.4% 47.0% 2.9%
Kimball International, Inc. 12.6% 18.5% 52.8% 44.6% 9.5% 79.7% 7.1% -39.3%
La-Z-Boy Incorporated -13.4% -17.2% 9.5% 0.6% 10.8% 27.1% -9.0% -13.4%
Natuzzi S.p.A. -9.3% -22.6% 17.1% 0.0% 0.3% 40.4% 3.9% -40.2%
Nova Lifestyle, Inc. -14.0% 9.9% -54.3% -14.7% -27.2% 7.2% -35.9% -37.7%
RH 129.1% 9.0% 103.4% -13.2% -4.0% -61.4% -17.2% 42.7%
Stanley Furniture Company, Inc. 31.1% 3.5% -33.7% -36.5% -25.1% -67.7% 1.8% -28.6%
Tempur Sealy International, Inc. -5.5% 20.8% 13.7% -5.0% 4.7% -3.1% 28.3% 1.8%
Median of Industry Public Companies 10.3% 9.0% 17.1% -6.9% 6.3% 21.2% 1.8% -13.4%
Multiple year periods are calculated as the average annual return.
Highest Return Lowest Return Median Return
| 2

The disclosures and limitations of this research on this page are an integral part of this report. Copyright © 2017 Cogent Valuation. All Rights Reserved. COGENTVALUATION.COM
Median Quarterly Revenue Growth of All Furniture Retail Companies Median Gross Profit, EBITDA, Net Income, and Gross Cash Flow Margins
Industry Revenue Growth and Profit Margins for the Past Two Years
INDUSTRY: Q3 2017 FURNITURE RETAIL
| 3
-1.0%
-0.5%
0.0%
0.5%
1.0%
1.5%
2.0%
2.5%
0.0%
5.0%
10.0%
15.0%
20.0%
25.0%
30.0%
35.0%
40.0%
Gross Profit EBITDA Net Income Gross Cash Flow

The disclosures and limitations of this research on this page are an integral part of this report. Copyright © 2017 Cogent Valuation. All Rights Reserved. COGENTVALUATION.COM
9/30/17 6/30/17 3/31/17 12/31/16 3/31/17 12/31/16 9/30/16 6/30/16
EV/Revenues Multiple 0.9x 0.8x 0.8x 0.9x 0.8x 0.9x 0.7x 0.7x
EV/EBITDA Multiple 8.6x 8.7x 8.5x 9.8x 8.5x 9.8x 7.9x 7.1x
Price/Earnings Multiple 18.4x 18.3x 17.3x 20.3x 17.3x 20.3x 16.1x 16.5x
EV/Gross Cash Flows Multiple 15.0x 13.2x 12.5x 14.1x 12.5x 14.1x 11.7x 11.4x
Highest Multiple Lowest Multiple Median Multiple
Public Company Median Multiples by Quarter
INDUSTRY: Q3 2017 FURNITURE RETAIL
| 4

The disclosures and limitations of this research on this page are an integral part of this report. Copyright © 2017 Cogent Valuation. All Rights Reserved. COGENTVALUATION.COM
Industry Initial Public Offerings—Industry: Furniture Retail (dollars in millions, except share prices)
INDUSTRY: Q3 2017 FURNITURE RETAIL
Offer Date Company Name Offer
Price Shares Offered
Amount Raised
Total Assets Debt LTM
Revenues LTM
EBITDA LTM Net Income
LTM Cash Flows
6/27/16 Vega Corporation Co., Ltd. $15.74 0.8 $13.2 $34.8 $8.1 $81.3 $0.0 $4.3 $0.0
5/26/16 Maisons du Monde S.A. $19.01 19.4 $369.1 $1,108.8 $838.3 N/A N/A N/A N/A
12/10/15 Miliboo SA $4.61 1.2 $5.6 $9.3 $1.5 $16.2 ($0.7) ($1.0) ($0.6)
12/9/15 Temple & Webster Group Limited $0.79 55.9 $44.4 $3.2 $3.5 $20.1 ($3.6) ($5.0) ($3.6)
6/16/15 Adairs Limited $2.40 90.9 $218.1 $160.1 $81.1 $202.5 $28.3 $6.3 $34.3
1/27/15 ScS Group plc $2.66 20.4 $54.3 $125.7 $38.2 $438.2 $20.4 $10.0 $27.1
11/1/12 RH $24.00 5.2 $123.9 $650.9 $151.1 $1,048.5 $67.4 $33.1 $92.1
5/17/11 GI Ventures $8.91 0.1 $1.1 N/A N/A N/A N/A N/A N/A
Median of all IPOs nm nm $49.3 $125.7 $38.2 $141.9 $10.2 $5.3 $13.6
Multiple year periods are calculated as the average annual return.
Highest Return Lowest Return Median Return
| 5

The disclosures and limitations of this research on this page are an integral part of this report. Copyright © 2017 Cogent Valuation. All Rights Reserved. COGENTVALUATION.COM
Recent Merger and Acquisition Transactions for a Majority Stake (dollars in millions)
INDUSTRY: Q3 2017 FURNITURE RETAIL
| 6
(Continued on next page)
USA International Highest Lowest Median
Transaction Date Target Acquirer Transaction
Size %
Bought
9/29/17 Shenandoah Furniture, Inc. Hooker Furniture $40.0 100%
9/12/17 Staples, Inc. Sycamore Partners $7,903.7 100%
7/28/17 SEI/Aaron's, Inc. Aaron's, Inc. $140.0 100%
6/30/17 Indoor Group Oy Sievi Capital Oyj $74.5 100%
6/22/17 Iniciativa Exterior 3i SA Oneall International Ltd. $1.9 100%
5/1/17 Deny Designs Inc. Leaf Group Ltd. $12.2 100%
2/28/17 Kohler Interiors Group, Ltd. Samson Holding Ltd. $29.5 100%
1/31/17 Poggenpohl Möbelwerke GmbH ADCURAM Group AG $10.4 100%
12/16/16 Morgana AB Lammhults Design Group $4.9 100%
12/12/16 Fantastic Holdings Limited Steinhoff Asia Pacific $275.1 100%
12/1/16 Macro International AB Svedbergs i Dalstorp AB $21.8 100%
Option: Yellow USA Target names
The disclosures and limitations of this research on this page are an integral part of this report. Copyright © 2017 Cogent Valuation. All Rights Reserved. COGENTVALUATION.COM
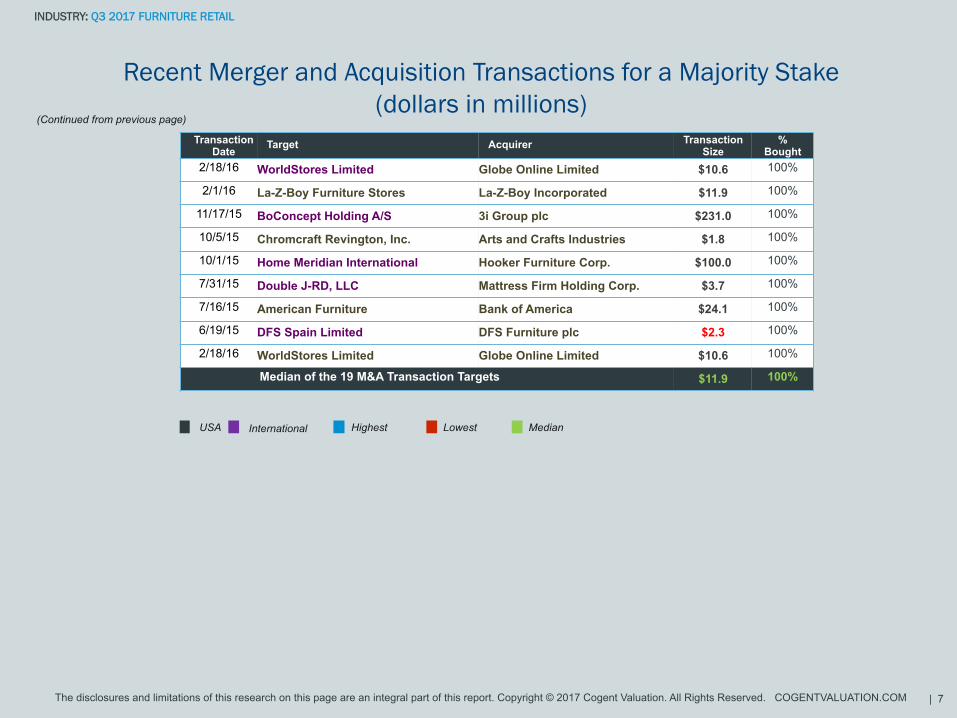
Recent Merger and Acquisition Transactions for a Majority Stake (dollars in millions)
INDUSTRY: Q3 2017 FURNITURE RETAIL
Transaction Date Target Acquirer Transaction
Size %
Bought 2/18/16 WorldStores Limited Globe Online Limited $10.6 100%
2/1/16 La-Z-Boy Furniture Stores La-Z-Boy Incorporated $11.9 100%
11/17/15 BoConcept Holding A/S 3i Group plc $231.0 100%
10/5/15 Chromcraft Revington, Inc. Arts and Crafts Industries $1.8 100%
10/1/15 Home Meridian International Hooker Furniture Corp. $100.0 100%
7/31/15 Double J-RD, LLC Mattress Firm Holding Corp. $3.7 100%
7/16/15 American Furniture Bank of America $24.1 100%
6/19/15 DFS Spain Limited DFS Furniture plc $2.3 100%
2/18/16 WorldStores Limited Globe Online Limited $10.6 100%
Median of the 19 M&A Transaction Targets $11.9 100%
| 7
(Continued from previous page)
USA International Highest Lowest Median
Option: Grey USA Target names
The disclosures and limitations of this research on this page are an integral part of this report. Copyright © 2017 Cogent Valuation. All Rights Reserved. COGENTVALUATION.COM
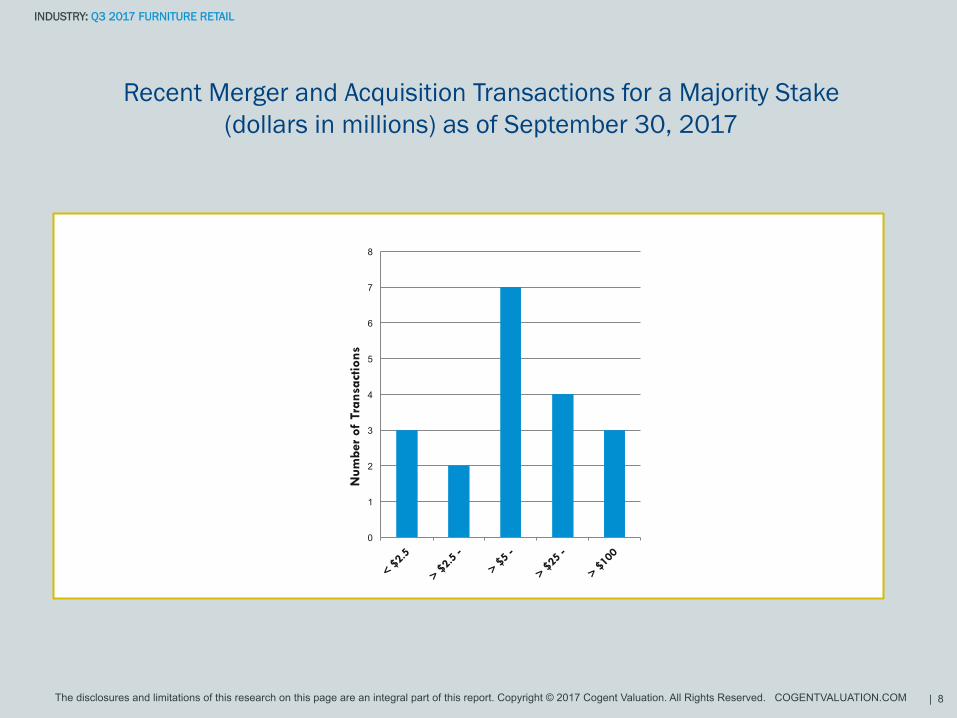
Recent Merger and Acquisition Transactions for a Majority Stake (dollars in millions) as of September 30, 2017
INDUSTRY: Q3 2017 FURNITURE RETAIL
| 8
0
1
2
3
4
5
6
7
8
Num
ber
of T
rans
actio
ns

The disclosures and limitations of this research on this page are an integral part of this report. Copyright © 2017 Cogent Valuation. All Rights Reserved. COGENTVALUATION.COM
COGENT VALUATION is a nationally recognized full service business valuation firm that has provided
independent valuation and financial advisory opinions in thousands of situations since 1991. These
assignments include the valuation of companies and pass-through entities, their securities, and their
intangible assets ranging in size from small, closely-held businesses and start-ups, to corporations with
market values over a billion dollars, covering almost every industry and all types of transactions. With the
collective backgrounds of our managing directors and professional staff, Cogent Valuation brings
substantial large deal experience to bear on our middle market transaction opinions. Cogent
Valuation utilizes proprietary research, intensive due diligence, and the experience and insights of its
professionals to produce thoughtful, well-documented opinions that have consistently withstood the
scrutiny of clients and their advisors, investors, regulators, and courts.
This industry research is provided at no charge to Cogent Valuation's clients. Research or detailed information not
covered in this report can be obtained for a fee. Contact Steven Kam at 415-392-0888 for additional information or
questions in connection with this research report.
| 9

The disclosures and limitations of this research on this page are an integral part of this report. Copyright © 2017 Cogent Valuation. All Rights Reserved. COGENTVALUATION.COM
Definitions of Financial Terms Used in this Quarterly Industry Update: Enterprise Value (EV): Market Value of Equity + Market Value of Debt
—Cash Earnings Before Interest, Taxes, Depreciation and Amortization (EBITDA): Profitability metric sometimes also referred to as operating
profit or operating earnings.
Gross Cash Flows: Net Income + Depreciation and Amortization Expense Latest Twelve Months (LTM): Financial information is as of the latest
twelve months through the date of this Quarterly Industry Update.
Disclosures and Limitations: This research report is for informational and discussion purposes only. Information presented herein is not
investment advice of any kind to any person and does not constitute a recommendation as to the purchase or sale of any interests or as to any
other course of action. General, financial, and statistical information concerning the details of this report and related industry are from sources
Cogent Valuation believes to be reliable. Cogent Valuation has accurately reflected such information in this research report; however, Cogent
Valuation makes no representation as to the sources’ accuracy or completeness and has accepted this information without further verification.
Neither all nor any part of the content of this report may be conveyed to the public through advertising, public relations, news, sales, mail, direct
transmittal, or other media without the prior written consent of Cogent Valuation. Cogent Valuation's research is as of the date reported herein.
Cogent Valuation has no affiliation with any of the companies comprising the industry used as a basis for research in this report, nor does Cogent
Valuation hold any investments in the companies listed herein. The content of this report may be used, in part, as a basis for any work that Cogent
Valuation performs for you in the future at the sole discretion of Cogent Valuation. THIS REPORT IS NOT TO BE USED OR CONSIDERED
UNDER ANY CIRCUMSTANCE BY ANYONE AS INVESTMENT ADVICE.
| 10