2017 third quarter report - denison mines · 2017 third quarter report ... discovery of high-grade...
TRANSCRIPT

Focused.
Experienced.
Growing.
2017 THIRD QUARTER REPORT


2017 THIRD QUARTER REPORT
FOR THE THREE AND NINE MONTHS
ENDED SEPTEMBER 30, 2017
TABLE OF CONTENTSMANAGEMENT’S DISCUSSION AND ANALYSIS 2
2017 THIRD QUARTER HIGHLIGHTS 2
ABOUT DENISON 3
RESULTS OF CONTINUING OPERATIONS 4
DISCONTINUED OPERATIONS 14
OUTLOOK FOR 2017 18
CAUTIONARY STATEMENT REGARDING FORWARD‐LOOKING STATEMENTS 20
INTERIM CONSOLIDATED FINANCIAL STATEMENTS 21

MANAGEMENT’S DISCUSSION & ANALYSIS
2
This Management’s Discussion and Analysis (“MD&A”) of Denison Mines Corp. and its subsidiary companies and joint arrangements (collectively, “Denison” or the “Company”) provides a detailed analysis of the Company’s business and compares its financial results with those of the previous year. This MD&A is dated as of October 31, 2017 and should be read in conjunction with the Company’s unaudited interim consolidated financial statements and related notes for the three and nine months ended September 30, 2017. The unaudited interim consolidated financial statements are prepared in accordance with International Financial Reporting Standards (“IFRS”) as issued by the International Accounting Standards Board (“IASB”). Readers are also encouraged to consult the audited consolidated financial statements and MD&A for the year ended December 31, 2016. All dollar amounts are expressed in U.S. dollars, unless otherwise noted. Additional information about Denison, including the Company’s press releases, quarterly and annual reports, Annual Information Form and Form 40-F is available through the Company’s filings with the securities regulatory authorities in Canada at www.sedar.com ("SEDAR") and the United States at www.sec.gov/edgar.shtml ("EDGAR").
2017 THIRD QUARTER PERFORMANCE HIGHLIGHTS Discovery of high-grade unconformity mineralization in new E series lenses at the Gryphon deposit
Drill hole WR-689D3, on the Company's 60% owned Wheeler River project, intersected high-grade unconformity-hosted uranium mineralization approximately 250 metres along strike to the northeast and 200 metres up-dip of the Gryphon deposit. Preliminary radiometric equivalent probe results ("eU3O8") from drill hole WR-689D3 are highlighted by an interval of 5.0% eU3O8 over 4.7 metres, including 8.5% eU3O8 over 2.7 metres. This intersection adds to other high-grade intersections, at or immediately below the unconformity, in the newly defined E series lenses, which occur outside of the current resources estimated for the Gryphon deposit. Other highlights of the E series lens intersections include 19.3% U3O8 over 1.0 metres (drill hole WR-507D2), and 6.2% U3O8 over 2.5 metres (drill hole WR-646) (see Denison's press releases dated May 26, 2016 and November 17, 2016).
Continued expansion of the Gryphon D series lenses including thick and high-grade intersections
Drill holes from the summer 2017 drilling program, testing for additional mineralization within the D series of lenses, outside of the Gryphon resource area, returned positive results, with the potential to add meaningful resources to the Gryphon deposit. An update to the resource estimate for the project is planned for later in 2017. A total of fifteen drill holes have been reported for the D series lenses, with results expanding the mineralized zone outwards from drill holes WR-641 (5.3% U3O8 over 11.0 metres) and WR-633D3 (1.3% U3O8 over 3.0 metres, plus 3.3% U3O8 over 13.5 metres, and 6.2% U3O8 over 2.5 m) (see Denison’s press releases dated May 26, 2016 and May 26, 2017). Preliminary radiometric equivalent grade results to date are highlighted by 3.5% eU3O8 over 3.2 metres (drill hole WR-621D2), 4.8% eU3O8 over 3.7 metres (drill hole WR-694), 3.8% eU3O8 over 3.7 metres (drill hole WR-690D2), 2.0% eU3O8 over 5.2 metres (drill hole WR-657D1) and 6.4% eU3O8 over 1.0 metre (drill hole WR-690D1).
Discovery of the new high-grade basement-hosted Huskie zone at Waterbury Lake
A new high-grade, and basement-hosted, zone of uranium mineralization was discovered approximately 1.5 kilometres to the northeast of the property’s J Zone deposit. The zone has been named the “Huskie” zone and was discovered during the summer 2017 drilling program at Waterbury Lake. The nine drill hole program, completed on an approximate 50 x 50 metre spacing, included seven mineralized holes with high-grades occurring in four holes. Highlight assay results included 9.1% U3O8 over 3.7 metres, including 16.8% U3O8 over 2.0 metres (drill hole WAT17-446A), 1.7% U3O8 over 7.5 metres, including 8.2% U3O8 over 1.5 metres (drill hole WAT17-449) and 1.5% U3O8 over 4.5 metres, including 3.9% U3O8 over 1.0 metre (drill hole WAT17-450A). The mineralized zone occurs between 50 and 175 metres vertically below the sub-Athabasca unconformity (265 and 390 metres vertically below surface). The zone measures approximately 100 metres along strike (the current extent of drilling), up to 120 metres along dip, with individual lenses varying in interpreted true thickness between approximately 2 and 7 metres. The zone is wide-open in all directions.

MANAGEMENT’S DISCUSSION & ANALYSIS
3
ABOUT DENISON Denison was formed under the laws of Ontario and is a reporting issuer in all Canadian provinces. Denison’s common shares are listed on the Toronto Stock Exchange (the “TSX”) under the symbol “DML” and on the NYSE American exchange (the “NYSE MKT”) under the symbol “DNN”. Denison is a uranium exploration and development company with interests focused in the Athabasca Basin region of northern Saskatchewan, Canada. In addition to its 60% owned Wheeler River project, which hosts the high grade Phoenix and Gryphon uranium deposits, Denison's exploration portfolio consists of numerous projects covering approximately 355,000 hectares in the Athabasca Basin region, including 335,000 hectares in the infrastructure rich eastern portion of the Athabasca Basin. Denison's interests in Saskatchewan also include a 22.5% ownership interest in the McClean Lake joint venture (“MLJV”), which includes several uranium deposits and the McClean Lake uranium mill, which is currently processing ore from the Cigar Lake mine under a toll milling agreement, plus a 25.17% interest in the Midwest deposit and a 64.22% interest in the J Zone deposit and newly discovered Huskie zone on the Waterbury Lake property. The Midwest and J Zone deposits, as well as the Huskie zone, are located within 20 kilometres of the McClean Lake mill. Denison is engaged in mine decommissioning and environmental services through its Denison Environmental Services (“DES”) division, which manages Denison’s Elliot Lake reclamation projects and provides post-closure mine and maintenance services to a variety of industry and government clients. Denison is also the manager of Uranium Participation Corporation (“UPC”), a publicly traded company listed on the TSX under the symbol “U”, which invests in uranium oxide in concentrates (“U3O8”) and uranium hexafluoride (“UF6”).
SELECTED QUARTERLY FINANCIAL INFORMATION
(in thousands)
As at September 30,
2017
As at December 31,
2016 Financial Position: Cash and cash equivalents $ 4,393 $ 11,838 Investment in debt instruments (GIC’s) $ 32,215 $ - Cash, cash equivalents and GIC’s $ 36,608 $ 11,838 Working capital $ 31,572 $ 9,853 Property, plant and equipment $ 200,377 $ 187,982 Total assets $ 263,168 $ 217,423 Total long-term liabilities $ 65,753 $ 37,452
2017 2017 2017 2016 (in thousands, except for per share amounts) Q3 Q2 Q1 Q4
Continuing Operations: Total revenues $ 2,717 $ 2,611 $ 2,601 $ 3,351 Net loss $ (5,777) $ (6,423) $ (646) $ (916) Basic and diluted loss per share $ (0.01) $ (0.01) $ - $ - Discontinued Operations:
Net loss $ - $ (81) $ - $ (9,082) Basic and diluted loss per share $ - $ - $ - $ (0.01)

MANAGEMENT’S DISCUSSION & ANALYSIS
4
2016 2016 2016 2015 (in thousands, except for per share amounts) Q3 Q2 Q1 Q4
Continuing Operations: Total revenues $ 3,489 $ 3,663 $ 3,330 $ 3,887 Net loss $ (2,506) $ (3,832) $ (4,445) $ (5,274) Basic and diluted loss per share $ - $ (0.01) $ (0.01) $ (0.01)
Discontinued Operations:
Net profit (loss) $ 9,050 $ (450) $ (5,162) $ (10,926) Basic and diluted profit (loss) per share $ 0.01 $ - $ (0.01) $ (0.02)
Significant items causing variations in quarterly results
The Company’s toll milling revenues over the last several quarters have fluctuated due to the timing of uranium processing at the McClean Lake mill as well as the impact of the toll milling financing transaction in the first quarter of 2017.
Revenues from Denison Environmental Services fluctuate due to the timing of projects, which vary throughout the year in the normal course of business.
Exploration expenses are generally largest in the first quarter and third quarter, due to the timing of the winter and summer exploration programs in Saskatchewan.
The Company’s results are also impacted, from time to time, by other non-recurring events arising from its ongoing activities.
RESULTS OF CONTINUING OPERATIONS
REVENUES McClean Lake Uranium Mill McClean Lake is located on the eastern edge of the Athabasca Basin in northern Saskatchewan, approximately 750 kilometres north of Saskatoon. Denison holds a 22.5% ownership interest in the MLJV and the McClean Lake uranium mill, one of the world’s largest uranium processing facilities, which is currently processing ore from the Cigar Lake mine under a toll milling agreement and is operated by AREVA Resources Canada (“ARC”). The MLJV is a joint venture between ARC with a 70% interest, Denison with a 22.5% interest and OURD (Canada) Co. Ltd. with a 7.5% interest. On February 13, 2017, Denison closed an arrangement with Anglo Pacific Group PLC and one of its wholly owned subsidiaries (the “APG Transaction”) under which Denison received an upfront payment of $32,860,000 (CAD$43,500,000) in exchange for its right to receive future toll milling cash receipts from the MLJV under the current toll milling agreement with the Cigar Lake Joint Venture (“CLJV”) from July 1, 2016 onwards.
The APG Transaction represents a contractual obligation of Denison to forward to APG any cash proceeds of toll milling revenue earned by the Company after July 1, 2016 related to the processing of the specified Cigar Lake ore through the McClean Lake mill, and as such, the upfront payment has been accounted for as deferred revenue. The Company has reflected payments made to APG of $2,659,000 (CAD$3,520,000), representing the Cigar Lake toll milling cash receipts received by Denison in respect of toll milling activity for the period from July 1, 2016 through January 31, 2017, as a reduction of the initial upfront amount received, reducing the initial deferred revenue balance to $30,201,000 (CAD$39,980,000). During the nine months ended September 30, 2017, the McClean Lake mill continued to process ore received from the Cigar Lake mine, and packaged approximately 13.0 million pounds U3O8 for the CLJV. The Company recognized total toll milling revenue for the three and nine months ended September 30, 2017 of $456,000 and $1,892,000, respectively. The Company’s share of toll milling revenue for January 2017 of $444,000, prior to the closing of the APG Transaction, was recognized as toll milling revenue in the first quarter of 2017. Following the closing of the APG Transaction, CAD$2,979,000 in toll milling cash receipts were received from the MLJV, and for the three and nine months ended September 30, 2017, the Company recognized toll milling revenue from the draw-down of deferred revenue of $456,000 and $1,448,000, respectively. See SIGNIFICANT ACCOUNTING POLICIES below for further details. In the nine months ended September 30, 2016, the mill packaged approximately 12.4 million pounds of U3O8 for the CLJV and the Company’s share of toll milling revenue during the three and nine months ended September 30, 2016 was $1,037,000 and $3,388,000 respectively.

MANAGEMENT’S DISCUSSION & ANALYSIS
5
Denison Environmental Services Revenue from DES during the three and nine months ended September 30, 2017 was $2,007,000 and $5,216,000 respectively, compared to $2,077,000 and $5,974,000 during the same periods in 2016. In the three and nine months ended September 30, 2017, DES experienced a decrease in Canadian dollar revenues due to a decrease in activity at certain care and maintenance sites as well as a reduction in non-recurring consulting revenues. Management Services Agreement with Uranium Participation Corporation (“UPC”) Revenue from the Company’s management contract with UPC was $254,000 and $821,000, respectively, during the three and nine months ended September 30, 2017, compared to $375,000 and $1,120,000 during the same periods in 2016. The decrease in revenues was predominantly due to a reduction in the management fees earned based on UPC’s monthly net asset value. UPC’s balance sheet consists primarily of uranium held either in the form of U3O8 or UF6, which is accounted for at its fair value. The fair value of uranium holdings was significantly lower during the nine months ended September 30, 2017, compared to same period during 2016, due to a decline in uranium spot prices. In addition, during the third quarter of 2016, the Company recognized $77,000 in transaction-related discretionary fee revenue. No similar transaction-related fee revenue has been recognized in the three and nine months ended September 30, 2017. CANADIAN MINERAL PROPERTY EXPLORATION & EVALUATION During 2017, the Company has remained active on its portfolio of projects in the Athabasca Basin region in Saskatchewan. Denison’s share of exploration and evaluation expenditures was $4,348,000 and $11,095,000, respectively, during the three and nine months ended September 30, 2017, compared to $3,308,000 and $10,037,000 during the same periods in 2016. During the third quarter in 2017, the Company’s increased exploration and evaluation expenditures, as compared to the prior year, were primarily due to a higher level of activity at the Wheeler River project. Exploration spending in the Athabasca Basin is seasonal, with spending higher during the winter exploration season (January to mid-April) and summer exploration season (June to mid-October). The following table summarizes the exploration activities for the period from January 1, 2017 through mid-October 2017. All exploration and evaluation expenditure information in this MD&A covers the three and nine months ended September 30, 2017.
EXPLORATION & EVALUATION ACTIVITIES
Property Denison’s ownership Drilling in metres (m) Other activities
Wheeler River 60%(1) 41,849 (84 holes) PFS activities
Murphy Lake 78.96%(2) 3,433 (9 holes) -
Waterbury Lake 64.22%(3) 8,525 (18 holes) -
Crawford Lake 100% 2,587 (5 holes) Geophysical surveys
Hook-Carter 80%(4) - Geophysical surveys
Moon Lake South 51%(5) - Geophysical surveys
South Dufferin 100% - Geophysical surveys
Bachman Lake 100% - Geophysical surveys
Wolly 22.76%(6) 5,029 (17 holes) -
McClean Lake 22.5% 5,870 (20 holes) -
Total 67,293 (153 holes) Notes: 1. Denison is expected to increase its ownership of the Wheeler River project to approximately 66% by the end of 2018. 2. The Company’s ownership as at December 31, 2016. The partner, Eros Resources Corp. has elected not to fund the 2017 program and will dilute
their respective ownership interest. As a result, Denison’s interest will increase. 3. The Company earned an additional 0.62% interest in the Waterbury Lake property effective May 31, 2017 and an additional 0.59% interest effective
August 31, 2017 Refer to RELATED PARTY TRANSACTIONS below for further details. 4. The Company acquired an 80% ownership in the project in November 2016 from ALX Uranium Corp. (“ALX”) and has agreed to fund ALX’s share of
the first CAD$12.0 million in expenditures on the project. 5. In accordance with the January 2016 letter agreement with CanAlaska Uranium Ltd., Denison earned a 51% interest in the Moon Lake South claim in
April 2017. 6. The Company’s ownership as at December 31, 2016. The Company has elected not to fund its share of joint venture expenditures in 2017 and will
dilute its interest by an estimated 1.1%.

MANAGEMENT’S DISCUSSION & ANALYSIS
6
The Company’s land position in the Athabasca Basin, as of September 30, 2017, is illustrated below. The Company’s Athabasca land package decreased during the third quarter from 359,313 hectares (249 claims) to 346,761 hectares (244 claims), as certain low priority claims were allowed to lapse where no further work was warranted.
Wheeler River Project The Wheeler River property is host to the high-grade Phoenix and Gryphon uranium deposits, discovered by Denison in 2008 and 2014 respectively. The Phoenix deposit is estimated to include indicated resources of 70.2 million pounds U3O8 (above a cut-off grade of 0.8% U3O8) based on 166,000 tonnes of mineralization at an average grade of 19.1% U3O8, and is the highest grade undeveloped uranium deposit in the world. The Gryphon deposit is hosted in basement rock, approximately 3 kilometres to the northwest of Phoenix, and was last estimated in 2015 to contain inferred resources of 43.0 million pounds U3O8 (above a cut-off grade of 0.2% U3O8) based on 834,000 tonnes of mineralization, at an average grade of 2.3% U3O8. The Wheeler River property lies between the McArthur River Mine and the Key Lake mill complex in the eastern portion of the Athabasca Basin in northern Saskatchewan – a well-established uranium mining district with infrastructure including the provincial power grid, all-weather provincial highways and haul roads, air transportation infrastructure and multiple uranium processing facilities, including the 22.5% Denison owned McClean Lake mill. The ore haul road and provincial power line between the McArthur River Mine and the Key Lake mill complex runs along the eastern side of the Wheeler River property. Denison is the operator of the Wheeler River project and holds a 60% interest, while Cameco Corp. (“Cameco”) holds a 30% interest and JCU (Canada) Exploration Company, Limited (“JCU”) holds a 10% interest. As previously announced on January 10, 2017, Denison has entered into an agreement with its Wheeler River Joint Venture partners, Cameco and JCU to fund 75% of Joint Venture expenses in 2017 and 2018 (ordinarily 60%) in exchange for an increase in Denison's interest in the project to up to approximately 66%. Under the terms of the agreement, Cameco will fund 50% of its ordinary 30% share in 2017 and 2018, and JCU is expected to continue to fund its 10% interest in the project.

MANAGEMENT’S DISCUSSION & ANALYSIS
7
Further details regarding the Wheeler River Project are provided in the Company’s NI 43-101 technical report entitled “Preliminary Economic Assessment for the Wheeler River Uranium Project, Saskatchewan, Canada”, (the “PEA”) with an effective date of March 31, 2016. A copy of the PEA is available on the Company’s website and on both SEDAR and EDGAR. The Wheeler River property location and basement geology map is provided below.
Exploration Program Denison’s share of exploration costs for the three and nine months ended September 30, 2017 at Wheeler River amounted to $3,064,000 and $6,220,000 respectively, compared to $1,736,000 and $4,364,000 during the same periods in 2016. Field activities during the third quarter of 2017 included continuation of the summer 2017 drilling program, which commenced in late May (see Denison’s press release dated June 6, 2017). A total of 27,116 metres in 58 holes were completed as part of the summer 2017 drilling program through mid-October 2017. Preliminary radiometric equivalent results for 34 holes were reported in our press releases dated July 24, 2017 and August 30, 2017. In early September, Denison announced a significant increase to the summer 2017 drilling program with the addition of approximately 16 drill holes (6,500 metres) (see Denison’s press release dated September 12, 2017). The summer drilling program is currently expected to include approximately 30,000 metres in 64 holes. The summer 2017 program includes drilling to increase the confidence of the Gryphon resource to an indicated category, and to potentially expand the size of the resource, ahead of an updated resource estimate scheduled for later in the year, and the Pre-Feasibility Study ("PFS") scheduled for 2018.

MANAGEMENT’S DISCUSSION & ANALYSIS
8
The definition drilling on the current inferred resources has continued to show good consistency with the current inferred resource block model. Furthermore, the program has resulted in the successful expansion of the A, B and D series of mineralized lenses, as well as the recognition and expansion of the new E series lenses (see Denison's press releases dated July 24 and August 30, 2017). Most notably, the D and E series lenses are not included in the current resources estimated for the Gryphon deposit. Summer 2017 Highlights from Preliminary Radiometric Equivalent Grades Drilling continued within the Gryphon D series lenses to potentially add indicated or inferred resources to the Gryphon deposit. A drill spacing of approximately 25 x 25 metres is being implemented around previous high-grade results which included 3.3% U3O8 over 13.5 metres, 6.2% U3O8 over 2.5 metres and 1.3% U3O8 over 3.0 metres in drill hole WR-633D3, and 5.3% U3O8 over 11.0 metres in drill hole WR-641. Highlight radiometric equivalent probe results for drill holes targeting the D series lenses from the summer 2017 program are provided in the table below. The results include highlights from Denison’s press release dated July 24, 2017 (reported in the 2017 second quarter MD&A) and results from Denison’s press release dated August 30, 2017. The table also includes results for the newly defined E series lenses as the orientation of the drill holes allow for testing of both series of lenses.
HIGHLIGHT RADIOMETRIC EQUIVALENT PROBE RESULTS
FOR DRILL HOLES TARGETING THE GRYPHON D & E SERIES LENSES
Hole Number From (m)
To (m)
Length5 (m)
eU3O8 (%)1,2,4
Lens Designation
WR-694 722.8 726.5 3.7 4.8 D Series including3 723 725.5 2.5 7 D Series WR-689D3 547.4 552.1 4.7 5 E Series including3 548.9 551.6 2.7 8.5 E Series
WR-690D1 724 725 1 6.4 D Series WR-690D2 711 714.7 3.7 3.8 D Series including3 711.2 714.5 3.3 4.2 D Series
WR-654D1 745.2 746.4 1.2 4.3 D Series including3 745.4 746.4 1 5.1 D Series
WR-638D4 710.6 715.2 4.6 1.5 A Series6 including3 712.4 715 2.6 2.5 A Series6
and 786.1 787.9 1.8 3.3 D Series including3 786.7 787.8 1.1 5.1 D Series
WR-657D1 708.2 713.4 5.2 2 D Series including3 708.6 711.7 3.1 3.1 D Series WR-6917 810.9 813.2 2.3 2.7 D Series
including3,7 811.5 812.8 1.3 4.5 D Series WR-621D17 752.5 754.5 2 3.2 D Series including3,7 752.8 753.8 1 6.1 D Series WR-621D27 752.8 756 3.2 3.5 D Series
Notes: 1. eU3O8 is radiometric equivalent U3O8 from a calibrated total gamma downhole probe. eU3O8 results are preliminary in nature
and all mineralized intervals will be sampled and submitted for chemical U3O8 assay. 2. Intersection interval is composited above a cut-off grade of 0.1% eU3O8 unless otherwise indicated. 3. Intersection interval is composited above a cut-off grade of 1.0% eU3O8. 4. Composites are compiled using 1.0 metre minimum ore thickness and 2.0 metres maximum waste. 5. As the drill holes are oriented steeply toward the northwest the true thickness of both the basement and unconformity
mineralization is expected to be approximately 75% of the intersection lengths (the basement mineralization is interpreted to dip moderately to the southeast and the unconformity mineralization is interpreted to be flat-lying).
6. Drill holes targeting the D series lens mineralization, in some cases, also intersect mineralization in the A and/or B and/or E series lenses outside of the Gryphon resource area.
7. Reported in second quarter MD&A.

MANAGEMENT’S DISCUSSION & ANALYSIS
9
Definition drilling on the Gryphon deposit’s A, B and C series lenses continues as part of the summer 2017 program, to upgrade the current inferred resources of the Gryphon deposit to an indicated level of confidence. Additional holes were also completed around the fringes of the A, B and C series lenses, outside of the current resources estimated for the Gryphon deposit, with the objective of adding additional resources. The table below provides highlight radiometric equivalent probe results for definition drill holes from Denison’s press release dated August 30, 2017. Additional results for the summer 2017 program are provided in Denison’s press release dated July 24, 2017 and summarized in Denison’s MD&A for the three and six months ended June 30, 2017.
HIGHLIGHT RADIOMETRIC EQUIVALENT PROBE RESULTS FOR GRYPHON DEPOSIT INFILL AND DELINEATION DRILL HOLES
Hole Number From (m)
To (m)
Length5 (m)
eU3O8 (%)1,2,4
Lens Designation
WR-572D1 639.5 661.3 21.8 1.3 A Series including3 650.7 651.9 1.2 2.5 A Series including3 654.9 660.2 5.3 3.9 A Series
WR-564D2 735.5 739.4 3.9 1.8 A Series including3 737.0 739.0 2.0 3.2 A Series
WR-564D3 716.3 721.7 5.4 5.8 A Series including3 717.9 720.7 2.8 11 A Series
Notes: 1. eU3O8 is radiometric equivalent U3O8 from a calibrated total gamma downhole probe. eU3O8 results are preliminary in nature
and all mineralized intervals will be sampled and submitted for chemical U3O8 assay. 2. Intersection interval is composited above a cut-off grade of 0.1% eU3O8 unless otherwise indicated. 3. Intersection interval is composited above a cut-off grade of 1.0% eU3O8. 4. Composites are compiled using 1.0 metre minimum ore thickness and 2.0 metres maximum waste. 5. As the drill holes are oriented steeply toward the northwest and the basement mineralization is interpreted to dip moderately
to the southeast, the true thickness of the mineralization is expected to be approximately 75% of the intersection lengths. Exploration Pipeline Properties Waterbury Lake The summer 2017 drilling program at Waterbury Lake, comprising 3,722 metres in nine holes, has led to the discovery of a new zone of high-grade basement-hosted uranium mineralization, named the “Huskie” zone. The summer program commenced in late July 2017 and was originally designed to include six exploration drill holes over 2,650 metres. The first drill hole of the program, WAT17-443, returned a high-grade uranium intersection in the basement rock (see Denison’s press release dated August 1, 2017). Following this result, a further eight holes were completed, including three additional holes, announced as part of an expanded program, on an approximate 50 x 50 metre spacing. Of the nine drill holes completed, seven intersected significant mineralization, including high-grade intersections in four holes (see Denison’s press releases dated August 22, and September 19, 2017). The Huskie zone is located on an east-west geological trend, located approximately 1.5 kilometres to the north of the property’s J Zone deposit. Drill testing to date has allowed for the wide-spaced definition of a zone of entirely basement-hosted mineralization, with geological features consistent with basement-hosted deposits in the Athabasca Basin. The mineralized zone, which covers the extent of the current drilling, occurs between 50 and 175 metres vertically below the sub-Athabasca unconformity (265 and 390 metres vertically below surface) and measures approximately 100 metres along strike, up to 120 metres along dip, with individual lenses varying in interpreted true thickness between approximately 2 and 7 metres. The zone is wide-open in all directions in terms of the mineralization and associated alteration intersected.

MANAGEMENT’S DISCUSSION & ANALYSIS
10
Assay results were received in early October and included the following highlights (see Denison’s press release dated October 11, 2017):
HIGHLIGHT SUMMER 2017 ASSAY RESULTS FOR THE HUSKIE ZONE
Hole Number From (m)
To (m)
Length5 (m)
U3O8 (%)1,2,4
WAT17-443 298.0 299.0 1.0 1.2 WAT17-446A 306.5 310.2 3.7 9.1
including3 307.7 309.7 2.0 16.8 WAT17-449 369.0 376.5 7.5 1.7 including3 375.0 376.5 1.5 8.2
and 379.3 384.3 5.0 0.29 including3 380.8 381.8 1.0 1.0
WAT17-450A 318.5 323.0 4.5 1.5 including3 319.0 320.0 1.0 3.9 including3 321.5 322.5 1.0 2.0
Notes: 1. U3O8 is the chemical assay of mineralized split core samples. 2. Intersection interval is composited above a cut-off grade of 0.05% U3O8 unless otherwise indicated. 3. Intersection interval is composited above a cut-off grade of 1.0% U3O8. 4. Composites are compiled using 1.0 metre minimum ore thickness and 2.0 metres maximum waste. 5. As the drill holes are oriented steeply toward the south-southeast and the mineralized lenses are
interpreted to dip moderately to the north, the true thickness of mineralization is expected to be approximately 75% of the intersection lengths.
Maps of the location of the Huskie zone, and highlight assays results shown on the inclined longitudinal section, are provided below.

MANAGEMENT’S DISCUSSION & ANALYSIS
11
Other Properties Exploration activities at other pipeline properties during the third quarter of 2017 included completion of ground geophysical surveys on the Denison-operated Hook-Carter project. Denison elected to defer the Hook-Carter drilling program planned for the late summer of 2017 to the winter of 2018 (see Denison’s press release dated September 12, 2017). Higher costs associated with helicopter-supported drilling programs in summer months, complications with forest fires in the area, and the integration and interpretation of significant amounts of ground geophysical data acquired earlier this year, were all contributing factors to the decision to defer the program into 2018. The drilling program originally planned for the summer of 2017 included a reconnaissance five-hole drill program of approximately 2,700 metres. The Hook-Carter project is owned 80% by Denison and 20% by ALX Uranium Corp. and is highlighted by 15 kilometres of strike potential along the prolific Patterson Corridor, which hosts the recently discovered Triple R deposit (Fission Uranium Corp.), Arrow deposit (NexGen Energy Ltd.), and Spitfire discovery (Purepoint Uranium Group Inc., Cameco , and ARC). At Crawford Lake (Denison 100% interest), four holes were completed during the third quarter of 2017, for a total of 2,068 metres. Three of the holes targeted the CR-3 conductive trend and one hole targeted a parallel conductive trend to the CR-3. Two of the three holes on the CR-3 intersected significant alteration including 250 metres of strong sandstone alteration in CR-17-32 along with total gamma radioactivity of 650 counts per second in fractures at the unconformity. The drill hole (CR-17-31) testing the parallel trend intersected strong sandstone alteration and structure higher up in the sandstone, suggesting the optimal target was overshot. The CR-3 area (including parallel trends) remains highly prospective with continued discovery of weak uranium mineralization at the unconformity and limited

MANAGEMENT’S DISCUSSION & ANALYSIS
12
historical drilling. The geochemistry and clay results from the summer program are currently being evaluated and will assist in the development of both unconformity and basement targets for future drill programs. At McClean Lake, an exploration program operated by ARC (22.5% Denison), including a total of 5,870 metres of drilling in 20 drill holes, was completed during the summer months. No significant mineralization was reported. Evaluation Program During the three and nine months ended September 30, 2017, Denison’s share of evaluation costs at Wheeler River amounted to $427,000 and $1,151,000, respectively (2016 - $323,000 and $453,000), which related to work on a pre-feasibility study (“PFS”) and environmental activities. PFS Activities In 2016, Denison announced the initiation of a PFS for the Wheeler River project, including commencing a drilling program to increase the level of confidence of the previously released inferred resource estimate for the Gryphon deposit to an indicated level. Refer to the Exploration Programs section below for results of the infill and delineation drill holes completed during the winter and summer 2017 programs. Engineering Activities As part of the PFS activities at Wheeler River to date, the Company commenced engineering data collection programs, including geotechnical and hydrogeological field studies. Geotechnical and hydrogeological data collection programs were initiated to assess ground and water conditions in the mineralized zones, as well as the surrounding host rock. The geotechnical information will be used to guide the location of underground development and the design of ground support systems for both the shafts and the mine. This information is also expected to be used in the production planning process, including the determination of optimum stope sizes and mine production sequencing. The hydrogeological information will be used to 1) evaluate routine and potential non-routine water inflows to the underground operation, 2) develop design criteria for ground freezing applications, mine dewatering and water treatment plant systems, and 3) understand potential interactions of the project with the environment. Other work performed relating to the PFS during 2017 included the following:
Twinning five historic Phoenix drill holes; Drilling a 600m shaft pilot hole for the main production shaft at Gryphon; and Collecting basic geotechnical information on approximately 50,000m of exploration drilling.
The Company also initiated an advanced metallurgical test program. This test program builds upon the basic metallurgical testing completed in 2014 and 2015, and aims to optimize the processing parameters for both the Gryphon and Phoenix deposits, including the grind size, leach residence time and recovery, reagent usage and consumption, and overall uranium recoveries. Previous test results indicated recoveries over 99% are possible after 10-12 hours of residence time following a coarse grinding process. Moderate reagent consumption levels were required in line with other Athabasca Basin ores. A high purity U3O8 product can be produced, that meets all specifications from ASTM C967‐13 "Standard Specifications for Uranium Ore Concentrate" with no deleterious elements. The advanced metallurgical testing program will evaluate the potential for hydrogen evolution during processing, and will identify and characterize tailings and raffinate by-products from processing. Additional metallurgical cores have been sent for testing starting in the fourth quarter of 2017 at New AREVA’s Mining Innovation Center (CIM) in France.
In addition to the engineering fieldwork described above, the Company also continued to investigate alternate mining methods at Phoenix. During the PEA, mining of Phoenix using a Jet Boring System (“JBS”) similar to Cigar Lake mining operations was evaluated, and the results indicated that the method, while economic, was capital intensive with long lead times to development, higher risk with technically challenging ground conditions, and ultimately generated a lower operating margin than the conventional mining methods evaluated for the Gryphon deposit. After significant analysis and evaluation, utilizing a number of specialized engineering providers, potentially viable mining alternatives have been identified, which could allow for the extraction of the Phoenix deposit from surface. These methods have the potential to result in a significant improvement in operating economics at Phoenix, while reducing capital, time to development, and technical risk. The Company’s PFS activities are expected to advance these applications to a robust engineering application. Other engineering works continues ahead of the completion of the PFS, including:
Shaft Excavation: Detailed evaluations (including site visits) and trade-off studies were completed to select the preferred shaft excavation method;

MANAGEMENT’S DISCUSSION & ANALYSIS
13
Water Treatment trade-off studies were initiated to select the preferred treatment technology and water management strategy for the project;
The formal PFS engineering procurement process was initiated in September and October 2017; and Discussions were initiated with the Province for the construction of the Highway 914 extension. This 50km
segment of highway is required to transport Wheeler River ore to McClean Lake.
Environmental Activities During the third quarter of 2017, the Company completed the collection of a full year of environmental baseline data, as part of the ongoing environmental data collection project to help characterize the existing environment in the project area. This data will form the foundation of the environmental assessment for the project. The information will also be used in the design of various aspects of the project, including the location and layout of site infrastructure, the location for treated effluent discharge and fresh water intake, and the designs of water treatment plants, waste storage facilities, and other infrastructure interacting with the environment. Programs in progress in the quarter included:
Aquatic environment: Characterization of the lakes and streams near the project area with key aspects including: water quality, water flow and water levels, lake sediment quality, benthic invertebrate communities, and fish communities;
Terrestrial environment: Data collection and characterization of wildlife, vegetation and soils surrounding the project area including: ecological land classification, breeding bird surveys, ungulate pellet counts, winter tracking surveys, aquatic furbearer shoreline surveys, small mammal trapping, amphibian surveys, characterization of terrain and soil types, vegetation and soil chemistry, vegetation;
Waste rock geochemistry: Analysis of targeted core samples to determine acid and metal leaching potential from waste rock. Additional kinetic testing of the waste rock was initiated in the third quarter of 2017;
Atmospheric environment: Collection of air quality measurements to gather information on pre-development atmospheric conditions; and
Archaeological surveys were completed in the area with no significant findings. These programs are ongoing. In addition, specific environmental modelling programs were initiated to assess project interactions with the environment, including modelling to assess potential water intake and effluent discharge locations. This data will inform the PFS and help to avoid the establishment of infrastructure in environmentally sensitive areas. In addition to the environmental baseline programs, the company also continued with the community consultation and engagement process. OPERATING EXPENSES Canada Mining Operating expenses of the Canadian mining segment include depreciation and development expenses. Operating expenses for the three and nine months ended September 30, 2017 were $794,000 and $2,746,000, respectively, compared to $736,000 and $2,291,000 during the same periods in 2016. During the three and nine months ended September 30, 2017, operating expenses included $532,000 and $2,209,000 respectively, of depreciation related to the McClean Lake mill, compared to depreciation of $533,000 and $1,725,000 during the same periods in 2016. Environmental Services Operating expenses during the three and nine months ended September 30, 2017 totaled $1,803,000, and $4,665,000, respectively, compared to $1,787,000 and $5,125,000 during the same periods in 2016. The expenses relate primarily to care and maintenance as well as environmental consulting services provided to clients, and include labour and other costs. The decline in operating expenses in the nine months ended September 30, 2017, as compared to the same period in the prior year, is predominantly due to the decline in care and maintenance and consulting activities at certain locations. GENERAL AND ADMINISTRATIVE EXPENSES Total general and administrative expenses were $1,169,000 and $4,697,000, respectively, during the three and nine months ended September 30, 2017, compared to $1,020,000 and $3,287,000 during the same periods in 2016. These costs are mainly comprised of head office salaries and benefits, office costs in multiple regions, audit and regulatory costs, legal fees, investor relations expenses, project costs, and all other costs related to operating a public company

MANAGEMENT’S DISCUSSION & ANALYSIS
14
with listings in Canada and the United States. The increase in general and administrative expenses during the nine months ended September 30, 2017 was predominantly the result of $1,162,000 in non-recurring project costs associated with the APG Transaction. IMPAIRMENT – MINERAL PROPERTIES During the three months ended September 30, 2017 the Company recognized $nil impairment expense. During the nine months ended September 30, 2017, the Company recognized an impairment recovery of $246,000 related to the Moore Lake property, based on an update of the estimated recoverable amount remaining to be received under an option agreement with Skyharbour Resources Ltd. During the three and nine months ended September 30, 2016, the Company recognized impairments of $79,000 and $2,253,000, due to the lapsing of certain claims as well as a charge of $2,174,000 recorded against the value of the Moore Lake property. FOREIGN EXCHANGE INCOME AND EXPENSE During the three and nine months ended September 30, 2017, foreign exchange losses of $355,000 and $658,000 were recognized, respectively (September 30, 2016 – foreign exchange income of $481,000 and foreign exchange losses of $1,687,000, respectively). The foreign exchange loss during the quarter was primarily due to unfavourable fluctuations in foreign exchange rates impacting the revaluation of intercompany advances and debt. OTHER INCOME AND EXPENSES During the three and nine months ended September 30, 2017, the Company recognized a loss of $556,000 and a gain of $779,000, respectively, in other income/expense, compared to gains of $519,000 and $767,000 in the same periods in 2016. The gain for the nine months ended September 30, 2017 is predominantly due to net gains in investments carried at fair value of $405,000, as well as a gain of $679,000 recorded in the first quarter of 2017 related to the extinguishment of the toll milling contract liability related to the Cigar Lake toll milling arrangement, offset by letter of credit fees of $238,000. The toll milling contract liability was recognized in 2006 on the acquisition of Denison Mines Inc. by Denison Mines Corp. (formerly International Uranium Corporation) and was extinguished as a result of the Company entering in the APG Transaction, whereby all revenues under the contract have been monetized. The net loss for the three months ended September 30, 2017 is predominantly due to net losses on investments carried at fair value, driven by a decline in fair value of $453,000, in the three month period. Gains and losses on investments carried at fair value are based on the closing share price of the related investments at period end. During the three and nine months ended September 30, 2016, the Company recorded gains on investments carried at fair value of $631,000 and $1,020,000, respectively. EQUITY SHARE OF INCOME FROM ASSOCIATES During the three and nine months ended September 30, 2017, the Company recognized a gain of $173,000 and a loss of $1,004,000, respectively, from its equity share of its associate, GoviEx Uranium Inc. (‘GoviEx’). The loss for the nine months ended September 30, 2017 is predominantly due to an equity loss of $599,000, which is based on the Company’s share of GoviEx’s net loss during the first six months of 2017. In addition, the Company recorded a net dilution loss of $405,000 as the result of an equity issuance completed by GoviEx as well other shareholders’ exercise of GoviEx share warrants, which reduced the Company’s ownership position in GoviEx from 20.68% at December 31, 2016, to approximately 20.24% at September 30, 2017. The gain for the three months ended September 30, 2017, was due to an equity gain of $173,000, which is based on the Company’s share of GoviEx’s net income during the second quarter of 2017. The Company records its share of income from associates a quarter in arrears, based on the most recent financial information available from GoviEx. Due to a significant financing transaction completed by GoviEx in the fourth quarter of 2016, the share of income from associates included for the year ended December 31, 2016, included both actual third quarter 2016 results as well as an estimate of GoviEx’s fourth quarter results. As a result, no income from associates was recorded during the three months ended March 31, 2017. See SALE OF AFRICAN-BASED URANIUM INTERESTS below for further details of the transaction with GoviEx.
DISCONTINUED OPERATIONS Sale of African-Based Uranium Interests In June 2016, GoviEx and Denison completed a transaction to combine their respective African uranium mineral interests under the direct ownership of GoviEx. Pursuant to the transaction, GoviEx acquired Denison’s wholly owned subsidiary, Rockgate Capital Corp., which held all of Denison’s Africa-based uranium interests (collectively “DML

MANAGEMENT’S DISCUSSION & ANALYSIS
15
Africa”), in exchange for 56,050,450 common shares (“Consideration Shares”) and 22,420,180 common share purchase warrants (“Consideration Warrants”) of GoviEx. Each Consideration Warrant is convertible into one common share of GoviEx at a price of $0.15 per share for a period of three years. The Consideration Warrants include an acceleration clause, which provide that in the event that the closing price of GoviEx’s common shares on the TSX Venture Exchange is equal to or greater than CAD$0.24 per share for a period of 15 consecutive trading days, GoviEx may provide holders of the Consideration Warrants with written notice that holders have 30 days to exercise the Consideration Warrants on the original terms, failing which the exercise price of the Consideration Warrants will be increased to $0.18 per share and the term of the Consideration Warrants will be reduced by six months. As part of the transaction, GoviEx undertook a concurrent equity financing by means of a non-brokered private placement ( the “GoviEx Concurrent Financing”), in which Denison provided the lead order for the private placement of $500,000 for 9,093,571 common shares (“Concurrent Shares”) and 9,093,571 common share purchase warrants (“Concurrent Warrants”). Each Concurrent Warrant is convertible into one common share of GoviEx for a period of three years, at a price of $0.12 per share until June 10, 2018 and thereafter at a price of $0.14 per share. The Concurrent Warrants include an acceleration clause, which provide that in the event that the closing price of GoviEx’s common shares on the TSX Venture Exchange is equal to or greater than CAD$0.20 per share for a period of 15 consecutive trading days, GoviEx may provide holders of the Concurrent Warrants with written notice that holders have 60 days to exercise the Concurrent Warrants on the original terms, failing which the Concurrent Warrants will expire unexercised. At September 30, 2017, Denison holds 65,144,021 common shares of GoviEx or approximately 20.24% of GoviEx’s issued and outstanding common shares and 31,513,751 common share purchase warrants. GoviEx is a publicly traded company and is listed on the TSX Venture Exchange under the symbol “GXU”. For so long as Denison holds at least 5% of the issued and outstanding common shares of GoviEx, Denison will have the right to appoint one director to the GoviEx board of directors and will have the right to participate in future GoviEx equity financings in order to maintain its pro-rata ownership. Denison’s nominee director, Mr. David Cates, President and Chief Executive Officer of Denison, has been appointed to the GoviEx board of directors.
LIQUIDITY AND CAPITAL RESOURCES Cash and cash equivalents were $4,393,000 at September 30, 2017 compared with $11,838,000 at December 31, 2016. At September 30, 2017, the Company also held investments in GICs of $32,215,000, which are categorized as short term investments on the balance sheet. At December 31, 2016, the Company held no short term investments. The decrease in cash and cash equivalents of $7,445,000 was predominantly due to net cash provided by operations of $15,857,000, net cash provided by financing activities of $13,689,000, and a net foreign exchange gain on the translation of cash and cash equivalents at period end of $481,000, offset by net cash used in investing activities of $37,472,000. Net cash provided by operating activities of $15,857,000 during the nine months ended September 30, 2017 was predominantly due to the APG Transaction, whereby Denison monetized its rights to receive the proceeds from the toll milling of specified Cigar Lake ore at the McClean Lake mill, for all periods after July 1, 2016, for proceeds of CAD$43,500,000. Toll milling revenue received between July 1, 2016 and January 31, 2017 amounted to CAD$3,520,000, and was subsequently paid to APG under the terms of the APG Transaction. The Company recorded the receipt of funds from APG as a prepayment of future toll milling revenue, which has been accounted for as deferred revenue. The cash movements associated with the deferred revenue have been classified as an operating activity, as the presale of the toll milling revenue relates to the principal revenue-generating activities of the Company. This cash inflow was offset by the net loss for the period adjusted for non-cash items and changes in working capital items. Net cash used in investing activities of $37,472,000 consists primarily of the purchase of GICs for $29,740,000, as well as an increase in restricted cash of $6,945,000. The increase in restricted cash was largely due to the terms of the Letters of Credit facility with the Bank of Nova Scotia (“BNS”) which was extended and amended on January 31, 2017, such that the Company is now required to maintain CAD$9,000,000 pledged restricted cash on deposit at BNS. Prior to this, the Company was required to maintain a minimum cash balance at BNS of CAD$5,000,000. Refer to LETTERS OF CREDIT FACILITY for more details. Net cash provided by financing activities of $13,689,000 largely reflects the net proceeds received from the Company’s March 2017 private placement issuance of 18,337,000 common shares for gross proceeds of $14,806,000 (CAD$20,000,290). The aggregate share offering was comprised of the following three elements: (1) a “Common Share” offering of 5,790,000 common shares of Denison at a price of CAD$0.95 per share for gross proceeds of
MANAGEMENT’S DISCUSSION & ANALYSIS
16
CAD$5,500,500; (2) a “Tranche A Flow-Through” offering of 8,482,000 flow-through shares at a price of CAD$1.12 per share for gross proceeds of CAD$9,499,840; and (3) a “Tranche B Flow-Through” offering of 4,065,000 flow-through shares at a price of CAD$1.23 per share for gross proceeds of CAD$4,999,950. The proceeds for the Tranche A and Tranche B flow through share offerings will be used to fund the Company’s Canadian exploration programs through to the end of 2018. As at September 30, 2017, the Company estimates that it has satisfied its obligation to spend CAD$12,405,000 on eligible exploration expenditures as a result of the issuance of flow-through shares in May 2016. As at September 30, 2017, the Company estimates that is has incurred CAD$584,000 of expenditures towards its obligation to spend CAD$9,499,840 on eligible exploration expenditures as a result of the issuance of Tranche A flow-through shares in March 2017. The Company has not yet incurred any expenditures towards its obligation to spend CAD$4,999,950 on eligible exploration expenditures as a result of the issuance of Tranche B flow-through shares in March 2017. The Company holds the large majority of its cash, cash equivalents, and investments in Canadian dollars. As at September 30, 2017, the Company’s cash and cash equivalents and GIC’s amount to approximately CAD$45.7 million. Refer to 2017 OUTLOOK for details of the Company’s working capital requirements for the remainder of the year. Letters of Credit Facility On January 31, 2017, the Company entered into an agreement with BNS to amend the terms of a letters of credit facility with BNS (the “2017 Credit Facility”) and extend the maturity date to January 31, 2018. Under the 2017 Credit Facility, the Company has access to letters of credit of up to CAD$24,000,000, which is fully utilized for non-financial letters of credit in support of reclamation obligations. Amongst the amendments included in the 2017 Credit Facility, a restrictive covenant to maintain CAD$5,000,000 on deposit with BNS, has been replaced with a pledge of CAD$9,000,000 in restricted cash in the form of GICs to be held with BNS as collateral against the credit facility. The 2017 Credit Facility is subject to letter of credit fees of 0.4% on the first CAD$9,000,000 (collateralized by the restricted cash), and 2.4% on the remaining CAD$15,000,000 of letters of credit issued under the facility.
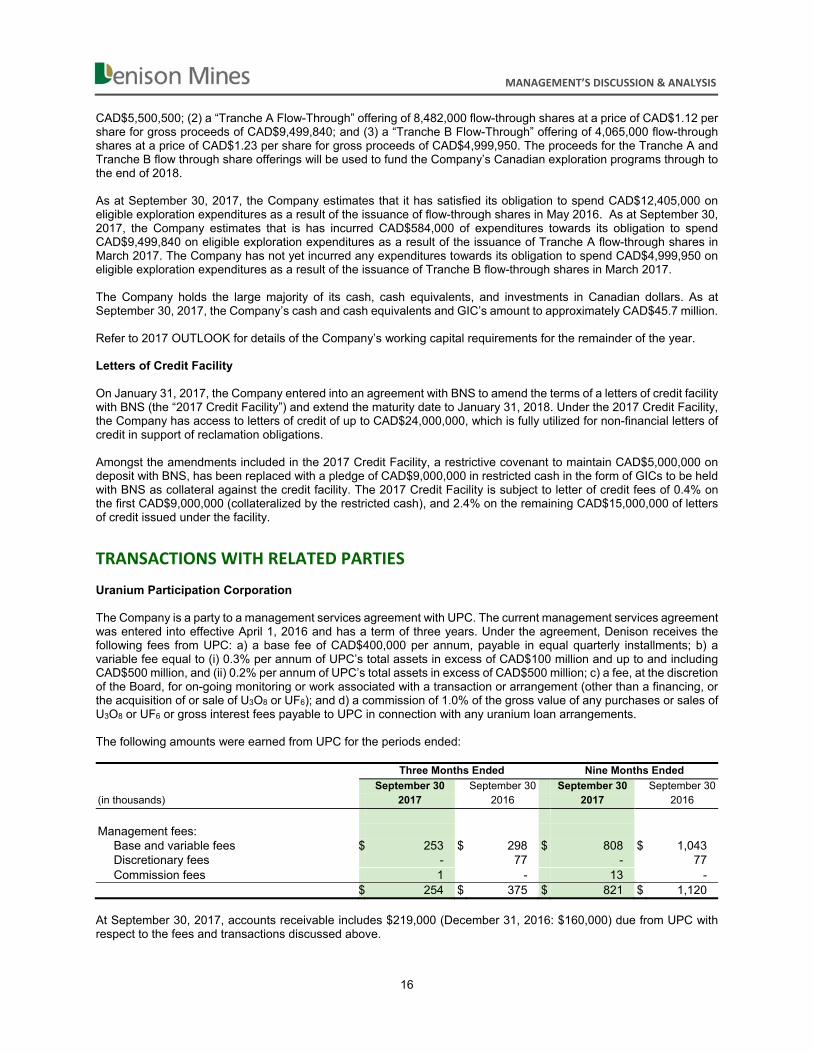
TRANSACTIONS WITH RELATED PARTIES Uranium Participation Corporation The Company is a party to a management services agreement with UPC. The current management services agreement was entered into effective April 1, 2016 and has a term of three years. Under the agreement, Denison receives the following fees from UPC: a) a base fee of CAD$400,000 per annum, payable in equal quarterly installments; b) a variable fee equal to (i) 0.3% per annum of UPC’s total assets in excess of CAD$100 million and up to and including CAD$500 million, and (ii) 0.2% per annum of UPC’s total assets in excess of CAD$500 million; c) a fee, at the discretion of the Board, for on-going monitoring or work associated with a transaction or arrangement (other than a financing, or the acquisition of or sale of U3O8 or UF6); and d) a commission of 1.0% of the gross value of any purchases or sales of U3O8 or UF6 or gross interest fees payable to UPC in connection with any uranium loan arrangements. The following amounts were earned from UPC for the periods ended: Three Months Ended Nine Months Ended
September 30 September 30 September 30 September 30 (in thousands) 2017 2016 2017 2016
Management fees:
Base and variable fees $ 253 $ 298 $ 808 $ 1,043 Discretionary fees - 77 - 77 Commission fees 1 - 13 -
$ 254 $ 375 $ 821 $ 1,120 At September 30, 2017, accounts receivable includes $219,000 (December 31, 2016: $160,000) due from UPC with respect to the fees and transactions discussed above.

MANAGEMENT’S DISCUSSION & ANALYSIS
17
Korea Electric Power Corporation (“KEPCO”) and Korea Hydro & Nuclear Power (“KHNP”) At September 30, 2017, KEPCO, through its subsidiaries, including KHNP and its subsidiary KHNP Canada Energy Ltd. (“KHNP Canada”), holds 58,284,000 shares of Denison representing a share interest of approximately 10.42%. KHNP Canada, is also the majority member of Korea Waterbury Uranium Limited Partnership (“KWULP”). KWULP is a consortium of investors that holds the non-Denison owned interests in Waterbury Lake Uranium Corporation (“WLUC”) and Waterbury Lake Uranium Limited Partnership (“WLULP”), entities which own the Waterbury Lake property. In May 2017, Denison funded 100% of Waterbury Lake expenditures, which has had the effect of diluting KWULP’s interest in WLULP. As a result, Denison earned an additional 0.62% interest in the WLULP, which resulted in Denison recording its increased pro-rata share of the net assets of Waterbury Lake, the majority of which relates to an addition to mineral property assets, of $296,000. In August 2017, Denison again funded 100% Waterbury Lake expenditures, which has had the impact of further diluting KWULP’s interest in the WLULP. As a result, Denison earned a further additional 0.59% interest in the WLULP, which resulted in Denison recording its increased pro-rata share of the net assets of Waterbury Lake, the majority of which relates to mineral property assets, of $304,000. As a result of the two dilution events in 2017, KWULP’s interest in the Waterbury Lake property has decreased to 35.78% (Denison, 64.22%). In September 2017, Denison and KHNP Canada entered into an amended and restated strategic relationship agreement (the “Amended SRA”) to replace the June 2009 strategic relationship agreement between Denison and KEPCO (the “2009 SRA”). The Amended SRA acknowledges the transfer of the Denison shares and the rights and obligations under the 2009 SRA, by KEPCO to KHNP Canada pursuant to an internal reorganization completed by KEPCO in early 2017. Other All services and transactions with the related parties listed below were made on terms equivalent to those that prevail with arm’s length transactions: During the three and nine months ended September 30, 2017, the Company incurred investor relations,
administrative service fees and other expenses of $111,000 and $135,000, respectively (September 30, 2016: $59,000 and $125,000) with Namdo Management Services Ltd, which shares a common director with Denison. These services were incurred in the normal course of operating a public company. At September 30, 2017, an amount of $nil (December 31, 2016: $nil) was due to this company.
During the three and nine months ended September 30, 2017, the Company incurred office and other expenses of $7,000 and $41,000, respectively with Lundin S.A (September 30, 2016: $5,000 and $17,000), a company that provides office and administration services to the executive chairman, other directors and management of Denison. At September 30, 2017, an amount of $nil (December 31, 2016: $6,000) was due to this company.
COMPENSATION OF KEY MANAGEMENT PERSONNEL Key management personnel are those persons having authority and responsibility for planning, directing and controlling the activities of the Company, directly or indirectly. Key management personnel include the Company’s executive officers, vice-presidents and members of its Board of Directors. The following compensation was awarded to key management personnel: Three Months Ended Nine Months Ended September 30 September 30 September 30 September 30 (in thousands) 2017 2016 2017 2016
Salaries and short-term employee benefits $ (359) $ (296) $ (1,018) $ (875) Share-based compensation (239) (70) (601) (195)
$ (598) $ (366) $ (1,619) $ (1,070) The increase in key management personnel compensation is predominantly due to an increase in share-based compensation expense as a result of an increase in stock options granted to key management personnel in 2017 as compared to 2016.
MANAGEMENT’S DISCUSSION & ANALYSIS
18
OFF‐BALANCE SHEET ARRANGEMENTS The Company does not have any off-balance sheet arrangements.
OUTSTANDING SHARE DATA At October 31, 2017, there were 559,084,402 common shares issued and outstanding, stock options outstanding for 12,426,489 Denison common shares, and 1,673,077 share purchase warrants outstanding for a total of 573,183,968 common shares on a fully diluted basis.
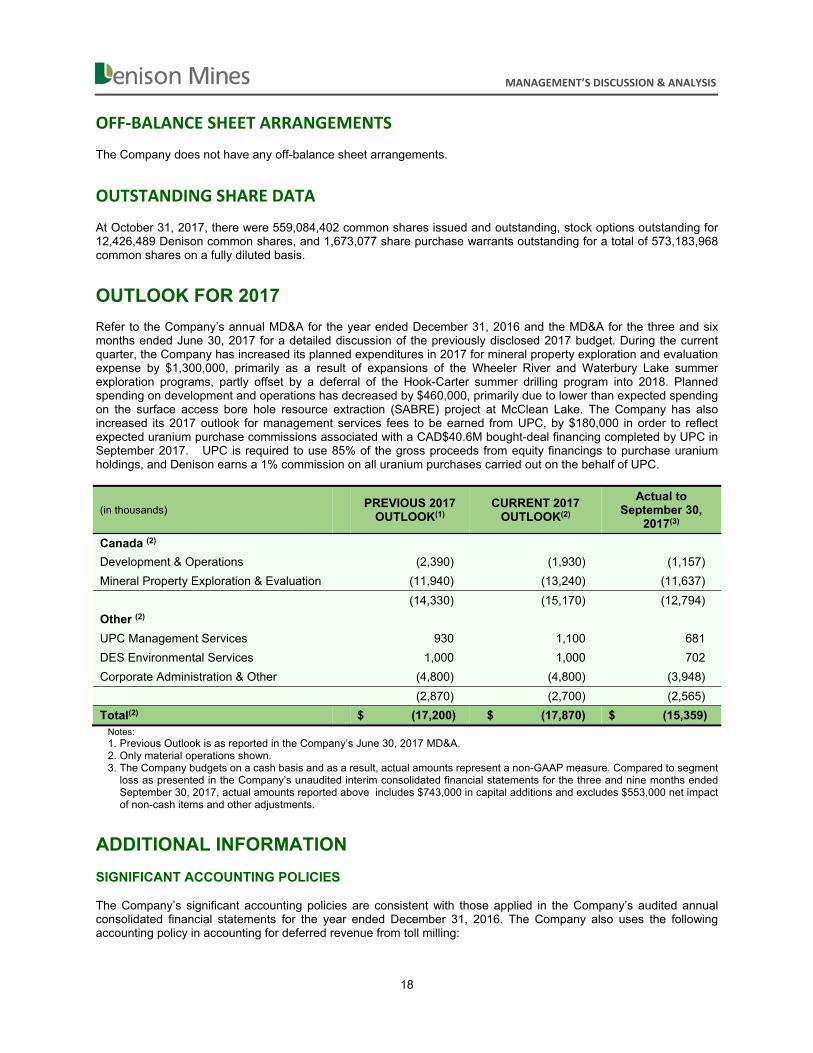
OUTLOOK FOR 2017 Refer to the Company’s annual MD&A for the year ended December 31, 2016 and the MD&A for the three and six months ended June 30, 2017 for a detailed discussion of the previously disclosed 2017 budget. During the current quarter, the Company has increased its planned expenditures in 2017 for mineral property exploration and evaluation expense by $1,300,000, primarily as a result of expansions of the Wheeler River and Waterbury Lake summer exploration programs, partly offset by a deferral of the Hook-Carter summer drilling program into 2018. Planned spending on development and operations has decreased by $460,000, primarily due to lower than expected spending on the surface access bore hole resource extraction (SABRE) project at McClean Lake. The Company has also increased its 2017 outlook for management services fees to be earned from UPC, by $180,000 in order to reflect expected uranium purchase commissions associated with a CAD$40.6M bought-deal financing completed by UPC in September 2017. UPC is required to use 85% of the gross proceeds from equity financings to purchase uranium holdings, and Denison earns a 1% commission on all uranium purchases carried out on the behalf of UPC.
(in thousands) PREVIOUS 2017
OUTLOOK(1) CURRENT 2017
OUTLOOK(2)
Actual to September 30,
2017(3)
Canada (2)
Development & Operations (2,390) (1,930) (1,157)
Mineral Property Exploration & Evaluation (11,940) (13,240) (11,637)
(14,330) (15,170) (12,794)
Other (2)
UPC Management Services 930 1,100 681
DES Environmental Services 1,000 1,000 702
Corporate Administration & Other (4,800) (4,800) (3,948)
(2,870) (2,700) (2,565)
Total(2) $ (17,200) $ (17,870) $ (15,359) Notes: 1. Previous Outlook is as reported in the Company’s June 30, 2017 MD&A. 2. Only material operations shown. 3. The Company budgets on a cash basis and as a result, actual amounts represent a non-GAAP measure. Compared to segment
loss as presented in the Company’s unaudited interim consolidated financial statements for the three and nine months ended September 30, 2017, actual amounts reported above includes $743,000 in capital additions and excludes $553,000 net impact of non-cash items and other adjustments.
ADDITIONAL INFORMATION
SIGNIFICANT ACCOUNTING POLICIES The Company’s significant accounting policies are consistent with those applied in the Company’s audited annual consolidated financial statements for the year ended December 31, 2016. The Company also uses the following accounting policy in accounting for deferred revenue from toll milling:
MANAGEMENT’S DISCUSSION & ANALYSIS
19
Deferred Revenue – Toll Milling Deferred revenue associated with toll milling services consists of an upfront cash payment received by the Company in exchange for the monetization of its rights to proceeds from future toll milling activities under the applicable toll milling agreement. The Company recognizes revenue on a pro-rata basis, based on the actual cash receipts from toll milling received in the period as a percentage of the total undiscounted cash receipts expected to be received under the applicable toll milling agreement. Accounting Standards Issued But Not Yet Applied An update on the Company’s progress in evaluating the impact of the new standards required for fiscal 2018 is as follows:
IFRS 9, Financial Instruments and IFRS 15, Revenue from Contracts with Customers
Denison completed its preliminary assessment of the impact of the adoption of these standards and does not expect the adoption to have a material impact on its financial results. However, the Company is still completing its assessment and it may identify other matters in advance of the adoption of this standard. CRITICAL ACCOUNTING ESTIMATES AND JUDGEMENTS Management has made significant estimates and judgements in the current period related to the following items that are in addition to those included in the financial statements for the year ended December 31, 2016: Deferred Revenue – Toll Milling In February 2017, Denison closed an arrangement with Anglo Pacific Group PLC and one of its wholly-owned subsidiaries (collectively “APG”). Under the arrangement, Denison monetized its right to receive future toll milling cash receipts from July 1, 2016 onwards from the MLJV under the current toll milling agreement with the CLJV (see note 12 of the unaudited interim consolidated financial statements) for an upfront cash payment. The arrangement consisted of a loan structure and a stream arrangement (collectively, the “APG Arrangement”). Significant judgement was required to determine whether the APG Arrangement should be accounted for as a financial obligation (i.e.: debt) or deferred revenue. Key factors that support the deferred revenue conclusion reached by management include, but are not limited to: a) Limited Recourse loan structure – amounts due to APG are generally repayable only to the extent of Denison’s share of the toll milling revenues earned by the MLJV from the processing of the first 215 million pounds of U308 from the Cigar Lake mine on or after July 1, 2016, under the terms of the current Cigar Lake toll milling agreement; and b) No Warranty of the Future Rate of Production - no warranty is provided by Denison to APG regarding the future rate of production at the Cigar Lake mine and / or the McClean Lake mill, or the amount and / or collectability of cash receipts to be received by the MLJV in respect of toll milling of Cigar Lake ore. QUALIFIED PERSON The disclosure regarding the Evaluation Program at Wheeler River, including the PEA, was reviewed and approved by Peter Longo, P. Eng, MBA, PMP, Denison’s Vice-President, and Project Development, who is a Qualified Person in accordance with the requirements of NI 43-101. The balance of the disclosure of scientific and technical information regarding Denison’s properties in the MD&A was prepared by or reviewed by Dale Verran, MSc, P. Geo, Pr.Sci.Nat., the Company’s Vice President, Exploration, a Qualified Person in accordance with the requirements of NI 43-101. For a description of Denison’s assay procedures, downhole gamma probe procedures, and the quality assurance program and quality control measures applied by Denison, please see Denison’s Annual Information Form dated March 23, 2017 available under Denison's profile on SEDAR at www.sedar.com, and its Form 40-F available on EDGAR at www.sec.gov/edgar.shtml.

MANAGEMENT’S DISCUSSION & ANALYSIS
20
CAUTIONARY STATEMENT REGARDING FORWARD-LOOKING STATEMENTS Certain information contained in this MD&A constitutes “forward-looking information", within the meaning of the applicable United States and Canadian legislation concerning the business, operations and financial performance and condition of Denison. Generally, these forward-looking statements can be identified by the use of forward-looking terminology such as "plans", "expects", "budget", "scheduled", "estimates", “forecasts", "intends", "anticipates", or "believes", or the negatives and/or variations of such words and phrases, or state that certain actions, events or results "may", "could", "would", "might" or "will be taken", "occur", "be achieved" or “has the potential to”. In particular, this MD&A contains forward-looking information pertaining to the following: the benefits to be derived from corporate transactions including the potential for receipt of any contingent payments; use of proceeds of financing activities; the estimates of Denison's mineral reserves and mineral resources; exploration, development and expansion plans and objectives, including the results of the PEA, the completion of the PFS, and statements regarding anticipated budgets, fees and expenditures; expectations regarding Denison’s joint venture ownership interests and the continuity of its agreements with its partners; expectations regarding adding to its mineral reserves and resources through acquisitions and exploration; expectations regarding the toll milling of Cigar Lake ores; expectations regarding revenues and expenditures from operations at DES; expectations regarding revenues from the UPC management contract; and capital expenditure programs, estimated exploration and development expenditures and reclamation costs and Denison's share of same; expectations of market prices and costs. Statements relating to "mineral reserves" or "mineral resources" are deemed to be forward-looking information, as they involve the implied assessment, based on certain estimates and assumptions that the mineral reserves and mineral resources described can be profitably produced in the future. Forward looking statements are based on the opinions and estimates of management as of the date such statements are made, and they are subject to known and unknown risks, uncertainties and other factors that may cause the actual results, level of activity, performance or achievements of Denison to be materially different from those expressed or implied by such forward-looking statements. Denison believes that the expectations reflected in this forward-looking information are reasonable but no assurance can be given that these expectations will prove to be accurate and results may differ materially from those anticipated in this forward-looking information. For a discussion in respect of risks and other factors that could influence forward-looking events, please refer to the factors discussed in the annual MD&A for the year ended December 31, 2016 under the heading "Risk Factors". These factors are not, and should not be construed as being exhaustive. Accordingly, readers should not place undue reliance on forward-looking statements. The forward-looking information contained in this MD&A is expressly qualified by this cautionary statement. Any forward-looking information and the assumptions made with respect thereto speaks only as of the date of this MD&A. Denison does not undertake any obligation to publicly update or revise any forward-looking information after the date of this MD&A to conform such information to actual results or to changes in Denison's expectations except as otherwise required by applicable legislation. Cautionary Note to United States Investors Concerning Estimates of Measured, Indicated and Inferred Mineral Resources: This MD&A may use the terms “measured”, “indicated” and “inferred” mineral resources. United States investors are advised that while such terms are recognized and required by Canadian regulations, the United States Securities and Exchange Commission does not recognize them. “Inferred mineral resources” have a great amount of uncertainty as to their existence, and as to their economic and legal feasibility. It cannot be assumed that all or any part of an inferred mineral resource will ever be upgraded to a higher category. Under Canadian rules, estimates of inferred mineral resources may not form the basis of feasibility or other economic studies. United States investors are cautioned not to assume that all or any part of measured or indicated mineral resources will ever be converted into mineral reserves. United States investors are also cautioned not to assume that all or any part of an inferred mineral resource exists, or is economically or legally mineable.

INTERIM CONSOLIDATED FINANCIAL STATEMENTS
21
CONDENSED INTERIM CONSOLIDATED STATEMENTS OF FINANCIAL POSITION (Unaudited - Expressed in thousands of U.S. dollars except for share amounts)
At September 30 2017
At December 31
2016 ASSETS
Current Cash and cash equivalents (note 5) $ 4,393 $ 11,838 Investments (note 8) 32,215 - Trade and other receivables (note 6) 3,253 2,403 Inventories (note 7) 2,781 2,381 Prepaid expenses and other 455 491 43,097 17,113 Non-Current Inventories-ore in stockpiles (note 7) 1,681 1,562 Investments (note 8) 4,463 3,760 Investments in associates (note 9) 3,688 4,692 Restricted cash and investments (note 10) 9,862 2,314 Property, plant and equipment (note 11) 200,377 187,982 Total assets $ 263,168 $ 217,423 LIABILITIES Current Accounts payable and accrued liabilities $ 4,991 $ 4,141 Debt obligations - 276 Current portion of long-term liabilities:
Deferred revenue (note 12) 2,454 - Post-employment benefits (note 13) 200 186 Reclamation obligations (note 14) 807 810 Other liabilities (note 16) 3,073 1,847
11,525 7,260 Non-Current Deferred revenue (note 12) 28,061 - Post-employment benefits (note 13) 1,716 1,646 Reclamation obligations (note 14) 21,912 20,155 Other liabilities (note 16) - 630 Deferred income tax liability 14,064 15,021 Total liabilities 77,278 44,712 EQUITY Share capital (note 17) 1,151,781 1,140,631 Share purchase warrants (note 18) 333 - Contributed surplus 54,991 54,306 Deficit (974,367) (961,440) Accumulated other comprehensive loss (note 20) (46,848) (60,786) Total equity 185,890 172,711 Total liabilities and equity $ 263,168 $ 217,423
Issued and outstanding common shares (note 17) 559,084,402 540,722,365
The accompanying notes are integral to the condensed interim consolidated financial statements

INTERIM CONSOLIDATED FINANCIAL STATEMENTS
22
CONDENSED INTERIM CONSOLIDATED STATEMENTS OF INCOME (LOSS) AND COMPREHENSIVE INCOME (LOSS) (Unaudited - Expressed in thousands of U.S. dollars except for share and per share amounts)
Three Months Ended Nine Months Ended
September 30 September 30 September 30 September 30 2017 2016 2017 2016
REVENUES (note 22) $ 2,717 $ 3,489 $ 7,929 $ 10,482 EXPENSES Operating expenses (note 21) (2,630) (2,553) (7,552) (7,625) Exploration and evaluation (note 22) (4,348) (3,308) (11,095) (10,037) General and administrative (note 22) (1,169) (1,020) (4,697) (3,287) Impairment recovery (expense) (note 11) - (79) 246 (2,253) Foreign exchange (355) 481 (658) (1,687) Other income (expense) (note 21) (556) 519 779 767 (9,058) (5,960) (22,977) (24,122) Loss before finance charges, equity accounting (6,341) (2,471) (15,048) (13,640) Finance expense (note 21) (228) (226) (622) (595) Equity share of income (loss) of associate (note 9) 173 - (1,004) - Loss before taxes (6,396) (2,697) (16,674) (14,235) Income tax recovery (note 24)
Deferred 619 191 3,828 3,452 Loss from continuing operations (5,777) (2,506) (12,846) (10,783) Net income (loss) from discontinued operations (note 4)
- 9,050 (81) 3,438
Net income (loss) for the period $ (5,777) $ 6,544 $ (12,927) $ (7,345) Other comprehensive income (loss):
Items that may be reclassified to income (loss): Unrealized gain on investments-net of tax
Continuing operations 2 1 - 6 Foreign currency translation change
Continuing operations 7,526 (3,145) 13,938 10,294 Discontinued operations - - 6,220
Comprehensive income (loss) for the period $ 1,751 $ 3,400 $ 1,011 $ 9,175 Basic and diluted net income (loss) per share:
Continuing operations (0.01) 0.00 (0.02) (0.02) Discontinued operations 0.00 0.01 0.00 0.01 All operations $ (0.01) $ 0.01 $ (0.02) $ (0.01)
Weighted-average number of shares outstanding (in thousands): Basic 559,084 533,419 553,983 525,953 Diluted 559,084 533,464 553,983 525,953
The accompanying notes are integral to the condensed interim consolidated financial statements

INTERIM CONSOLIDATED FINANCIAL STATEMENTS
23
CONDENSED INTERIM CONSOLIDATED STATEMENTS OF CHANGES IN EQUITY
(Unaudited - Expressed in thousands of U.S. dollars)
Nine Months Ended
September 30 September 30 2017 2016
Share capital Balance-beginning of period $ 1,140,631 $ 1,130,779 Shares issued-net of issue costs 13,955 8,841 Flow-through share premium (2,839) (1,843) Share options exercised-cash 16 - Share options exercised-non cash 18 - Balance-end of period 1,151,781 1,137,777 Share purchase warrants Balance-beginning of period - - Warrants issued in connection with APG Arrangement (note 18) 333 - Balance-end of period 333 - Contributed surplus Balance-beginning of period 54,306 53,965 Stock-based compensation expense 703 261 Share options exercised-non cash (18) - Balance-end of period 54,991 54,226 Deficit Balance-beginning of period (961,440) (944,097) Net loss (12,927) (7,345) Balance-end of period (974,367) (951,442) Accumulated other comprehensive loss Balance-beginning of period (60,786) (73,592) Unrealized gain on investments - 6 Foreign currency translation realized in net income - (637) Foreign currency translation 13,938 17,151 Balance-end of period (46,848) (57,072) Total Equity Balance-beginning of period 172,711 167,055 Balance-end of period $ 185,890 $ 183,489
The accompanying notes are integral to the condensed interim consolidated financial statements

INTERIM CONSOLIDATED FINANCIAL STATEMENTS
24
CONDENSED INTERIM CONSOLIDATED STATEMENTS OF CASH FLOW
(Unaudited - Expressed in thousands of U.S. dollars)
Nine Months Ended
September 30 September 30 CASH PROVIDED BY (USED IN): 2017 2016
OPERATING ACTIVITIES Net loss for the period $ (12,927) $ (7,345) Items not affecting cash:
Depletion, depreciation, amortization and accretion 3,430 2,974 Impairment expense (recovery) (246) 2,253 Stock-based compensation (note 19) 703 261 Recognition of deferred revenue (note 12) (1,448) - Gain on other liability revisions (note 16) (679) - Loss on divestiture of Africa Mining Division (note 4) 81 70 Gain on divestiture of Mongolia Mining Division (note 4) - (9,050) Gains on asset disposals (21) (51) Gains on investments (405) (1,017) Equity loss of associate (note 9) 599 - Dilution loss of associate (note 9) 405 - Deferred income tax recovery (3,828) (3,452) Foreign exchange losses 658 6,841 Other 17 -
Deferred revenue (note 12) 30,201 - Post-employment benefits (note 13) (95) (99) Reclamation obligations (note 14) (585) (376) Change in non-cash working capital items (note 21) (3) 1,468 Net cash provided by (used in) operating activities 15,857 (7,523) INVESTING ACTIVITIES Divestiture of asset group, net of cash and cash equivalents divested:
Africa Mining Division (81) (798) Sale and maturity of investments - 7,785 Purchase of investments (29,889) (500) Expenditures on property, plant and equipment (743) (1,083) Proceeds on sale of property, plant and equipment 186 55 Increase in restricted cash and investments (6,945) (280) Net cash provided by (used in) investing activities (37,472) 5,179
FINANCING ACTIVITIES Repayment of debt obligations (282) (313) Issuance of common shares for:
New share issues-net of issue costs 13,955 8,841 Share options exercised 16 -
Net cash provided by financing activities 13,689 8,528
Increase (decrease) in cash and cash equivalents (7,926) 6,184 Foreign exchange effect on cash and cash equivalents 481 278 Cash and cash equivalents, beginning of period 11,838 5,367 Cash and cash equivalents, end of period $ 4,393 $ 11,829
The accompanying notes are integral to the condensed interim consolidated financial statements

INTERIM CONSOLIDATED FINANCIAL STATEMENTS
25
NOTES TO THE CONDENSED INTERIM CONSOLIDATED FINANCIAL STATEMENTS FOR THE NINE MONTHS ENDED SEPTEMBER 30, 2017
(Unaudited - Expressed in U.S. dollars except for shares and per share amounts)
1. NATURE OF OPERATIONS
Denison Mines Corp. (“DMC”) and its subsidiary companies and joint arrangements (collectively, “Denison” or the “Company”) are engaged in uranium mining related activities, including acquisition, exploration and development of uranium bearing properties, extraction, processing and selling of uranium.
The Company has a 60% interest in the Wheeler River Joint Venture (“WRJV”), a 22.5% interest in the McClean Lake Joint Venture (“MLJV”) (which includes the McClean Lake mill) and a 25.17% interest in the Midwest Joint Venture (“MWJV”), each of which are located in the eastern portion of the Athabasca Basin region in northern Saskatchewan, Canada. The McClean Lake mill provides toll milling services to the Cigar Lake Joint Venture (“CLJV”) under the terms of a toll milling agreement between the parties (see note 12). In addition, the Company has varying ownership interests in a number of other development and exploration projects located in Canada. The Company provides mine decommissioning and decommissioned site monitoring services to third parties through its Denison Environmental Services (“DES”) division and is also the manager of Uranium Participation Corporation (“UPC”), a publicly-listed investment holding company formed to invest substantially all of its assets in uranium oxide concentrates (“U3O8”) and uranium hexafluoride (“UF6”). The Company has no ownership interest in UPC but receives fees for management services and commissions from the purchase and sale of U3O8
and UF6 by UPC. DMC is incorporated under the Business Corporations Act (Ontario) and domiciled in Canada. The address of its registered head office is 40 University Avenue, Suite 1100, Toronto, Ontario, Canada, M5J 1T1.
2. BASIS OF PRESENTATION
These condensed interim consolidated financial statements have been prepared in accordance with International Financial Reporting Standards (“IFRS”) as issued by the International Accounting Standards Board (“IASB”) applicable to the preparation of interim financial statements, including IAS 34, Interim Financial Reporting. The condensed interim consolidated financial statements should be read in conjunction with the audited annual consolidated financial statements for the year ended December 31, 2016. The Company’s presentation currency is U.S. dollars.
These financial statements were approved by the board of directors for issue on October 31, 2017.
3. SIGNIFICANT ACCOUNTING POLICIES AND CRITICAL ACCOUNTING ESTIMATES AND JUDGEMENTS Significant Accounting Policies The significant accounting policies followed in these condensed interim consolidated financial statements are consistent with those applied in the Company’s audited annual consolidated financial statements for the year ended December 31, 2016. Commencing with the first quarter of 2017, the Company applies the following accounting policy in accounting for deferred revenue from toll milling:
(a) Deferred Revenue – Toll Milling
Deferred revenue associated with toll milling services consists of an upfront cash payment received by the Company in exchange for the monetization of its rights to proceeds from future toll milling activities under the applicable toll milling agreement. The Company recognizes revenue on a pro-rata basis, based on the actual cash receipts from toll milling received in the period as a percentage of the total undiscounted cash receipts expected to be received under the applicable toll milling agreement.

INTERIM CONSOLIDATED FINANCIAL STATEMENTS
26
Accounting Standards Issued But Not Yet Applied An update on the Company’s progress in evaluating the impact of the new standards required for fiscal 2018 is as follows: IFRS 9, Financial Instruments and IFRS 15, Revenue from Contracts with Customers Denison completed its preliminary assessment of the impact of the adoption of these standards and does not expect the adoption of either to have a material impact on its financial results. However, the Company is still completing its assessment and it may identify other matters in advance of the adoption of these standards. Comparative Numbers Certain classifications of the comparative figures have been changed to conform to those used in the current period. Critical Accounting Estimates and Judgements The preparation of consolidated financial statements in accordance with IFRS requires the use of certain critical accounting estimates and judgements that affect the amounts reported. It also requires management to exercise judgement in applying the Company’s accounting policies. These judgements and estimates are based on management’s best knowledge of the relevant facts and circumstances taking into account previous experience. Although the Company regularly reviews the estimates and judgements made that affect these financial statements, actual results may be materially different. Management has made significant estimates and judgements in the current period related to the following items that are in addition to those included in the financial statements for the year ended December 31, 2016:
(a) Deferred Revenue – Toll Milling
In February 2017, Denison closed an arrangement with Anglo Pacific Group PLC and one of its wholly-owned subsidiaries (collectively “APG”). Under the arrangement, Denison monetized its right to receive future toll milling cash receipts from July 1, 2016 onwards from the MLJV under the current toll milling agreement with the CLJV (see note 12) for an upfront cash payment. The arrangement consisted of a loan structure and a stream arrangement (collectively, the “APG Arrangement”). Significant judgement was required to determine whether the APG Arrangement should be accounted for as a financial obligation (ie: debt) or deferred revenue. Key factors that support the deferred revenue conclusion reached by management include, but are not limited to: a) Limited Recourse loan structure – amounts due to APG are generally repayable only to the extent of Denison’s share of the toll milling revenues earned by the MLJV from the processing of the first 215 million pounds of U308 from the Cigar Lake mine on or after July 1, 2016, under the terms of the current Cigar Lake toll milling agreement; and b) No Warranty of the Future Rate of Production - no warranty is provided by Denison to APG regarding the future rate of production at the Cigar Lake mine and / or the McClean Lake mill, or the amount and / or collectability of cash receipts to be received by the MLJV in respect of toll milling of Cigar Lake ore.
4. DISCONTINUED OPERATIONS
Discontinued Operation – Africa Mining Division On June 10, 2016, the Company completed a transaction with GoviEx Uranium Inc. (“GoviEx”) to sell its mining assets and operations located in Africa (the “Africa Mining Division”). The primary assets of the African Mining Division at that time were the mineral property rights for the Falea, Mutanga and Dome projects.

INTERIM CONSOLIDATED FINANCIAL STATEMENTS
27
The consolidated statement of income (loss) for the Africa Mining Division discontinued operation for the three months and nine months ended September 30, 2017 and 2016 is as follows:
Three Months Ended Nine Months Ended
September 30 September 30 September 30 September 30 (in thousands) 2017 2016 2017 2016
Expenses Operating expenses $ - $ - $ - $ (64) Exploration and evaluation - - - (74) General and administrative - - - (280) Foreign exchange
Transactional - - - (5,154) Translational - - - -
Other income (expense) Gains on disposal of plant and equipment - - - 49 Other - - - (19)
Loss before taxes - - - (5,542) Income tax recovery (expense) - - - - Net loss for the period - - - (5,542) Loss on disposal - - (81) (70) Loss from discontinued operations $ - $ - $ (81) $ (5,612) The loss on disposal of $81,000 for the nine months ended September 30, 2017 consists of additional transaction costs incurred by the Company for professional fees related to the GoviEx transaction. Cash flows for the Africa Mining Division discontinued operation for the nine months ended September 30, 2017 and 2016 is as follows: Nine Months Ended
September 30 September 30 (in thousands) 2017 2016
Cash inflow (outflow): Operating activities $ - $ (442) Investing activities (81) (822) Net cash outflow for the period $ (81) $ (1,264) Discontinued Operation – Mongolia Mining Division On November 30, 2015, the Company completed a transaction with Uranium Industry a.s (“Uranium Industry”) to sell its mining assets and operations located in Mongolia (the “Mongolia Mining Division”). The primary assets of the Mongolia Mining Division at that time were the exploration licenses for the Hairhan, Haraat, Gurvan Saihan and Ulzit projects.
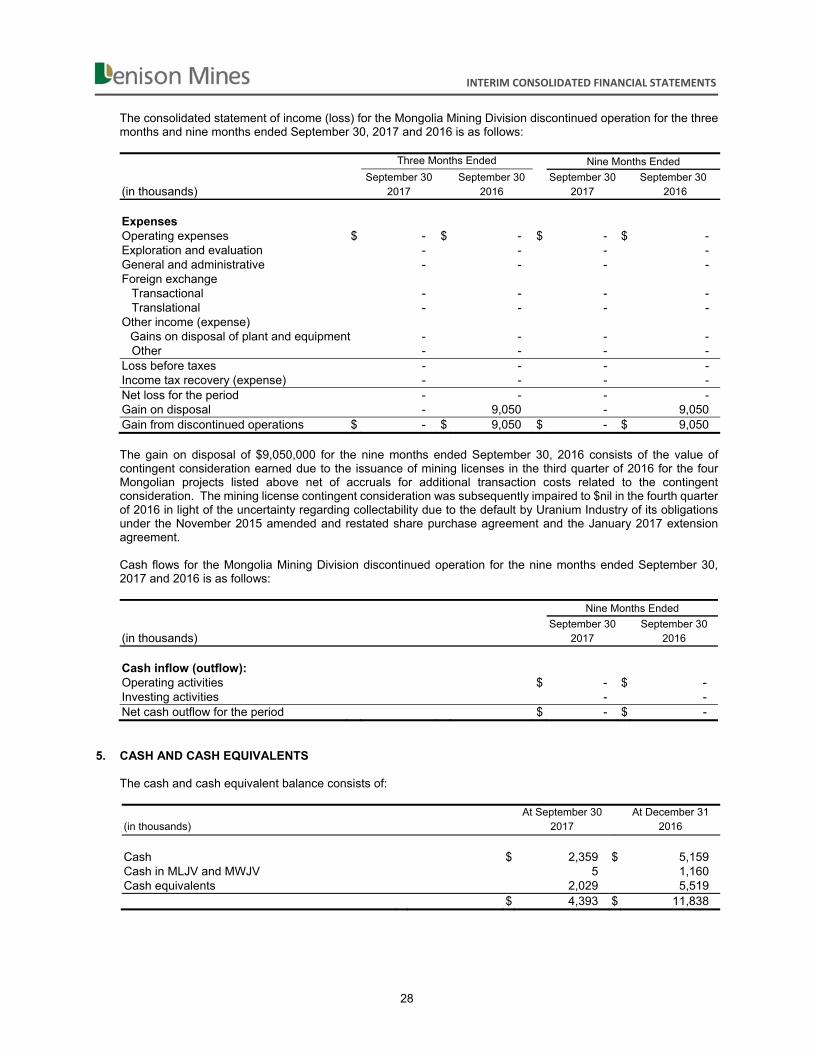
INTERIM CONSOLIDATED FINANCIAL STATEMENTS
28
The consolidated statement of income (loss) for the Mongolia Mining Division discontinued operation for the three months and nine months ended September 30, 2017 and 2016 is as follows:
Three Months Ended Nine Months Ended
September 30 September 30 September 30 September 30 (in thousands) 2017 2016 2017 2016
Expenses Operating expenses $ - $ - $ - $ - Exploration and evaluation - - - - General and administrative - - - - Foreign exchange
Transactional - - - - Translational - - - -
Other income (expense) Gains on disposal of plant and equipment - - - - Other - - - -
Loss before taxes - - - - Income tax recovery (expense) - - - - Net loss for the period - - - - Gain on disposal - 9,050 - 9,050 Gain from discontinued operations $ - $ 9,050 $ - $ 9,050 The gain on disposal of $9,050,000 for the nine months ended September 30, 2016 consists of the value of contingent consideration earned due to the issuance of mining licenses in the third quarter of 2016 for the four Mongolian projects listed above net of accruals for additional transaction costs related to the contingent consideration. The mining license contingent consideration was subsequently impaired to $nil in the fourth quarter of 2016 in light of the uncertainty regarding collectability due to the default by Uranium Industry of its obligations under the November 2015 amended and restated share purchase agreement and the January 2017 extension agreement. Cash flows for the Mongolia Mining Division discontinued operation for the nine months ended September 30, 2017 and 2016 is as follows: Nine Months Ended
September 30 September 30 (in thousands) 2017 2016
Cash inflow (outflow): Operating activities $ - $ - Investing activities - - Net cash outflow for the period $ - $ -
5. CASH AND CASH EQUIVALENTS
The cash and cash equivalent balance consists of: At September 30 At December 31 (in thousands) 2017 2016
Cash $ 2,359 $ 5,159 Cash in MLJV and MWJV 5 1,160 Cash equivalents 2,029 5,519 $ 4,393 $ 11,838

INTERIM CONSOLIDATED FINANCIAL STATEMENTS
29
6. TRADE AND OTHER RECEIVABLES
The trade and other receivables balance consists of: At September 30 At December 31 (in thousands) 2017 2016
Trade receivables $ 2,757 $ 1,792 Receivables in MLJV and MWJV 327 583 Sales tax receivables 123 18 Sundry receivables 46 10 $ 3,253 $ 2,403
7. INVENTORIES The inventories balance consists of: At September 30 At December 31 (in thousands) 2017 2016
Uranium concentrates and work-in-progress $ 421 $ 392 Inventory of ore in stockpiles 1,681 1,562 Mine and mill supplies in MLJV 2,360 1,989 $ 4,462 $ 3,943 Inventories-by balance sheet presentation:
Current $ 2,781 $ 2,381 Long-term-ore in stockpiles 1,681 1,562
$ 4,462 $ 3,943
8. INVESTMENTS
The investments balance consists of:
At September 30 At December 31 (in thousands) 2017 2016
Investments:
Debt instruments-fair value through profit and loss $ 32,215 $ - Equity instruments-fair value through profit and loss 4,447 3,745 Equity instruments-available for sale 16 15
$ 36,678 $ 3,760 Investments-by balance sheet presentation:
Current $ 32,215 $ - Long-term 4,463 3,760
$ 36,678 $ 3,760
During the nine months ended September 30, 2017, the Company purchased debt instruments (consisting of a GIC) for $29,740,000 and it purchased additional equity instruments in Skyharbour Resources Ltd (“Skyharbour”) for $149,000.

INTERIM CONSOLIDATED FINANCIAL STATEMENTS
30
9. INVESTMENT IN ASSOCIATES
The investment in associates balance consists of:
At September 30 At December 31 (in thousands) 2017 2016
Investment in associates-by investee:
GoviEx $ 3,688 $ 4,692 $ 3,688 $ 4,692
A summary of the investment in GoviEx is as follows: (in thousands)
Balance-December 31, 2016 $ 4,692 Share of equity loss (599) Dilution loss (405) Balance-September 30, 2017 $ 3,688
GoviEx is a mineral resource company focused on the exploration and development of its uranium properties located in Africa. GoviEx maintains a head office located in Canada and is a public company listed on the TSX Venture Exchange. At September 30, 2017 Denison held an approximate 20.24% interest in GoviEx based on publicly available information (December 31, 2016: 20.68%) and has one director appointed to the GoviEx board of directors. Through the extent of its share ownership interest and its seat on the board of directors, Denison has the ability to exercise significant influence over GoviEx and accordingly, is using the equity method to account for this investment.
The trading price of GoviEx on September 30, 2017 was CAD$0.20 per share which corresponds to a quoted market value of CAD$13,029,000 or $10,440,000 (December 31, 2016: CAD$9,772,000 or $7,278,000) for the Company’s interest in common shares of GoviEx. The following table is a summary of the consolidated financial information of GoviEx on a 100% basis taking into account adjustments made by Denison for equity accounting purposes for fair value adjustments and differences in accounting policy. Denison records its equity investment entries in GoviEx one quarter in arrears due to the information not yet being publicly available. A reconciliation of GoviEx’s summarized information to Denison’s investment carrying value is also included.
At June 30 At December 31 (in thousands) 2017 2016
Total current assets $ 3,284 $ 4,480 Total non-current assets 23,926 23,937 Total current liabilities (7,535) (7,220) Total non-current liabilities (421) (503) Total net assets $ 19,254 $ 20,694

INTERIM CONSOLIDATED FINANCIAL STATEMENTS
31
6 Months Ended (in thousands) June 30, 2017
Revenue $ - Net loss (2,882) Other comprehensive income (loss) $ - Reconciliation of GoviEx net assets to Denison investment carrying value:
Net assets of GoviEx – at December 31, 2016 $ 20,694 Share capital change 812 Share-based payment reserve change 630 Net loss (2,882) Net assets of GoviEx – at June 30, 2017 $ 19,254 Denison ownership interest 20.24% Denison share of net assets of GoviEx 3,897 Other adjustments (209)
Investment in GoviEx $ 3,688 10. RESTRICTED CASH AND INVESTMENTS
The restricted cash and investments balance consists of:
At September 30 At December 31 (in thousands) 2017 2016
Cash and cash equivalents $ 2,542 $ 277 Investments 7,320 2,037 $ 9,862 $ 2,314 Restricted cash and investments-by item:
Elliot Lake reclamation trust fund $ 2,542 $ 2,213 Letters of credit facility pledged assets 7,212 - Letters of credit additional collateral 108 101
$ 9,862 $ 2,314
Elliot Lake Reclamation Trust Fund
During the nine months ended September 30, 2017, the Company deposited an additional $693,000 (CAD$917,000) into the Elliot Lake Reclamation Trust Fund and withdrew $565,000 (CAD$741,000).
Letters of Credit Facility Pledged Assets
During the nine months ended September 30, 2017, the Company deposited CAD$9,000,000 with the Bank of Nova Scotia (“BNS”) as pledged restricted cash and investments pursuant to its obligations under an amended and extended letters of credit facility (see notes 12, 14 and 15). The monies have been invested in a GIC.
Letters of Credit Additional Collateral
As at September 30, 2017, the Company had on deposit an additional CAD$135,000 of cash collateral with BNS
in respect of the portion of its issued reclamation letters of credit in excess of the collateral available under its letters of credit facility (see notes 14 and 15). The cash collateral has been invested in a GIC.

INTERIM CONSOLIDATED FINANCIAL STATEMENTS
32
11. PROPERTY, PLANT AND EQUIPMENT
The property, plant and equipment balance consists of:
At September 30 At December 31 (in thousands) 2017 2016
Plant and equipment:
Cost $ 78,188 $ 72,601 Construction-in-progress 5,136 4,821 Accumulated depreciation (16,217) (12,609)
Net book value $ 67,107 $ 64,813 Mineral properties:
Cost $ 133,454 $ 123,340 Accumulated amortization (184) (171)
Net book value $ 133,270 $ 123,169 Total net book value $ 200,377 $ 187,982
The property, plant and equipment continuity summary is as follows: Accumulated Amortization / Net (in thousands) Cost Depreciation Book Value
Plant and equipment:
Balance-December 31, 2016 $ 77,422 $ (12,609) $ 64,813 Additions 115 - 115 Amortization - (109) (109) Depreciation - (2,485) (2,485) Disposals (89) 73 (16) Foreign exchange 5,876 (1,087) 4,789 Balance-September 30, 2017 $ 83,324 $ (16,217) $ 67,107
Mineral properties:
Balance-December 31, 2016 $ 123,340 $ (171) $ 123,169 Additions 628 - 628 Impairment recovery 246 - 246 Recoveries (149) - (149) Foreign exchange 9,389 (13) 9,376 Balance-September 30, 2017 $ 133,454 $ (184) $ 133,270
Plant and Equipment Canada Mining Segment The Company has a 22.5% interest in the McClean Lake mill located in the Athabasca Basin of Saskatchewan, Canada. A toll milling agreement has been signed with the participants in the CLJV that provides for the processing of the future output of the Cigar Lake mine at the McClean Lake mill, for which the owners of the McClean Lake mill receive a toll milling fee and other benefits. In determining the units of production amortization rate for the McClean Lake mill, the amount of production attributable to the mill assets has been adjusted to include Denison’s expected share of mill feed related to the CLJV toll milling contract.
DES The environmental services division of the Company provides mine decommissioning and decommissioned site monitoring services for third parties.

INTERIM CONSOLIDATED FINANCIAL STATEMENTS
33
Mineral Properties
Canada Mining Segment As at September 30, 2017, the Company has various interests in development and exploration projects located in Canada which are held directly or through option or various contractual agreements. Significant updates from the December 31, 2016 year-end are listed below.
Wheeler River On January 10, 2017, Denison executed an agreement with the partners of the WRJV that will result in Denison having the potential to increase its ownership in the WRJV from 60% up to approximately 66% by the end of fiscal 2018. Under the terms of the agreement, the partners have agreed to allow for a one-time election by Cameco Corp. (“Cameco”) to fund 50% of its ordinary 30% share of the WRJV expenses for fiscal 2017 and 2018. The shortfall in Cameco’s contribution will be funded by Denison in exchange for a transfer of a portion of Cameco’s interest in the WRJV. Accordingly, Denison’s share of the WRJV expenses will be 75% in fiscal 2017 and 2018. Waterbury Lake In May 2017, the Company increased its interest in the Waterbury Lake property from 63.01% to 63.63% and, in August 2017, further increased its interest to 64.22% under the terms of the dilution provisions in the agreements governing the project (see note 23). Moon Lake South In January 2016, the Company entered into an option agreement with CanAlaska Uranium Ltd (“CanAlaska”) to earn an interest in CanAlaska’s Moon Lake South project located in the Athabasca Basin in Saskatchewan. As at September 30, 2017, the Company has spent CAD$549,000 under the option and has met the CAD$200,000 spending requirement for the first stage of the option. Denison now has a 51% interest in the project. Moore Lake In August 2016, the Company closed an agreement to option its 100% interest in the Moore Lake property to Skyharbour. In April 2017, Denison received CAD$200,000 of cash consideration from Skyharbour pursuant to the terms of the option agreement and a recovery of the carrying value of Moore Lake of $149,000 was recognized. In June 2017, the Company recognized an impairment recovery of $246,000 for Moore Lake based on an update of the estimated recoverable amount remaining to be received under the option agreement.
12. DEFERRED REVENUE
The deferred revenue balance consists of: At September 30 At December 31 (in thousands) 2017 2016
Deferred revenue – toll milling $ 30,515 $ - $ 30,515 $ -
Deferred revenue-by balance sheet presentation: Current $ 2,454 $ - Non-current 28,061 -
$ 30,515 $ -

INTERIM CONSOLIDATED FINANCIAL STATEMENTS
34
The deferred revenue liability continuity summary is as follows: (in thousands)
Balance-December 31, 2016 $ - Proceeds of APG Arrangement, net
Upfront proceeds 32,860 Less: toll milling cash receipts from July 1, 2016 to January 31, 2017 (2,659)
Revenue earned during the period (1,448) Foreign exchange 1,762 Balance-September 30, 2017 $ 30,515
Arrangement with Anglo Pacific Group PLC On February 13, 2017, Denison closed an arrangement with APG under which Denison received an upfront payment of $32,860,000 (CAD$43,500,000) in exchange for its right to receive future toll milling cash receipts from the MLJV under the current toll milling agreement with the CLJV from July 1, 2016 onwards. The APG Arrangement represents a contractual obligation of Denison to pay onward to APG any cash proceeds of future toll milling revenue earned by the Company related to the processing of the specified Cigar Lake ore through the McClean Lake mill. The Company has reflected payments made to APG of $2,659,000 (CAD$3,520,000), representing the Cigar Lake toll milling cash receipts received by Denison in respect of toll milling activity for the period from July 1, 2016 through January 31, 2017, as a reduction of the initial upfront amount received and has reduced the initial deferred revenue balance to $30,201,000 (CAD$39,980,000) at the transaction date. The Company’s share of toll milling revenue for January 2017, prior to the closing of the transaction with APG, of $444,000 has been recognized as toll milling revenue in the quarter ending March 31, 2017. Following the closing of the APG Arrangement, the Company recognized $1,448,000 in additional toll milling revenue from the draw-down of deferred revenue, based on the receipt of CAD$2,979,000 in toll milling cash receipts, in accordance with its accounting policy in note 3.
In connection with the closing of the APG Arrangement, Denison reimbursed APG for $100,000 in due diligence costs and granted 1,673,077 share purchase warrants to APG in satisfaction of a $333,000 (CAD$435,000) arrangement fee payable. The warrants have an exercise price of CAD$1.27 per share and will be exercisable for a period of 3 years from the date of closing of the financing (see note 18). In addition, the terms of the 2016 BNS Letters of Credit Facility between BNS and Denison have been amended to reflect certain changes required to facilitate an Intercreditor Agreement between APG, BNS and Denison (see note 15).
13. POST-EMPLOYMENT BENEFITS
The post-employment benefits balance consists of: At September 30 At December 31 (in thousands) 2017 2016
Accrued benefit obligation $ 1,916 $ 1,832 $ 1,916 $ 1,832 Post-employment benefits liability-by balance sheet presentation:
Current $ 200 $ 186 Non-current 1,716 1,646
$ 1,916 $ 1,832

INTERIM CONSOLIDATED FINANCIAL STATEMENTS
35
The post-employment benefits continuity summary is as follows: (in thousands)
Balance-December 31, 2016 $ 1,832 Accretion 43 Benefits paid (95) Foreign exchange 136 Balance-September 30, 2017 $ 1,916
14. RECLAMATION OBLIGATIONS
The reclamation obligations balance consists of:
At September 30 At December 31 (in thousands) 2017 2016
Reclamation liability-by location:
Elliot Lake $ 13,385 $ 12,470 McClean and Midwest Joint Ventures 9,317 8,479 Other 17 16
$ 22,719 $ 20,965 Reclamation and remediation liability-by balance sheet presentation:
Current 807 810 Non-current 21,912 20,155
$ 22,719 $ 20,965
The reclamation obligations continuity summary is as follows: (in thousands)
Balance-December 31, 2016 $ 20,965 Accretion 744 Expenditures incurred (585) Foreign exchange 1,595 Balance-September 30, 2017 $ 22,719
Site Restoration: Elliot Lake
Spending on restoration activities at the Elliot Lake site is funded from monies in the Elliot Lake Reclamation Trust fund (see note 10). Site Restoration: McClean Lake Joint Venture and Midwest Joint Venture Under the Mineral Industry Environmental Protection Regulations (1996), the Company is required to provide its pro-rata share of financial assurances to the province of Saskatchewan relating to future decommissioning and reclamation plans that have been filed and approved by the applicable regulatory authorities. As at September 30, 2017, the Company has provided irrevocable standby letters of credit, from a chartered bank, in favour of the Saskatchewan Ministry of Environment, totalling CAD$24,135,000 relating to an approved reclamation plan dated March 2016.

INTERIM CONSOLIDATED FINANCIAL STATEMENTS
36
15. DEBT FACILITIES
Letters of Credit Facility
The Company’s current letters of credit facility with BNS has a maturity date of January 31, 2018 and allows for credit to be extended to the Company for up to CAD$24,000,000. Use of the facility is restricted to non-financial letters of credit in support of reclamation obligations (see note 14).
The facility contains a covenant to maintain a level of tangible net worth greater than or equal to the sum of $150,000,000 and a pledge of CAD$9,000,000 in restricted cash and investments as collateral for the facility (see note 10). As additional security for the facility, DMC has provided an unlimited full recourse guarantee and a pledge of all of the shares of DMI. DMI has provided a first-priority security interest in all present and future personal property and an assignment of its rights and interests under all material agreements relative to the McClean Lake and Midwest projects. The facility is subject to letter of credit fees of 2.40% (0.40% on the first CAD$9,000,000) and standby fees of 0.75%. At September 30, 2017, the Company is in compliance with its facility covenants and CAD$24,000,000 (December 31, 2016: CAD$24,000,000) of the facility is being utilized as collateral for letters of credit issued in respect of the reclamation obligations for the MLJV and MWJV. During the nine months ended September 30, 2017, the Company incurred letter of credit fees of $238,000.
16. OTHER LIABILITIES
The other liabilities balance consists of: At September 30 At December 31 (in thousands) 2017 2016
Unamortized fair value of toll milling contracts $ - $ 674 Flow-through share premium obligation (note 17) 3,073 1,803 $ 3,073 $ 2,477 Other long-term liabilities-by balance sheet presentation:
Current $ 3,073 $ 1,847 Non-current - 630
$ 3,073 $ 2,477
In February 2017, in conjunction with the APG Arrangement, the Company extinguished the remaining unamortized fair value of its toll milling contract liabilities and recognized a gain of $679,000 as a component of “Other income (expense)” – see note 21.

INTERIM CONSOLIDATED FINANCIAL STATEMENTS
37
17. SHARE CAPITAL Denison is authorized to issue an unlimited number of common shares without par value. A continuity summary of the issued and outstanding common shares and the associated dollar amounts is presented below:
Number of Value of Common Common
(in thousands except share amounts) Shares Shares
Balance at December 31, 2016 540,722,365 $ 1,140,631
Issued for cash: Share issue proceeds 18,337,000 14,806 Share issue costs - (851) Share option exercises 30,066 16
Share option exercises-fair value adjustment - 18 Flow-through share premium liability - (2,839) Share cancellations (5,029) -
18,362,037 11,150 Balance at September 30, 2017 559,084,402 $ 1,151,781
New Issues In March 2017, Denison completed a private placement of 18,337,000 shares of Denison for gross proceeds of $14,806,000 (CAD$20,000,290). The aggregate share offering was comprised of the following three elements: (1) a “Common Share” offering which consisted of 5,790,000 common shares of Denison at a price of CAD$0.95 per share for gross proceeds of CAD$5,500,500; (2) a “Tranche A Flow-Through” offering which consisted of 8,482,000 flow-through shares at a price of CAD$1.12 per share for gross proceeds of CAD$9,499,840; and (3) a “Tranche B Flow-Through” offering which consisted of 4,065,000 flow-through shares at a price of CAD$1.23 per share for gross proceeds of CAD$4,999,950. The income tax benefits of the flow-through elements of this issue will be renounced to subscribers no later than December 31, 2017. The related flow-through share premium liabilities are included as a component of other liabilities on the balance sheet at September 30, 2017 (see note 16).
Share Cancellations In January 2017, 5,029 shares were cancelled in connection with the January 2014 acquisition of the minority interest of Rockgate Capital Corp (“RCC”). RCC shareholders were entitled to exchange their RCC shares for shares of Denison in accordance with the share exchange ratio established for the acquisition. In January 2017, this right expired and the un-exchanged shares for which shareholders had not elected to exercise their exchange rights were subsequently cancelled. Flow-Through Share Issues The Company finances a portion of its exploration programs through the use of flow-through share issuances. Canadian income tax deductions relating to these expenditures are claimable by the investors and not by the Company. As at September 30, 2017, the Company estimates that it has satisfied its obligation to spend CAD$12,405,000 on eligible exploration expenditures as a result of the issuance of flow-through shares in May 2016. The Company renounced the income tax benefits of this issue in February 2017, with an effective date of renunciation to its subscribers of December 31, 2016. In conjunction with the renunciation, the flow-through share premium liability has been reversed and recognized as part of the deferred tax recovery (see notes 16 and 24). As at September 30, 2017, the Company estimates that is has incurred CAD$584,000 of expenditures towards its obligation to spend CAD$9,499,840 on eligible exploration expenditures as a result of the issuance of Tranche A flow-through shares in March 2017. As at September 30, 2017, the Company has not incurred any expenditures towards its obligation to spend CAD$4,999,950 on eligible exploration expenditures as a result of the issuance of Tranche B flow-through shares in March 2017.

INTERIM CONSOLIDATED FINANCIAL STATEMENTS
38
18. SHARE PURCHASE WARRANTS
A continuity summary of the issued and outstanding share purchase warrants in terms of common shares of the Company and the associated dollar amounts is presented below:
Weighted Average Number of Exercise Common Fair Price Per Shares Value (in thousands except share amounts) Share (CAD$) Issuable Amount
Balance-December 31, 2016 $ - - $ - February 2017 warrants issued 1.27 1,673,077 333 Balance-September 30, 2017 $ 1.27 1,673,077 $ 333
The February 2017 warrants were issued in conjunction with the APG Arrangement (see note 12) and expire on February 14, 2020.
19. STOCK OPTIONS A continuity summary of the stock options granted under the Company’s stock-based compensation plan is
presented below:
Weighted- Average Exercise Number of Price per Common Share Shares (CAD$)
Stock options outstanding - beginning of period 6,938,179 $ 1.06 Granted 6,459,400 0.85 Exercises (1) (30,066) 0.68 Expiries (819,524) 1.42 Forfeitures (121,500) 0.75 Stock options outstanding - end of period 12,426,489 $ 0.93 Stock options exercisable - end of period 4,803,464 $ 1.11
(1) The weighted average share price at the date of exercise was CAD$0.88.
A summary of the Company’s stock options outstanding at September 30, 2017 is presented below:
Weighted Weighted- Average Average Remaining Exercise
Range of Exercise Contractual Number of Price per Prices per Share Life Common Share (CAD$) (Years) Shares (CAD$)
Stock options outstanding $ 0.50 to $ 0.99 3.96 9,316,489 $ 0.78 $ 1.00 to $ 1.19 2.28 1,365,000 1.10 $ 1.20 to $ 1.39 0.46 827,000 1.30 $ 1.40 to $ 1.99 1.43 918,000 1.82 Stock options outstanding - end of period 3.35 12,426,489 $ 0.93
Options outstanding at September 30, 2017 expire between December 2017 and August 2022.

INTERIM CONSOLIDATED FINANCIAL STATEMENTS
39
The fair value of each option granted is estimated on the date of grant using the Black-Scholes option pricing model. The following table outlines the assumptions used in the model to determine the fair value of options granted:
Nine Months Ended
September 30, 2017
Risk-free interest rate 0.11% to 1.44% Expected stock price volatility 47.02% to 47.77% Expected life 3.4 to 3.45 years Expected dividend yield - Fair value per share under options granted CAD$0.21 to CAD$0.29
The fair values of stock options with vesting provisions are amortized on a graded method basis as stock-based compensation expense over the applicable vesting periods. Included in the statement of income (loss) is stock-based compensation of $268,000 and $703,000 for the three and nine months ended September 30, 2017 and $73,000 and $261,000 for the three and nine months ended September 30, 2016. At September 30, 2017, an additional $778,000 in stock-based compensation expense remains to be recognized up until August 2019.
20. ACCUMULATED OTHER COMPREHENSIVE INCOME (LOSS)
The accumulated other comprehensive income (loss) balance consists of: At September 30 At December 31 (in thousands) 2017 2016
Cumulative foreign currency translation $ (47,433) $ (61,371) Unamortized experience gain-post employment liability
Gross 786 786 Tax effect (208) (208)
Unrealized gains on investments Gross 7 7
$ (46,848) $ (60,786) 21. SUPPLEMENTAL FINANCIAL INFORMATION
The components of operating expenses from continuing operations are as follows: Three Months Ended Nine Months Ended
September 30 September 30 September 30 September 30 (in thousands) 2017 2016 2017 2016
Cost of goods and services sold:
Operating overheads: Mining, other development expense $ (235) $ (176) $ (456) $ (490) Milling, conversion expense (531) (533) (2,209) (1,725) Less absorption:
-Mineral properties 10 8 28 29 Cost of services (1,836) (1,817) (4,806) (5,334)
Cost of goods and services sold (2,592) (2,518) (7,443) (7,520) Reclamation asset amortization (38) (35) (109) (105) Operating expenses $ (2,630) $ (2,553) $ (7,552) $ (7,625)

INTERIM CONSOLIDATED FINANCIAL STATEMENTS
40
The components of other income (expense) for continuing operations are as follows: Three Months Ended Nine Months Ended
September 30 September 30 September 30 September 30 (in thousands) 2017 2016 2017 2016
Gains (losses) on:
Disposal of property, plant and equipment $ 12 $ - $ 21 $ 2 Disposal of equity investments - (3) - (3) Investment fair value through profit (loss) (453) 631 405 1,020 Extinguishment of toll milling contract liability (note 16)
- - 679 -
Other (115) (109) (326) (252) Other income (expense) $ (556) $ 519 $ 779 $ 767
The components of finance income (expense) for continuing operations are as follows: Three Months Ended Nine Months Ended
September 30 September 30 September 30 September 30 (in thousands) 2017 2016 2017 2016
Interest income $ 45 $ 26 $ 168 $ 153 Interest expense - - (3) (2) Accretion expense-reclamation obligations (258) (229) (744) (679) Accretion expense-post-employment benefits (15) (23) (43) (67) Finance expense $ (228) $ (226) $ (622) $ (595)
A summary of depreciation expense recognized in the statement of income (loss) is as follows: Three Months Ended Nine Months Ended
September 30 September 30 September 30 September 30 (in thousands) 2017 2016 2017 2016
Continuing operations:
Operating expenses Mining, other development expense $ (1) $ (3) $ (4) $ (11) Milling, conversion expense (532) (533) (2,209) (1,725) Cost of services (59) (68) (177) (201)
Exploration and evaluation (23) (16) (69) (43) General and administrative (9) (9) (26) (25)
Discontinued operations - - - (26) Depreciation expense-gross $ (624) $ (629) $ (2,485) $ (2,031)
A summary of employee benefits expense recognized in the statement of income (loss) is as follows:
Three Months Ended Nine Months Ended
September 30 September 30 September 30 September 30 (in thousands) 2017 2016 2017 2016
Continuing operations:
Salaries and short-term employee benefits $ (1,699) $ (1,599) $ (4,813) $ (4,839) Share-based compensation (268) (73) (703) (261) Termination benefits - (4) (13) (19)
Discontinued operations - - - (269) Employee benefits expense $ (1,967) $ (1,676) $ (5,529) $ (5,388)

INTERIM CONSOLIDATED FINANCIAL STATEMENTS
41
The change in non-cash working capital items in the consolidated statements of cash flows is as follows:
Nine Months Ended
September 30 September 30 (in thousands) 2017 2016
Change in non-cash working capital items:
Trade and other receivables $ (676) $ 1,770 Inventories (207) (15) Prepaid expenses and other assets 13 197 Accounts payable and accrued liabilities 867 (484)
Change in non-cash working capital items $ (3) $ 1,468 22. SEGMENTED INFORMATION
Business Segments
The Company operates in three primary segments – the Mining segment, the Environmental Services segment
and the Corporate and Other segment. The Mining segment has historically been further subdivided into geographic regions, being Canada, Africa and Asia, and includes activities related to exploration, evaluation and development, mining, milling (including toll milling) and the sale of mineral concentrates. The Africa and Asia Mining segments were disposed of in 2016 and 2015, respectively, and are reported under discontinued operations in the tables below (see note 4). The Environmental Services segment includes the results of the Company’s environmental services business, DES. The Corporate and Other segment includes management fee income earned from UPC and general corporate expenses not allocated to the other segments. Management fee income has been included with general corporate expenses due to the shared infrastructure between the two activities.
For the three months ended September 30, 2017, reportable segment results were as follows:
(in thousands)
Canada
Mining DES Corporate and Other
Total Continuing Operations
Total Discontinued Operations
Statement of Operations:
Revenues 456 2,007 254 2,717 -
Expenses:
Operating expenses (794) (1,803) (33) (2,630) -
Exploration and evaluation (4,348) - - (4,348) -
General and administrative (1) - (1,168) (1,169) -
Impairment recovery - - - - -
(5,143) (1,803) (1,201) (8,147) -
Segment income (loss) (4,687) 204 (947) (5,430) -
Revenues – supplemental:
Environmental services - 2,007 - 2,007 -
Management fees - - 254 254 -
Toll milling services 456 - - 456 -
456 2,007 254 2,717 -

INTERIM CONSOLIDATED FINANCIAL STATEMENTS
42
For the nine months ended September 30, 2017, reportable segment results were as follows:
(in thousands)
Canada Mining DES
Corporate and Other
Total Continuing Operations
Total Discontinued Operations
Statement of Operations:
Revenues 1,892 5,216 821 7,929 -
Expenses:
Operating expenses (2,746) (4,665) (141) (7,552) -
Exploration and evaluation (11,095) - - (11,095) -
General and administrative (12) - (4,685) (4,697) -
Impairment recovery 246 - - 246 -
(13,607)) (4,665) (4,826) (23,098) -
Segment income (loss) (11,715) 551 (4,005) (15,169) -
Revenues – supplemental:
Environmental services - 5,216 - 5,216 -
Management fees - - 821 821 -
Toll milling services 1,892 - - 1,892 -
1,892 5,216 821 7,929 -
Capital additions:
Property, plant and equipment 717 26 - 743 -
Long-lived assets:
Plant and equipment
Cost 79,629 3,460 235 83,324 -
Accumulated depreciation (13,988) (2,126) (103) (16,217) -
Mineral properties 133,270 - - 133,270 -
198,911 1,334 132 200,377 -
For the three months ended September 30, 2016, reportable segment results were as follows:
(in thousands)
Canada
Mining DES Corporate and Other
Total Continuing Operations
Total Discontinued Operations
Statement of Operations:
Revenues 1,037 2,077 375 3,489 -
Expenses:
Operating expenses (736) (1,787) (30) (2,553) -
Exploration and evaluation (3,308) - - (3,308) -
General and administrative - - (1,020) (1,020) -
Impairment expense (79) - - (79) -
(4,123) (1,787) (1,050) (6,960) -
Segment income (loss) (3,086) 290 (675) (3,471) -
Revenues – supplemental:
Environmental services - 2,077 - 2,077 -
Management fees - - 375 375 -
Toll milling services 1,037 - - 1,037 -
1,037 2,077 375 3,489 -

INTERIM CONSOLIDATED FINANCIAL STATEMENTS
43
For the nine months ended September 30, 2016, reportable segment results were as follows:
(in thousands)
Canada
Mining DES Corporate and Other
Total Continuing Operations
Total Discontinued Operations
Statement of Operations:
Revenues 3,388 5,974 1,120 10,482 -
Expenses:
Operating expenses (2,291) (5,125) (209) (7,625) (64)
Exploration and evaluation (10,037) - - (10,037) (74)
General and administrative (17) - (3,270) (3,287) (280)
Impairment expense (2,253) - - (2,253) -
(14,598) (5,125) (3,479) (23,202) (418)
Segment income (loss) (11,210) 849 (2,359) (12,720) (418)
Revenues – supplemental:
Environmental services - 5,974 - 5,974 -
Management fees - - 1,120 1,120 -
Toll milling services 3,388 - - 3,388 -
3,388 5,974 1,120 10,482 -
Capital additions:
Property, plant and equipment 879 128 - 1,007 78
Long-lived assets:
Plant and equipment
Cost 76,717 3,331 224 80,272 -
Accumulated depreciation (11,093) (1,834) (64) (12,991) -
Mineral properties 123,127 - - 123,127 -
188,751 1,497 160 190,408 -
23. RELATED PARTY TRANSACTIONS
Uranium Participation Corporation
The Company is a party to a management services agreement with UPC with an effective start date of April 1, 2016 and a term of three years. Under the agreement, Denison receives the following fees from UPC: a) a base fee of CAD$400,000 per annum, payable in equal quarterly installments; b) a variable fee equal to (i) 0.3% per annum of UPC’s total assets in excess of CAD$100 million and up to and including CAD$500 million, and (ii) 0.2% per annum of UPC’s total assets in excess of CAD$500 million; c) a fee, at the discretion of the Board, for on-going monitoring or work associated with a transaction or arrangement (other than a financing, or the acquisition of or sale of U3O8 or UF6); and d) a commission of 1.0% of the gross value of any purchases or sales of U3O8 or UF6 or gross interest fees payable to UPC in connection with any uranium loan arrangements. The following transactions were incurred with UPC for the periods noted: Three Months Ended Nine Months Ended
September 30 September 30 September 30 September 30 (in thousands) 2017 2016 2017 2016
Management fees:
Base and variable fees $ 253 $ 298 $ 808 $ 1,043 Discretionary fees - 77 - 77 Commission fees 1 - 13 -
$ 254 $ 375 $ 821 $ 1,120

INTERIM CONSOLIDATED FINANCIAL STATEMENTS
44
At September 30, 2017, accounts receivable includes $219,000 (December 31, 2016: $160,000) due from UPC with respect to the fees indicated above. Korea Electric Power Corporation (“KEPCO”) and Korea Hydro & Nuclear Power (“KHNP”)
At September 30, 2017, KEPCO, through its subsidiaries, including KHNP and its subsidiary KHNP Canada Energy Ltd. (“KHNP Canada”), holds 58,284,000 shares of Denison representing a share interest of approximately 10.42%. KHNP Canada is also the majority member of Korea Waterbury Uranium Limited Partnership (“KWULP”). KWULP is a consortium of investors that holds the non-Denison owned interests in Waterbury Lake Uranium Corporation (“WLUC”) and Waterbury Lake Uranium Limited Partnership (“WLULP”), entities whose key asset is the Waterbury Lake property. In May 2017, Denison funded 100% of the approved fiscal 2017 program for Waterbury Lake which has had the impact of further diluting KWULP’s interest in the WLULP. As a result, Denison earned an additional 0.62% interest in the WLULP, increasing Denison’s interest to 63.63%. The additional interest has been accounted for using an effective date of May 31, 2017 and has resulted in Denison recording its increased pro-rata share of the net assets of Waterbury Lake, the majority of which relates to an addition to mineral property assets of $296,000. In August 2017, Denison funded 100% of an approved expanded fiscal 2017 program for Waterbury Lake which has had the impact of further diluting KWULP’s interest in the WLULP. As a result, Denison earned an additional 0.59% interest in the WLULP, increasing Denison’s interest to 64.22%. The additional interest has been accounted for using an effective date of August 31, 2017 and has resulted in Denison recording its increased pro-rata share of the net assets of Waterbury Lake, the majority of which relates to an addition to mineral property assets of $304,000. In September 2017, Denison and KHNP Canada entered into an amended and restated strategic relationship agreement (the “Amended SRA”) to replace the June 2009 strategic relationship agreement between Denison and KEPCO (the “2009 SRA”). The Amended SRA acknowledges the transfer of the Denison shares and the rights and obligations under the 2009 SRA, by KEPCO to KHNP Canada pursuant to an internal reorganization completed by KEPCO in early 2017. Other
During the nine months ended September 30, 2017, the Company incurred investor relations, administrative service fees and other expenses of $135,000 (September 30, 2016: $125,000) with Namdo Management Services Ltd, which shares a common director with Denison. These services were incurred in the normal course of operating a public company. At September 30, 2017, an amount of $nil (December 31, 2016: $nil) was due to this company. During the nine months ended September 30, 2017, the Company incurred office expenses and other expenses of $41,000 (September 30, 2016: $17,000) with Lundin S.A, a company which provides office and administration services to the executive chairman, other directors and management of Denison. At September 30, 2017, an amount of $nil (December 31, 2016: $6,000) was due to this company.
Compensation of Key Management Personnel Key management personnel are those persons having authority and responsibility for planning, directing and controlling the activities of the Company, directly or indirectly. Key management personnel include the Company’s executive officers, vice-presidents and members of its Board of Directors. The following compensation was awarded to key management personnel:
Three Months Ended Nine Months Ended
September 30 September 30 September 30 September 30 (in thousands) 2017 2016 2017 2016
Salaries and short-term employee benefits $ (359) $ (296) $ (1,018) $ (875) Share-based compensation (239) (70) (601) (195) Key management personnel compensation $ (598) $ (366) $ (1,619) $ (1,070)

INTERIM CONSOLIDATED FINANCIAL STATEMENTS
45
24. INCOME TAXES
For the nine months ended September 30, 2017, Denison has recognized deferred tax recoveries of $3,828,000. The deferred tax recovery includes the recognition of previously unrecognized Canadian tax assets of $2,482,000 relating to the February 2017 renunciation of the tax benefits associated with the Company’s CAD$12,405,000 flow-through share issue in May 2016.
25. FAIR VALUE OF FINANCIAL INSTRUMENTS
IFRS requires disclosures about the inputs to fair value measurements, including their classification within a hierarchy that prioritizes the inputs to fair value measurement. The three levels of the fair value hierarchy are:
Level 1 – Unadjusted quoted prices in active markets for identical assets or liabilities; Level 2 – Inputs other than quoted prices that are observable for the asset or liability either directly or
indirectly; and Level 3 – Inputs that are not based on observable market data.
The fair value of financial instruments which trade in active markets, such as share and warrant equity instruments, is based on quoted market prices at the balance sheet date. The quoted market price used to value financial assets held by the Company is the current closing price. Warrants that do not trade in active markets have been valued using the Black-Scholes pricing model. Debt instruments have been valued using the effective interest rate for the period that the Company expects to hold the instrument and not the rate to maturity. Except as otherwise disclosed, the fair values of cash and cash equivalents, trade and other receivables, accounts payable and accrued liabilities, restricted cash and cash equivalents and debt obligations approximate their carrying values as a result of the short-term nature of the instruments, or the variable interest rate associated with the instruments, or the fixed interest rate of the instruments being similar to market rates.
The following table illustrates the classification of the Company’s financial assets within the fair value hierarchy as at September 30, 2017 and December 31, 2016: September 30 December 31, Financial Fair 2017 2016 Instrument Value Fair Fair (in thousands) Category(1) Hierarchy Value Value
Financial Assets:
Cash and equivalents Category D $ 4,393 $ 11,838 Trade and other receivables
Trade and other Category D 3,253 2,403 Investments
Debt instruments Category A Level 2 32,215 - Equity instruments-shares Category A Level 1 1,774 1,228 Equity instruments-warrants Category A Level 2 2,673 2,517 Equity instruments-shares Category B Level 1 16 15
Restricted cash and equivalents Elliot Lake reclamation trust fund Category C 2,542 2,213 Credit facility pledged assets Category C 7,212 - Reclamation letter of credit collateral Category C 108 101
$ 54,186 $ 20,315 Financial Liabilities:
Account payable and accrued liabilities Category E 4,991 4,141 Debt obligations Category E - 276
$ 4,991 $ 4,417 (1) Financial instrument designations are as follows: Category A=Financial assets and liabilities at fair value through profit and loss; Category
B=Available for sale investments; Category C=Held to maturity investments; Category D=Loans and receivables; and Category E=Financial liabilities at amortized cost.

Corporate Information
BOARD OF DIRECTORS
W. Robert DenglerOntario, CanadaBrian D. Edgar British Columbia, Canada Ron F. Hochstein British Columbia, Canada Kwang Hee Jeong Gyeonggi-do, Korea Lukas H. Lundin Vaud, Switzerland William A. Rand British Columbia, Canada Catherine J.G. Stefan Ontario, Canada
OFFICERS
Lukas H. Lundin Executive Chairman David D. Cates President and Chief Executive Officer Mac McDonald Vice President, Finance Chief Financial Officer Peter Longo Vice President, Project Development Michael J. Schoonderwoerd Vice President, Controller Dale Verran Vice President, Exploration Amanda Willett Corporate Counsel & Corporate Secretary
OFFICES
Head Office Denison Mines Corp. 1100 – 40 University Ave Toronto, Ontario M5J 1T1 Telephone: 416-979-1991 Facsimile: 416-979-5893 www.denisonmines.com
Denison Mines Corp. 885 West Georgia Street, Suite 2000 Vancouver, British Columbia V6C 3E8 Telephone: 604-689-7842 Toll Free: 1-888-689-7842 Facsimile: 604-689-4250
Denison Mines Corp. 230 – 22nd Street East, Suite 200 Saskatoon, Saskatchewan S7K 0E9 Telephone: 306-652-8200 Facsimile: 306-652-8202
Denison Environmental Services 1 Horne Walk, Suite 200 Elliot Lake, Ontario P5A 2A5 Telephone: 705-848-9191 Facsimile: 705-848-5814 www.denisonenvironmental.com
STOCK EXCHANGE LISTINGS
The Toronto Stock Exchange (TSX) Trading Symbol: DML
NYSE MKT LLC Trading Symbol: DNN
SHARE REGISTRAR AND TRANSFER AGENT
Computershare Investor Services Inc. 100 University Avenue, 8th Floor Toronto, Ontario M5J 2Y1 Telephone: 1-800-564-6253
AUDITOR
PricewaterhouseCoopers LLP PwC Tower 18 York Street, Suite 2600 Toronto, Ontario M5J 0B2 Telephone: 416-863-1133
ADDITIONAL INFORMATION
Further information about Denison is available by contacting Investor Relations at the head office listed above or by email to: [email protected]

Denison Mines Corp. #1100—40 University Avenue Toronto ON M5J 1T1 T 416 979 1991 F 416 979 5893 www.denisonmines.com
TSX: DML | NYSE MKT: DNN