2017 workplace bullying institute u.s. workplace bullying ... · workplacebullying.org © 2017...
TRANSCRIPT
2017 Workplace Bullying Institute U.S. Workplace Bullying Survey
Gary Namie, PhD, Research Director
Contents: Prevalence; Gender & Race; Health Impact; Rank; Notification by Targets; Employer & Witness
Reactions; Stopping the Bullying; Support for a Law; Elections Effect; Methodology
Major funding from
workplacebullying.org
Copyright 2017, Workplace Bullying Institute, LLC, All rights reserved

workplacebullying.org © 2017 Workplace Bullying Institute 1
2017 WBI U.S. Workplace Bullying Survey National Prevalence 19% of Americans have suffered abusive conduct at work; another 19% have witnessed it;
63% are aware that workplace bullying happens We used the definition of workplace bullying that matches perfectly the definition codified in the Healthy Workplace Bill. Bullying is repeated mistreatment but also “abusive conduct.” For the first time, we asked Americans to consider only the most serious forms of bullying. Wording of the Question: At work, what has been your personal experience with the following types of repeated mistreatment: abusive conduct that is threatening, intimidating, humiliating, work sabotage or verbal abuse? [Response choices are non-italicized phrases in all Tables.] Table 1.
Types of Experiences with Abusive Conduct Proportion Percentage
I am experiencing it now or have experienced it in the last year .0899 9%
I have experienced it before, but not in the last year .0956 10%
Total with Direct Experience .1855 19%
I have seen it happen to others .1471 15%
I know that it has happened to others .0461 4%
Total of those who Witnessed it .1878 19%
I’ve been a perpetrator myself .0033 .3%
I have not experienced or witnessed it: I do believe it happens in workplaces .1619 16%
I have not experienced or witnessed it: I believe that non-harmful routine interactions are what others consider “mistreatment”
.0922 9%
Public Awareness of bullying in the workplace .6311 63% I have no personal experience of knowledge of, or an opinion about, workplace mistreatment .3689 37%
Have never been bullied .6263 62% Using the stratified random sample of 1,008 adult Americans (see the Methodology section at the end of this report), one-fifth of adult Americans (19%) said they directly experienced abusive conduct at work – currently (9%) or earlier in their work life but not in the last year (10%).

workplacebullying.org © 2017 Workplace Bullying Institute 2
This 2017 Survey is the fourth national survey conducted by WBI. As we did in 2014, we incorporated the term “abusive conduct” in the question. The “witnessed” category was split into those who had seen the bullying of others and those who knew that others were bullied. Both groups would have experienced the bullying vicariously. Recent research of those who vicariously experienced bullying found that the severity of emotional injuries were similar in severity to injuries suffered by bullied individuals. The most important change was to split the “I have not experienced or witnessed it” category into three separate subgroups. For the first time, respondents were asked to declare if they were aware that bullying happens despite not having personal experiences with it. This subgroup (16%) we call the “Aware & Believers.” They are not in denial. The “Aware & Disbelievers” subgroup (9%) would be those in denial. The third subgroup is comprised of individuals who know nothing, see nothing and are completely unaware of misconduct occurring in their workplace, approximately 37% of all Americans. The partitioning of the “I have not experienced or witnessed it” group also allows us to clarify to refute the axiom that one must have first-hand knowledge of bullying to recognize its existence. In fact, the 62% of the adult American population that claims to have no experience is split into those who are aware (25%) and those who profess to know nothing (37%).
Figure 1. The percentage of adult Americans aware that abusive conduct/workplace bullying happens at work is the sum of those with direct and vicarious experience plus those with no experience but who believe it happens and those who choose to rationalize abusive conduct as “routine.” That

workplacebullying.org © 2017 Workplace Bullying Institute 3
estimate is 63% of adults. We at the Workplace Bullying Institute take some credit for the high level of public awareness. Our work began 20 years ago with the steadfast commitment to raising public awareness and the myriad of activities and programs has expanded to drive that awareness. The April 2017 survey was conducted when the U.S. laborforce was approximately 161,616,000, according to the Bureau of Labor Statistics. By applying the prevalence proportions (Table 1), we are able to estimate the equivalent number of working Americans that correspond to each bullying experience category. Thirty million American workers have been, or are now being, bullied at work. Another 30 million have witnessed it. These proportions are epidemic-level. Table 2.
Experiences U.S. Workers
I am experiencing it now or have experienced it in the last year 14,545,440
I have experienced it before, but not in the last year 15,450,489
Total with Direct Experience 29,995,926
I have seen it happen to others 22,900,987
I know that it has happened to others 7,450,497
Total of those who Witnessed it 30,351,484
Total of Workers AFFECTED (Direct + Witnessed) by Bullying 60,347,410
I’ve been a perpetrator myself 533,332
I have not experienced or witnessed it: I do believe it happens in workplaces 26,165,630
I have not experienced or witnessed it: I believe that non-harmful routine interactions are what others consider “mistreatment”
14,900,995
Public Awareness of bullying in the workplace 101,947,367
I have no personal experience of knowledge of, or an opinion about, workplace mistreatment 59,620,142
Have Never Been Bullied 101,220,099 The number of U.S. workers who are affected by bullying – summing over those with direct bullying and witnessing experiences – is 60.3 million, the combined population of six Western states.

workplacebullying.org © 2017 Workplace Bullying Institute 4
Figure 2.
workplacebullying.org © 2017 Workplace Bullying Institute 5
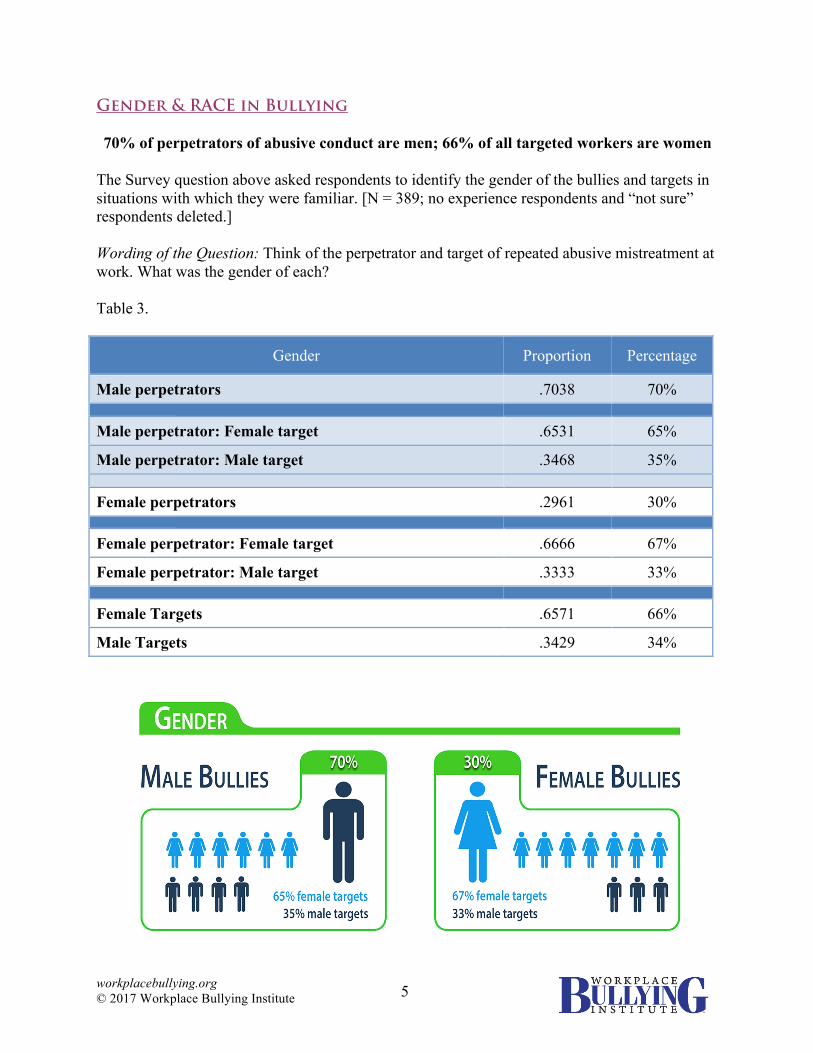
Gender & RACE in Bullying 70% of perpetrators of abusive conduct are men; 66% of all targeted workers are women
The Survey question above asked respondents to identify the gender of the bullies and targets in situations with which they were familiar. [N = 389; no experience respondents and “not sure” respondents deleted.] Wording of the Question: Think of the perpetrator and target of repeated abusive mistreatment at work. What was the gender of each? Table 3.
Gender Proportion Percentage
Male perpetrators .7038 70% Male perpetrator: Female target .6531 65%
Male perpetrator: Male target .3468 35% Female perpetrators .2961 30% Female perpetrator: Female target .6666 67%
Female perpetrator: Male target .3333 33% Female Targets .6571 66%
Male Targets .3429 34%

workplacebullying.org © 2017 Workplace Bullying Institute 6
Figure 3.
Bullies were more likely to be men (70%) than women (30%). Both men and women perpetrators disproportionately chose women as targets for bullying. Women bullied women in 67% of cases; men in 65% of cases. Women were targets in 66% of cases overall. Race & Bullying
Hispanic and African American targets are bullied at higher rates than the national rate
Race is an important demographic variable that pollsters use to achieve a representative national sample for our U.S. Workplace Bullying Surveys. The proportion that occurs in the general population was matched in the sample for this Survey. In the sample of 1,008 individuals, there were 130 Hispanic, 120 African-Americans, 30 Asian-Americans, and 681 White respondents. Below are the percentages within each ethnic group that had been bullied, witnessed it and the combined percentage to represent those “affected” by bullying. Race was crossed with the results of the Prevalence question. Table 4.
The groups most bullied were Hispanics, African-Americans and Whites in that order. Non-White respondents are considered to be members of legally protected status groups. Employers have to comply with state and federal anti-discrimination laws. That is, when they endure harassment, they would be eligible to demand protection from their employers in most situations. From the 2007 WBI U.S. Workplace Bullying Survey, we know that in 20% of bullying incidents there is an underlying discrimination component. Bullying, defined in this Survey, as abusive conduct, compounds discriminatory misconduct. In other words, bullying supplements, exacerbates, the mistreatment that may or may not have its basis in race of the bullied target. Bullying is cruelty that transcends race and gender boundaries. There were only 30 self-identified Asian-Americans in the entire sample. The only conclusion to be drawn from that small group is that those respondents were more likely to witness bullying than claim to be a victim of it. And even that conclusion may be spurious given the small number surveyed.
Race Direct Witness Affected
Hispanic 25% 14% 39%
African American 21% 22% 43%
Asian 7% 44% 51%
White 19% 17% 36%
National Sample 19% 19% 37%
workplacebullying.org © 2017 Workplace Bullying Institute 7
The overall percentage of those affected across all races was 37%. The two credible non-White groups had higher rates than the national rate. African-Americans were affected at the 43% rate and Hispanics 39%.
workplacebullying.org © 2017 Workplace Bullying Institute 8
Target Health Impact
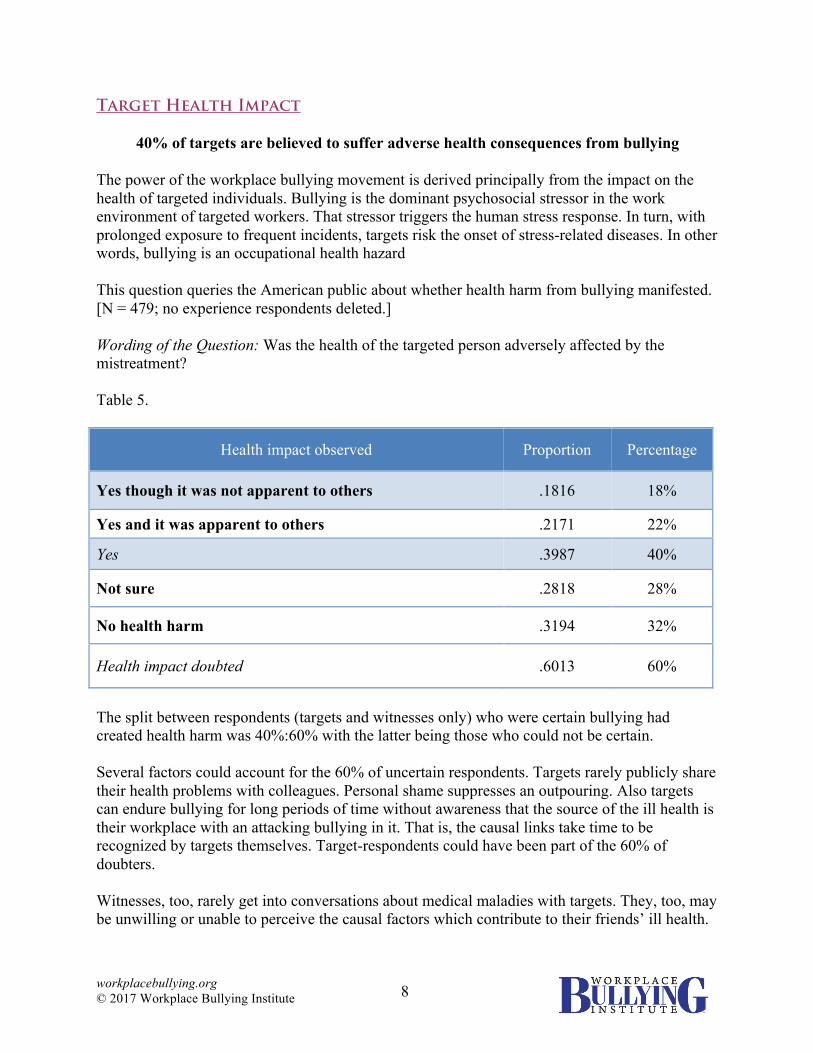
40% of targets are believed to suffer adverse health consequences from bullying The power of the workplace bullying movement is derived principally from the impact on the health of targeted individuals. Bullying is the dominant psychosocial stressor in the work environment of targeted workers. That stressor triggers the human stress response. In turn, with prolonged exposure to frequent incidents, targets risk the onset of stress-related diseases. In other words, bullying is an occupational health hazard This question queries the American public about whether health harm from bullying manifested. [N = 479; no experience respondents deleted.] Wording of the Question: Was the health of the targeted person adversely affected by the mistreatment? Table 5.
Health impact observed Proportion Percentage
Yes though it was not apparent to others .1816 18%
Yes and it was apparent to others .2171 22%
Yes .3987 40%
Not sure .2818 28%
No health harm .3194 32%
Health impact doubted .6013 60%
The split between respondents (targets and witnesses only) who were certain bullying had created health harm was 40%:60% with the latter being those who could not be certain. Several factors could account for the 60% of uncertain respondents. Targets rarely publicly share their health problems with colleagues. Personal shame suppresses an outpouring. Also targets can endure bullying for long periods of time without awareness that the source of the ill health is their workplace with an attacking bullying in it. That is, the causal links take time to be recognized by targets themselves. Target-respondents could have been part of the 60% of doubters. Witnesses, too, rarely get into conversations about medical maladies with targets. They, too, may be unwilling or unable to perceive the causal factors which contribute to their friends’ ill health.

workplacebullying.org © 2017 Workplace Bullying Institute 9
Figure 4.

workplacebullying.org © 2017 Workplace Bullying Institute 10
Perpetrator Rank & Numbers
61% of bullies are bosses; in 63% of incidents the perpetrator operates alone Mobbing was the term adopted by Heinz Leymann to describe health-harming abusive conduct at work. Mobbing implies that there are multiple perpetrators, a “gang.” Mobbing preceded the term workplace bullying historically. However, WBI has consistently defined bullying as committed by one or more persons. Bullying nearly always escalates to engage more than one person who joins the instigator to torment the target. For this question, the response categories allowed respondents familiar with bullying either directly or indirectly as witnesses [N = 374 with no experience respondents and “not sure” respondents deleted] to comment on both number of perpetrators and the organizational rank(s) of the bullies. Wording of the Question: Who was (were) the principal perpetrator(s)? Table 6.
Responses Percentage
Solo higher rank perpetrator 37.16%
Solo same-ranked perpetrator 21.39%
Solo lower rank (subordinate) perpetrator 4.27%
Multiple higher rank perpetrators 19.52%
Multiple same-ranked perpetrators 8.82%
Lower rank (subordinate) perpetrators 1.6%
Multiple higher and lower rank perpetrators 7.22% From Table 6, we can say the following: - 63% of cases involved single perpetrators - 37% of cases involved multiple perpetrators - 61% of perpetrators had a higher rank then their targets - 33% of perpetrators were peers with the same rank as their targets - 6% of perpetrators were subordinates who bullied targets with higher rank In 7% of cases, the bullying was generated by a combination of perpetrators operating at different levels of the organization – bosses, peers, and subordinates.

workplacebullying.org © 2017 Workplace Bullying Institute 11
Figure 5.
workplacebullying.org © 2017 Workplace Bullying Institute 12
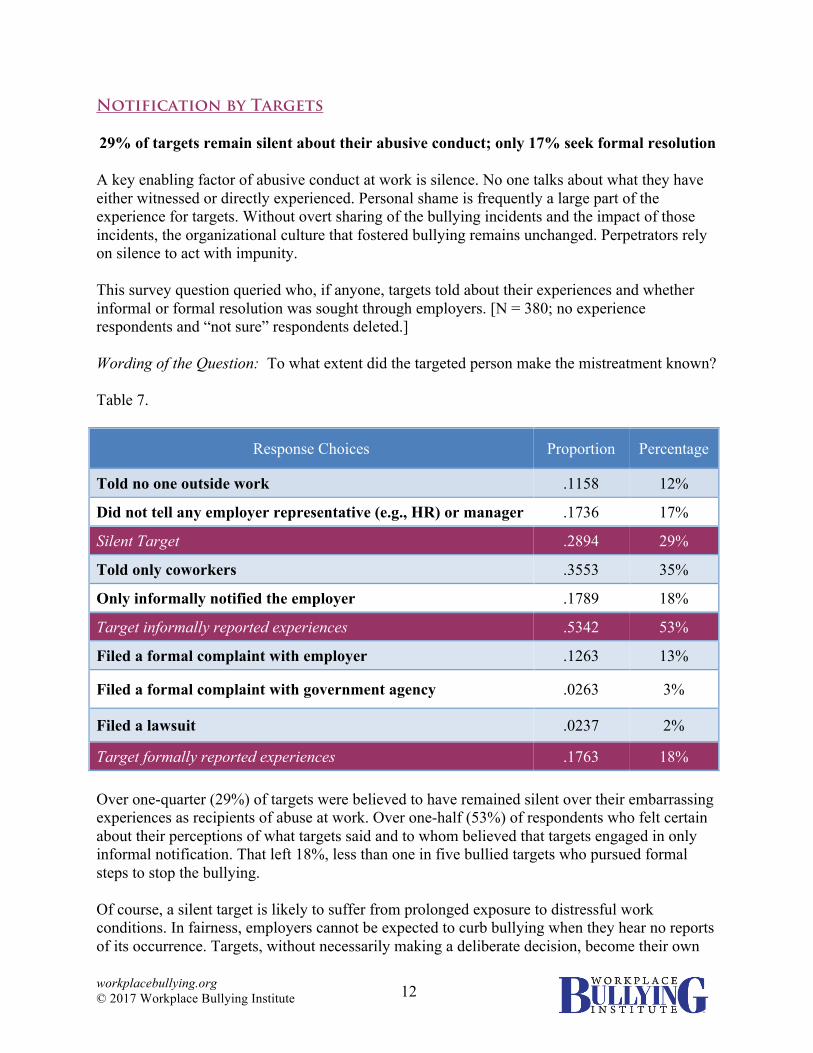
Notification by Targets 29% of targets remain silent about their abusive conduct; only 17% seek formal resolution A key enabling factor of abusive conduct at work is silence. No one talks about what they have either witnessed or directly experienced. Personal shame is frequently a large part of the experience for targets. Without overt sharing of the bullying incidents and the impact of those incidents, the organizational culture that fostered bullying remains unchanged. Perpetrators rely on silence to act with impunity. This survey question queried who, if anyone, targets told about their experiences and whether informal or formal resolution was sought through employers. [N = 380; no experience respondents and “not sure” respondents deleted.] Wording of the Question: To what extent did the targeted person make the mistreatment known? Table 7.
Response Choices Proportion Percentage
Told no one outside work .1158 12%
Did not tell any employer representative (e.g., HR) or manager .1736 17%
Silent Target .2894 29%
Told only coworkers .3553 35%
Only informally notified the employer .1789 18%
Target informally reported experiences .5342 53%
Filed a formal complaint with employer .1263 13%
Filed a formal complaint with government agency .0263 3%
Filed a lawsuit .0237 2%
Target formally reported experiences .1763 18% Over one-quarter (29%) of targets were believed to have remained silent over their embarrassing experiences as recipients of abuse at work. Over one-half (53%) of respondents who felt certain about their perceptions of what targets said and to whom believed that targets engaged in only informal notification. That left 18%, less than one in five bullied targets who pursued formal steps to stop the bullying. Of course, a silent target is likely to suffer from prolonged exposure to distressful work conditions. In fairness, employers cannot be expected to curb bullying when they hear no reports of its occurrence. Targets, without necessarily making a deliberate decision, become their own
workplacebullying.org © 2017 Workplace Bullying Institute 13
worst enemies. It is noteworthy that a group of targets of unknown size do choose to not inform their employers out of a genuine fear of retaliation and reprisal. Contrary to the myth that victims (targets) are “sue-crazy,” only 5% take their stories outside the boundaries of their employers’ world. Thus, bullying is a secret kept by employers within their organizations. A mere 3% use federal or state agencies to seek redress. A miniscule 2% ever file a lawsuit. The author of this report, in the role of expert witness in litigation cases, can confirm that only a small proportion of file lawsuits ever make it the courtroom to be tried on the merits of the cases. The vast majority are tossed by judges acceding to employer motions for summary judgment or dismissal.
workplacebullying.org © 2017 Workplace Bullying Institute 14
Employer Reactions
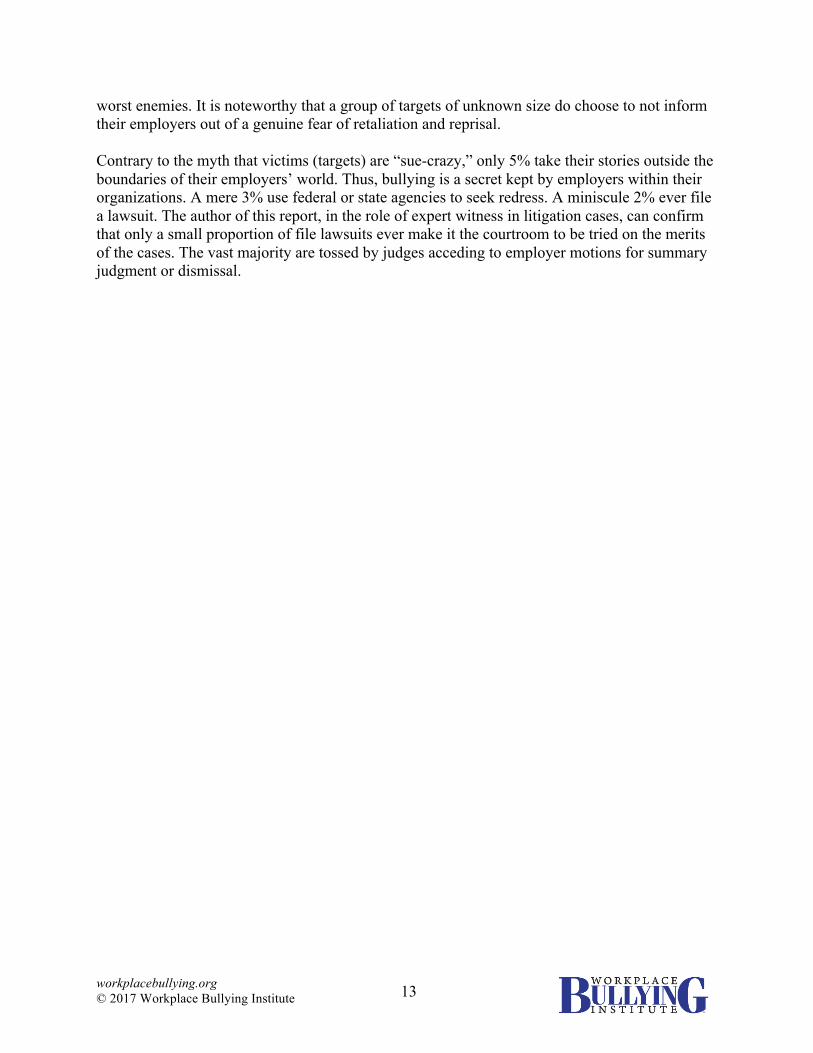
71% of U.S. employers react to reports of abusive conduct in ways that harm targets Employers have the power to either sustain or eliminate abusive conduct. Anecdotal evidence suggests that American employers rarely take steps to assist the aggrieved employee (the target). This question asks what the public believes employers actually do. [N = 479; no experience respondents deleted.] Wording of the Question: Upon learning of the abusive conduct, what did the employer do? Table 8.
Employer Reactions Proportion Percentage
Employer never learned about the misconduct .2192 22%
Not sure .3382 34%
Complaint filed, employer did nothing .2594 26%
Employer investigated complaint inadequately, nothing changed .4622 46%
Negative Reactions .7075 71%
Employer investigated complaint, positive changes for target .2311 23%
Post-investigation negative outcomes for perpetrator .0613 6%
Positive Reactions .2925 29% For many respondents, employer reactions were obscured. Two sub-groups of respondents were eliminated – “employer never learned” and “not sure” – representing 56% of the initial sample. For a host of possible reasons (e.g., the target never reported it), employer actions were unknown to over half of the sample. It is also very difficult for observers to be certain what employers know and what they do because so many actions are shrouded in secrecy beneath the veil of “confidentiality.” Respondents who were sufficiently certain of what employers did, the remaining 44% of the sample [N = 212], concluded that 71% of employers took steps that did not benefit the targeted worker. The most frequent negative employer reaction is to conduct what targets describe as “sham” investigations characterized by major shortcomings. Investigator biases are often legend. Coworkers, for understandable reasons, fail to corroborate their bullied peer’s account of alleged bullying incidents. Key individuals are not interviewed. Greater weight is given to perpetrators’ versions of incidents. Objective historical documentation is ignored or discounted. “Sham” investigations end with an inconclusive result but with inadequate or inaccurate execution. To be

workplacebullying.org © 2017 Workplace Bullying Institute 15
fair to investigators with integrity, the process is fraught with problems in bullying cases different than investigations of routine conflict or illegal forms of discriminatory misconduct. An endpoint of “she said/she said” is common. WBI survey respondents say it happens in 46% of cases. Because abusive conduct is a form of workplace violence, the complainant has likely suffered long prior to requesting an investigation. Therefore, when no work environment changes to restore psychological safety for complainants follow an investigation, investigators necessarily should understand the perception of incredulity by victims of the psychological violence. Employer apologists might argue that an employer’s decision to do nothing is an act of neutrality. However, this is wrong. Doing nothing or showing indifference to filed complaints or discovering a procedural technicality to justify not responding to the complaints is an act of complicity with the aggressor. By enabling bullying with impunity, the institution takes the side of perpetrators and provides shelter from the accountability they seek. Doing nothing happens 26% of the time, according to the survey respondents. Positive employer actions resulted in 29% of cases. Perpetrators endured negative outcomes in only 6% of the cases.

workplacebullying.org © 2017 Workplace Bullying Institute 16
Witness Reactions
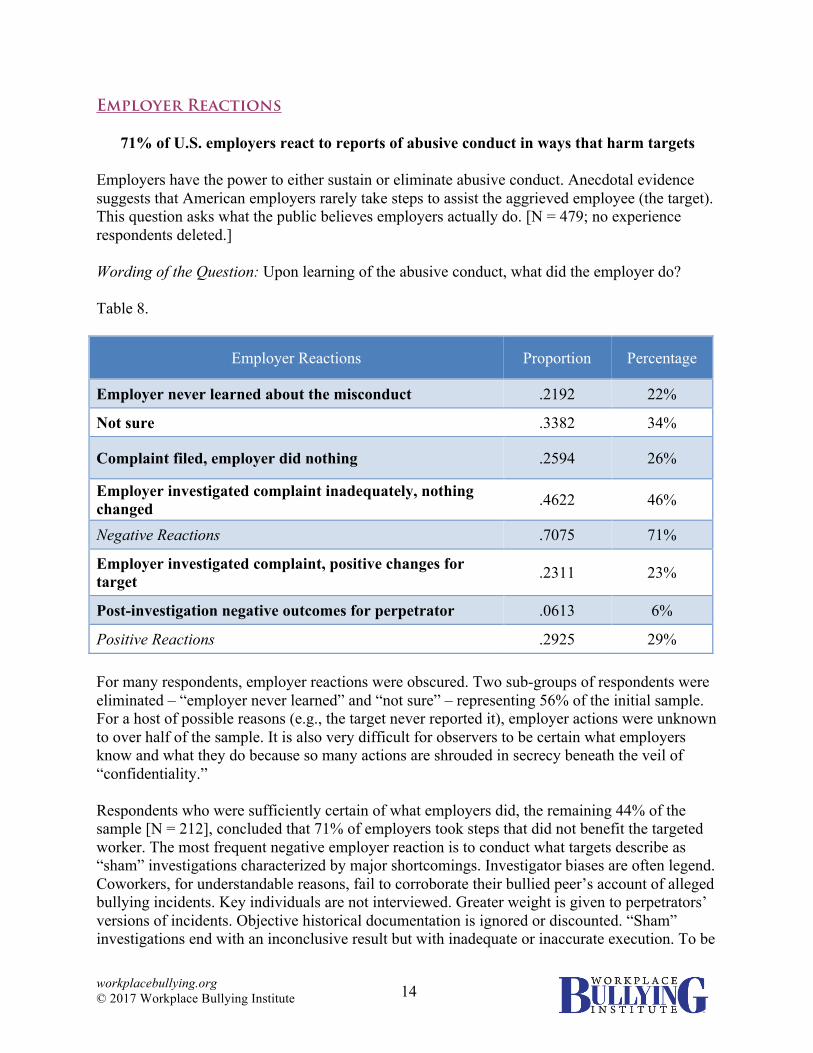
60% of coworker/witnesses’ reactions to bullying harmed their targeted colleagues Results from several WBI online surveys of bullied targets reliably show that coworkers rarely help their bullied colleagues. Several social psychological processes operate in the group setting to explain the failure to act prosocially toward colleagues. The question explored a range of positive and negative actions taken by witnesses to the bullying. [N = 362 with no experience respondents and “not sure” respondents deleted.] Wording of the Question: How did most of the witnesses react to the repeated mistreatment of their targeted coworker? Table 9.
Responses Proportion Percentage
Privately aided the target/victim .1574 16%
Publicly helped the target/victim: corroboration, reported incidents .1049 10%
Attempted to intervene or resolve: talked to perpetrator and/or management .1132 11%
Called in the union that helped .0193 2%
Did nothing .3950 40%
Isolated/ostracized/avoided the target .1353 13%
Sided with the perpetrator: ended relationships with the target/victim .0361 4%
Doing nothing was the most cited tactic (40%). Of course, doing nothing to help colleagues when they are distressed is not a neutral act. It is negative. However, it is not the same as betraying the target by siding with the perpetrator(s), believed by respondents from the general American public to happen in only 4% of cases. Positive witness reactions occurred in 40% of cases, according to survey respondents. Negative actions were taken in 60% of cases.
workplacebullying.org © 2017 Workplace Bullying Institute 17
Figure 6.
workplacebullying.org © 2017 Workplace Bullying Institute 18
Stopping the Bullying
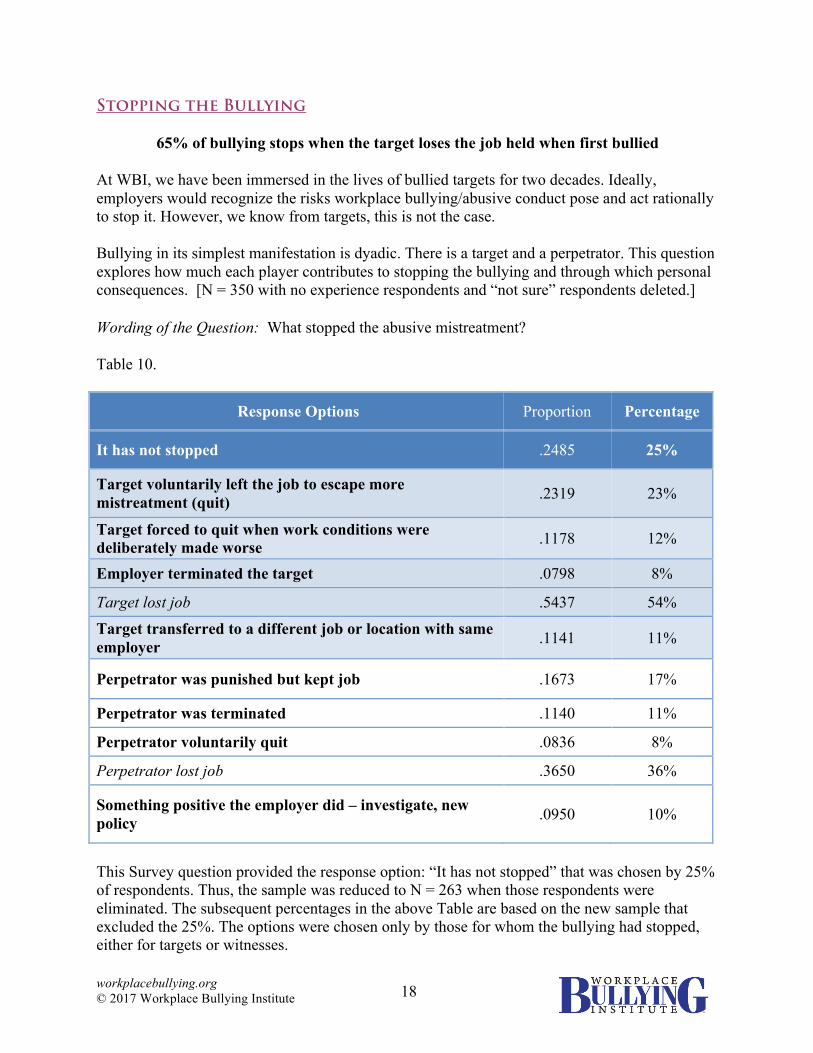
65% of bullying stops when the target loses the job held when first bullied At WBI, we have been immersed in the lives of bullied targets for two decades. Ideally, employers would recognize the risks workplace bullying/abusive conduct pose and act rationally to stop it. However, we know from targets, this is not the case. Bullying in its simplest manifestation is dyadic. There is a target and a perpetrator. This question explores how much each player contributes to stopping the bullying and through which personal consequences. [N = 350 with no experience respondents and “not sure” respondents deleted.] Wording of the Question: What stopped the abusive mistreatment? Table 10.
Response Options Proportion Percentage
It has not stopped .2485 25%
Target voluntarily left the job to escape more mistreatment (quit) .2319 23%
Target forced to quit when work conditions were deliberately made worse .1178 12%
Employer terminated the target .0798 8%
Target lost job .5437 54%
Target transferred to a different job or location with same employer .1141 11%
Perpetrator was punished but kept job .1673 17%
Perpetrator was terminated .1140 11%
Perpetrator voluntarily quit .0836 8%
Perpetrator lost job .3650 36%
Something positive the employer did – investigate, new policy .0950 10%
This Survey question provided the response option: “It has not stopped” that was chosen by 25% of respondents. Thus, the sample was reduced to N = 263 when those respondents were eliminated. The subsequent percentages in the above Table are based on the new sample that excluded the 25%. The options were chosen only by those for whom the bullying had stopped, either for targets or witnesses.

workplacebullying.org © 2017 Workplace Bullying Institute 19
The sad reality is that even the general public seems to know that it is the target, the victim of the abuse, who is asked to make additional sacrifices to stop the bullying. In 54% of cases, bullying stops only when the target loses her or his job. Remember that individuals do not invite this severe misery into their work lives. Therefore, once a person is targeted for bullying – a choice made by the perpetrator(s) – that person has a 5 out of 10 chance of losing her or his livelihood. If one adds the 11% of targets who had to transfer to retain employment, 65% of targets had to leave the job they loved for no cause. Furthermore, the target is driven to quit. Voluntary quitting (23%) is usually based on escalating health problems that families and physicians recognize, then encourage the target to leave the job. But 12% of quitting is based on decisions made after work conditions become untenable, so cruel as to drive a rational person to escape. Constructive discharge is the goal for many perpetrators. Terminations (8%) of the skilled but threatening (to bullies) targets are typically based on fabricated lies. Several WBI surveys of bullied targets substantiate this claim.
Figure 7. Accepting a transfer to retain a job (11%), to bullied targets, is often a source of perceived injustice. Their reasoning is “I did nothing to deserve the abuse, why should I be the one to leave the job I love and am best qualified to perform.” To many, transfers are punitive. On the other hand, it prevents economic devastation and might provide a degree of psychological safety.
workplacebullying.org © 2017 Workplace Bullying Institute 20
The pattern of results from this national sample stands in marked contrast with WBI studies asking the same question of a sample of only bullied targets. To them, the ratio of negative consequences experienced by targets is 7:1 when compared to negatives for perpetrators. The public overestimates the proportion of negative consequences suffered by perpetrators. In this 2017 version of the national survey, we added the option for respondents to choose –employers stopped the bullying by doing something positive and proactive such as creating a policy or conducting credible investigations. Ten percent of respondents chose this option.

workplacebullying.org © 2017 Workplace Bullying Institute 21
Support for New Law
77% of Americans support a new law to address abusive conduct at work When the 2017 WBI U.S. Workplace Bullying data were collected, legislation written to address abusive conduct in American workplaces – the Healthy Workplace Bill – had been introduced in 30 states and Territories. The bill had not yet been enacted into law in its complete form. We asked all respondents [N = 1,008] whether they supported or opposed such a law. Wording of the Question: Do you support or oppose enactment of a new law that would protect all workers from repeated health-harming abusive mistreatment in addition to protections against illegal discrimination and harassment? Table 11.
Response Options Proportion Percentage
Strongly support .4752 47%
Somewhat support .2976 30%
Not sure .1488 15%
Somewhat oppose .0387 4%
Strongly oppose .0407 4% It is clear that the American public wants to see worker protections against abusive conduct extended beyond the anti-discrimination statutes – 77% support specific anti-bullying legislation when strongly support and somewhat support proportions are combined.

workplacebullying.org © 2017 Workplace Bullying Institute 22
Figure 8. Self-described political ideology was one of the demographic variables provided by Zogby. There were 242 liberals, 314 moderates and 369 conservatives. Table 12 shows the pattern of support and opposition for the new anti-abuse workplace law. The phenomenon of bullying ignores ideological boundaries (with the possible Trump effect being the exception, see the analysis of the final question). Nevertheless, liberals and moderates showed the strongest support for the bill. It is noteworthy that two-thirds of conservatives support enacting the law against abusive conduct at work. Table 12.
Strongly Support Somewhat Support Overall Support Oppose
Liberal 69.8% 19.8% 89.6% 2%
Moderate 43.6% 39.4% 83.1% 4%
Conservative 38.2% 28.9% 67.2% 14.6%

workplacebullying.org © 2017 Workplace Bullying Institute 23
Trump Effect
46% believe the brutish 2016 election campaigns negatively impact the workplace The U.S. is unique among nations in the world when it comes to electing its political leaders. Candidates for the highest office, the President, spend nearly two years campaigning for the four-year post. The run-up to the election of November 2016 for President and members of Congress began in 2015. Media coverage was amplified by three major cable networks devoted nearly entirely to political campaigning. The role of social media online also drove the themes during the seemingly endless two years. The saturation coverage magnified flaws in candidates. There was an unprecedented amount of rancor among candidates on the Republican side. Veteran Republican candidates seemed to coalesce into an anti-Trump coalition. Over the two years, Donald Trump showed a willingness to behave in a non-normative manner. There were several episodes during which his personal vulgarity was exposed. However, he paid no political penalty for these foibles. His shortcomings, read by most as evidence of bullying with a narcissistic flair, encouraged his supporters. Pundits and commenters lamented the coarsening of political campaigns. Before the election, with nearly two years exposure to bullying and disrespect exhibited at the highest level, school bullying researchers noted the increase in aggression among school age children. Ultimately, Trump was rewarded, not sanctioned, for his conduct. He had modeled bullying and given license for others to forego norms of interpersonal civility and kindness. This survey question, asked the entire sample [N = 1,008] to opine about whether the American workplace had been influenced by the two-year bombardment of bullying messages manifested during the long electoral campaign. Wording of the Question: How did the presidential and congressional elections of 2016 affect relationships in American workplaces? Table 13.
Response Options Proportion Percentage
Relations improved .1888 19%
No effect – relations remain good overall .1954 20%
No effect – relations remain poor overall .1582 16%
Relations worsened .4561 46%

workplacebullying.org © 2017 Workplace Bullying Institute 24
We eliminated the “not sure” respondents [N = 752] to calculate the above percentages. Of those respondents who had an opinion, as Table 13 shows, 46% of Americans say that the brutish campaigns leading to the 2016 election did negatively impact the workplace. Combining the two “no effect” response classes with the “improved” and the “worsened” responses suggests that 61% of Americans think that the current state of relationships among workers is bad. American society at the time of this survey is politically polarized. Zogby Analytics provides WBI with several demographic measures of the survey sample. One variable is the respondents’ self-described political affiliation. The Trump effect seems dependent on that affiliation. Republicans perceive the election as positive for the workplace as negative. Whereas Democrats see little improvement and mostly decline in interpersonal relations as the result of the election. Table 14.
Improved Worsened
Republican 34% 35%
Democrat 6% 59%
Independent 16% 41%
workplacebullying.org © 2017 Workplace Bullying Institute 25
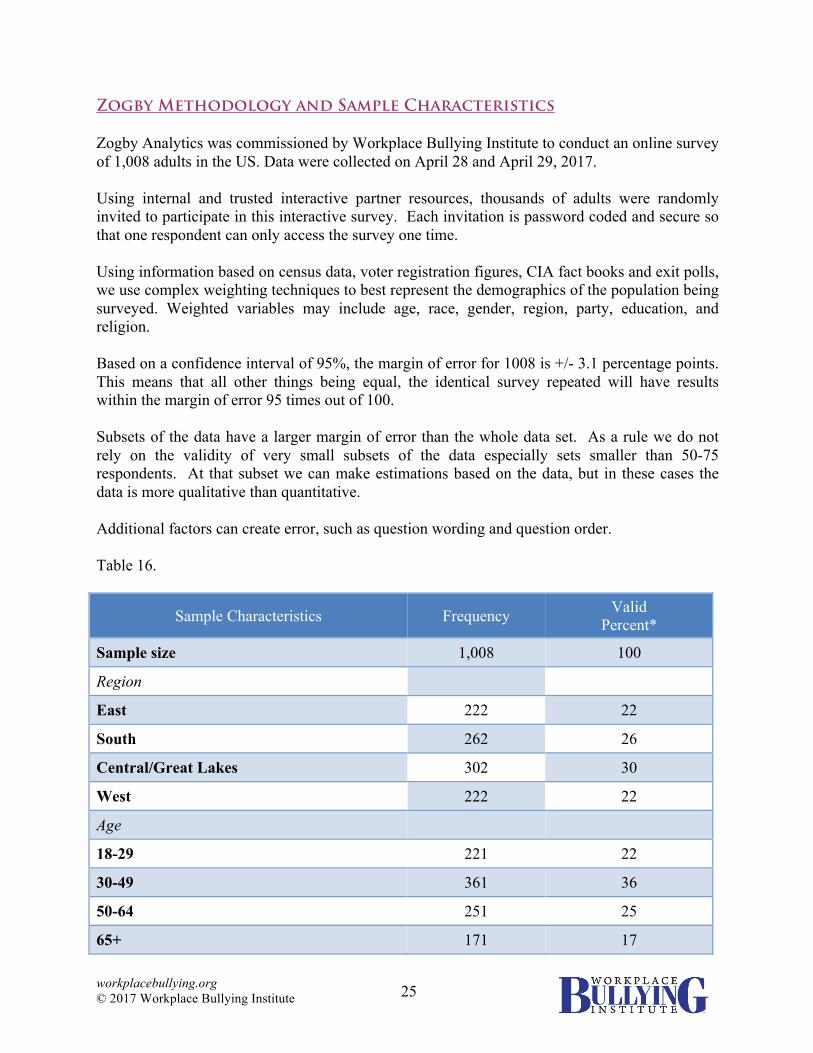
Zogby Methodology and Sample Characteristics Zogby Analytics was commissioned by Workplace Bullying Institute to conduct an online survey of 1,008 adults in the US. Data were collected on April 28 and April 29, 2017. Using internal and trusted interactive partner resources, thousands of adults were randomly invited to participate in this interactive survey. Each invitation is password coded and secure so that one respondent can only access the survey one time. Using information based on census data, voter registration figures, CIA fact books and exit polls, we use complex weighting techniques to best represent the demographics of the population being surveyed. Weighted variables may include age, race, gender, region, party, education, and religion. Based on a confidence interval of 95%, the margin of error for 1008 is +/- 3.1 percentage points. This means that all other things being equal, the identical survey repeated will have results within the margin of error 95 times out of 100. Subsets of the data have a larger margin of error than the whole data set. As a rule we do not rely on the validity of very small subsets of the data especially sets smaller than 50-75 respondents. At that subset we can make estimations based on the data, but in these cases the data is more qualitative than quantitative. Additional factors can create error, such as question wording and question order. Table 16.
Sample Characteristics Frequency Valid Percent*
Sample size 1,008 100
Region
East 222 22
South 262 26
Central/Great Lakes 302 30
West 222 22
Age
18-29 221 22
30-49 361 36
50-64 251 25
65+ 171 17
workplacebullying.org © 2017 Workplace Bullying Institute 26
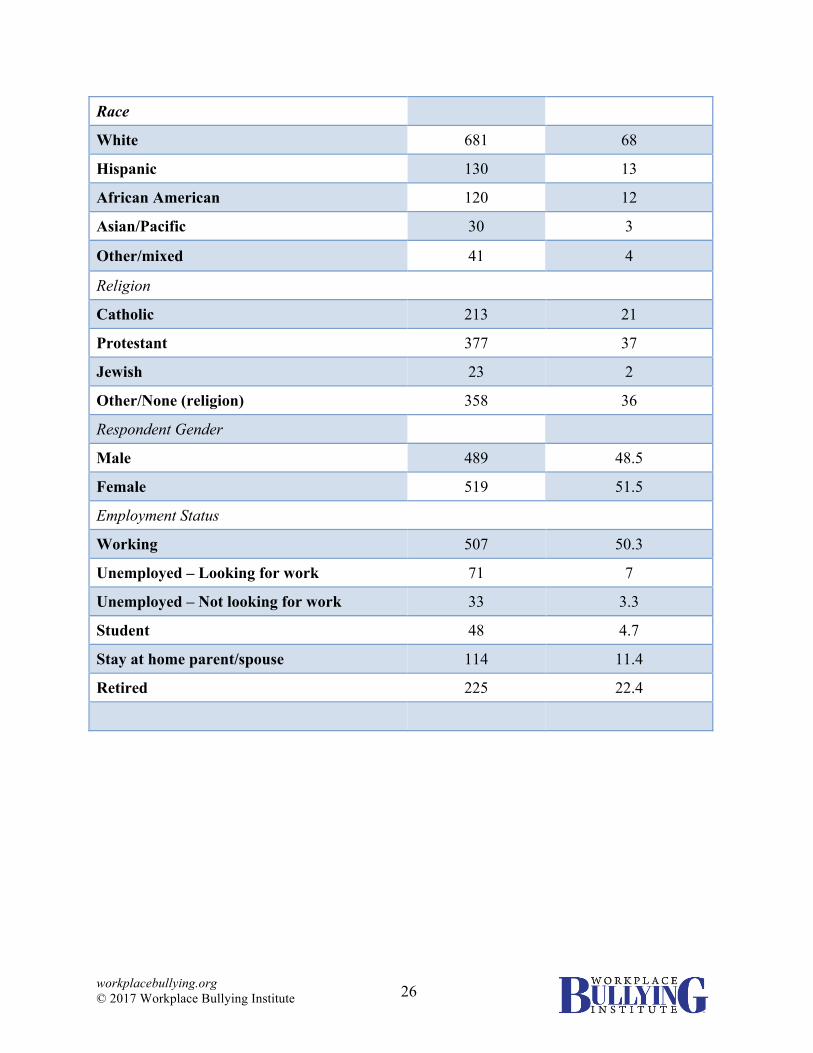
Race
White 681 68
Hispanic 130 13
African American 120 12
Asian/Pacific 30 3
Other/mixed 41 4
Religion
Catholic 213 21
Protestant 377 37
Jewish 23 2
Other/None (religion) 358 36
Respondent Gender
Male 489 48.5
Female 519 51.5
Employment Status
Working 507 50.3
Unemployed – Looking for work 71 7
Unemployed – Not looking for work 33 3.3
Student 48 4.7
Stay at home parent/spouse 114 11.4
Retired 225 22.4

workplacebullying.org © 2017 Workplace Bullying Institute 27
About MAPE – Major Sponsor of the Survey
MAPE is a public-sector labor union which promotes the welfare and advances the interests of its members while acting as their exclusive representative concerning terms and conditions of employment. Members are probation officers analysts, scientists, foresters psychologists, zoologists and so much more. MAPE members work in all segments of state government to provide Minnesotans with the vital services they need. MAPE is proud to contribute to the high quality of life in Minnesota!
mape.org About WBI
The Workplace Bullying Institute is the first and still the only U.S. organization dedicated to the eradication of workplace bullying that combines help for individuals, research, books, public education, training for professionals-unions-employers, legislative advocacy, and consulting solutions for organizations. The founders, Dr. Ruth and Dr. Gary Namie, began their work in Benicia California in mid-1997. WBI is once again located in the San Francisco Bay Area. The 2017 WBI U.S. Workplace Bullying Survey is the fourth national scientific survey done by WBI. Additional WBI studies can be found at the WBI website.
workplacebullying.org v. 060617