20170404 - strategic outlook event (kelowna) · • since early 2000’s • us growth -...
TRANSCRIPT


Our Speakers
Rob Edel Chief Investment Officer
John Nicola Chairman & CEO

Our Speakers
Rob Edel Chief Investment Officer
Mark Therriault Chairman & CEO Mark Therriault Financial Advisor

Who We Are Founded in 1994
$4.8 billion in AUM
Vancouver, Toronto, Kelowna, Richmond

Budgeting Cash Flow and Compensation
Estate And Succession
Planning Legal Coordination And
Document Retention
Coordination of Tax Planning
Philanthropic Giving And
Management
Asset Allocation And Investment Management
Insurance Placement And Management
Coordination &
Management
Our Focus: Total Integration of Financial & Wealth Management Strategies

2017 Market Outlook
Rob Edel Chief Investment Officer

Our Agenda
2016 in Review Investment Strategies
Dr. Trump
Treatment Options
Economic Diagnosis
Make the Economy Great Again

2016 in Review S&P 500
Trump Bump
Election Uncertainty Search For
Yield Recession
Fears
Brexit Trump Elected

2016 in Review U.S. 10 Year Treasury Bond Yields
Trump Bump
Election Uncertainty
Search For Yield
Recession Fears
Brexit Trump Elected

U.S. GDP Purchasing Manager Index
2016 in Review U.S. Economy
New Jobs NFIB Small Business Optimism

WSJ – July 30, 2016
2016 in Review U.S. GDP
Symptom: • Why isn’t the economy great?
4.1% 3.8% 2.7% 2.1%
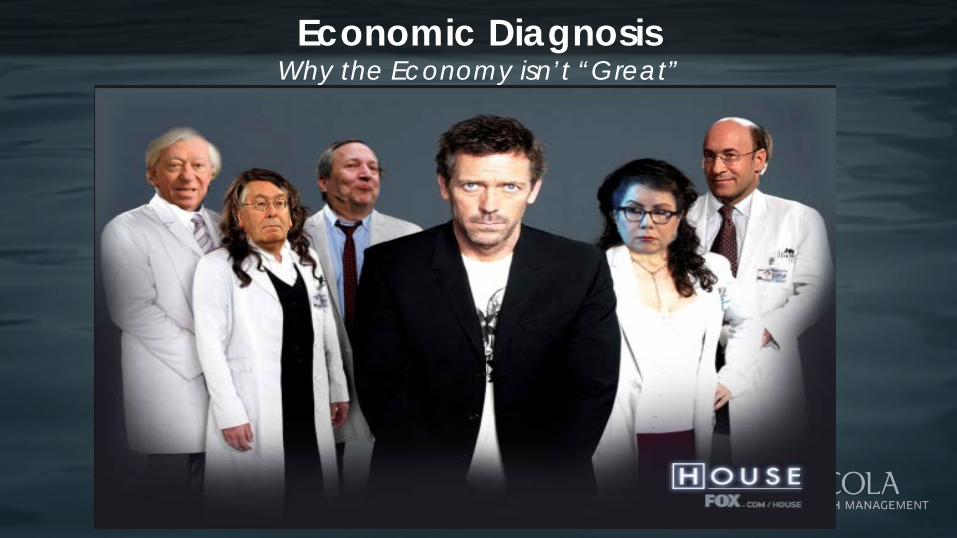
Economic Diagnosis Why the Economy isn’t “Great”

Economic Diagnosis Doctor Robert Gordon – Productivity Slowdown
WSJ – Aug 10, 2016
Dr. Robert Gordon Productivity Slowdown • Supply-side secular stagnation • Productivity gains from IT over • Norm is lower productivity
“We wanted flying cars, but instead we got 140 characters.” - Peter Thiel

Economic Diagnosis Doctor Larry Summers – Secular Stagnation
Dr. Larry Summers Secular Stagnation
• Not enough demand • Leads to lower investment • Lack of demand creates lack of supply • Need to borrow more – fiscal stimulus
Business Insider – Aug 17, 2106

Economic Diagnosis Doctor’s Reinhart & Rogoff – De-leveraging
Dr. Carmen Reinhart Dr. Kenneth Rogoff Deleveraging
• Too much debt • Deleveraging takes 8 years • Recoveries are weaker
https://www.newyorkfed.org/microeconomics/hhdc.html
Recession
• Deleveraging made recession worse • But GDP Growth was slowing
well before deleveraging began • Debt increased because GDP slowed
WSJ – Oct 6, 2016

Economic Diagnosis Doctor Mervyn King – Savings Glut
Dr. Mervyn King Savings Glut
• Unsustainable trade imbalance • Since early 2000’s
• US growth - consumption • Asia/Europe growth - Exports • US consumer add debt • China buy US Treasury’s
• Lower US interest rates • Lower US inflation WSJ – Nov 16, 2016

Treatment Options Dr. Trump or Mr. Burns

POSSIBLE OUTCOMES OF A TRUMP PRESIDENCY AT VARIOUS PLACES ON THE RISK CURVE
NUCLEAR WAR
BRINGING EMBARASMENT TO AMERICA ON THE WORLD
STAGE
GOOD DEALS
SOME COOL INFRASTRUCTURE
STUFF
MEXICO PAYING FOR THE WALL
Treatment Options Dr. Trump or Mr. Burns
Business Insider
Probability
Return + -
TRUMP IMPEACHED DUE TO RUSSIAN COLLUSION
TRADE WAR WITH CHINA
This presentation is not an endorsement of President Trump or an endorsement of any of President Trump’s policies. NWM has had no contact with any Russian foreign nationals in the past, nor do we
intend to in the future. Any statements to the contrary are fake news.
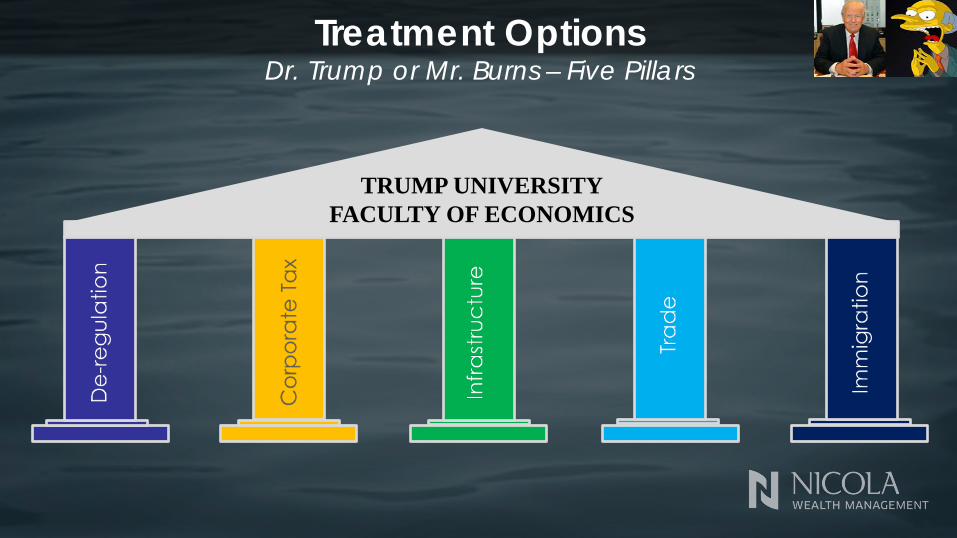
Treatment Options Dr. Trump or Mr. Burns – Five Pillars
TRUMP UNIVERSITY FACULTY OF ECONOMICS

JP Morgan Eye on the Market – Michael Cembalest Jan 23, 2017
George Mason University • Regulations across 22 industries reduce GDP 0.8%/yr. • Economy would be 25% larger if no regulations since 1980
World Bank - Ease of Doing Business Report • U.S. 51/190 for starting a business • 2012 – 40 days to get a construction permit • 2016 – 81 days
1950 – 5% of workers required a license or certificate 2016 – 30%
Treatment Options Dr. Trump or Mr. Burns – Deregulation

WSJ – Nov 28, 2016
U.S. companies hold $2 trillion offshore
Treatment Options Dr. Trump or Mr. Burns – Tax Reform
JP Morgan Eye On The Market Michael Cembalest Feb 8, 2017

Bloomberg – Jan 11, 2017
Average U.S. commuter wastes over 40 hours/yr.
waiting in traffic
$1 trillion spent over 10 years Moody’s Analytics:
Every $1= $1.21 in GDP
Treatment Options Dr. Trump or Mr. Burns – Infrastructure Spending
WSJ Mar 10, 2017
$1 trillion = +5% to Debt $4.6 trillion = ~ +25% to Debt

The Daily Shot – Aug 24, 2016
The 1%
Top 2-5%
Top 1%
Treatment Options Dr. Trump or Mr. Burns – Trade

$347 Billion
$69 Billion
$65 Billion
$63 Billion
• U.S. Trade Deficit ~ $500 billion • Not just Tariffs - VAT • U.S. Exporter pay VAT • Foreign Exporters get a VAT Credit
Treatment Options Dr. Trump or Mr. Burns – Trade
Oxford University • Nearly 50% of U.S. Jobs will be automated in 20 years
McKinsey &Co. • 45% of today’s activities can be automated • But less then 5% can be full automated
Deloitte • Automation could lift global productivity 0.8% - 1.4%/yr
over next 50 years

Pew Research - 2020-2040 • Working population +0.3% • 500,000 less +0.1% • 1,000,000 less -0.1%
Treatment Options Dr. Trump or Mr. Burns – Immigration
Pew Research • 8 million undocumented workers • 5% of civilian workforce • 92% between 18-64 years old • 70% in Agriculture and Construction

Treatment Options Make the Economy Great Again - Education
Math U.S. #38 of 71
Canada #9 of 71
Reading U.S. #39 of 71
Canada #3 of 71
Science U.S. #24 of 71
Canada #7 of 71
WSJ – Dec 8, 2016
President’s Council of Advisors on Science and Technology U.S. will need ~1 million more STEM professionals over next decade than will currently produce. Need to increase STEM degrees by 34%.

Treatment Options Make the Economy Great Again - Healthcare

The 2016 Long-Term Budget Outlook
Treatment Options Make the Economy Great Again – Entitlement Spending

WSJ – Aug 21, 2016
Low/Negative Interest Rates • Lowers consumer confidence – communicate fear • Hurts savers • Increases wealth gap – low rates helps financial assets
Treatment Options Make the Economy Great Again – Monetary Policy
Monetary Policy • Need to normalize interest rates • If only U.S. then US$ will increase
Trade • Need to balance trade flows • China, but also Germany

Treatment Options Make the Economy Great Again – Oil
WSJ – Apr 6, 2017

Treatment Options Make the Economy Great Again – Monetary Policy
The Daily Shot - Mar 30, 2017

Treatment Options Make the Economy Great Again – Monetary Policy
The Daily Shot – Apr 6, 2017

Treatment Options Make the Economy Great Again – Monetary Policy
http://www.canadianbusiness.com/economy/canadas-50-most-important-economic-charts-for-2016/

Treatment Options Make the Economy Great Again – Monetary Policy
http://www.canadianbusiness.com/economy/canadas-50-most-important-economic-charts-for-2016/

Investment Strategies Equities – Bull Market
Strategas – Mar 20, 2017
Second Longest Fourth Highest

Investment Strategies Equities
WSJ - Jan 27, 2017 RBC - Jonathan Golub “In Defense of Trump Rally – Dec 13, 2016
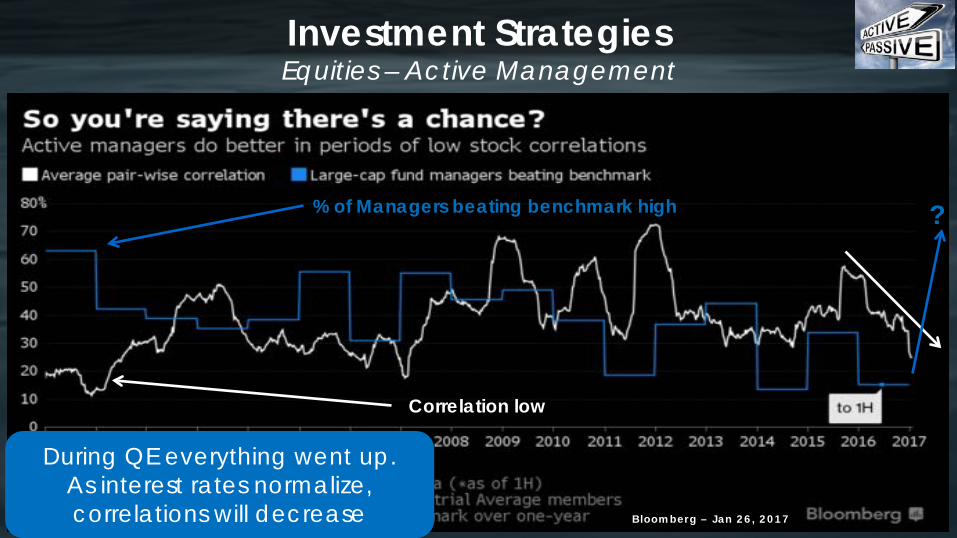
Investment Strategies Equities – Active Management
Bloomberg – Jan 26, 2017
Correlation low
% of Managers beating benchmark high ?
During QE everything went up. As interest rates normalize, correlations will decrease

Economy starting to reflate Trump policies could help Risks are too the upside Monetary policy to finally normalize Equities in the short term Active Management Diversification!
Summary

Financial Advisor/Partner
Mark Therriault
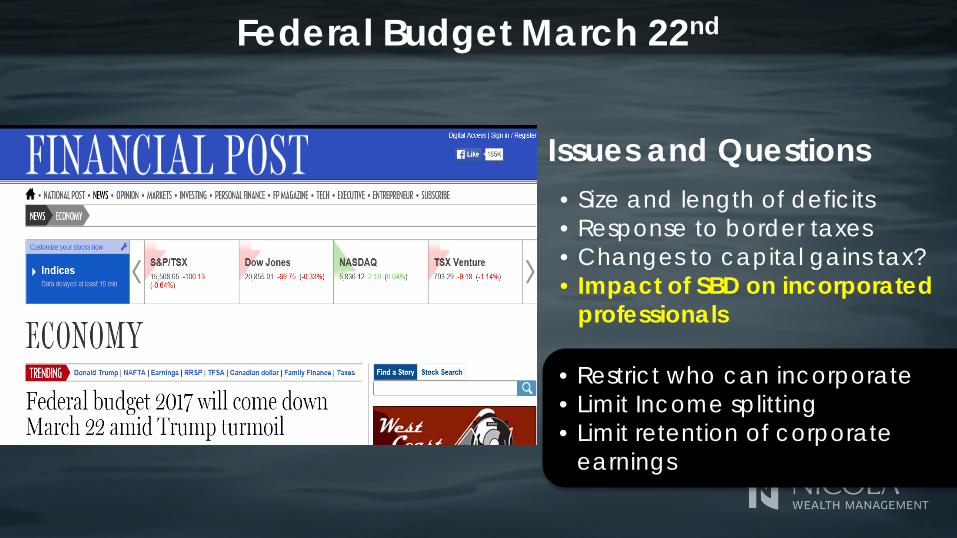
Federal Budget March 22nd
Issues and Questions
• Size and length of deficits • Response to border taxes • Changes to capital gains tax? • Impact of SBD on incorporated
professionals
• Restrict who can incorporate • Limit Income splitting • Limit retention of corporate
earnings

A Genius Bromance
Daniel Kahneman • Introvert • Holocaust Survivor • Psychologist • Taught at UBC • Nobel Prize 2002 in
Economics
Amos Tversky • Extrovert • Israeli Sabra • Psychologist • Taught at Stanford • Died before Nobel
prize

Loss Avoidance
Win 85%
Lose 15% Guaranteed Win Majority
Guaranteed Loss
Win 15%
Lose 85% Majority

Seven Habits of Highly Ineffective Investors

We’re in the Gifted Program
80% Think they are in the top 50%
Over-Optimism

Gambling with House Money
Can we up the minimum
bet?
Investors increase their aggressiveness when they win first.

Increase risk when market rises
Reduce risk when market drops
Gambling with House Money
Can we up the minimum
bet?

4-5% annual loss of return
The Impact of Emotion in Investing

Emotional Investing
5.8%
1.8%
Fund Investor
Vanguard Value Fund 10-year return (01/2017)
Name Fund Investor
Vanguard Growth Stock
Index 8.1% 5.3%
Vanguard Small Cap
Value Index 7.5% 4.2%
Vanguard Small Cap
Growth index 8.1% 7.2%
http://www.theglobeandmail.com/globe-investor/investment-ideas/strategy-lab/index-investing/how-factor-based-investors-take-bigger-risks/article34179810/
-2.8%
-0.9%
-3.2%

Managing Assets More Efficiently
Canadian Equities, 16.7%
High Yield Bonds, 7.3%
Preferred Shares, 4.5%
Alternative Strategies, 15.0%
Real Estate, 20.0%
Mortgages, 11.0%
Bonds, 9.0%
Foreign Bonds, 5.4%
Cash, 4.0%
Foreign Equities, 12.1%
11.4%
Re-Balance
-7.5%
7.48% Blended
2015

• Prices were down 35% • Yields were up more than 50% • Taxes on income 20% less than interest (equal to
bonds paying 8%) • Good chance of capital recovery over five years
What Happened ?

A Tale of Two Shares
7.9% after fees
5.3% before fees Purchases at
depressed prices
35% recovery

The Vulcan Investor

• Good investor behaviour is difficult • 90% of investors do not earn the benchmarks • Volatility can bring on bad behaviour • Diversification is both safe and effective • Picking quality assets takes time and patience
Behaviour and Diversification
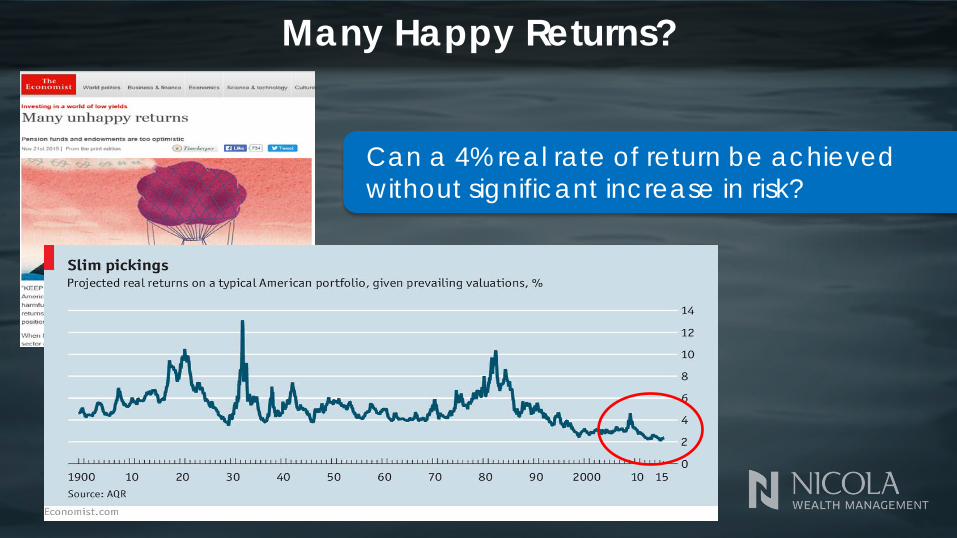
Many Happy Returns?
Can a 4% real rate of return be achieved without significant increase in risk?
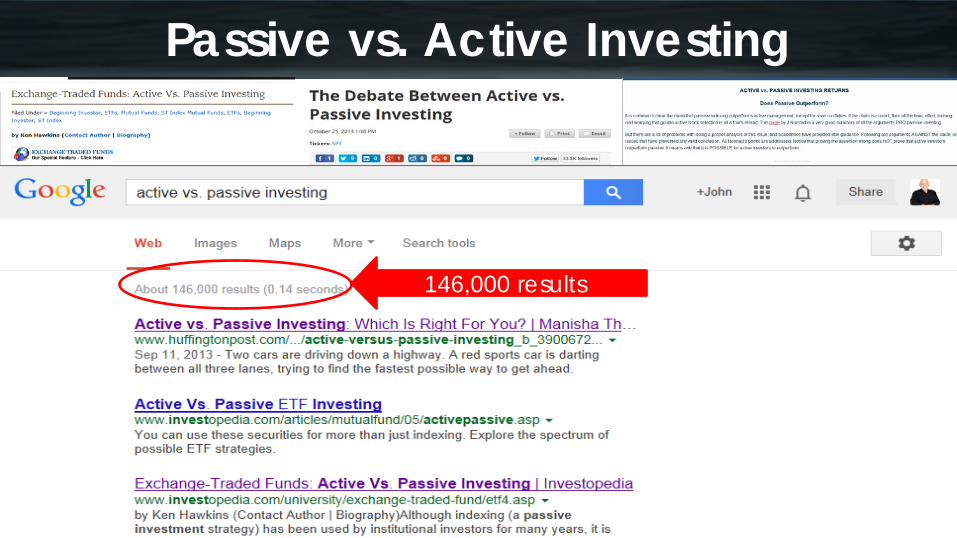
Passive vs. Active Investing
146,000 results

How Do ETFs Compare Over 10 Years?
10% 10% 22%
10%
0%10%20%30%40%50%60%70%80%90%
100%
Canadianequities
Canadian Bonds S&P 500 MSCI
ETFFunds1st and 2nd quartile over ten years

Active vs. Passive Investing
What is an Active Manager? • 2007 Yale Study (Updated 2013 FAJ) • Cremers and Petajisto • Focused positions (example
Oakmark Select with 20 positions) • Not always within the benchmark • Different trading strategies and not
market weighted

Passive vs. Active: Another Side
Can you find this?

6.9%( .54% MER)
11.7%(.53% MER)

Active vs. Passive Investing
4.03%
6.84% 7.73%
Average Return, 5 years
ETFs NWM Active Client Returns
Dalbar Effect means Average investor
lower than this
Disciplined rebalancing creates results better
than buy/hold

CAN CI Bal Inc (PSG) 100/100 (PS1) Trimark Glbl Balanced Cl Srs P USD IG/GWL Balanced GIF 75/100 A
TD Advantage Balanced Portfolio-A BMO Asset Allocation - A RBC Bal Fund Series A
Sour
ce: G
lob
eInv
esto
rGol
d A
pr 4
, 201
6
Beyond Stocks and Bonds

Beyond the 60/40 Approach
Canadian Equities
Foreign Equities
Bonds
Foreign Bonds
High Yield Bonds
First Mortgages
Second Mortgages
Real Estate
Private Equity
Preferred Shares
Alternative Strategies
NWM

Typical NWM Client Asset Allocation
Target Cash Flow (interest, dividends, rents) = 4% - 5% /yr.
Target Long-Term Returns (cash flow + growth) = 7% - 8% /yr. (or 4% above inflation)

Historically Consistent & Stable Returns

4.8% 6.6%
-9.5%
6.3%
13.9%
-22.3%
6.2% 4.3%
-4.4%
10 year returns Volatility Worst QuarterBalanced 60/40 TSX NWM
The right asset allocation well managed Can reduces risk and increase returns
Reduced volatility = better Investor behaviour

Hard Asset Real Estate SPIRE RE LP (2005)
SPIRE US LP (2010)
SPIRE VA LP (2014)
$2 billion gross assets ($1 billion client equity)

Private Equity vs. Public Equity
Northleaf: “Private equity should continue to provide investors with a premium of 3% to 5% relative to
public markets over the long term”
Issues with Private Equity • Large minimum investment • No liquidity for 7 to 10 years • Capital calls and return of capital • Concentration risk

The NWM Private Equity Pool LP

NWM Farmland LP

NWM First
Mortgage Pool
• LTV 50 - 60% • Yield 4-4.5%
NWM Balanced Mortgage Pool
• LTV 70 – 75%
• Yield 5.5% - 6%
NWM Mortgage Pools

Summary
Diversification Know Thyself and Behave Well
Low Cost Active Investing Rebalanced Art History

THANK YOU
This presentation contains the current opinions of the presenter and such opinions are subject to change without notice. This material is distributed for informational purposes only and is not intended to provide legal, accounting, tax or specific investment advice. Please speak to your NWM Advisor regarding your unique situation. Forecasts, estimates, and certain information contained herein are based upon proprietary research and should not be considered as investment advice or a recommendation of any particular security, strategy or investment product. NWM fund returns are quoted net of fund-level expenses. Past performance is not indicative of future results. All investments contain risk and may gain or lose value. NWM is registered as a Portfolio Manager, Exempt Market Dealer and Investment Fund Manager with the required provincial securities’ commissions.

QUESTION & ANSWER