2017–2018 school year common core state …...ccss correlation created ovember 2017 percent...
TRANSCRIPT

2017–2018 School YearCommon Core State Standards Correlation
BUILT for theCOMMONCORE

Table of ContentsPercent Correlation ............................. 3 Grade 3 .....................................................6Grade 4 .................................................. 14Grade 5 ...................................................23Grade 6 ..................................................32Grade 7 .................................................. 44Grade 8 ................................................. 54Algebra I ................................................62Geometry ..............................................75Math I ..................................................... 84

3
2017–2018 School Year
CCSS CorrelationCreated November 2017
Percent Correlation to Common Core State StandardsGrade 3
Standards not addressed:3.MD.B.4 Generate measurement data by measuring lengths using rulers marked with halves and fourths of an inch. Show the data by making a line plot, where the
horizontal scale is marked off in appropriate units— whole numbers, halves, or quarters.
Grade 4
Standards not addressed:4.MD.A.2 Use the four operations to solve word problems involving distances, intervals of time, liquid volumes, masses of objects, and money, including problems involving
simple fractions or decimals, and problems that require expressing measurements given in a larger unit in terms of a smaller unit. Represent measurement quantities using diagrams such as number line diagrams that feature a measurement scale.
4.MD.B.4 Make a line plot to display a data set of measurements in fractions of a unit (1/2, 1/4, 1/8). Solve problems involving addition and subtraction of fractions by using information presented in line plots. For example, from a line plot find and interpret the difference in length between the longest and shortest specimens in an insect collection.
Grade 5
Standards not addressed:5.OA.B.3 Generate two numerical patterns using two given rules. Identify apparent relationships between corresponding terms. Form ordered pairs consisting of
corresponding terms from the two patterns, and graph the ordered pairs on a coordinate plane. For example, given the rule Add 3 and the starting number 0, and given the rule Add 6 and the starting number 0, generate terms in the resulting sequences, and observe that the terms in one sequence are twice the corresponding terms in the other sequence. Explain informally why this is so.
5.MD.A.1 Convert among different-sized standard measurement units within a given measurement system (e.g., convert 5 cm to 0.05 m), and use these conversions in solving multi-step, real world problems.
Grade 6

4
2017–2018 School Year
CCSS CorrelationCreated November 2017
Grade 7
Standards not addressed:7.G.A.3 Describe the two-dimensional figures that result from slicing three-dimensional figures, as in plane sections of right rectangular prisms and right rectangular
pyramids.7.SP.A.1 Understand that statistics can be used to gain information about a population by examining a sample of the population; generalizations about a population from
a sample are valid only if the sample is representative of that population. Understand that random sampling tends to produce representative samples and support valid inferences.
Grade 8
Standards not addressed:8.G.A.1.A Verify experimentally the properties of rotations, reflections, and translations:
a. Lines are taken to lines, and line segments to line segments of the same length.8.G.A.1.B Verify experimentally the properties of rotations, reflections, and translations:
b. Angles are taken to angles of the same measure.8.G.A.1.C Verify experimentally the properties of rotations, reflections, and translations:
c. Parallel lines are taken to parallel lines.
Algebra I
Standards not addressed:HSN.Q.A.2 Define appropriate quantities for the purpose of descriptive modeling.HSS.ID.C.8 Compute (using technology) and interpret the correlation coefficient of a linear fit.

5
2017–2018 School Year
CCSS CorrelationCreated November 2017
Geometry
Standards not addressed:HSG.SRT.D.9 Derive the formula A = 1/2 ab sin(C) for the area of a triangle by drawing an auxiliary line from a vertex perpendicular to the opposite side.HSG.SRT.D.10 Prove the Laws of Sines and Cosines and use them to solve problems.HSS.CP.B.8 Apply the general Multiplication Rule in a uniform probability model, P(A and B) = P(A)P(B|A) = P(B)P(A|B), and interpret the answer in terms of the model.HSS.MD.B.6 Use probabilities to make fair decisions (e.g., drawing by lots, using a random number generator).HSS.MD.B.7 Analyze decisions and strategies using probability concepts (e.g., product testing, medical testing, pulling a hockey goalie at the end of a game).
Math I
Standards not addressed:HSN.Q.A.2 Define appropriate quantities for the purpose of descriptive modeling.HSS.ID.C.8 Compute (using technology) and interpret the correlation coefficient of a linear fit.

Grade 3Common Core State Standards Mathematics

7
2017–2018 School Year
CCSS CorrelationCreated November 2017
Common Core State Standards Imagine MathGrade 3 Unit Lesson
Operations and Algebraic ThinkingRepresent and solve problems involving multiplication and division.3.OA.A.1 Interpret products of whole numbers, e.g., interpret 5 × 7 as the total
number of objects in 5 groups of 7 objects each. For example, describe a context in which a total number of objects can be expressed as 5 × 7.
Operations and Algebraic Thinking Concept of Multiplication - Arrays Concept of Multiplication - Grouping Concept of Multiplication - Word Problems
3.OA.A.2 Interpret whole-number quotients of whole numbers, e.g., interpret 56 ÷ 8 as the number of objects in each share when 56 objects are partitioned equally into 8 shares, or as a number of shares when 56 objects are partitioned into equal shares of 8 objects each. For example, describe a context in which a number of shares or a number of groups can be expressed as 56 ÷ 8.
Operations and Algebraic Thinking Concept of Division Constructing Division Problems Interpreting Division Problems
3.OA.A.3 Use multiplication and division within 100 to solve word problems in situations involving equal groups, arrays, and measurement quantities, e.g., by using drawings and equations with a symbol for the unknownnumber to represent the problem.
Operations and Algebraic Thinking Multiplication and Division Word Problems - Equations Multiplication and Division Word Problems - SolutionsMultiplication and Division Word Problems - Visual Models
3.OA.A.4 Determine the unknown whole number in a multiplication or division equation relating three whole numbers. For example, determine the unknown number that makes the equation true in each of the equations 8 × ? = 48, 5 = _ ÷ 3, 6 × 6 = ?
Operations and Algebraic Thinking Division as an Unknown-Factor ProblemSolving Multiplication and Division Equations

8
2017–2018 School Year
CCSS CorrelationCreated November 2017
Common Core State Standards Imagine MathGrade 3 Unit Lesson
Understand properties of multiplication and the relationship between multiplication and division.3.OA.B.5 Apply properties of operations as strategies to multiply and divide.
Examples: If 6 × 4 = 24 is known, then 4 × 6 = 24 is also known. (Commutative property of multiplication.) 3 × 5 × 2 can be found by 3 × 5 = 15, then 15 × 2 = 30, or by 5 × 2 = 10, then 3 × 10 = 30. (Associative property of multiplication.) Knowing that 8 × 5 = 40 and 8 × 2 = 16, one can find 8 × 7 as 8 × (5 + 2) = (8 × 5) + (8 × 2) = 40 + 16 = 56. (Distributive property.)
Operations and Algebraic Thinking Multiplication and Division Fact Families Properties of Addition and Multiplication Relationship Between Multiplication and DivisionUsing Visual Models to Understand the Distributive Property
3.OA.B.6 Understand division as an unknown-factor problem. For example, find 32 ÷ 8 by finding the number that makes 32 when multiplied by 8.
Operations and Algebraic Thinking Division as an Unknown-Factor ProblemMultiplication and Division Fact Families Solving Multiplication and Division Equations
Multiply and divide within 100. 3.OA.C.7 Fluently multiply and divide within 100, using strategies such as the
relationship between multiplication and division (e.g., knowing that 8 × 5 = 40, one knows 40 ÷ 5 = 8) or properties of operations. By the end of Grade 3, know from memory all products of two one-digit numbers.
Operations and Algebraic Thinking Developing Fluency Using 2 as a FactorDeveloping Fluency Using 5 or 10 as a FactorMultiplication and Division Fact Families Using Halves and Doubles to Solve Multiplication Problems
Solve problems involving the four operations, and identify and explain patterns in arithmetic. 3.OA.D.8 Solve two-step word problems using the four operations. Represent
these problems using equations with a letter standing for the unknown quantity. Assess the reasonableness of answers using mental computation and estimation strategies including rounding.
Operations and Algebraic Thinking Estimating Sums and Differences - Application Modeling and Solving Two-Step Word Problems Solving Two-Step Word Problems
3.OA.D.9 Identify arithmetic patterns (including patterns in the addition table or multiplication table), and explain them using properties of operations. For example, observe that 4 times a number is always even, and explain why 4 times a number can be decomposed into two equal addends.
Operations and Algebraic Thinking Additive and Multiplicative Patterns

9
2017–2018 School Year
CCSS CorrelationCreated November 2017
Common Core State Standards Imagine MathGrade 3 Unit Lesson
Number & Operations in Base Ten Use place value understanding and properties of operations to perform multi-digit arithmetic. 3.NBT.A.1 Use place value understanding to round whole numbers to the nearest
10 or 100.Number and Operations in Base Ten Reasoning About Place Value and Rounding
Rounding to the Nearest Ten and Hundred 3.NBT.A.2 Fluently add and subtract within 1000 using strategies and algorithms
based on place value, properties of operations, and/or the relationship between addition and subtraction.
Number and Operations in Base Ten Reasoning About Addition and Subtraction Within 1,000Structuring Within 1,000
3.NBT.A.3 Multiply one-digit whole numbers by multiples of 10 in the range 10-90 (e.g., 9 × 80, 5 × 60) using strategies based on place value andproperties of operations.
Number and Operations in Base Ten Multiplying by Multiples of Ten
Number & Operations—Fractions Develop understanding of fractions as numbers.3.NF.A.1 Understand a fraction 1/b as the quantity formed by 1 part when a
whole is partitioned into b equal parts; understand a fraction a/b as the quantity formed by a parts of size 1/b.
Number and Operations - Fractions Understanding Fractions - Equal Areas
3.NF.A.2.A Understand a fraction as a number on the number line; represent fractions on a number line diagram.a. Represent a fraction 1/b on a number line diagram by defining theinterval from 0 to 1 as the whole and partitioning it into b equal parts.Recognize that each part has size 1/b and that the endpoint of the partbased at 0 locates the number 1/b on the number line.
Number and Operations - Fractions Unit Fractions on the Number Line
3.NF.A.2.B Understand a fraction as a number on the number line; represent fractions on a number line diagram.b. Represent a fraction a/b on a number line diagram by marking offa lengths 1/b from 0. Recognize that the resulting interval has size a/band that its endpoint locates the number a/b on the number line.
Number and Operations - Fractions Fractions on the Number Line

10
2017–2018 School Year
CCSS CorrelationCreated November 2017
Common Core State Standards Imagine MathGrade 3 Unit Lesson
3.NF.A.3.A Explain equivalence of fractions in special cases, and compare fractions by reasoning about their size.a. Understand two fractions as equivalent (equal) if they are the samesize, or the same point on a number line.
Number and Operations - Fractions Modeling Equivalent Fractions with Number Lines
3.NF.A.3.B Explain equivalence of fractions in special cases, and compare fractions by reasoning about their size.b. Recognize and generate simple equivalent fractions, e.g., 1/2 = 2/4,4/6 = 2/3. Explain why the fractions are equivalent, e.g., by using avisual fraction model.
Number and Operations - Fractions Visual Models of Equivalent Fractions
3.NF.A.3.C Explain equivalence of fractions in special cases, and compare fractions by reasoning about their size.c. Express whole numbers as fractions, and recognize fractions thatare equivalent to whole numbers. Examples: Express 3 in the form 3= 3/1; recognize that 6/1 = 6; locate 4/4 and 1 at the same point of anumber line diagram.
Number and Operations - Fractions Whole Numbers as Fractions Whole Numbers as Fractions on the Number Line
3.NF.A.3.D Explain equivalence of fractions in special cases, and compare fractions by reasoning about their size.d. Compare two fractions with the same numerator or the samedenominator by reasoning about their size. Recognize thatcomparisons are valid only when the two fractions refer to the samewhole. Record the results of comparisons with the symbols >, =, or <,and justify the conclusions, e.g., by using a visual fraction model.
Number and Operations - Fractions Comparing Fractions with the Same Numerator or Denominator Recognizing Valid Fraction Comparisons I
Measurement & Data Solve problems involving measurement and estimation.3.MD.A.1 Tell and write time to the nearest minute and measure time intervals
in minutes. Solve word problems involving addition and subtraction of time intervals in minutes, e.g., by representing the problem on a number line diagram.
Measurement and Data Adding and Subtracting Time

11
2017–2018 School Year
CCSS CorrelationCreated November 2017
Common Core State Standards Imagine MathGrade 3 Unit Lesson
3.MD.A.2 Measure and estimate liquid volumes and masses of objects using standard units of grams (g), kilograms (kg), and liters (l). Add, subtract, multiply, or divide to solve one-step word problems involving masses or volumes that are given in the same units, e.g., by using drawings (such as a beaker with a measurement scale) to represent the problem.
Measurement and Data Capacity or Weight
Represent and interpret data.3.MD.B.3 Draw a scaled picture graph and a scaled bar graph to represent a data
set with several categories. Solve one- and two-step “how many more” and “how many less” problems using information presented in scaled bar graphs. For example, draw a bar graph in which each square in the bar graph might represent 5 pets.
Measurement and Data Introduction to Data Displays
3.MD.B.4 Generate measurement data by measuring lengths using rulers marked with halves and fourths of an inch. Show the data by making a line plot, where the horizontal scale is marked off in appropriate units— whole numbers, halves, or quarters.
This standard is not addressed. This standard is not addressed.
Geometric measurement: understand concepts of area and relate area to multiplication and to addition.3.MD.C.5.A Recognize area as an attribute of plane figures and understand
concepts of area measurement.a. A square with side length 1 unit, called “a unit square,” is said tohave “one square unit” of area, and can be used to measure area.
Measurement and Data Concept of Area Unit Squares
3.MD.C.5.B Recognize area as an attribute of plane figures and understand concepts of area measurement.b. A plane figure which can be covered without gaps or overlaps by nunit squares is said to have an area of n square units.
Measurement and Data Concept of Area

12
2017–2018 School Year
CCSS CorrelationCreated November 2017
Common Core State Standards Imagine MathGrade 3 Unit Lesson
3.MD.C.6 Measure areas by counting unit squares (square cm, square m, square in, square ft, and improvised units).
Measurement and Data Concept of Area Unit Squares
3.MD.C.7.A Relate area to the operations of multiplication and addition.a. Find the area of a rectangle with whole-number side lengths bytiling it, and show that the area is the same as would be found bymultiplying the side lengths.
Measurement and Data Area of Rectangles
3.MD.C.7.B Relate area to the operations of multiplication and addition.b. Multiply side lengths to find areas of rectangles with whole-numberside lengths in the context of solving real world and mathematicalproblems, and represent whole-number products as rectangular areasin mathematical reasoning.
Measurement and Data Area of Rectangles
3.MD.C.7.C Relate area to the operations of multiplication and addition.c. Use tiling to show in a concrete case that the area of a rectanglewith whole-number side lengths a and b + c is the sum of a × band a × c. Use area models to represent the distributive property inmathematical reasoning.
Measurement and Data Area of Rectangles
3.MD.C.7.D Relate area to the operations of multiplication and addition.d. Recognize area as additive. Find areas of rectilinear figures bydecomposing them into non-overlapping rectangles and adding theareas of the non-overlapping parts, applying this technique to solvereal world problems.
Measurement and Data Area of Basic Composite FiguresRecognizing Area as Additive
Geometric measurement: recognize perimeter.3.MD.D.8 Solve real world and mathematical problems involving perimeters
of polygons, including finding the perimeter given the side lengths, finding an unknown side length, and exhibiting rectangles with the same perimeter and different areas or with the same area and different perimeters.
Measurement and Data Perimeter

13
2017–2018 School Year
CCSS CorrelationCreated November 2017
Common Core State Standards Imagine MathGrade 3 Unit Lesson
GeometryReason with shapes and their attributes.3.G.A.1 Understand that shapes in different categories (e.g., rhombuses,
rectangles, and others) may share attributes (e.g., having four sides), and that the shared attributes can define a larger category (e.g., quadrilaterals). Recognize rhombuses, rectangles, and squares as examples of quadrilaterals, and draw examples of quadrilaterals that do not belong to any of these subcategories.
Geometry Classifying Quadrilaterals I
3.G.A.2 Partition shapes into parts with equal areas. Express the area of each part as a unit fraction of the whole. For example, partition a shape into 4 parts with equal area, and describe the area of each part as 1/4 of the area of the shape.
Number and Operations - Fractions Understanding Fractions - Notation

Grade 4Common Core State Standards Mathematics

15
2017–2018 School Year
CCSS CorrelationCreated November 2017
Common Core State Standards Imagine MathGrade 4 Unit Lesson
Operations and Algebraic ThinkingUse the four operations with whole numbers to solve problems.4.OA.A.1 Interpret a multiplication equation as a comparison, e.g., interpret 35
= 5 × 7 as a statement that 35 is 5 times as many as 7 and 7 times as many as 5. Represent verbal statements of multiplicative comparisons as multiplication equations.
Operations and Algebraic Thinking Multiplication as a Comparison - Equations
4.OA.A.2 Multiply or divide to solve word problems involving multiplicative comparison, e.g., by using drawings and equations with a symbol for the unknown number to represent the problem, distinguishing multiplicative comparison from additive comparison.
Operations and Algebraic Thinking Multiplication as a Comparison - Word Problems
4.OA.A.3 Solve multistep word problems posed with whole numbers and having whole-number answers using the four operations, including problems in which remainders must be interpreted. Represent these problems using equations with a letter standing for the unknown quantity. Assess the reasonableness of answers using mental computation and estimation strategies including rounding.
Number and Operations in Base Ten Estimating Solutions to Multistep Word Problems
Operations and Algebraic Thinking Interpreting RemaindersUsing Equations to Model and Solve Multi-step Problems
Gain familiarity with factors and multiples.4.OA.B.4 Find all factor pairs for a whole number in the range 1-100.
Recognize that a whole number is a multiple of each of its factors. Determine whether a given whole number in the range 1-100 is a multiple of a given one-digit number. Determine whether a given whole number in the range 1-100 is prime or composite.
Operations and Algebraic Thinking Factors Relating Factors and Multiples IRelating Factors and Multiples II
Generate and analyze patterns.4.OA.C.5 Generate a number or shape pattern that follows a given rule.
Identify apparent features of the pattern that were not explicit in the rule itself. For example, given the rule “Add 3” and the starting number 1, generate terms in the resulting sequence and observe that the terms appear to alternate between odd and even numbers. Explain informally why the numbers will continue to alternate in this way.
Operations and Algebraic Thinking Generating and Describing Number Patterns

16
2017–2018 School Year
CCSS CorrelationCreated November 2017
Common Core State Standards Imagine MathGrade 4 Unit Lesson
Number & Operations in Base Ten Generalize place value understanding for multi-digit whole numbers.4.NBT.A.1 Recognize that in a multi-digit whole number, a digit in one place
represents ten times what it represents in the place to its right. For example, recognize that 700 ÷ 70 = 10 by applying concepts of place value and division.
Number and Operations in Base Ten Understanding Place Value Relationships
4.NBT.A.2 Read and write multi-digit whole numbers using base-ten numerals, number names, and expanded form. Compare two multi-digit numbers based on meanings of the digits in each place, using >, =, and < symbols to record the results of comparisons.
Number and Operations in Base Ten Place Value ConceptsUsing Place Value Concepts to Compare Whole Numbers
4.NBT.A.3 Use place value understanding to round multi-digit whole numbers to any place.
Number and Operations in Base Ten Rounding Whole Numbers Using Rounding in Problem Solving
Use place value understanding and properties of operations to perform multi-digit arithmetic.4.NBT.B.4 Fluently add and subtract multi-digit whole numbers using the
standard algorithm.Number and Operations in Base Ten Adding and Subtracting with the Standard
Algorithm Adding Whole Numbers
4.NBT.B.5 Multiply a whole number of up to four digits by a one-digit whole number, and multiply two two-digit numbers, using strategies based on place value and the properties of operations. Illustrate and explain the calculation by using equations, rectangular arrays, and/or area models.
Number and Operations in Base Ten Multiplying 2-Digit Numbers by 2-Digit NumbersMultiplying Whole Numbers
4.NBT.B.6 Find whole-number quotients and remainders with up to four-digit dividends and one-digit divisors, using strategies based on place value, the properties of operations, and/or the relationship between multiplication and division. Illustrate and explain the calculation by using equations, rectangular arrays, and/or area models.
Number and Operations in Base Ten Dividing Multiples of TenDividing Whole Numbers - One-Digit Divisors

17
2017–2018 School Year
CCSS CorrelationCreated November 2017
Common Core State Standards Imagine MathGrade 4 Unit Lesson
Number & Operations—Fractions Extend understanding of fraction equivalence and ordering.4.NF.A.1 Explain why a fraction a/b is equivalent to a fraction (n × a)/(n × b)
by using visual fraction models, with attention to how the number and size of the parts differ even though the two fractions themselves are the same size. Use this principle to recognize and generate equivalent fractions.
Number and Operations - Fractions Generating Equivalent Fractions Modeling Equivalent Fractions Reducing FractionsUnderstanding Fractions - Relationship Between Numerator and Denominator
4.NF.A.2 Compare two fractions with different numerators and different denominators, e.g., by creating common denominators or numerators, or by comparing to a benchmark fraction such as 1/2. Recognize that comparisons are valid only when the two fractions refer to the same whole. Record the results of comparisons with symbols >, =, or <, and justify the conclusions, e.g., by using a visual fraction model.
Number and Operations - Fractions Comparing Fractions - Visual ModelsComparing Fractions with Different Numerators and Different Denominators Recognizing Valid Fraction Comparisons II
Build fractions from unit fractions.4.NF.B.3.A Understand a fraction a/b with a > 1 as a sum of fractions 1/b.
a. Understand addition and subtraction of fractions as joining andseparating parts referring to the same whole.
Number and Operations - Fractions Adding and Subtracting Fractions with Like Denominators Adding and Subtracting Fractions with Like Denominators in Real-World Situations
4.NF.B.3.B Understand a fraction a/b with a > 1 as a sum of fractions 1/b.b. Decompose a fraction into a sum of fractions with the samedenominator in more than one way, recording each decompositionby an equation. Justify decompositions, e.g., by using a visual fractionmodel. Examples: 3/8 = 1/8 + 1/8 + 1/8 ; 3/8 = 1/8 + 2/8 ; 2 1/8 = 1 +1 + 1/8 = 8/8 + 8/8 + 1/8.
Number and Operations - Fractions Decomposing Fractions and Mixed Numbers Writing Fractions as Mixed Numbers and Mixed Numbers as Fractions

18
2017–2018 School Year
CCSS CorrelationCreated November 2017
Common Core State Standards Imagine MathGrade 4 Unit Lesson
4.NF.B.3.C Understand a fraction a/b with a > 1 as a sum of fractions 1/b.c. Add and subtract mixed numbers with like denominators, e.g., byreplacing each mixed number with an equivalent fraction, and/or byusing properties of operations and the relationship between additionand subtraction.
Number and Operations - Fractions Adding and Subtracting Mixed Numbers with Like DenominatorsAdding and Subtracting Mixed Numbers with Like Denominators - Conceptual Strategies
4.NF.B.3.D Understand a fraction a/b with a > 1 as a sum of fractions 1/b.d. Solve word problems involving addition and subtraction offractions referring to the same whole and having like denominators,e.g., by using visual fraction models and equations to represent theproblem.
Number and Operations - Fractions Word Problems with Fractions and Mixed Numbers - EstimationWord Problems with Fractions and Mixed Numbers - Visual Models
4.NF.B.4.A Apply and extend previous understandings of multiplication to multiply a fraction by a whole number.a. Understand a fraction a/b as a multiple of 1/b. For example, usea visual fraction model to represent 5/4 as the product 5 × (1/4),recording the conclusion by the equation 5/4 = 5 × (1/4).
Number and Operations - Fractions Multiplying Unit Fractions by Whole Numbers
4.NF.B.4.B Apply and extend previous understandings of multiplication to multiply a fraction by a whole number.b. Understand a multiple of a/b as a multiple of 1/b, and use thisunderstanding to multiply a fraction by a whole number. Forexample, use a visual fraction model to express 3 × (2/5) as 6 × (1/5),recognizing this product as 6/5. (In general, n × (a/b) = (n × a)/b.)
Number and Operations - Fractions Multiplying Fractions by Whole Numbers
4.NF.B.4.C Apply and extend previous understandings of multiplication to multiply a fraction by a whole number.c. Solve word problems involving multiplication of a fraction by awhole number, e.g., by using visual fraction models and equations torepresent the problem. For example, if each person at a party will eat3/8 of a pound of roast beef, and there will be 5 people at the party, howmany pounds of roast beef will be needed? Between what two wholenumbers does your answer lie?
Number and Operations - Fractions Solving Word Problems with Multiplication of Fractions by Whole Numbers

19
2017–2018 School Year
CCSS CorrelationCreated November 2017
Common Core State Standards Imagine MathGrade 4 Unit Lesson
Understand decimal notation for fractions, and compare decimal fractions.4.NF.C.5 Express a fraction with denominator 10 as an equivalent fraction
with denominator 100, and use this technique to add two fractions with respective denominators 10 and 100. For example, express 3/10 as 30/100, and add 3/10 + 4/100 = 34/100.
Number and Operations - Fractions Adding Fractions with Denominators of 10 or 100Understanding Fractions with Denominators of 10 and 100
4.NF.C.6 Use decimal notation for fractions with denominators 10 or 100. For example, rewrite 0.62 as 62/100; describe a length as 0.62 meters; locate 0.62 on a number line diagram.
Number and Operations - Fractions Comparing Decimal Fractions Number and Operations in Base Ten Comparing and Ordering Decimal Fractions
Comparing Fractions and Decimals Decimal Notation IDecimal Notation IIFraction and Decimal Equivalents
4.NF.C.7 Compare two decimals to hundredths by reasoning about their size. Recognize that comparisons are valid only when the two decimals refer to the same whole. Record the results of comparisons with the symbols >, =, or <, and justify the conclusions, e.g., by using a visual model.
Number and Operations - Fractions Decimals to Hundredths Recognizing Valid Decimal Comparisons
Number and Operations in Base Ten Comparing Decimals to Hundredths Introduction to Comparing Decimals to Hundredths
Measurement & Data Solve problems involving measurement and conversion of measurements.4.MD.A.1 Know relative sizes of measurement units within one system of units
including km, m, cm; kg, g; lb, oz.; l, ml; hr, min, sec. Within a single system of measurement, express measurements in a larger unit in terms of a smaller unit. Record measurement equivalents in a two-column table. For example, know that 1 ft is 12 times as long as 1 in. Express the length of a 4 ft snake as 48 in. Generate a conversion table for feet and inches listing the number pairs (1, 12), (2, 24), (3, 36), ...
Measurement and Data Units of Measure - CustomaryUnits of Measure - Metric

20
2017–2018 School Year
CCSS CorrelationCreated November 2017
Common Core State Standards Imagine MathGrade 4 Unit Lesson
4.MD.A.2 Use the four operations to solve word problems involving distances, intervals of time, liquid volumes, masses of objects, and money, including problems involving simple fractions or decimals, and problems that require expressing measurements given in a larger unit in terms of a smaller unit. Represent measurement quantities using diagrams such as number line diagrams that feature a measurement scale.
This standard is not addressed. This standard is not addressed.
4.MD.A.3 Apply the area and perimeter formulas for rectangles in real world and mathematical problems. For example, find the width of a rectangular room given the area of the flooring and the length, by viewing the area formula as a multiplication equation with an unknown factor.
Measurement and Data Area and Perimeter of Rectangles
Represent and interpret data.4.MD.B.4 Make a line plot to display a data set of measurements in fractions
of a unit (1/2, 1/4, 1/8). Solve problems involving addition and subtraction of fractions by using information presented in line plots. For example, from a line plot find and interpret the difference in length between the longest and shortest specimens in an insect collection.
This standard is not addressed. This standard is not addressed.
Geometric measurement: understand concepts of angle and measure angles.4.MD.C.5 Recognize angles as geometric shapes that are formed wherever two
rays share a common endpoint, and understand concepts of angle measurement:
Measurement and Data Identifying and Comparing Angles

21
2017–2018 School Year
CCSS CorrelationCreated November 2017
Common Core State Standards Imagine MathGrade 4 Unit Lesson
4.MD.C.5.A Recognize angles as geometric shapes that are formed wherever two rays share a common endpoint, and understand concepts of angle measurement:a. An angle is measured with reference to a circle with its center at the common endpoint of the rays, by considering the fraction of the circular arc between the points where the two rays intersect the circle. An angle that turns through 1/360 of a circle is called a “one-degree angle,” and can be used to measure angles.
Measurement and Data AnglesAngles 0 to 180
4.MD.C.5.B Recognize angles as geometric shapes that are formed wherever two rays share a common endpoint, and understand concepts of angle measurement:b. An angle that turns through n one-degree angles is said to have an angle measure of n degrees.
Measurement and Data AnglesAngles 0 to 180
4.MD.C.6 Measure angles in whole-number degrees using a protractor. Sketch angles of specified measure.
Measurement and Data AnglesAngles 0 to 180
4.MD.C.7 Recognize angle measure as additive. When an angle is decomposed into non-overlapping parts, the angle measure of the whole is the sum of the angle measures of the parts. Solve addition and subtraction problems to find unknown angles on a diagram in real world and mathematical problems, e.g., by using an equation with a symbol for the unknown angle measure.
Measurement and Data AnglesAngles 0 to 180
GeometryDraw and identify lines and angles, and classify shapes by properties of their lines and angles.4.G.A.1 Draw points, lines, line segments, rays, angles (right, acute, obtuse),
and perpendicular and parallel lines. Identify these in two-dimensional figures.
Geometry Classifying Quadrilaterals IIClassifying TrianglesIdentifying and Classifying Lines, Rays, and Segments

22
2017–2018 School Year
CCSS CorrelationCreated November 2017
Common Core State Standards Imagine MathGrade 4 Unit Lesson
4.G.A.2 Classify two-dimensional figures based on the presence or absence of parallel or perpendicular lines, or the presence or absence of angles of a specified size. Recognize right triangles as a category, and identify right triangles.
Geometry Classifying Quadrilaterals IIClassifying Triangles
4.G.A.3 Recognize a line of symmetry for a two-dimensional figure as a line across the figure such that the figure can be folded along the line into matching parts. Identify line-symmetric figures and draw lines of symmetry.
Geometry Symmetry

Grade 5Common Core State Standards Mathematics

24
2017–2018 School Year
CCSS CorrelationCreated November 2017
Common Core State Standards Imagine MathGrade 5 Unit Lesson
Operations and Algebraic ThinkingWrite and interpret numerical expressions.5.OA.A.1 Use parentheses, brackets, or braces in numerical expressions, and
evaluate expressions with these symbols.Expressions and Equations Evaluating Simple Expressions
5.OA.A.2 Write simple expressions that record calculations with numbers, and interpret numerical expressions without evaluating them. For example, express the calculation “add 8 and 7, then multiply by 2” as 2 × (8 + 7). Recognize that 3 × (18932 + 921) is three times as large as 18932 + 921, without having to calculate the indicated sum or product.
Operations and Algebraic Thinking Writing and Interpreting Simple ExpressionsWriting Simple Expressions
Analyze patterns and relationships.5.OA.B.3 Generate two numerical patterns using two given rules. Identify
apparent relationships between corresponding terms. Form ordered pairs consisting of corresponding terms from the two patterns, and graph the ordered pairs on a coordinate plane. For example, given the rule “Add 3” and the starting number 0, and given the rule “Add 6” and the starting number 0, generate terms in the resulting sequences, and observe that the terms in one sequence are twice the corresponding terms in the other sequence. Explain informally why this is so.
This standard is not addressed. This standard is not addressed.
Number & Operations in Base Ten Understand the place value system.5.NBT.A.1 Recognize that in a multi-digit number, a digit in one place
represents 10 times as much as it represents in the place to its right and 1/10 of what it represents in the place to its left.
Number and Operations in Base Ten Place Value Relationships Within Whole Numbers and Decimals

25
2017–2018 School Year
CCSS CorrelationCreated November 2017
Common Core State Standards Imagine MathGrade 5 Unit Lesson
5.NBT.A.2 Explain patterns in the number of zeros of the product when multiplying a number by powers of 10, and explain patterns in the placement of the decimal point when a decimal is multiplied or divided by a power of 10. Use whole-number exponents to denote powers of 10.
Number and Operations in Base Ten Multiplying and Dividing by Powers of Ten Multiplying by Powers of Ten
5.NBT.A.3.A Read, write, and compare decimals to thousandths.a. Read and write decimals to thousandths using base-ten numerals, number names, and expanded form, e.g., 347.392 = 3 × 100 + 4 × 10 + 7 × 1 + 3 × (1/10) + 9 × (1/100) + 2 × (1/1000).
Number and Operations in Base Ten Comparing Fractions and Decimals Decimals to Thousandths Fraction and Decimal Equivalents
5.NBT.A.3.B Read, write, and compare decimals to thousandths.b. Compare two decimals to thousandths based on meanings of the digits in each place, using >, =, and < symbols to record the results of comparisons.
Number and Operations in Base Ten Comparing Decimals to Thousandths
5.NBT.A.4 Use place value understanding to round decimals to any place. Number and Operations in Base Ten Reasoning About Rounding Decimals Rounding Decimals to the Nearest Tenth and Hundredth
Perform operations with multi-digit whole numbers and with decimals to hundredths.
Number and Operations in Base Ten Operations with Whole Numbers - Mixed Practice
5.NBT.B.5 Fluently multiply multi-digit whole numbers using the standard algorithm.
Number and Operations in Base Ten Multiplying 3-digit by 2-digit Whole Numbers Using the Standard AlgorithmMultiplying Whole Numbers - Standard Algorithm
5.NBT.B.6 Find whole-number quotients of whole numbers with up to four-digit dividends and two-digit divisors, using strategies based on place value, the properties of operations, and/or the relationship between multiplication and division. Illustrate and explain the calculation by using equations, rectangular arrays, and/or area models.
Number and Operations in Base Ten Dividing Whole Numbers - Two-Digit Divisors

26
2017–2018 School Year
CCSS CorrelationCreated November 2017
Common Core State Standards Imagine MathGrade 5 Unit Lesson
5.NBT.B.7 Add, subtract, multiply, and divide decimals to hundredths, using concrete models or drawings and strategies based on place value, properties of operations, and/or the relationship between addition and subtraction; relate the strategy to a written method and explain the reasoning used.
Number and Operations in Base Ten Adding and Subtracting DecimalsAdding and Subtracting Decimals in Real-World SituationsCalculating with DecimalsDividing Decimals to Hundredths Multiplying Decimals to HundredthsUsing Reasoning and Estimation to Calculate with Decimals
Number & Operations—Fractions Use equivalent fractions as a strategy to add and subtract fractions.5.NF.A.1 Add and subtract fractions with unlike denominators (including
mixed numbers) by replacing given fractions with equivalent fractions in such a way as to produce an equivalent sum or difference of fractions with like denominators. For example, 2/3 + 5/4 = 8/12 + 15/12 = 23/12. (In general, a/b + c/d = (ad + bc)/bd.)
Number and Operations - Fractions Adding and Subtracting FractionsAdding and Subtracting Fractions - Multistep Word ProblemsAdding FractionsSubtracting Fractions
5.NF.A.2 Solve word problems involving addition and subtraction of fractions referring to the same whole, including cases of unlike denominators, e.g., by using visual fraction models or equations to represent the problem. Use benchmark fractions and number sense of fractions to estimate mentally and assess the reasonableness of answers. For example, recognize an incorrect result 2/5 + 1/2 = 3/7, by observing that 3/7 < 1/2.
Number and Operations - Fractions Adding and Subtracting FractionsAdding and Subtracting Fractions - Multistep Word ProblemsAdding Fractions - Estimation StrategiesSubtracting Fractions - Estimation Strategies

27
2017–2018 School Year
CCSS CorrelationCreated November 2017
Common Core State Standards Imagine MathGrade 5 Unit Lesson
Apply and extend previous understandings of multiplication and division.5.NF.B.3 Interpret a fraction as division of the numerator by the denominator
(a/b = a ÷ b). Solve word problems involving division of whole numbers leading to answers in the form of fractions or mixed numbers, e.g., by using visual fraction models or equations to represent the problem. For example, interpret 3/4 as the result of dividing 3 by 4, noting that 3/4 multiplied by 4 equals 3, and that when 3 wholes are shared equally among 4 people each person has a share of size 3/4. If 9 people want to share a 50-pound sack of rice equally by weight, how many pounds of rice should each person get? Between what two whole numbers does your answer lie?
Number and Operations - Fractions Understanding Fractions as Division
5.NF.B.4.A Apply and extend previous understandings of multiplication to multiply a fraction or whole number by a fraction.a. Interpret the product (a/b × q as a parts of a partitionof q into b equal parts; equivalently, as the result of a sequence ofoperations a × q ÷ b. For example, use a visual fraction model to show(2/3) × 4 = 8/3, and create a story context for this equation. Do thesame with (2/3) × (4/5) = 8/15. (In general, (a/b) × (c/d) = (ac)/(bd).
Number and Operations - Fractions Multiplying Fractions by Fractions
5.NF.B.4.B Apply and extend previous understandings of multiplication to multiply a fraction or whole number by a fraction.b. Find the area of a rectangle with fractional side lengths by tiling itwith unit squares of the appropriate unit fraction side lengths, andshow that the area is the same as would be found by multiplyingthe side lengths. Multiply fractional side lengths to find areas ofrectangles, and represent fraction products as rectangular areas.
Number and Operations - Fractions Multiplying Fractions by Fractions
5.NF.B.5.A Interpret multiplication as scaling (resizing), by: a. Comparing the size of a product to the size of one factor on thebasis of the size of the other factor, without performing the indicatedmultiplication.
Number and Operations - Fractions Understanding Products with Fractions

28
2017–2018 School Year
CCSS CorrelationCreated November 2017
Common Core State Standards Imagine MathGrade 5 Unit Lesson
5.NF.B.5.B Interpret multiplication as scaling (resizing), by:b. Explaining why multiplying a given number by a fraction greater than 1 results in a product greater than the given number (recognizing multiplication by whole numbers greater than 1 as a familiar case); explaining why multiplying a given number by a fraction less than 1 results in a product smaller than the given number; and relating the principle of fraction equivalence a/b = (n × a)/(n × b) to the effect of multiplying a/b by 1.
Number and Operations - Fractions Understanding Products with Fractions
5.NF.B.6 Solve real world problems involving multiplication of fractions and mixed numbers, e.g., by using visual fraction models or equations to represent the problem.
Number and Operations - Fractions Multiplying Fractions by Whole Numbers to Solve Multistep ProblemsMultiplying with Fractions and Mixed Numbers
5.NF.B.7.A Apply and extend previous understandings of division to divide unit fractions by whole numbers and whole numbers by unit fractions.a. Interpret division of a unit fraction by a non-zero whole number, and compute such quotients. For example, create a story context for (1/3) ÷ 4, and use a visual fraction model to show the quotient. Use the relationship between multiplication and division to explain that (1/3) ÷ 4 = 1/12 because (1/12) × 4 = 1/3.
Number and Operations - Fractions Dividing Unit Fractions by Whole Numbers
5.NF.B.7.B Apply and extend previous understandings of division to divide unit fractions by whole numbers and whole numbers by unit fractions.b. Interpret division of a whole number by a unit fraction, and compute such quotients. For example, create a story context for 4 ÷ (1/5), and use a visual fraction model to show the quotient. Use the relationship between multiplication and division to explain that 4 ÷ (1/5) = 20 because 20 × (1/5) = 4.
Number and Operations - Fractions Dividing Whole Numbers by Unit Fractions

29
2017–2018 School Year
CCSS CorrelationCreated November 2017
Common Core State Standards Imagine MathGrade 5 Unit Lesson
5.NF.B.7.C Apply and extend previous understandings of division to divide unit fractions by whole numbers and whole numbers by unit fractions.c. Solve real world problems involving division of unit fractions by non-zero whole numbers and division of whole numbers by unit fractions, e.g., by using visual fraction models and equations to represent the problem. For example, how much chocolate will each person get if 3 people share 1/2 lb of chocolate equally? How many 1/3-cup servings are in 2 cups of raisins?
Number and Operations - Fractions Dividing Unit Fractions by Whole Numbers Dividing Whole Numbers by Unit Fractions
Measurement & Data Convert like measurement units within a given measurement system.5.MD.A.1 Convert among different-sized standard measurement units within
a given measurement system (e.g., convert 5 cm to 0.05 m), and use these conversions in solving multi-step, real world problems.
This standard is not addressed. This standard is not addressed.
Represent and interpret data.5.MD.B.2 Make a line plot to display a data set of measurements in fractions
of a unit (1/2, 1/4, 1/8). Use operations on fractions for this grade to solve problems involving information presented in line plots. For example, given different measurements of liquid in identical beakers, find the amount of liquid each beaker would contain if the total amount in all the beakers were redistributed equally.
Measurement and Data Line Plots
Geometric measurement: understand concepts of volume. 5.MD.C.3.A Recognize volume as an attribute of solid figures and understand
concepts of volume measurement.a. A cube with side length 1 unit, called a “unit cube,” is said to have “one cubic unit” of volume, and can be used to measure volume.
Measurement and Data Volume of Rectangular Prisms I

30
2017–2018 School Year
CCSS CorrelationCreated November 2017
Common Core State Standards Imagine MathGrade 5 Unit Lesson
5.MD.C.3.B Recognize volume as an attribute of solid figures and understand concepts of volume measurement.b. A solid figure which can be packed without gaps or overlapsusing n unit cubes is said to have a volume of n cubic units.
Measurement and Data Volume of Rectangular Prisms I
5.MD.C.4 Measure volumes by counting unit cubes, using cubic cm, cubic in, cubic ft, and improvised units.
Measurement and Data Volume of Rectangular Prisms I
5.MD.C.5.A Relate volume to the operations of multiplication and addition and solve real world and mathematical problems involving volume.a. Find the volume of a right rectangular prism with whole-numberside lengths by packing it with unit cubes, and show that the volumeis the same as would be found by multiplying the edge lengths,equivalently by multiplying the height by the area of the base.Represent threefold whole-number products as volumes, e.g., torepresent the associative property of multiplication.
Measurement and Data Volume of Rectangular Prisms II
5.MD.C.5.B Relate volume to the operations of multiplication and addition and solve real world and mathematical problems involving volume.b. Apply the formulas V = l × w × h and V = b × h for rectangularprisms to find volumes of right rectangular prisms with whole-number edge lengths in the context of solving real world andmathematical problems.
Measurement and Data Volume of Rectangular Prisms II
5.MD.C.5.C Relate volume to the operations of multiplication and addition and solve real world and mathematical problems involving volume.c. Recognize volume as additive. Find volumes of solid figurescomposed of two non-overlapping right rectangular prisms byadding the volumes of the non-overlapping parts, applying thistechnique to solve real world problems.
Measurement and Data Volume of Rectangular Prisms II

31
2017–2018 School Year
CCSS CorrelationCreated November 2017
Common Core State Standards Imagine MathGrade 5 Unit Lesson
GeometryGraph points on the coordinate plane to solve real-world and mathematical problems.5.G.A.1 Use a pair of perpendicular number lines, called axes, to define a
coordinate system, with the intersection of the lines (the origin) arranged to coincide with the 0 on each line and a given point in the plane located by using an ordered pair of numbers, called its coordinates. Understand that the first number indicates how far to travel from the origin in the direction of one axis, and the second number indicates how far to travel in the direction of the second axis, with the convention that the names of the two axes and the coordinates correspond (e.g., x-axis and x-coordinate, y-axis and y-coordinate).
Geometry Introduction to Scatter PlotsIntroduction to the Coordinate Plane
5.G.A.2 Represent real world and mathematical problems by graphing points in the first quadrant of the coordinate plane, and interpret coordinate values of points in the context of the situation.
Geometry Introduction to Scatter PlotsRepresenting Real-World Quantities in the First Quadrant
Classify two-dimensional figures into categories based on their properties.5.G.B.3 Understand that attributes belonging to a category of two-
dimensional figures also belong to all subcategories of that category. For example, all rectangles have four right angles and squares are rectangles, so all squares have four right angles.
Geometry Classifying 2-Dimensional Figures
5.G.B.4 Classify two-dimensional figures in a hierarchy based on properties. Geometry Classifying 2-Dimensional FiguresClassifying Triangles

Grade 6Common Core State Standards Mathematics

33
2017–2018 School Year
CCSS CorrelationCreated November 2017
Common Core State Standards Imagine MathGrade 6 Unit Lesson
Ratios & Proportional RelationshipsUnderstand ratio concepts and use ratio reasoning to solve problems.6.RP.A.1 Understand the concept of a ratio and use ratio language to describe
a ratio relationship between two quantities. For example, “The ratio of wings to beaks in the bird house at the zoo was 2:1, because for every 2 wings there was 1 beak.” “For every vote candidate A received, candidate C received nearly three votes.”
Ratios and Proportional Relationships Concept of Ratios and RatesIdentifying Ratios Identifying Unit Rates Ratios Solving Problems with Unit Rates
6.RP.A.2 Understand the concept of a unit rate a/b associated with a ratio a:b with b ≠ 0, and use rate language in the context of a ratio relationship. For example, “This recipe has a ratio of 3 cups of flour to 4 cups of sugar, so there is 3/4 cup of flour for each cup of sugar.” “We paid $75 for 15 hamburgers, which is a rate of $5 per hamburger.”
Ratios and Proportional Relationships Concept of Ratios and RatesIdentifying Unit Rates Solving Problems with Unit Rates
6.RP.A.3 Use ratio and rate reasoning to solve real-world and mathematical problems, e.g., by reasoning about tables of equivalent ratios, tape diagrams, double number line diagrams, or equations.
Ratios and Proportional Relationships Ratios
6.RP.A.3.A Use ratio and rate reasoning to solve real-world and mathematical problems, e.g., by reasoning about tables of equivalent ratios, tape diagrams, double number line diagrams, or equations.a. Make tables of equivalent ratios relating quantities with whole-number measurements, find missing values in the tables, and plot the pairs of values on the coordinate plane. Use tables to compare ratios.
Ratios and Proportional Relationships Using Ratios to Solve ProblemsThe Number System Rational Numbers in the Coordinate Plane II
34
2017–2018 School Year
CCSS CorrelationCreated November 2017
Common Core State Standards Imagine MathGrade 6 Unit Lesson
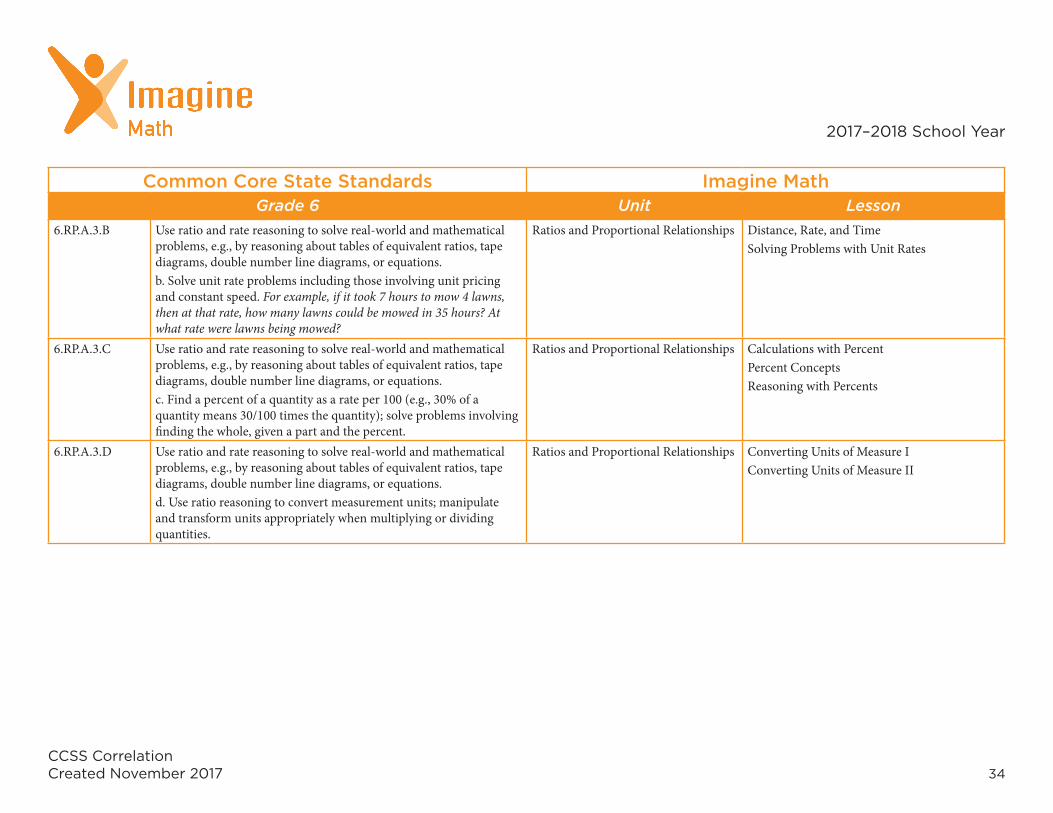
6.RP.A.3.B Use ratio and rate reasoning to solve real-world and mathematical problems, e.g., by reasoning about tables of equivalent ratios, tape diagrams, double number line diagrams, or equations.b. Solve unit rate problems including those involving unit pricing and constant speed. For example, if it took 7 hours to mow 4 lawns, then at that rate, how many lawns could be mowed in 35 hours? At what rate were lawns being mowed?
Ratios and Proportional Relationships Distance, Rate, and Time Solving Problems with Unit Rates
6.RP.A.3.C Use ratio and rate reasoning to solve real-world and mathematical problems, e.g., by reasoning about tables of equivalent ratios, tape diagrams, double number line diagrams, or equations.c. Find a percent of a quantity as a rate per 100 (e.g., 30% of a quantity means 30/100 times the quantity); solve problems involving finding the whole, given a part and the percent.
Ratios and Proportional Relationships Calculations with PercentPercent ConceptsReasoning with Percents
6.RP.A.3.D Use ratio and rate reasoning to solve real-world and mathematical problems, e.g., by reasoning about tables of equivalent ratios, tape diagrams, double number line diagrams, or equations.d. Use ratio reasoning to convert measurement units; manipulate and transform units appropriately when multiplying or dividing quantities.
Ratios and Proportional Relationships Converting Units of Measure IConverting Units of Measure II

35
2017–2018 School Year
CCSS CorrelationCreated November 2017
Common Core State Standards Imagine MathGrade 6 Unit Lesson
The Number SystemApply and extend previous understandings of multiplication and division to divide fractions by fractions.6.NS.A.1 Interpret and compute quotients of fractions, and solve word
problems involving division of fractions by fractions, e.g., by using visual fraction models and equations to represent the problem. For example, create a story context for (2/3) ÷ (3/4) and use a visual fraction model to show the quotient; use the relationship between multiplication and division to explain that (2/3) ÷ (3/4) = 8/9 because 3/4 of 8/9 is 2/3. (In general, (a/b) ÷ (c/d) = ad/bc.) How much chocolate will each person get if 3 people share 1/2 lb of chocolate equally? How many 3/4-cup servings are in 2/3 of a cup of yogurt? How wide is a rectangular strip of land with length 3/4 mi and area 1/2 square mi?.
The Number System Dividing Fractions by Fractions Operations with Fractions - Mixed PracticeUsing Division of Fractions to Represent and Solve ProblemsUsing the Relationship Between Multiplication and Division to Divide Fractions
Compute fluently with multi-digit numbers and find common factors and multiples.6.NS.B.2 Fluently divide multi-digit numbers using the standard algorithm. Number and Operations in Base Ten Dividing Whole Numbers - Standard
Algorithm6.NS.B.3 Fluently add, subtract, multiply, and divide multi-digit decimals
using the standard algorithm for each operation.Number and Operations in Base Ten Adding and Subtracting Decimals
Adding and Subtracting Decimals in Real-World SituationsCalculating with DecimalsUsing Reasoning and Estimation to Calculate with Decimals
6.NS.B.4 Find the greatest common factor of two whole numbers less than or equal to 100 and the least common multiple of two whole numbers less than or equal to 12. Use the distributive property to express a sum of two whole numbers 1-100 with a common factor as a multiple of a sum of two whole numbers with no common factor. For example, express 36 + 8 as 4 (9 + 2)..
The Number System Greatest Common Factor Greatest Common Factor - ApplicationsLeast Common Multiple

36
2017–2018 School Year
CCSS CorrelationCreated November 2017
Common Core State Standards Imagine MathGrade 6 Unit Lesson
Apply and extend previous understandings of numbers to the system of rational numbers.6.NS.C.5 Understand that positive and negative numbers are used together
to describe quantities having opposite directions or values (e.g., temperature above/below zero, elevation above/below sea level, credits/debits, positive/negative electric charge); use positive and negative numbers to represent quantities in real-world contexts, explaining the meaning of 0 in each situation.
The Number System Integer Concepts
6.NS.C.6.A Understand a rational number as a point on the number line. Extend number line diagrams and coordinate axes familiar from previous grades to represent points on the line and in the plane with negative number coordinates.a. Recognize opposite signs of numbers as indicating locations onopposite sides of 0 on the number line; recognize that the opposite ofthe opposite of a number is the number itself, e.g., -(-3) = 3, and that0 is its own opposite.
The Number System Integer Concepts with a Number Line
6.NS.C.6.B Understand a rational number as a point on the number line. Extend number line diagrams and coordinate axes familiar from previous grades to represent points on the line and in the plane with negative number coordinates.b. Understand signs of numbers in ordered pairs as indicatinglocations in quadrants of the coordinate plane; recognize that whentwo ordered pairs differ only by signs, the locations of the points arerelated by reflections across one or both axes.
The Number System Integers in the Coordinate Plane IIntegers in the Coordinate Plane IIRational Numbers in the Coordinate Plane II
6.NS.C.6.C Understand a rational number as a point on the number line. Extend number line diagrams and coordinate axes familiar from previous grades to represent points on the line and in the plane with negative number coordinates.c. Find and position integers and other rational numbers on ahorizontal or vertical number line diagram; find and position pairsof integers and other rational numbers on a coordinate plane.
The Number System Comparing Rational Numbers IInteger Concepts Integer Concepts with a Number LineRational Numbers in the Coordinate Plane I

37
2017–2018 School Year
CCSS CorrelationCreated November 2017
Common Core State Standards Imagine MathGrade 6 Unit Lesson
6.NS.C.7.A Understand ordering and absolute value of rational numbers.a. Interpret statements of inequality as statements about the relativeposition of two numbers on a number line diagram. For example,interpret -3 > -7 as a statement that -3 is located to the right of -7 on anumber line oriented from left to right.
The Number System Comparing Rational Numbers II
6.NS.C.7.B Understand ordering and absolute value of rational numbers.b. Write, interpret, and explain statements of order for rationalnumbers in real-world contexts. For example, write -3 °C > -7 °C toexpress the fact that -3 °C is warmer than -7 °C.
The Number System Comparing Rational Numbers II
6.NS.C.7.C Understand ordering and absolute value of rational numbers.c. Understand the absolute value of a rational number as its distancefrom 0 on the number line; interpret absolute value as magnitude fora positive or negative quantity in a real-world situation. For example,for an account balance of -30 dollars, write |-30| = 30 to describe thesize of the debt in dollars.
The Number System Absolute Value I
6.NS.C.7.D Understand ordering and absolute value of rational numbers.d. Distinguish comparisons of absolute value from statements aboutorder. For example, recognize that an account balance less than -30dollars represents a debt greater than 30 dollars.
The Number System Absolute Value II
6.NS.C.8 Solve real-world and mathematical problems by graphing points in all four quadrants of the coordinate plane. Include use of coordinates and absolute value to find distances between points with the same first coordinate or the same second coordinate.
The Number System Distance on the Coordinate Plane IIRational Numbers in the Coordinate Plane II

38
2017–2018 School Year
CCSS CorrelationCreated November 2017
Common Core State Standards Imagine MathGrade 6 Unit Lesson
Expressions & EquationsApply and extend previous understandings of arithmetic to algebraic expressions.6.EE.A.1 Write and evaluate numerical expressions involving whole-number
exponents.Expressions and Equations Evaluating Expressions and Equations with
ExponentsUnderstanding Exponents
6.EE.A.2.A Write, read, and evaluate expressions in which letters stand for numbers.a. Write expressions that record operations with numbers and with letters standing for numbers. For example, express the calculation “Subtract y from 5” as 5 - y.
Expressions and Equations Introduction to the Language of Algebra
6.EE.A.2.B Write, read, and evaluate expressions in which letters stand for numbers.b. Identify parts of an expression using mathematical terms (sum, term, product, factor, quotient, coefficient); view one or more parts of an expression as a single entity. For example, describe the expression 2 (8 + 7) as a product of two factors; view (8 + 7) as both a single entity and a sum of two terms.
Expressions and Equations Evaluating Expressions with Real Numbers
6.EE.A.2.C Write, read, and evaluate expressions in which letters stand for numbers.c. Evaluate expressions at specific values of their variables. Include expressions that arise from formulas used in real-world problems. Perform arithmetic operations, including those involving whole-number exponents, in the conventional order when there are no parentheses to specify a particular order (Order of Operations). For example, use the formulas V = s3 and A = 6 s2 to find the volume and surface area of a cube with sides of length s = 1/2.
Expressions and Equations Evaluating Expressions and Equations with ExponentsEvaluating Expressions with Two Operations Evaluating Simple Expressions

39
2017–2018 School Year
CCSS CorrelationCreated November 2017
Common Core State Standards Imagine MathGrade 6 Unit Lesson
6.EE.A.3 Apply the properties of operations to generate equivalent expressions. For example, apply the distributive property to the expression 3 (2 + x) to produce the equivalent expression 6 + 3x; apply the distributive property to the expression 24x + 18y to produce the equivalent expression 6 (4x + 3y); apply properties of operations to y + y + y to produce the equivalent expression 3y.
Expressions and Equations Combining Like TermsEvaluating Expressions with the Distributive Property Identifying and Generating Equivalent Expressions Using the Distributive Property to Represent Real-World Situations
6.EE.A.4 Identify when two expressions are equivalent (i.e., when the two expressions name the same number regardless of which value is substituted into them). For example, the expressions y + y + y and 3y are equivalent because they name the same number regardless of which number y stands for..
Expressions and Equations Combining Like TermsIdentifying and Generating Equivalent Expressions
Reason about and solve one-variable equations and inequalities.6.EE.B.5 Understand solving an equation or inequality as a process of
answering a question: which values from a specified set, if any, make the equation or inequality true? Use substitution to determine whether a given number in a specified set makes an equation or inequality true.
Expressions and Equations Reasoning About One-Step Equations
6.EE.B.6 Use variables to represent numbers and write expressions when solving a real-world or mathematical problem; understand that a variable can represent an unknown number, or, depending on the purpose at hand, any number in a specified set.
Expressions and Equations Introduction to the Language of Algebra
6.EE.B.7 Solve real-world and mathematical problems by writing and solving equations of the form x + p = q and px = q for cases in which p, q and x are all nonnegative rational numbers.
Expressions and Equations Introduction to Solving Word Problems with Algebra Writing and Solving One-Step Equations

40
2017–2018 School Year
CCSS CorrelationCreated November 2017
Common Core State Standards Imagine MathGrade 6 Unit Lesson
6.EE.B.8 Write an inequality of the form x > c or x < c to represent a constraint or condition in a real-world or mathematical problem. Recognize that inequalities of the form x > c or x < c have infinitely many solutions; represent solutions of such inequalities on number line diagrams.Represent
Expressions and Equations Concept of Inequalities I
Represent and analyze quantitative relationships between dependent and independent variables.6.EE.C.9 Use variables to represent two quantities in a real-world problem
that change in relationship to one another; write an equation to express one quantity, thought of as the dependent variable, in terms of the other quantity, thought of as the independent variable. Analyze the relationship between the dependent and independent variables using graphs and tables, and relate these to the equation. For example, in a problem involving motion at constant speed, list and graph ordered pairs of distances and times, and write the equation d = 65t to represent the relationship between distance and time.
Expressions and Equations Independent and Dependent Quantities
GeometrySolve real-world and mathematical problems involving area, surface area, and volume.6.G.A.1 Find the area of right triangles, other triangles, special quadrilaterals,
and polygons by composing into rectangles or decomposing into triangles and other shapes; apply these techniques in the context of solving real-world and mathematical problems.
Geometry Area of Complex Composite FiguresArea of ParallelogramsArea of Trapezoids and Composite FiguresArea of Triangles

41
2017–2018 School Year
CCSS CorrelationCreated November 2017
Common Core State Standards Imagine MathGrade 6 Unit Lesson
6.G.A.2 Find the volume of a right rectangular prism with fractional edge lengths by packing it with unit cubes of the appropriate unit fraction edge lengths, and show that the volume is the same as would be found by multiplying the edge lengths of the prism. Apply the formulas V = l w h and V = b h to find volumes of right rectangular prisms with fractional edge lengths in the context of solving real-world and mathematical problems.
Geometry Surface Area and Volume of Rectangular Prisms
6.G.A.3 Draw polygons in the coordinate plane given coordinates for the vertices; use coordinates to find the length of a side joining points with the same first coordinate or the same second coordinate. Apply these techniques in the context of solving real-world and mathematical problems.
Geometry Distance on the Coordinate Plane I
6.G.A.4 Represent three-dimensional figures using nets made up of rectangles and triangles, and use the nets to find the surface area of these figures. Apply these techniques in the context of solving real-world and mathematical problems.
Geometry Surface Area and Volume of Rectangular PrismsSurface Area of Pyramids
Statistics & ProbabilityDevelop understanding of statistical variability.6.SP.A.1 Recognize a statistical question as one that anticipates variability
in the data related to the question and accounts for it in the answers. For example, “How old am I?” is not a statistical question, but “How old are the students in my school?” is a statistical question because one anticipates variability in students' ages.
Statistics and Probability Data Analysis

42
2017–2018 School Year
CCSS CorrelationCreated November 2017
Common Core State Standards Imagine MathGrade 6 Unit Lesson
6.SP.A.2 Understand that a set of data collected to answer a statistical question has a distribution which can be described by its center, spread, and overall shape.
Statistics and Probability Box PlotsMeasures of Center - MeanMeasures of Center - MedianMeasures of Spread - RangeQuartilesStem-and-Leaf PlotsSummarizing Data
6.SP.A.3 Recognize that a measure of center for a numerical data set summarizes all of its values with a single number, while a measure of variation describes how its values vary with a single number.
Statistics and Probability Measures of Spread - RangeQuartilesUnderstanding the Effects of Outliers on Mean and Median
Summarize and describe distributions.6.SP.B.4 Display numerical data in plots on a number line, including dot
plots, histograms, and box plots.Geometry Introduction to Scatter PlotsStatistics and Probability Bar Graphs and Histograms
Box PlotsCircle GraphsStem-and-Leaf Plots
6.SP.B.5.A Summarize numerical data sets in relation to their context, such as by:a. Reporting the number of observations.
Statistics and Probability Summarizing Data
6.SP.B.5.B Summarize numerical data sets in relation to their context, such as by:b. Describing the nature of the attribute under investigation,including how it was measured and its units of measurement.
Statistics and Probability Summarizing Data

43
2017–2018 School Year
CCSS CorrelationCreated November 2017
Common Core State Standards Imagine MathGrade 6 Unit Lesson
6.SP.B.5.C Summarize numerical data sets in relation to their context, such as by:c. Giving quantitative measures of center (median and/or mean) and variability (interquartile range and/or mean absolute deviation), as well as describing any overall pattern and any striking deviations from the overall pattern with reference to the context in which the data were gathered.
Statistics and Probability Box PlotsDeviation from the MeanMeasures of Center - MeanMeasures of Center - MedianStem-and-Leaf PlotsSummarizing Data
6.SP.B.5.D Summarize numerical data sets in relation to their context, such as by:d. Relating the choice of measures of center and variability to the shape of the data distribution and the context in which the data were gathered.
Statistics and Probability Deviation from the MeanSummarizing Data

Grade 7Common Core State Standards Mathematics

45
2017–2018 School Year
CCSS CorrelationCreated November 2017
Common Core State Standards Imagine MathGrade 7 Unit Lesson
Ratios & Proportional RelationshipsAnalyze proportional relationships and use them to solve real-world and mathematical problems.7.RP.A.1 Compute unit rates associated with ratios of fractions, including
ratios of lengths, areas and other quantities measured in like or different units. For example, if a person walks 1/2 mile in each 1/4 hour, compute the unit rate as the complex fraction 1/2/1/4 miles per hour, equivalently 2 miles per hour.
Ratios and Proportional Relationships Interpreting Points on Graphs of Proportional Relationships
7.RP.A.2.A Recognize and represent proportional relationships between quantities.a. Decide whether two quantities are in a proportional relationship,e.g., by testing for equivalent ratios in a table or graphing on acoordinate plane and observing whether the graph is a straight linethrough the origin.
Ratios and Proportional Relationships Proportion Concepts Proportional Relationships in Tables and Equations
7.RP.A.2.B Recognize and represent proportional relationships between quantities.b. Identify the constant of proportionality (unit rate) in tables,graphs, equations, diagrams, and verbal descriptions of proportionalrelationships.
Ratios and Proportional Relationships Interpreting Unit Rates on Graphs
7.RP.A.2.C Recognize and represent proportional relationships between quantities.c. Represent proportional relationships by equations. For example,if total cost t is proportional to the number n of items purchased at aconstant price p, the relationship between the total cost and the numberof items can be expressed as t = pn.
Ratios and Proportional Relationships Introduction to Similar Figures Proportion Concepts Proportional Relationships in Tables and Equations Using Similar Figures to Solve Problems
7.RP.A.2.D Recognize and represent proportional relationships between quantities.d. Explain what a point (x, y) on the graph of a proportionalrelationship means in terms of the situation, with special attention tothe points (0, 0) and (1, r) where r is the unit rate.
Ratios and Proportional Relationships Interpreting Points on Graphs of Proportional Relationships

46
2017–2018 School Year
CCSS CorrelationCreated November 2017
Common Core State Standards Imagine MathGrade 7 Unit Lesson
7.RP.A.3 Use proportional relationships to solve multistep ratio and percent problems. Examples: simple interest, tax, markups and markdowns, gratuities and commissions, fees, percent increase and decrease, percent error.
Ratios and Proportional Relationships Percent and Percent ChangePercent and Percent ErrorProportions in Scale DrawingsSimple InterestUsing Proportions to Solve Problems
The Number SystemApply and extend previous understandings of operations with fractions.7.NS.A.1.A Apply and extend previous understandings of addition and
subtraction to add and subtract rational numbers; represent addition and subtraction on a horizontal or vertical number line diagram.a. Describe situations in which opposite quantities combine tomake 0. For example, a hydrogen atom has 0 charge because its twoconstituents are oppositely charged.
The Number System Adding and Subtracting Rational Numbers I
7.NS.A.1.B Apply and extend previous understandings of addition and subtraction to add and subtract rational numbers; represent addition and subtraction on a horizontal or vertical number line diagram.b. Understand p + q as the number located a distance |q| from p,in the positive or negative direction depending on whether q ispositive or negative. Show that a number and its opposite have a sumof 0 (are additive inverses). Interpret sums of rational numbers bydescribing real-world contexts.
The Number System Adding and Subtracting Rational Numbers I
7.NS.A.1.C Apply and extend previous understandings of addition and subtraction to add and subtract rational numbers; represent addition and subtraction on a horizontal or vertical number line diagram.c. Understand subtraction of rational numbers as adding the additiveinverse, p - q = p + (-q). Show that the distance between two rationalnumbers on the number line is the absolute value of their difference,and apply this principle in real-world contexts.
The Number System Adding and Subtracting Rational Numbers II

47
2017–2018 School Year
CCSS CorrelationCreated November 2017
Common Core State Standards Imagine MathGrade 7 Unit Lesson
7.NS.A.1.D Apply and extend previous understandings of addition and subtraction to add and subtract rational numbers; represent addition and subtraction on a horizontal or vertical number line diagram.d. Apply properties of operations as strategies to add and subtract rational numbers.
The Number System Adding and Subtracting Rational Numbers I
7.NS.A.2.A Apply and extend previous understandings of multiplication and division and of fractions to multiply and divide rational numbers.a. Understand that multiplication is extended from fractions to rational numbers by requiring that operations continue to satisfy the properties of operations, particularly the distributive property, leading to products such as (-1)(-1) = 1 and the rules for multiplying signed numbers. Interpret products of rational numbers by describing real-world contexts.
The Number System Multiplying and Dividing Rational Numbers
7.NS.A.2.B Apply and extend previous understandings of multiplication and division and of fractions to multiply and divide rational numbers.b. Understand that integers can be divided, provided that the divisor is not zero, and every quotient of integers (with non-zero divisor) is a rational number. If p and q are integers, then -(p/q) = (-p)/q = p/(-q). Interpret quotients of rational numbers by describing real-world contexts.
The Number System Multiplying and Dividing Rational Numbers
7.NS.A.2.C Apply and extend previous understandings of multiplication and division and of fractions to multiply and divide rational numbers.c. Apply properties of operations as strategies to multiply and divide rational numbers.
Number and Operations - Fractions Understanding and Multiplying with Negative Mixed Numbers
The Number System Multiplying and Dividing Rational Numbers
7.NS.A.2.D Apply and extend previous understandings of multiplication and division and of fractions to multiply and divide rational numbers.d. Convert a rational number to a decimal using long division; know that the decimal form of a rational number terminates in 0s or eventually repeats.
Number and Operations - Fractions Using Division to Write Fractions as DecimalsThe Number System Multiplying and Dividing Rational Numbers

48
2017–2018 School Year
CCSS CorrelationCreated November 2017
Common Core State Standards Imagine MathGrade 7 Unit Lesson
7.NS.A.3 Solve real-world and mathematical problems involving the four operations with rational numbers.
The Number System Operations with Rational Numbers IWriting and Interpreting Expressions with Rational Numbers
Expressions & EquationsUse properties of operations to generate equivalent expressions.7.EE.A.1 Apply properties of operations as strategies to add, subtract, factor,
and expand linear expressions with rational coefficients.Expressions and Equations Common Factors in Polynomials
7.EE.A.2 Understand that rewriting an expression in different forms in a problem context can shed light on the problem and how the quantities in it are related. For example, a + 0.05a = 1.05a means that “increase by 5%” is the same as “multiply by 1.05.”
Expressions and Equations Solving Word Problems with Algebra
Solve real-life and mathematical problems using numerical and algebraic expressions and equations.7.EE.B.3 Solve multi-step real-life and mathematical problems posed with
positive and negative rational numbers in any form (whole numbers, fractions, and decimals), using tools strategically. Apply properties of operations to calculate with numbers in any form; convert between forms as appropriate; and assess the reasonableness of answers using mental computation and estimation strategies. For example: If a woman making $25 an hour gets a 10% raise, she will make an additional 1/10 of her salary an hour, or $2.50, for a new salary of $27.50. If you want to place a towel bar 9 3/4 inches long in the center of a door that is 27 1/2 inches wide, you will need to place the bar about 9 inches from each edge; this estimate can be used as a check on the exact computation.
Expressions and Equations Fraction, Decimal, and Percent EquivalentsThe Number System Operations with Rational Numbers II
Writing and Interpreting Expressions with Rational Numbers

49
2017–2018 School Year
CCSS CorrelationCreated November 2017
Common Core State Standards Imagine MathGrade 7 Unit Lesson
7.EE.B.4.A Use variables to represent quantities in a real-world or mathematical problem, and construct simple equations and inequalities to solve problems by reasoning about the quantities.a. Solve word problems leading to equations of theform px + q = r and p(x + q) = r, where p, q, and r are specificrational numbers. Solve equations of these forms fluently. Comparean algebraic solution to an arithmetic solution, identifying thesequence of the operations used in each approach. For example, theperimeter of a rectangle is 54 cm. Its length is 6 cm. What is its width?
Expressions and Equations Solving and Modeling Two-Step Problems Solving Equations with the Distributive Property Solving Equations with the Distributive Property in Context
7.EE.B.4.B Use variables to represent quantities in a real-world or mathematical problem, and construct simple equations and inequalities to solve problems by reasoning about the quantities.b. Solve word problems leading to inequalities of theform px + q > r or px + q < r, where p, q, and r are specific rationalnumbers. Graph the solution set of the inequality and interpret it inthe context of the problem. For example: As a salesperson, you arepaid $50 per week plus $3 per sale. This week you want your pay to beat least $100. Write an inequality for the number of sales you need tomake, and describe the solutions.
Expressions and Equations Concept of Inequalities IIModeling, Evaluating, and Graphing Two-Step Inequalities in One Variable
GeometryDraw construct, and describe geometrical figures and describe the relationships between them.7.G.A.1 Solve problems involving scale drawings of geometric figures,
including computing actual lengths and areas from a scale drawing and reproducing a scale drawing at a different scale.
Ratios and Proportional Relationships Introduction to Similar Figures Proportions in Scale DrawingsSimilarityUsing Proportions to Solve ProblemsUsing Similar Figures to Solve Problems

50
2017–2018 School Year
CCSS CorrelationCreated November 2017
Common Core State Standards Imagine MathGrade 7 Unit Lesson
7.G.A.2 Draw (freehand, with ruler and protractor, and with technology) geometric shapes with given conditions. Focus on constructing triangles from three measures of angles or sides, noticing when the conditions determine a unique triangle, more than one triangle, or no triangle.
Geometry Using Line Segments and Angles to Make Triangles
7.G.A.3 Describe the two-dimensional figures that result from slicing three-dimensional figures, as in plane sections of right rectangular prisms and right rectangular pyramids.
This standard is not addressed. This standard is not addressed.
Solve real-life and mathematical problems involving angle measure, area, surface area, and volume.7.G.B.4 Know the formulas for the area and circumference of a circle and
use them to solve problems; give an informal derivation of the relationship between the circumference and area of a circle.
Geometry Area of CirclesCircumferenceSurface Area of Composite SolidsSurface Area of ConesSurface Area of Cylinders
7.G.B.5 Use facts about supplementary, complementary, vertical, and adjacent angles in a multi-step problem to write and solve simple equations for an unknown angle in a figure.
Geometry Angle PairsAngles in a Polygon
7.G.B.6 Solve real-world and mathematical problems involving area, volume and surface area of two- and three-dimensional objects composed of triangles, quadrilaterals, polygons, cubes, and right prisms.
Geometry Area of Complex Composite FiguresSurface Area and Volume of Rectangular PrismsSurface Area of Composite SolidsSurface Area of ConesSurface Area of CylindersSurface Area of Pyramids

51
2017–2018 School Year
CCSS CorrelationCreated November 2017
Common Core State Standards Imagine MathGrade 7 Unit Lesson
Statistics & ProbabilityUse random sampling to draw inferences about a population.7.SP.A.1 Understand that statistics can be used to gain information about a
population by examining a sample of the population; generalizations about a population from a sample are valid only if the sample is representative of that population. Understand that random sampling tends to produce representative samples and support valid inferences.
This standard is not addressed. This standard is not addressed.
7.SP.A.2 Use data from a random sample to draw inferences about a population with an unknown characteristic of interest. Generate multiple samples (or simulated samples) of the same size to gauge the variation in estimates or predictions. For example, estimate the mean word length in a book by randomly sampling words from the book; predict the winner of a school election based on randomly sampled survey data. Gauge how far off the estimate or prediction might be.
Statistics and Probability Sampling
Draw informal comparative inferences about two populations.7.SP.B.3 Informally assess the degree of visual overlap of two numerical data
distributions with similar variabilities, measuring the difference between the centers by expressing it as a multiple of a measure of variability. For example, the mean height of players on the basketball team is 10 cm greater than the mean height of players on the soccer team, about twice the variability (mean absolute deviation) on either team; on a dot plot, the separation between the two distributions of heights is noticeable.
Statistics and Probability Comparing Data

52
2017–2018 School Year
CCSS CorrelationCreated November 2017
Common Core State Standards Imagine MathGrade 7 Unit Lesson
7.SP.B.4 Use measures of center and measures of variability for numerical data from random samples to draw informal comparative inferences about two populations. For example, decide whether the words in a chapter of a seventh-grade science book are generally longer than the words in a chapter of a fourth-grade science book.
Statistics and Probability Sampling
Investigate chance processes and develop, use, and evaluate probability models.7.SP.C.5 Understand that the probability of a chance event is a number
between 0 and 1 that expresses the likelihood of the event occurring. Larger numbers indicate greater likelihood. A probability near 0 indicates an unlikely event, a probability around 1/2 indicates an event that is neither unlikely nor likely, and a probability near 1 indicates a likely event.
Statistics and Probability Probability and Sample SpacesSimple Probability
7.SP.C.6 Approximate the probability of a chance event by collecting data on the chance process that produces it and observing its long-run relative frequency, and predict the approximate relative frequency given the probability. For example, when rolling a number cube 600 times, predict that a 3 or 6 would be rolled roughly 200 times, but probably not exactly 200 times.
Statistics and Probability Making Predictions
7.SP.C.7.A Develop a probability model and use it to find probabilities of events. Compare probabilities from a model to observed frequencies; if the agreement is not good, explain possible sources of the discrepancy.a. Develop a uniform probability model by assigning equalprobability to all outcomes, and use the model to determineprobabilities of events. For example, if a student is selected at randomfrom a class, find the probability that Jane will be selected and theprobability that a girl will be selected.
Statistics and Probability Compound Probability

53
2017–2018 School Year
CCSS CorrelationCreated November 2017
Common Core State Standards Imagine MathGrade 7 Unit Lesson
7.SP.C.7.B Develop a probability model and use it to find probabilities of events. Compare probabilities from a model to observed frequencies; if the agreement is not good, explain possible sources of the discrepancy.b. Develop a probability model (which may not be uniform) by observing frequencies in data generated from a chance process. For example, find the approximate probability that a spinning penny will land heads up or that a tossed paper cup will land open-end down. Do the outcomes for the spinning penny appear to be equally likely based on the observed frequencies?
Statistics and Probability Simple Probability
7.SP.C.8.A Find probabilities of compound events using organized lists, tables, tree diagrams, and simulation.a. Understand that, just as with simple events, the probability of a compound event is the fraction of outcomes in the sample space for which the compound event occurs.
Statistics and Probability Compound Probability
7.SP.C.8.B Find probabilities of compound events using organized lists, tables, tree diagrams, and simulation.b. Represent sample spaces for compound events using methods such as organized lists, tables and tree diagrams. For an event described in everyday language (e.g., “rolling double sixes”), identify the outcomes in the sample space which compose the event.
Statistics and Probability Probability and Sample Spaces
7.SP.C.8.C Find probabilities of compound events using organized lists, tables, tree diagrams, and simulation.c. Design and use a simulation to generate frequencies for compound events. For example, use random digits as a simulation tool to approximate the answer to the question: If 40% of donors have type A blood, what is the probability that it will take at least 4 donors to find one with type A blood?
Statistics and Probability Simulations of Simple and Compound Events

Grade 8Common Core State Standards Mathematics

55
2017–2018 School Year
CCSS CorrelationCreated November 2017
Common Core State Standards Imagine MathGrade 8 Unit Lesson
The Number SystemKnow that there are numbers that are not rational, and approximate them by rational numbers.8.NS.A.1 Know that numbers that are not rational are called irrational.
Understand informally that every number has a decimal expansion; for rational numbers show that the decimal expansion repeats eventually, and convert a decimal expansion which repeats eventually into a rational number.
The Number System Approximating Values of Irrational NumbersClassifying and Ordering Real Numbers
8.NS.A.2 Use rational approximations of irrational numbers to compare the size of irrational numbers, locate them approximately on a number line diagram, and estimate the value of expressions (e.g., π2). For example, by truncating the decimal expansion of √2, show that √2 is between 1 and 2, then between 1.4 and 1.5, and explain how to continue on to get better approximations.
The Number System Approximating Values of Irrational Numbers
Expressions & EquationsWork with radicals and integer exponents.8.EE.A.1 Know and apply the properties of integer exponents to generate
equivalent numerical expressions. For example, 32 × 3-5 = 3-3 = 1/33 = 1/27.
Expressions and Equations Applying Properties of Integer ExponentsUnderstanding Properties of Integer Exponents
8.EE.A.2 Use square root and cube root symbols to represent solutions to equations of the form x2 = p and x3 = p, where p is a positive rational number. Evaluate square roots of small perfect squares and cube roots of small perfect cubes. Know that √2 is irrational.
Expressions and Equations Understanding Square and Cube Roots
8.EE.A.3 Use numbers expressed in the form of a single digit times an integer power of 10 to estimate very large or very small quantities, and to express how many times as much one is than the other. For example, estimate the population of the United States as 3 times 108 and the population of the world as 7 times 109, and determine that the world population is more than 20 times larger.
Expressions and Equations Interpreting Numbers Written in Scientific Notation

56
2017–2018 School Year
CCSS CorrelationCreated November 2017
Common Core State Standards Imagine MathGrade 8 Unit Lesson
8.EE.A.4 Perform operations with numbers expressed in scientific notation, including problems where both decimal and scientific notation are used. Use scientific notation and choose units of appropriate size for measurements of very large or very small quantities (e.g., use millimeters per year for seafloor spreading). Interpret scientific notation that has been generated by technology.
Expressions and Equations Operations with Numbers in Scientific Notation
Understand the connections between proportional relationships, lines, and linear equations.8.EE.B.5 Graph proportional relationships, interpreting the unit rate as the
slope of the graph. Compare two different proportional relationships represented in different ways. For example, compare a distance-time graph to a distance-time equation to determine which of two moving objects has greater speed.
Expressions and Equations Interpreting Slope
8.EE.B.6 Use similar triangles to explain why the slope m is the same between any two distinct points on a non-vertical line in the coordinate plane; derive the equation y = mx for a line through the origin and the equation y = mx + b for a line intercepting the vertical axis at b.
Expressions and Equations Slope Functions Slope-Intercept Form
Analyze and solve linear equations and pairs of simultaneous linear equations.8.EE.C.7.A Solve linear equations in one variable.
a. Give examples of linear equations in one variable with onesolution, infinitely many solutions, or no solutions. Show whichof these possibilities is the case by successively transforming thegiven equation into simpler forms, until an equivalent equation ofthe form x = a, a = a, or a = b results (where a and b are differentnumbers).
Expressions and Equations Analyzing Solution Sets to Linear Equations with the Variable on Both Sides
8.EE.C.7.B Solve linear equations in one variable.b. Solve linear equations with rational number coefficients, includingequations whose solutions require expanding expressions using thedistributive property and collecting like terms.
Expressions and Equations Solving Equations with the Variable on Both SidesSolving Two-Step Equations

57
2017–2018 School Year
CCSS CorrelationCreated November 2017
Common Core State Standards Imagine MathGrade 8 Unit Lesson
8.EE.C.8 Analyze and solve pairs of simultaneous linear equations. Expressions and Equations Solving a System of Linear Equations AlgebraicallySolving a System of Linear Equations Graphically
8.EE.C.8.A Analyze and solve pairs of simultaneous linear equations.a. Understand that solutions to a system of two linear equations in two variables correspond to points of intersection of their graphs, because points of intersection satisfy both equations simultaneously.
Expressions and Equations Solving a System of Linear Equations Graphically
8.EE.C.8.B Analyze and solve pairs of simultaneous linear equations.b. Solve systems of two linear equations in two variables algebraically, and estimate solutions by graphing the equations. Solve simple cases by inspection. For example, 3x + 2y = 5 and 3x + 2y = 6 have no solution because 3x + 2y cannot simultaneously be 5 and 6.
Expressions and Equations Solving a System of Linear Equations Algebraically
8.EE.C.8.C Analyze and solve pairs of simultaneous linear equations.c. Solve real-world and mathematical problems leading to two linear equations in two variables. For example, given coordinates for two pairs of points, determine whether the line through the first pair of points intersects the line through the second pair.
Expressions and Equations Solving a System of Linear Equations - Applications
FunctionsDefine, evaluate, and compare functions.8.F.A.1 Understand that a function is a rule that assigns to each input
exactly one output. The graph of a function is the set of ordered pairs consisting of an input and the corresponding output.
Expressions and Equations Slope
8.F.A.2 Compare properties of two functions each represented in a different way (algebraically, graphically, numerically in tables, or by verbal descriptions). For example, given a linear function represented by a table of values and a linear function represented by an algebraic expression, determine which function has the greater rate of change.
Expressions and Equations Slope

58
2017–2018 School Year
CCSS CorrelationCreated November 2017
Common Core State Standards Imagine MathGrade 8 Unit Lesson
8.F.A.3 Interpret the equation y = mx + b as defining a linear function, whose graph is a straight line; give examples of functions that are not linear. For example, the function A = s2 giving the area of a square as a function of its side length is not linear because its graph contains the points (1,1), (2,4) and (3,9), which are not on a straight line.
Functions Point-Slope Form
Use functions to model relationships between quantities.8.F.B.4 Construct a function to model a linear relationship between two
quantities. Determine the rate of change and initial value of the function from a description of a relationship or from two (x, y) values, including reading these from a table or from a graph. Interpret the rate of change and initial value of a linear function in terms of the situation it models, and in terms of its graph or a table of values.
Functions Point-Slope FormSlope-Intercept Form
8.F.B.5 Describe qualitatively the functional relationship between two quantities by analyzing a graph (e.g., where the function is increasing or decreasing, linear or nonlinear). Sketch a graph that exhibits the qualitative features of a function that has been described verbally.
Functions Interpreting Graphs of Real-World SituationsIntroduction to Sketching Graphs of Real-World Situations
GeometryUnderstand congruence and similarity using physical models, transparencies, or geometry software.8.G.A.1.A Verify experimentally the properties of rotations, reflections, and
translations:a. Lines are taken to lines, and line segments to line segments of thesame length.
This standard is not addressed. This standard is not addressed.
8.G.A.1.B Verify experimentally the properties of rotations, reflections, and translations:b. Angles are taken to angles of the same measure.
This standard is not addressed. This standard is not addressed.

59
2017–2018 School Year
CCSS CorrelationCreated November 2017
Common Core State Standards Imagine MathGrade 8 Unit Lesson
8.G.A.1.C Verify experimentally the properties of rotations, reflections, and translations:c. Parallel lines are taken to parallel lines.
This standard is not addressed. This standard is not addressed.
8.G.A.2 Understand that a two-dimensional figure is congruent to another if the second can be obtained from the first by a sequence of rotations, reflections, and translations; given two congruent figures, describe a sequence that exhibits the congruence between them.
Geometry Congruence
8.G.A.3 Describe the effect of dilations, translations, rotations, and reflections on two-dimensional figures using coordinates.
Geometry Composition of TransformationsDilationsDilations in the Coordinate PlaneReflectionsRotationsTranslations
8.G.A.4 Understand that a two-dimensional figure is similar to another if the second can be obtained from the first by a sequence of rotations, reflections, translations, and dilations; given two similar two-dimensional figures, describe a sequence that exhibits the similarity between them.
Geometry Dilations
8.G.A.5 Use informal arguments to establish facts about the angle sum and exterior angle of triangles, about the angles created when parallel lines are cut by a transversal, and the angle-angle criterion for similarity of triangles. For example, arrange three copies of the same triangle so that the sum of the three angles appears to form a line, and give an argument in terms of transversals why this is so.
Geometry Angles in a PolygonParallel Lines and Transversals
Understand and apply the Pythagorean Theorem.8.G.B.6 Explain a proof of the Pythagorean Theorem and its converse. Geometry Understanding the Pythagorean Theorem

60
2017–2018 School Year
CCSS CorrelationCreated November 2017
Common Core State Standards Imagine MathGrade 8 Unit Lesson
8.G.B.7 Apply the Pythagorean Theorem to determine unknown side lengths in right triangles in real-world and mathematical problems in two and three dimensions.
Geometry Pythagorean Theorem - Distance FormulaPythagorean Theorem - HypotenusePythagorean Theorem - LegsPythagorean Theorem - Mixed Problems
8.G.B.8 Apply the Pythagorean Theorem to find the distance between two points in a coordinate system.
Geometry Pythagorean Theorem - Distance Formula
Solve real-world and mathematical problems involving volume of cylinders, cones, and spheres.8.G.C.9 Know the formulas for the volumes of cones, cylinders, and spheres
and use them to solve real-world and mathematical problems.Geometry Volume of Composite Solids
Volume of CylindersVolume of Pyramids and ConesVolume of Spheres
Statistics & ProbabilityInvestigate patterns of association in bivariate data.8.SP.A.1 Construct and interpret scatter plots for bivariate measurement
data to investigate patterns of association between two quantities. Describe patterns such as clustering, outliers, positive or negative association, linear association, and nonlinear association.
Statistics and Probability Comparing Linear and Nonlinear Data
8.SP.A.2 Know that straight lines are widely used to model relationships between two quantitative variables. For scatter plots that suggest a linear association, informally fit a straight line, and informally assess the model fit by judging the closeness of the data points to the line.
Building Functions Direct VariationStatistics and Probability Comparing Linear and Nonlinear Data
8.SP.A.3 Use the equation of a linear model to solve problems in the context of bivariate measurement data, interpreting the slope and intercept. For example, in a linear model for a biology experiment, interpret a slope of 1.5 cm/hr as meaning that an additional hour of sunlight each day is associated with an additional 1.5 cm in mature plant height.
Building Functions Direct VariationFunctions Slope-Intercept Form

61
2017–2018 School Year
CCSS CorrelationCreated November 2017
Common Core State Standards Imagine MathGrade 8 Unit Lesson
8.SP.A.4 Understand that patterns of association can also be seen in bivariate categorical data by displaying frequencies and relative frequencies in a two-way table. Construct and interpret a two-way table summarizing data on two categorical variables collected from the same subjects. Use relative frequencies calculated for rows or columns to describe possible association between the two variables. For example, collect data from students in your class on whether or not they have a curfew on school nights and whether or not they have assigned chores at home. Is there evidence that those who have a curfew also tend to have chores?
Statistics and Probability Patterns of Association in Data

Algebra ICommon Core State Standards Mathematics

63
2017–2018 School Year
CCSS CorrelationCreated November 2017
Common Core State Standards Imagine MathAlgebra I Unit Lesson
The Real Number System Extend the properties of exponents to rational exponents. HSN.RN.A.1 Explain how the definition of the meaning of rational exponents
follows from extending the properties of integer exponents to those values, allowing for a notation for radicals in terms of rational exponents. For example, we define 51/3 to be the cube root of 5 because we want (51/3)3 = 5(1/3)3 to hold, so (51/3)3 must equal 5.
Interpreting Functions Radical Functions and Their GraphsRational Functions and Their Graphs
The Real Number System Using Rational Exponents to Rewrite Expressions
HSN.RN.A.2 Rewrite expressions involving radicals and rational exponents using the properties of exponents.
Interpreting Functions Radical Functions and Their GraphsRational Functions and Their Graphs
The Real Number System Using Rational Exponents to Rewrite Expressions
Use properties of rational and irrational numbers.HSN.RN.B.3 Explain why the sum or product of two rational numbers is rational;
that the sum of a rational number and an irrational number is irrational; and that the product of a nonzero rational number and an irrational number is irrational.
The Real Number System Products and Sums with Rational and Irrational Numbers
Quantities*Reason quantitatively and use units to solve problems.HSN.Q.A.1 Use units as a way to understand problems and to guide the solution
of multi-step problems; choose and interpret units consistently in formulas; choose and interpret the scale and the origin in graphs and data displays.
Quantities Using Units to Solve ProblemsStatistics and Probability Standard Deviation
HSN.Q.A.2 Define appropriate quantities for the purpose of descriptive modeling.
This standard is not addressed. This standard is not addressed.
HSN.Q.A.3 Choose a level of accuracy appropriate to limitations on measurement when reporting quantities.
Quantities Using Units to Solve Problems

64
2017–2018 School Year
CCSS CorrelationCreated November 2017
Common Core State Standards Imagine MathAlgebra I Unit Lesson
Seeing Structure in ExpressionsInterpret the structure of expressions.HSA.SSE.A.1.A Interpret expressions that represent a quantity in terms of its context.
a. Interpret parts of an expression, such as terms, factors, and coefficients.
Seeing Structure in Expressions Interpreting the Structure of Linear and Exponential ExpressionsInterpreting the Structure of Quadratic Expressions and Expressions with Rational Exponents
HSA.SSE.A.1.B Interpret expressions that represent a quantity in terms of its context.b. Interpret complicated expressions by viewing one or more of their parts as a single entity. For example, interpret P(1+r)n as the product of P and a factor not depending on P.
Seeing Structure in Expressions Interpreting the Structure of Linear and Exponential ExpressionsInterpreting the Structure of Quadratic Expressions and Expressions with Rational Exponents
HSA.SSE.A.2 Use the structure of an expression to identify ways to rewrite it. For example, see x4 - y4 as (x2)2 - (y2)2, thus recognizing it as a difference of squares that can be factored as (x2 - y2)(x2 + y2).
Seeing Structure in Expressions Factoring PolynomialsFactoring Quadratic Expressions
Write expressions in equivalent forms to solve problems.HSA.SSE.B.3.A Choose and produce an equivalent form of an expression to reveal
and explain properties of the quantity represented by the expression.a. Factor a quadratic expression to reveal the zeros of the function it defines.
Seeing Structure in Expressions Factoring ExpressionsFactoring PolynomialsFactoring Quadratic Expressions
HSA.SSE.B.3.B Choose and produce an equivalent form of an expression to reveal and explain properties of the quantity represented by the expression.b. Complete the square in a quadratic expression to reveal the maximum or minimum value of the function it defines.
Interpreting Functions Rewriting Quadratics to Reveal Their Structure

65
2017–2018 School Year
CCSS CorrelationCreated November 2017
Common Core State Standards Imagine MathAlgebra I Unit Lesson
HSA.SSE.B.3.C Choose and produce an equivalent form of an expression to reveal and explain properties of the quantity represented by the expression.c. Use the properties of exponents to transform expressions forexponential functions. For example the expression 1.15t can berewritten as (1.151/12)12t ≈ 1.01212t to reveal the approximate equivalentmonthly interest rate if the annual rate is 15%.
Interpreting Functions Rewriting and Interpreting Exponential Functions in Terms of Context
Arithmetic with Polynomials & Rational ExpressionsPerform arithmetic operations on polynomials.HSA.APR.A.1 Understand that polynomials form a system analogous to the
integers, namely, they are closed under the operations of addition, subtraction, and multiplication; add, subtract, and multiply polynomials.
Arithmetic with Polynomials and Rational Expressions
Adding and Subtracting PolynomialsMultiplying and Dividing MonomialsMultiplying Polynomials
Creating Equations*Create equations that describe numbers or relationships.HSA.CED.A.1 Create equations and inequalities in one variable and use them to
solve problems. Include equations arising from linear and quadratic functions, and simple rational and exponential functions.
Creating Equations Modeling Exponential Relationships with Equations, Inequalities, and GraphsModeling Quadratic Relationships with Equations, Inequalities, and GraphsWriting and Solving Linear Equations in One VariableWriting Linear Inequalities in One Variable

66
2017–2018 School Year
CCSS CorrelationCreated November 2017
Common Core State Standards Imagine MathAlgebra I Unit Lesson
HSA.CED.A.2 Create equations in two or more variables to represent relationships between quantities; graph equations on coordinate axes with labels and scales.
Building Functions Writing Quadratic Functions From Their Graphs
Creating Equations Equations of Parallel and Perpendicular LinesModeling Exponential Relationships with Equations, Inequalities, and GraphsModeling Quadratic Relationships with Equations, Inequalities, and GraphsWriting and Graphing Linear Equations in Two or More Variables
Interpreting Functions Radical Functions and Their GraphsRational Functions and Their Graphs
HSA.CED.A.3 Represent constraints by equations or inequalities, and by systems of equations and/or inequalities, and interpret solutions as viable or nonviable options in a modeling context. For example, represent inequalities describing nutritional and cost constraints on combinations of different foods.
Creating Equations Writing and Solving Linear Equations in One VariableWriting Linear Inequalities in One Variable
Reasoning with Equations and Inequalities
Graphing Linear Inequalities and Systems of Linear Inequalities in Real-World Situations
HSA.CED.A.4 Rearrange formulas to highlight a quantity of interest, using the same reasoning as in solving equations. For example, rearrange Ohm's law V = IR to highlight resistance R.
Creating Equations Modeling Quadratic Relationships with Equations, Inequalities, and GraphsSolving Literal Equations
Reasoning with Equations & InequalitiesUnderstand solving equations as a process of reasoning and explain the reasoning.HSA.REI.A.1 Explain each step in solving a simple equation as following from the
equality of numbers asserted at the previous step, starting from the assumption that the original equation has a solution. Construct a viable argument to justify a solution method.
Reasoning with Equations and Inequalities
Solving Linear Equations in One Variable as a Reasoning Process

67
2017–2018 School Year
CCSS CorrelationCreated November 2017
Common Core State Standards Imagine MathAlgebra I Unit Lesson
Solve equations and inequalities in one variable.HSA.REI.B.3 Solve linear equations and inequalities in one variable, including
equations with coefficients represented by letters.Reasoning with Equations and Inequalities
Solving Linear Equations in One Variable as a Reasoning ProcessSolving Linear Inequalities in One Variable
HSA.REI.B.4.A Solve quadratic equations in one variable.a. Use the method of completing the square to transform anyquadratic equation in x into an equation of the form (x - p)2 = q thathas the same solutions. Derive the quadratic formula from this form.
Reasoning with Equations and Inequalities
Solving Quadratic Equations with Real and Complex Roots - Completing the SquareSolving Quadratics - Completing the Square
HSA.REI.B.4.B Solve quadratic equations in one variable.b. Solve quadratic equations by inspection (e.g., for x2 = 49),taking square roots, completing the square, the quadratic formulaand factoring, as appropriate to the initial form of the equation.Recognize when the quadratic formula gives complex solutions andwrite them as a ± bi for real numbers a and b.
Reasoning with Equations and Inequalities
Complex Numbers and Complex SolutionsProblem Solving with Quadratic FunctionsSolving Quadratic Equations with Real and Complex Roots - Using the Quadratic FormulaUsing the Quadratic Formula
Solve systems of equations.HSA.REI.C.5 Prove that, given a system of two equations in two variables,
replacing one equation by the sum of that equation and a multiple of the other produces a system with the same solutions.
Reasoning with Equations and Inequalities
Solving Systems of Linear Equations
HSA.REI.C.6 Solve systems of linear equations exactly and approximately (e.g., with graphs), focusing on pairs of linear equations in two variables.
Reasoning with Equations and Inequalities
Solving Systems of Linear Equations
HSA.REI.C.7 Solve a simple system consisting of a linear equation and a quadratic equation in two variables algebraically and graphically. For example, find the points of intersection between the line y = -3x and the circle x2 + y2 = 3.
Reasoning with Equations and Inequalities
Solving a System of Linear and Quadratic Equations

68
2017–2018 School Year
CCSS CorrelationCreated November 2017
Common Core State Standards Imagine MathAlgebra I Unit Lesson
Represent and solve equations and inequalities graphically.
HSA.REI.D.10 Understand that the graph of an equation in two variables is the set of all its solutions plotted in the coordinate plane, often forming a curve (which could be a line).
Interpreting Functions Radical Functions and Their GraphsRational Functions and Their Graphs
Reasoning with Equations and Inequalities
Solving Exponential Equations GraphicallySolving Linear Equations GraphicallySolving Quadratic Equations Graphically
HSA.REI.D.11 Explain why the x-coordinates of the points where the graphs of the equations y = f(x) and y = g(x) intersect are the solutions of the equation f(x) = g(x); find the solutions approximately, e.g., using technology to graph the functions, make tables of values, or find successive approximations. Include cases where f(x) and/or g(x) are linear, polynomial, rational, absolute value, exponential, and logarithmic functions.
Reasoning with Equations and Inequalities
Solving Exponential Equations GraphicallySolving Linear Equations Graphically
HSA.REI.D.12 Graph the solutions to a linear inequality in two variables as a half-plane (excluding the boundary in the case of a strict inequality), and graph the solution set to a system of linear inequalities in two variables as the intersection of the corresponding half-planes.
Reasoning with Equations and Inequalities
Graphing Linear Inequalities and Systems of Linear Inequalities in Real-World Situations
Interpreting FunctionsUnderstand the concept of a function and use function notation. HSF.IF.A.1 Understand that a function from one set (called the domain) to
another set (called the range) assigns to each element of the domain exactly one element of the range. If f is a function and x is an element of its domain, then f(x) denotes the output of f corresponding to the input x. The graph of f is the graph of the equation y = f(x).
Interpreting Functions Function Notation IFunction Notation II
HSF.IF.A.2 Use function notation, evaluate functions for inputs in their domains, and interpret statements that use function notation in terms of a context.
Interpreting Functions Function Notation IFunction Notation II

69
2017–2018 School Year
CCSS CorrelationCreated November 2017
Common Core State Standards Imagine MathAlgebra I Unit Lesson
HSF.IF.A.3 Recognize that sequences are functions, sometimes defined recursively, whose domain is a subset of the integers. For example, the Fibonacci sequence is defined recursively by f(0) = f(1) = 1, f(n+1) = f(n) + f(n-1) for n ≥ 1.
Building Functions Geometric Sequences - Closed Form (Extra Practice)Geometric Sequences - Recursive Form (Extra Practice)
Interpreting Functions Sequences as Functions
Interpret functions that arise in applications in terms of the context.HSF.IF.B.4 For a function that models a relationship between two quantities,
interpret key features of graphs and tables in terms of the quantities, and sketch graphs showing key features given a verbal description of the relationship. Key features include: intercepts; intervals where the function is increasing, decreasing, positive, or negative; relative maximums and minimums; symmetries; end behavior; and periodicity.
Interpreting Functions Interpreting Graphs of Linear and Exponential Functions in ContextSketching Graphs of Linear and Exponential Functions from a ContextSketching Graphs of Quadratic Functions in Context
HSF.IF.B.5 Relate the domain of a function to its graph and, where applicable, to the quantitative relationship it describes. For example, if the function h(n) gives the number of person-hours it takes to assemble n engines in a factory, then the positive integers would be an appropriate domain for the function.
Interpreting Functions Sketching Graphs of Quadratic Functions in ContextUnderstanding the Domain of a Function
HSF.IF.B.6 Calculate and interpret the average rate of change of a function (presented symbolically or as a table) over a specified interval. Estimate the rate of change from a graph.
Interpreting Functions Rate of Change for Linear and Exponential FunctionsSketching Graphs of Quadratic Functions in Context
Analyze functions using different representations.HSF.IF.C.7.A Graph functions expressed symbolically and show key features of
the graph, by hand in simple cases and using technology for more complicated cases.a. Graph linear and quadratic functions and show intercepts,maxima, and minima.
Interpreting Functions Sketching and Transforming Graphs of Quadratic Functions from Symbolic RepresentationsSketching Graphs of Linear Functions from Symbolic Representations

70
2017–2018 School Year
CCSS CorrelationCreated November 2017
Common Core State Standards Imagine MathAlgebra I Unit Lesson
HSF.IF.C.7.B Graph functions expressed symbolically and show key features of the graph, by hand in simple cases and using technology for more complicated cases.b. Graph square root, cube root, and piecewise-defined functions, including step functions and absolute value functions.
Interpreting Functions Piecewise, Step, and Absolute Value FunctionsRadical Functions and Their Graphs
HSF.IF.C.7.E Graph functions expressed symbolically and show key features of the graph, by hand in simple cases and using technology for more complicated cases. e. Graph exponential and logarithmic functions, showing intercepts and end behavior, and trigonometric functions, showing period, midline, and amplitude.
Interpreting Functions Introduction to LogarithmsLogarithmic FunctionsSketching Graphs of Exponential Functions from Symbolic Representations
HSF.IF.C.8.A Write a function defined by an expression in different but equivalent forms to reveal and explain different properties of the function.a. Use the process of factoring and completing the square in a quadratic function to show zeros, extreme values, and symmetry of the graph, and interpret these in terms of a context.
Interpreting Functions Rewriting Quadratics to Reveal Their Structure
Seeing Structure in Expressions Factoring PolynomialsHSF.IF.C.8.B Write a function defined by an expression in different but equivalent
forms to reveal and explain different properties of the function.b. Use the properties of exponents to interpret expressions for exponential functions. For example, identify percent rate of change in functions such as y = (1.02)t, y = (0.97)t, y = (1.01)12t, y = (1.2)t/10, and classify them as representing exponential growth or decay.
Interpreting Functions Rewriting and Interpreting Exponential Functions in Terms of Context
HSF.IF.C.9 Compare properties of two functions each represented in a different way (algebraically, graphically, numerically in tables, or by verbal descriptions). For example, given a graph of one quadratic function and an algebraic expression for another, say which has the larger maximum.
Interpreting Functions Comparing Functions Using Different RepresentationsComparing Functions Using Different Representations II

71
2017–2018 School Year
CCSS CorrelationCreated November 2017
Common Core State Standards Imagine MathAlgebra I Unit Lesson
Building FunctionsBuild a function that models a relationship between two quantities.HSF.BF.A.1.A Write a function that describes a relationship between two
quantities.a. Determine an explicit expression, a recursive process, or steps forcalculation from a context.
Building Functions Geometric Sequences - Closed Form (Extra Practice)Geometric Sequences - Recursive Form (Extra Practice)Writing Linear and Exponential Functions from a ContextWriting Quadratic Functions from a Context
HSF.BF.A.1.B Write a function that describes a relationship between two quantities.b. Combine standard function types using arithmetic operations.For example, build a function that models the temperature of a coolingbody by adding a constant function to a decaying exponential, andrelate these functions to the model.
Building Functions Composite FunctionsWriting Quadratic Functions from a Context
HSF.BF.A.2 Write arithmetic and geometric sequences both recursively and with an explicit formula, use them to model situations, and translate between the two forms.
Building Functions Geometric Sequences - Closed Form (Extra Practice)Geometric Sequences - Recursive Form (Extra Practice)Writing Arithmetic Sequences Explicitly and RecursivelyWriting Geometric Sequences RecursivelyWriting Geometric Sequences Using an Explicit Formula

72
2017–2018 School Year
CCSS CorrelationCreated November 2017
Common Core State Standards Imagine MathAlgebra I Unit Lesson
Build new functions from existing functions.HSF.BF.B.3 Identify the effect on the graph of replacing f(x) by f(x) + k, k
f(x), f(kx), and f(x + k) for specific values of k (both positive and negative); find the value of k given the graphs. Experiment with cases and illustrate an explanation of the effects on the graph using technology. Include recognizing even and odd functions from their graphs and algebraic expressions for them.
Building Functions Direct VariationTransformations of Graphs of Linear and Exponential Functions
Interpreting Functions Sketching and Transforming Graphs of Quadratic Functions from Symbolic Representations
HSF.BF.B.4.A Find inverse functions.a. Solve an equation of the form f(x) = c for a simple function f that has an inverse and write an expression for the inverse. For example, f(x) =2 x3 or f(x) = (x+1)/(x-1) for x ≠ 1.
Building Functions Writing Inverse Functions
Linear, Quadratic, & Exponential Models*Construct and compare linear, quadratic, and exponential models and solve problems.HSF.LE.A.1.A Distinguish between situations that can be modeled with linear
functions and with exponential functions.a. Prove that linear functions grow by equal differences over equal intervals, and that exponential functions grow by equal factors over equal intervals.
Linear, Quadratic, and Exponential Models
Distinguishing Between Linear and Exponential Relationships
HSF.LE.A.1.B Distinguish between situations that can be modeled with linear functions and with exponential functions.b. Recognize situations in which one quantity changes at a constant rate per unit interval relative to another.
Linear, Quadratic, and Exponential Models
Distinguishing Between Linear and Exponential Relationships
HSF.LE.A.1.C Distinguish between situations that can be modeled with linear functions and with exponential functions.c. Recognize situations in which a quantity grows or decays by a constant percent rate per unit interval relative to another.
Linear, Quadratic, and Exponential Models
Distinguishing Between Linear and Exponential Relationships

73
2017–2018 School Year
CCSS CorrelationCreated November 2017
Common Core State Standards Imagine MathAlgebra I Unit Lesson
HSF.LE.A.2 Construct linear and exponential functions, including arithmetic and geometric sequences, given a graph, a description of a relationship, or two input-output pairs (include reading these from a table).
Linear, Quadratic, and Exponential Models
Writing Linear and Exponential Functions Based on Different Representations
HSF.LE.A.3 Observe using graphs and tables that a quantity increasing exponentially eventually exceeds a quantity increasing linearly, quadratically, or (more generally) as a polynomial function.
Linear, Quadratic, and Exponential Models
Introduction to Nonlinear Models
Interpret expressions for functions in terms of the situation they model.HSF.LE.B.5 Interpret the parameters in a linear or exponential function in terms
of a context.Building Functions Direct VariationInterpreting Functions Introduction to Logarithms
Logarithmic FunctionsRewriting and Interpreting Exponential Functions in Terms of Context
Interpreting Categorical & Quantitative DataSummarize, represent, and interpret data on a single count or measurement variableHSS.ID.A.1 Represent data with plots on the real number line (dot plots,
histograms, and box plots).Interpreting Categorical and Quantitative Data
Data Displays on the Real Number Line
HSS.ID.A.2 Use statistics appropriate to the shape of the data distribution to compare center (median, mean) and spread (interquartile range, standard deviation) of two or more different data sets.
Interpreting Categorical and Quantitative Data
Comparing the Shape, Center, and Spread of Data Sets
Statistics and Probability SamplingHSS.ID.A.3 Interpret differences in shape, center, and spread in the context of
the data sets, accounting for possible effects of extreme data points (outliers).
Interpreting Categorical and Quantitative Data
Comparing the Shape, Center, and Spread of Data Sets
Statistics and Probability Measures of Center - MeanMeasures of Center - Median

74
2017–2018 School Year
CCSS CorrelationCreated November 2017
Common Core State Standards Imagine MathAlgebra I Unit Lesson
Summarize, represent, and interpret data on two categorical and quantitative variables HSS.ID.B.5 Summarize categorical data for two categories in two-way frequency
tables. Interpret relative frequencies in the context of the data (including joint, marginal, and conditional relative frequencies). Recognize possible associations and trends in the data.
Interpreting Categorical and Quantitative Data
Summarizing and Interpreting Categorical Data
HSS.ID.B.6.A Represent data on two quantitative variables on a scatter plot, and describe how the variables are related.a. Fit a function to the data; use functions fitted to data to solve problems in the context of the data. Use given functions or choose a function suggested by the context. Emphasize linear, quadratic, and exponential models.
Interpreting Categorical and Quantitative Data
Fitting Functions to Data
HSS.ID.B.6.B Represent data on two quantitative variables on a scatter plot, and describe how the variables are related.b. Informally assess the fit of a function by plotting and analyzing residuals.
Interpreting Categorical and Quantitative Data
Fitting Functions to Data
HSS.ID.B.6.C Represent data on two quantitative variables on a scatter plot, and describe how the variables are related.c. Fit a linear function for a scatter plot that suggests a linear association.
Interpreting Categorical and Quantitative Data
Fitting Functions to Data
Interpret linear modelsHSS.ID.C.7 Interpret the slope (rate of change) and the intercept (constant term)
of a linear model in the context of the data.Interpreting Categorical and Quantitative Data
Correlation
HSS.ID.C.8 Compute (using technology) and interpret the correlation coefficient of a linear fit.
This standard is not addressed. This standard is not addressed.
HSS.ID.C.9 Distinguish between correlation and causation. Interpreting Categorical and Quantitative Data
Correlation

GeometryCommon Core State Standards Mathematics

76
2017–2018 School Year
CCSS CorrelationCreated November 2017
Common Core State Standards Imagine MathGeometry Unit Lesson
CongruenceExperiment with transformations in the planeHSG.CO.A.1 Know precise definitions of angle, circle, perpendicular line, parallel
line, and line segment, based on the undefined notions of point, line, distance along a line, and distance around a circular arc.
Congruence Defining Basic Geometric Elements
HSG.CO.A.2 Represent transformations in the plane using, e.g., transparencies and geometry software; describe transformations as functions that take points in the plane as inputs and give other points as outputs. Compare transformations that preserve distance and angle to those that do not (e.g., translation versus horizontal stretch).
Congruence Representing Transformations with Algebra
HSG.CO.A.3 Given a rectangle, parallelogram, trapezoid, or regular polygon, describe the rotations and reflections that carry it onto itself.
Congruence Rotational and Reflectional Symmetry
HSG.CO.A.4 Develop definitions of rotations, reflections, and translations in terms of angles, circles, perpendicular lines, parallel lines, and line segments.
Congruence Defining Transformations
HSG.CO.A.5 Given a geometric figure and a rotation, reflection, or translation, draw the transformed figure using, e.g., graph paper, tracing paper, or geometry software. Specify a sequence of transformations that will carry a given figure onto another.
Congruence Rigid Motion and Congruence
Understand congruence in terms of rigid motionsHSG.CO.B.6 Use geometric descriptions of rigid motions to transform figures
and to predict the effect of a given rigid motion on a given figure; given two figures, use the definition of congruence in terms of rigid motions to decide if they are congruent.
Congruence Rigid Motion and Congruence
HSG.CO.B.7 Use the definition of congruence in terms of rigid motions to show that two triangles are congruent if and only if corresponding pairs of sides and corresponding pairs of angles are congruent.
Congruence What Is Proof?

77
2017–2018 School Year
CCSS CorrelationCreated November 2017
Common Core State Standards Imagine MathGeometry Unit Lesson
HSG.CO.B.8 Explain how the criteria for triangle congruence (ASA, SAS, and SSS) follow from the definition of congruence in terms of rigid motions.
Congruence Proving Theorems About Congruent Triangles
Prove geometric theoremsHSG.CO.C.9 Prove theorems about lines and angles. Theorems include: vertical
angles are congruent; when a transversal crosses parallel lines, alternate interior angles are congruent and corresponding angles are congruent; points on a perpendicular bisector of a line segment are exactly those equidistant from the segment's endpoints.
Congruence Proving Theorems About Lines and AnglesWhat Is Proof?
HSG.CO.C.10 Prove theorems about triangles. Theorems include: measures of interior angles of a triangle sum to 180°; base angles of isosceles triangles are congruent; the segment joining midpoints of two sides of a triangle is parallel to the third side and half the length; the medians of a triangle meet at a point.
Congruence Proving Theorems About Congruent TrianglesProving Theorems About Relationships in Triangles
Similarity, Right Triangles, and Trigonometry
Problem Solving with Congruent Triangles
HSG.CO.C.11 Prove theorems about parallelograms. Theorems include: opposite sides are congruent, opposite angles are congruent, the diagonals of a parallelogram bisect each other, and conversely, rectangles are parallelograms with congruent diagonals.
Congruence Proving Theorems About Parallelograms
Make geometric constructionsHSG.CO.D.12 Make formal geometric constructions with a variety of tools and
methods (compass and straightedge, string, reflective devices, paper folding, dynamic geometric software, etc.). Copying a segment; copying an angle; bisecting a segment; bisecting an angle; constructing perpendicular lines, including the perpendicular bisector of a line segment; and constructing a line parallel to a given line through a point not on the line.
Congruence Constructing Angles and Special Line Segments
HSG.CO.D.13 Construct an equilateral triangle, a square, and a regular hexagon inscribed in a circle.
Congruence Constructing Inscribed Figures

78
2017–2018 School Year
CCSS CorrelationCreated November 2017
Common Core State Standards Imagine MathGeometry Unit Lesson
Similarity, Right Triangles, & TrigonometryUnderstand similarity in terms of similarity transformationsHSG.SRT.A.1.A Verify experimentally the properties of dilations given by a center
and a scale factor:a. A dilation takes a line not passing through the center of thedilation to a parallel line, and leaves a line passing through the centerunchanged.
Similarity, Right Triangles, and Trigonometry
Properties of Dilations II
HSG.SRT.A.1.B Verify experimentally the properties of dilations given by a center and a scale factor:b. The dilation of a line segment is longer or shorter in the ratio givenby the scale factor.
Similarity, Right Triangles, and Trigonometry
Properties of Dilations I
HSG.SRT.A.2 Given two figures, use the definition of similarity in terms of similarity transformations to decide if they are similar; explain using similarity transformations the meaning of similarity for triangles as the equality of all corresponding pairs of angles and the proportionality of all corresponding pairs of sides.
Similarity, Right Triangles, and Trigonometry
Transformations and Similarity
HSG.SRT.A.3 Use the properties of similarity transformations to establish the AA criterion for two triangles to be similar.
Similarity, Right Triangles, and Trigonometry
Transformations and Similarity
Prove theorems involving similarityHSG.SRT.B.4 Prove theorems about triangles. Theorems include: a line parallel
to one side of a triangle divides the other two proportionally, and conversely; the Pythagorean Theorem proved using triangle similarity.
Similarity, Right Triangles, and Trigonometry
Proving Theorems About Similar Triangles
HSG.SRT.B.5 Use congruence and similarity criteria for triangles to solve problems and to prove relationships in geometric figures.
Similarity, Right Triangles, and Trigonometry
Problem Solving with Congruent TrianglesProblem Solving with Transformations and Similarity

79
2017–2018 School Year
CCSS CorrelationCreated November 2017
Common Core State Standards Imagine MathGeometry Unit Lesson
Define trigonometric ratios and solve problems involving right triangles HSG.SRT.C.6 Understand that by similarity, side ratios in right triangles are
properties of the angles in the triangle, leading to definitions of trigonometric ratios for acute angles.
Similarity, Right Triangles, and Trigonometry
Similarity and Trigonometric Ratios
HSG.SRT.C.7 Explain and use the relationship between the sine and cosine of complementary angles.
Similarity, Right Triangles, and Trigonometry
Sine and Cosine of Complementary Angles
HSG.SRT.C.8 Use trigonometric ratios and the Pythagorean Theorem to solve right triangles in applied problems.
Geometry Pythagorean Theorem - HypotenusePythagorean Theorem - LegsPythagorean Theorem - Mixed Problems
Similarity, Right Triangles, and Trigonometry
Problem Solving with Similarity and Trigonometric Ratios
Apply trigonometry to general trianglesHSG.SRT.D.9 Derive the formula A = 1/2 ab sin(C) for the area of a triangle by
drawing an auxiliary line from a vertex perpendicular to the opposite side.
This standard is not addressed. This standard is not addressed.
HSG.SRT.D.10 Prove the Laws of Sines and Cosines and use them to solve problems. This standard is not addressed. This standard is not addressed.HSG.SRT.D.11 Understand and apply the Law of Sines and the Law of Cosines to
find unknown measurements in right and non-right triangles (e.g., surveying problems, resultant forces).
Similarity, Right Triangles, and Trigonometry
Law of Sines and Law of Cosine
CirclesUnderstand and apply theorems about circlesHSG.C.A.1 Prove that all circles are similar. Expressing Geometric Properties with
EquationsEquation of a Circle

80
2017–2018 School Year
CCSS CorrelationCreated November 2017
Common Core State Standards Imagine MathGeometry Unit Lesson
HSG.C.A.2 Identify and describe relationships among inscribed angles, radii, and chords. Include the relationship between central, inscribed, and circumscribed angles; inscribed angles on a diameter are right angles; the radius of a circle is perpendicular to the tangent where the radius intersects the circle.
Circles Tangents, Chords, Radii, and Angles in Circles
HSG.C.A.3 Construct the inscribed and circumscribed circles of a triangle, and prove properties of angles for a quadrilateral inscribed in a circle.
Circles Quadrilaterals Inscribed in Circles
HSG.C.A.4 Construct a tangent line from a point outside a given circle to the circle.
Circles Tangents, Chords, Radii, and Angles in Circles
Find arc lengths and areas of sectors of circlesHSG.C.B.5 Derive using similarity the fact that the length of the arc intercepted
by an angle is proportional to the radius, and define the radian measure of the angle as the constant of proportionality; derive the formula for the area of a sector.
Circles Radians and Area of Sectors
Expressing Geometric Properties with EquationsTranslate between the geometric description and the equation for a conic sectionHSG.GPE.A.1 Derive the equation of a circle of given center and radius using the
Pythagorean Theorem; complete the square to find the center and radius of a circle given by an equation.
Expressing Geometric Properties with Equations
Equation of a CircleProblem Solving with the Equation of a Circle
HSG.GPE.A.2 Derive the equation of a parabola given a focus and directrix. Expressing Geometric Properties with Equations
Deriving the Equation of a Parabola from Its Definition
Use coordinates to prove simple geometric theorems algebraicallyHSG.GPE.B.4 Use coordinates to prove simple geometric theorems algebraically.
For example, prove or disprove that a figure defined by four given points in the coordinate plane is a rectangle; prove or disprove that the point (1, √3) lies on the circle centered at the origin and containing the point (0, 2).
Expressing Geometric Properties with Equations
Coordinates of Parallel and Perpendicular LinesProblem Solving with Coordinates of Parallel and Perpendicular LinesProblem Solving with the Equation of a Circle

81
2017–2018 School Year
CCSS CorrelationCreated November 2017
Common Core State Standards Imagine MathGeometry Unit Lesson
HSG.GPE.B.5 Prove the slope criteria for parallel and perpendicular lines and use them to solve geometric problems (e.g., find the equation of a line parallel or perpendicular to a given line that passes through a given point).
Expressing Geometric Properties with Equations
Coordinates of Parallel and Perpendicular Lines
HSG.GPE.B.6 Find the point on a directed line segment between two given points that partitions the segment in a given ratio.
Expressing Geometric Properties with Equations
Dividing a Segment Proportionally
HSG.GPE.B.7 Use coordinates to compute perimeters of polygons and areas of triangles and rectangles, e.g., using the distance formula.
Expressing Geometric Properties with Equations
Using Coordinates to Find Perimeters and Areas
Geometric Measurement & DimensionExplain volume formulas and use them to solve problemsHSG.GMD.A.1 Give an informal argument for the formulas for the circumference
of a circle, area of a circle, volume of a cylinder, pyramid, and cone. Use dissection arguments, Cavalieri's principle, and informal limit arguments.
Geometric Measurement and Dimension
Understanding Formulas for Curved Figures
HSG.GMD.A.3 Use volume formulas for cylinders, pyramids, cones, and spheres to solve problems.
Geometry Volume of CylindersVolume of Pyramids and ConesVolume of Spheres
Visualize relationships between two-dimensional and three-dimensional objects
HSG.GMD.B.4 Identify the shapes of two-dimensional cross-sections of three-dimensional objects, and identify three-dimensional objects generated by rotations of two-dimensional objects.
Geometric Measurement and Dimension
Cross Sections of 3-Dimensional Figures
Modeling with GeometryApply geometric concepts in modeling situationsHSG.MG.A.1 Use geometric shapes, their measures, and their properties to
describe objects (e.g., modeling a tree trunk or a human torso as a cylinder).
Modeling with Geometry Modeling Objects with Geometric Figures

82
2017–2018 School Year
CCSS CorrelationCreated November 2017
Common Core State Standards Imagine MathGeometry Unit Lesson
HSG.MG.A.2 Apply concepts of density based on area and volume in modeling situations (e.g., persons per square mile, BTUs per cubic foot).
Modeling with Geometry Rates with Area and Volume
HSG.MG.A.3 Apply geometric methods to solve design problems (e.g., designing an object or structure to satisfy physical constraints or minimize cost; working with typographic grid systems based on ratios).
Modeling with Geometry Using Geometric Relationships to Solve Design Problems
Conditional Probability & the Rules of ProbabilityUnderstand independence and conditional probability and use them to interpret dataHSS.CP.A.1 Describe events as subsets of a sample space (the set of outcomes)
using characteristics (or categories) of the outcomes, or as unions, intersections, or complements of other events (“or,” “and,” “not”).
Conditional Probability and the Rules of Probability
Organizing Possible Outcomes of Events
HSS.CP.A.2 Understand that two events A and B are independent if the probability of A and B occurring together is the product of their probabilities, and use this characterization to determine if they are independent.
Conditional Probability and the Rules of Probability
Understanding Independent and Dependent Events
HSS.CP.A.3 Understand the conditional probability of A given B as P(A and B)/P(B), and interpret independence of A and B as saying that the conditional probability of A given B is the same as the probability of A, and the conditional probability of B given A is the same as the probability of B.
Conditional Probability and the Rules of Probability
Understanding Conditional Probability
HSS.CP.A.4 Construct and interpret two-way frequency tables of data when two categories are associated with each object being classified. Use the two-way table as a sample space to decide if events are independent and to approximate conditional probabilities. For example, collect data from a random sample of students in your school on their favorite subject among math, science, and English. Estimate the probability that a randomly selected student from your school will favor science given that the student is in tenth grade. Do the same for other subjects and compare the results.
Conditional Probability and the Rules of Probability
Modeling Probability Situations Using Two-Way Frequency Tables

83
2017–2018 School Year
CCSS CorrelationCreated November 2017
Common Core State Standards Imagine MathGeometry Unit Lesson
HSS.CP.A.5 Recognize and explain the concepts of conditional probability and independence in everyday language and everyday situations. For example, compare the chance of having lung cancer if you are a smoker with the chance of being a smoker if you have lung cancer.
Conditional Probability and the Rules of Probability
Using Area Models for Compound Probability
Use the rules of probability to compute probabilities of compound events.HSS.CP.B.6 Find the conditional probability of A given B as the fraction of B's
outcomes that also belong to A, and interpret the answer in terms of the model.
Conditional Probability and the Rules of Probability
Modeling Probability Situations Using Two-Way Frequency TablesUnderstanding Conditional Probability
HSS.CP.B.7 Apply the Addition Rule, P(A or B) = P(A) + P(B) - P(A and B), and interpret the answer in terms of the model.
Conditional Probability and the Rules of Probability
Relating Probabilities of Unions and Intersections of Events
HSS.CP.B.8 Apply the general Multiplication Rule in a uniform probability model, P(A and B) = P(A)P(B|A) = P(B)P(A|B), and interpret the answer in terms of the model.
This standard is not addressed. This standard is not addressed.
HSS.CP.B.9 Use permutations and combinations to compute probabilities of compound events and solve problems.
Conditional Probability and the Rules of Probability
Using Area Models for Compound Probability
Using Probability to Make DecisionsUse probability to evaluate outcomes of decisionsHSS.MD.B.6 Use probabilities to make fair decisions (e.g., drawing by lots, using a
random number generator).This standard is not addressed. This standard is not addressed.
HSS.MD.B.7 Analyze decisions and strategies using probability concepts (e.g., product testing, medical testing, pulling a hockey goalie at the end of a game).
This standard is not addressed. This standard is not addressed.

Math ICommon Core State Standards Mathematics

85
2017–2018 School Year
CCSS CorrelationCreated November 2017
Common Core State Standards Imagine MathMath I Unit Lesson
Quantities*Reason quantitatively and use units to solve problems.HSN.Q.A.1 Use units as a way to understand problems and to guide the solution
of multi-step problems; choose and interpret units consistently in formulas; choose and interpret the scale and the origin in graphs and data displays.
Quantities Using Units to Solve ProblemsStatistics and Probability Standard Deviation
HSN.Q.A.2 Define appropriate quantities for the purpose of descriptive modeling.
This standard is not addressed. This standard is not addressed.
HSN.Q.A.3 Choose a level of accuracy appropriate to limitations on measurement when reporting quantities.
Quantities Using Units to Solve Problems
Seeing Structure in ExpressionsInterpret the structure of expressions.HSA.SSE.A.1.A Interpret expressions that represent a quantity in terms of its context.
a. Interpret parts of an expression, such as terms, factors, and coefficients.
Seeing Structure in Expressions Interpreting the Structure of Linear and Exponential ExpressionsInterpreting the Structure of Quadratic Expressions and Expressions with Rational Exponents
HSA.SSE.A.1.B Interpret expressions that represent a quantity in terms of its context.b. Interpret complicated expressions by viewing one or more of their parts as a single entity. For example, interpret P(1+r)n as the product of P and a factor not depending on P.
Seeing Structure in Expressions Interpreting the Structure of Linear and Exponential ExpressionsInterpreting the Structure of Quadratic Expressions and Expressions with Rational Exponents

86
2017–2018 School Year
CCSS CorrelationCreated November 2017
Common Core State Standards Imagine MathMath I Unit Lesson
Creating Equations*Create equations that describe numbers or relationships.HSA.CED.A.1 Create equations and inequalities in one variable and use them to
solve problems. Include equations arising from linear and quadratic functions, and simple rational and exponential functions.
Creating Equations Modeling Exponential Relationships with Equations, Inequalities, and GraphsModeling Quadratic Relationships with Equations, Inequalities, and GraphsWriting and Solving Linear Equations in One VariableWriting Linear Inequalities in One Variable
HSA.CED.A.2 Create equations in two or more variables to represent relationships between quantities; graph equations on coordinate axes with labels and scales.
Building Functions Writing Quadratic Functions From Their Graphs
Creating Equations Equations of Parallel and Perpendicular LinesModeling Exponential Relationships with Equations, Inequalities, and GraphsModeling Quadratic Relationships with Equations, Inequalities, and GraphsWriting and Graphing Linear Equations in Two or More Variables
Interpreting Functions Radical Functions and Their GraphsRational Functions and Their Graphs
HSA.CED.A.3 Represent constraints by equations or inequalities, and by systems of equations and/or inequalities, and interpret solutions as viable or nonviable options in a modeling context. For example, represent inequalities describing nutritional and cost constraints on combinations of different foods.
Creating Equations Writing and Solving Linear Equations in One VariableWriting Linear Inequalities in One Variable
Reasoning with Equations and Inequalities
Graphing Linear Inequalities and Systems of Linear Inequalities in Real-World Situations

87
2017–2018 School Year
CCSS CorrelationCreated November 2017
Common Core State Standards Imagine MathMath I Unit Lesson
HSA.CED.A.4 Rearrange formulas to highlight a quantity of interest, using the same reasoning as in solving equations. For example, rearrange Ohm's law V = IR to highlight resistance R.
Creating Equations Modeling Quadratic Relationships with Equations, Inequalities, and GraphsSolving Literal Equations
Reasoning with Equations & InequalitiesUnderstand solving equations as a process of reasoning and explain the reasoning.HSA.REI.A.1 Explain each step in solving a simple equation as following from the
equality of numbers asserted at the previous step, starting from the assumption that the original equation has a solution. Construct a viable argument to justify a solution method.
Reasoning with Equations and Inequalities
Solving Linear Equations in One Variable as a Reasoning Process
Solve equations and inequalities in one variable.HSA.REI.B.3 Solve linear equations and inequalities in one variable, including
equations with coefficients represented by letters.Reasoning with Equations and Inequalities
Solving Linear Equations in One Variable as a Reasoning ProcessSolving Linear Inequalities in One Variable
Solve systems of equations.HSA.REI.C.5 Prove that, given a system of two equations in two variables,
replacing one equation by the sum of that equation and a multiple of the other produces a system with the same solutions.
Reasoning with Equations and Inequalities
Solving Systems of Linear Equations
HSA.REI.C.6 Solve systems of linear equations exactly and approximately (e.g., with graphs), focusing on pairs of linear equations in two variables.
Reasoning with Equations and Inequalities
Solving Systems of Linear Equations
Represent and solve equations and inequalities graphically.
HSA.REI.D.10 Understand that the graph of an equation in two variables is the set of all its solutions plotted in the coordinate plane, often forming a curve (which could be a line).
Interpreting Functions Radical Functions and Their GraphsRational Functions and Their Graphs
Reasoning with Equations and Inequalities
Solving Exponential Equations GraphicallySolving Linear Equations GraphicallySolving Quadratic Equations Graphically

88
2017–2018 School Year
CCSS CorrelationCreated November 2017
Common Core State Standards Imagine MathMath I Unit Lesson
HSA.REI.D.11 Explain why the x-coordinates of the points where the graphs of the equations y = f(x) and y = g(x) intersect are the solutions of the equation f(x) = g(x); find the solutions approximately, e.g., using technology to graph the functions, make tables of values, or find successive approximations. Include cases where f(x) and/or g(x) are linear, polynomial, rational, absolute value, exponential, and logarithmic functions.
Reasoning with Equations and Inequalities
Solving Exponential Equations GraphicallySolving Linear Equations Graphically
HSA.REI.D.12 Graph the solutions to a linear inequality in two variables as a half-plane (excluding the boundary in the case of a strict inequality), and graph the solution set to a system of linear inequalities in two variables as the intersection of the corresponding half-planes.
Reasoning with Equations and Inequalities
Graphing Linear Inequalities and Systems of Linear Inequalities in Real-World Situations
Interpreting FunctionsUnderstand the concept of a function and use function notation. HSF.IF.A.1 Understand that a function from one set (called the domain) to
another set (called the range) assigns to each element of the domain exactly one element of the range. If f is a function and x is an element of its domain, then f(x) denotes the output of f corresponding to the input x. The graph of f is the graph of the equation y = f(x).
Interpreting Functions Function Notation IFunction Notation II
HSF.IF.A.2 Use function notation, evaluate functions for inputs in their domains, and interpret statements that use function notation in terms of a context.
Interpreting Functions Function Notation IFunction Notation II
HSF.IF.A.3 Recognize that sequences are functions, sometimes defined recursively, whose domain is a subset of the integers. For example, the Fibonacci sequence is defined recursively by f(0) = f(1) = 1, f(n+1) = f(n) + f(n-1) for n ≥ 1.
Building Functions Geometric Sequences - Closed Form (Extra Practice)Geometric Sequences - Recursive Form (Extra Practice)
Interpreting Functions Sequences as Functions

89
2017–2018 School Year
CCSS CorrelationCreated November 2017
Common Core State Standards Imagine MathMath I Unit Lesson
Interpret functions that arise in applications in terms of the context.HSF.IF.B.4 For a function that models a relationship between two quantities,
interpret key features of graphs and tables in terms of the quantities, and sketch graphs showing key features given a verbal description of the relationship. Key features include: intercepts; intervals where the function is increasing, decreasing, positive, or negative; relative maximums and minimums; symmetries; end behavior; and periodicity.
Interpreting Functions Interpreting Graphs of Linear and Exponential Functions in ContextSketching Graphs of Linear and Exponential Functions from a ContextSketching Graphs of Quadratic Functions in Context
HSF.IF.B.5 Relate the domain of a function to its graph and, where applicable, to the quantitative relationship it describes. For example, if the function h(n) gives the number of person-hours it takes to assemble n engines in a factory, then the positive integers would be an appropriate domain for the function.
Interpreting Functions Sketching Graphs of Quadratic Functions in ContextUnderstanding the Domain of a Function
HSF.IF.B.6 Calculate and interpret the average rate of change of a function (presented symbolically or as a table) over a specified interval. Estimate the rate of change from a graph.
Interpreting Functions Rate of Change for Linear and Exponential FunctionsSketching Graphs of Quadratic Functions in Context
Analyze functions using different representations.HSF.IF.C.7.A Graph functions expressed symbolically and show key features of
the graph, by hand in simple cases and using technology for more complicated cases.a. Graph linear and quadratic functions and show intercepts, maxima, and minima.
Interpreting Functions Sketching and Transforming Graphs of Quadratic Functions from Symbolic RepresentationsSketching Graphs of Linear Functions from Symbolic Representations
HSF.IF.C.7.E Graph functions expressed symbolically and show key features of the graph, by hand in simple cases and using technology for more complicated cases. e. Graph exponential and logarithmic functions, showing intercepts and end behavior, and trigonometric functions, showing period, midline, and amplitude.
Interpreting Functions Introduction to LogarithmsLogarithmic FunctionsSketching Graphs of Exponential Functions from Symbolic Representations

90
2017–2018 School Year
CCSS CorrelationCreated November 2017
Common Core State Standards Imagine MathMath I Unit Lesson
HSF.IF.C.9 Compare properties of two functions each represented in a different way (algebraically, graphically, numerically in tables, or by verbal descriptions). For example, given a graph of one quadratic function and an algebraic expression for another, say which has the larger maximum.
Interpreting Functions Comparing Functions Using Different RepresentationsComparing Functions Using Different Representations II
Building FunctionsBuild a function that models a relationship between two quantities.HSF.BF.A.1.A Write a function that describes a relationship between two
quantities.a. Determine an explicit expression, a recursive process, or steps for calculation from a context.
Building Functions Geometric Sequences - Closed Form (Extra Practice)Geometric Sequences - Recursive Form (Extra Practice)Writing Linear and Exponential Functions from a ContextWriting Quadratic Functions from a Context
HSF.BF.A.1.B Write a function that describes a relationship between two quantities.b. Combine standard function types using arithmetic operations. For example, build a function that models the temperature of a cooling body by adding a constant function to a decaying exponential, and relate these functions to the model.
Building Functions Composite FunctionsWriting Quadratic Functions from a Context

91
2017–2018 School Year
CCSS CorrelationCreated November 2017
Common Core State Standards Imagine MathMath I Unit Lesson
HSF.BF.A.2 Write arithmetic and geometric sequences both recursively and with an explicit formula, use them to model situations, and translate between the two forms.
Building Functions Geometric Sequences - Closed Form (Extra Practice)Geometric Sequences - Recursive Form (Extra Practice)Writing Arithmetic Sequences Explicitly and RecursivelyWriting Geometric Sequences RecursivelyWriting Geometric Sequences Using an Explicit Formula
Build new functions from existing functions.HSF.BF.B.3 Identify the effect on the graph of replacing f(x) by f(x) + k, k
f(x), f(kx), and f(x + k) for specific values of k (both positive and negative); find the value of k given the graphs. Experiment with cases and illustrate an explanation of the effects on the graph using technology. Include recognizing even and odd functions from their graphs and algebraic expressions for them.
Building Functions Direct VariationTransformations of Graphs of Linear and Exponential Functions
Interpreting Functions Sketching and Transforming Graphs of Quadratic Functions from Symbolic Representations
Linear, Quadratic, & Exponential Models*Construct and compare linear, quadratic, and exponential models and solve problems.HSF.LE.A.1.A Distinguish between situations that can be modeled with linear
functions and with exponential functions.a. Prove that linear functions grow by equal differences over equalintervals, and that exponential functions grow by equal factors overequal intervals.
Linear, Quadratic, and Exponential Models
Distinguishing Between Linear and Exponential Relationships
HSF.LE.A.1.B Distinguish between situations that can be modeled with linear functions and with exponential functions.b. Recognize situations in which one quantity changes at a constantrate per unit interval relative to another.
Linear, Quadratic, and Exponential Models
Distinguishing Between Linear and Exponential Relationships

92
2017–2018 School Year
CCSS CorrelationCreated November 2017
Common Core State Standards Imagine MathMath I Unit Lesson
HSF.LE.A.1.C Distinguish between situations that can be modeled with linear functions and with exponential functions.c. Recognize situations in which a quantity grows or decays by aconstant percent rate per unit interval relative to another.
Linear, Quadratic, and Exponential Models
Distinguishing Between Linear and Exponential Relationships
HSF.LE.A.2 Construct linear and exponential functions, including arithmetic and geometric sequences, given a graph, a description of a relationship, or two input-output pairs (include reading these from a table).
Linear, Quadratic, and Exponential Models
Writing Linear and Exponential Functions Based on Different Representations
HSF.LE.A.3 Observe using graphs and tables that a quantity increasing exponentially eventually exceeds a quantity increasing linearly, quadratically, or (more generally) as a polynomial function.
Linear, Quadratic, and Exponential Models
Introduction to Nonlinear Models
Interpret expressions for functions in terms of the situation they model.HSF.LE.B.5 Interpret the parameters in a linear or exponential function in terms
of a context.Building Functions Direct VariationInterpreting Functions Introduction to Logarithms
Logarithmic FunctionsRewriting and Interpreting Exponential Functions in Terms of Context
Congruence Experiment with transformations in the planeHSG.CO.A.1 Know precise definitions of angle, circle, perpendicular line, parallel
line, and line segment, based on the undefined notions of point, line, distance along a line, and distance around a circular arc.
Congruence Defining Basic Geometric Elements
HSG.CO.A.2 Represent transformations in the plane using, e.g., transparencies and geometry software; describe transformations as functions that take points in the plane as inputs and give other points as outputs. Compare transformations that preserve distance and angle to those that do not (e.g., translation versus horizontal stretch).
Congruence Representing Transformations with Algebra

93
2017–2018 School Year
CCSS CorrelationCreated November 2017
Common Core State Standards Imagine MathMath I Unit Lesson
HSG.CO.A.3 Given a rectangle, parallelogram, trapezoid, or regular polygon, describe the rotations and reflections that carry it onto itself.
Congruence Rotational and Reflectional Symmetry
HSG.CO.A.4 Develop definitions of rotations, reflections, and translations in terms of angles, circles, perpendicular lines, parallel lines, and line segments.
Congruence Defining Transformations
HSG.CO.A.5 Given a geometric figure and a rotation, reflection, or translation, draw the transformed figure using, e.g., graph paper, tracing paper, or geometry software. Specify a sequence of transformations that will carry a given figure onto another.
Congruence Rigid Motion and Congruence
Understand congruence in terms of rigid motions HSG.CO.B.6 Use geometric descriptions of rigid motions to transform figures
and to predict the effect of a given rigid motion on a given figure; given two figures, use the definition of congruence in terms of rigid motions to decide if they are congruent.
Congruence Rigid Motion and Congruence
HSG.CO.B.7 Use the definition of congruence in terms of rigid motions to show that two triangles are congruent if and only if corresponding pairs of sides and corresponding pairs of angles are congruent.
Congruence What Is Proof?
HSG.CO.B.8 Explain how the criteria for triangle congruence (ASA, SAS, and SSS) follow from the definition of congruence in terms of rigid motions.
Congruence Proving Theorems About Congruent Triangles
Make geometric constructionsHSG.CO.D.12 Make formal geometric constructions with a variety of tools and
methods (compass and straightedge, string, reflective devices, paper folding, dynamic geometric software, etc.). Copying a segment; copying an angle; bisecting a segment; bisecting an angle; constructing perpendicular lines, including the perpendicular bisector of a line segment; and constructing a line parallel to a given line through a point not on the line.
Congruence Constructing Angles and Special Line Segments

94
2017–2018 School Year
CCSS CorrelationCreated November 2017
Common Core State Standards Imagine MathMath I Unit Lesson
HSG.CO.D.13 Construct an equilateral triangle, a square, and a regular hexagon inscribed in a circle.
Congruence Constructing Inscribed Figures
Expressing Geometric Properties with Equations Use coordinates to prove simple geometric theorems algebraicallyHSG.GPE.B.4 Use coordinates to prove simple geometric theorems algebraically.
For example, prove or disprove that a figure defined by four given points in the coordinate plane is a rectangle; prove or disprove that the point (1, √3) lies on the circle centered at the origin and containing the point (0, 2).
Expressing Geometric Properties with Equations
Coordinates of Parallel and Perpendicular LinesProblem Solving with Coordinates of Parallel and Perpendicular LinesProblem Solving with the Equation of a Circle
HSG.GPE.B.5 Prove the slope criteria for parallel and perpendicular lines and use them to solve geometric problems (e.g., find the equation of a line parallel or perpendicular to a given line that passes through a given point).
Expressing Geometric Properties with Equations
Coordinates of Parallel and Perpendicular Lines
HSG.GPE.B.7 Use coordinates to compute perimeters of polygons and areas of triangles and rectangles, e.g., using the distance formula.
Expressing Geometric Properties with Equations
Using Coordinates to Find Perimeters and Areas
Interpreting Categorical & Quantitative DataSummarize, represent, and interpret data on a single count or measurement variableHSS.ID.A.1 Represent data with plots on the real number line (dot plots,
histograms, and box plots).Interpreting Categorical and Quantitative Data
Data Displays on the Real Number Line
HSS.ID.A.2 Use statistics appropriate to the shape of the data distribution to compare center (median, mean) and spread (interquartile range, standard deviation) of two or more different data sets.
Interpreting Categorical and Quantitative Data
Comparing the Shape, Center, and Spread of Data Sets
Statistics and Probability SamplingHSS.ID.A.3 Interpret differences in shape, center, and spread in the context of
the data sets, accounting for possible effects of extreme data points (outliers).
Interpreting Categorical and Quantitative Data
Comparing the Shape, Center, and Spread of Data Sets
Statistics and Probability Measures of Center - MeanMeasures of Center - Median

95
2017–2018 School Year
CCSS CorrelationCreated November 2017
Common Core State Standards Imagine MathMath I Unit Lesson
Summarize, represent, and interpret data on two categorical and quantitative variables HSS.ID.B.5 Summarize categorical data for two categories in two-way frequency
tables. Interpret relative frequencies in the context of the data (including joint, marginal, and conditional relative frequencies). Recognize possible associations and trends in the data.
Interpreting Categorical and Quantitative Data
Summarizing and Interpreting Categorical Data
HSS.ID.B.6.A Represent data on two quantitative variables on a scatter plot, and describe how the variables are related.a. Fit a function to the data; use functions fitted to data to solve problems in the context of the data. Use given functions or choose a function suggested by the context. Emphasize linear, quadratic, and exponential models.
Interpreting Categorical and Quantitative Data
Fitting Functions to Data
HSS.ID.B.6.B Represent data on two quantitative variables on a scatter plot, and describe how the variables are related.b. Informally assess the fit of a function by plotting and analyzing residuals.
Interpreting Categorical and Quantitative Data
Fitting Functions to Data
HSS.ID.B.6.C Represent data on two quantitative variables on a scatter plot, and describe how the variables are related.c. Fit a linear function for a scatter plot that suggests a linear association.
Interpreting Categorical and Quantitative Data
Fitting Functions to Data
Interpret linear modelsHSS.ID.C.7 Interpret the slope (rate of change) and the intercept (constant term)
of a linear model in the context of the data.Interpreting Categorical and Quantitative Data
Correlation
HSS.ID.C.8 Compute (using technology) and interpret the correlation coefficient of a linear fit.
This standard is not addressed. This standard is not addressed.
HSS.ID.C.9 Distinguish between correlation and causation. Interpreting Categorical and Quantitative Data
Correlation

Imagine Learning, Inc. © 2017 All Rights Reserved. imaginelearning.com | 801.377.5071