2018-19 school report card for mount pleasant high school
TRANSCRIPT

Educator DemographicsRace
American Indian or AlaskaNative
Asian
Black or African American
Native Hawaiian or OtherPacific Islander
Two Or More Races
White
Race Not Reported 12
64
1
10
3
Educator Type
Building Administrators
District Administrators
Support Professionals
Teachers 77
5
1
7
EthnicityHispanic
Not Hispanic
Ethnicity Not Reported 35
45
10
Note: Totals by educator race and ethnicity may be lower than educator type totals because an educator may be in more than one educator type assignment.
09-12 Abc
School Grade Span(2018-19 School Year)
2018-19 School Report Card for Mount Pleasant High School
Rhode Island Department of Elementary and Secondary EducationAngélica Infante-Green, Commissioner
The Rhode Island Report Card is a central platform for data and information aboutschool, district, and state education performance in Rhode Island. Report Cardsare required under the Every Student Succeeds Act (ESSA), the federal educationlaw, and Rhode Island's approach has been praised nationally for itstransparency, accessibility, and holistic approach to school accountability. Withinthis platform, students, parents, community members and all Rhode Islanderscan learn more about how schools are performing on a wide range of metrics,including state assessments, student and teacher chronic absence, andparticipation in advanced coursework, as well as survey data on school climateand culture.
921
Number of Students(On October 1, 2018)
90
Number of Educators(On October 1, 2018)
0 1 20 1 20 1 20 1 20 1 2Mount Pleasant High School is a 1-Star schoolbecause of: Achievement and Growth. A 1-Starrating indicates the lowest performance in terms ofachievement and growth or graduation.
Identified for Comprehensive Support andImprovement in 2018-19 due to Achievementand Growth.
Student DemographicsRace/Ethnicity
American Indian or AlaskaNative
Asian
Black or African American
Hispanic
Two or More Races
White 60
27
640
148
32
14
Gender
Female
Male 555
366
Economically Disadvantaged
ECD
Not ECD 116
805

A school's star rating is the lowest row where points are circled. If a column is missing a circled point score this means there was not enoughinformation to score that indicator, such as having too few students for that indicator.
This school was identified for Comprehensive Support and Improvement for 2019-20 due to Achievement & Growth.
Mount Pleasant High School earned a 1-Star rating.The star rating for Mount Pleasant High School was driven most by performance on Achievement and Growth.
Group TSI Reason ATSI Reason
Black or African American Achievement & Growth Achievement & Growth
Economically Disadvantaged Achievement & Growth Achievement & Growth
English Learners Achievement & Growth, Graduation Graduation and Achievement & Growth
Hispanic Achievement & Growth, Graduation Graduation and Achievement & Growth
Once the school's star rating is calculated, the number of low performing subgroups (right-most column) is counted. A low performing subgroup, orsubgroup identified for Targeted Support and Improvement (TSI) is a subgroup that would earn one star if it were its own school. A subgroup identifiedfor Additional Targeted Support and Improvement (ATSI) would be identified for Comprehensive Support and Improvement if it were its own school.
Subgroup Identifications (TSI, ATSI, or both): 7
*Schools missing growth have alternate cut points for levels 2 and 3 under achievement and growth. Those are: 3 star level: 4 points, 2 star level: 3 points.**Schools missing one or more 'School Quality and Student Success' indicator, have adjusted cuts for the second to last column. Those are: 4 indicators available: 5 starlevel: 10-12 points, 4 star level: 8-9 points, 3 star level: 6-7 points, 2 star level: 4-5 points; 3 indicators available: 5 star level: 8-9 points, 4 star level: 7 points, 3 star level:5-6 points, 2 star level: 3-4 points; 2 indicators available: 5 star level: 5-6 points, 4 star level: 4 points; 3 star level: 3 points, 2 star level: 1 point

ELA Achievement Points: 1 out of 4School points are based on All Students performance shown inchart on right.Four points matches RI's long-term goal of 75% proficiency.
0 20 40 60 80 100
All Students
American Indian or Alaska..
Asian
Black or African American
Hispanic
Native Hawaiian or Other ..
Two or More Races
White
Economically Disadvanta..
English Learners
Students with Disabilities
16
12 **
6 **
19
15
*
*
*
16
4
8
2 Points
3 Points
4 Points, > 75% Proficient
1 Point
2 Points
3 Points
4 Points, > 75% Proficient
1 Point
2 Points
3 Points
4 Points, > 75% Proficient
1 Point
2 Points
3 Points
4 Points, > 75% Proficient
1 Point
2 Points
3 Points
4 Points, > 75% Proficient
1 Point
Results by Subgroup
How is the proficiency index calculated?Hover here for information.
Filled bars above show proficiency index. Lines within bars show % proficient.Dotted and dashed lines in chart correspond to cut points in table on left.
Mount Pleasant High's participation rate for ELA accountability is 94%.10% of Mount Pleasant High students are proficient in ELA.Their ELA proficiency index, which includes partial points for level 2, is 16 out of 100.
Mount Pleasant High School ELA AchievementMeasures performance on the SAT and DLM assessments in 2017-18 and 2018-19 combined
Students who were not enrolled from Oct. 1 through the end of the testing window and students who moved to the US in the past year are not included.*Blank rows indicate too few students to report.**Subgroups with 10-19 students are reported, but not included in accountability determinations.

0 20 40 60 80 100
All Students
American Indian or Alaska..
Asian
Black or African American
Hispanic
Native Hawaiian or Other ..
Two or More Races
White
Economically Disadvanta..
English Learners
Students with Disabilities
10
14 **
4 **
10
9
*
*
*
10
4
5
2 Points
3 Points
4 Points, > 75% Proficient
1 Point
2 Points
3 Points
4 Points, > 75% Proficient
1 Point
2 Points
3 Points
4 Points, > 75% Proficient
1 Point
2 Points
3 Points
4 Points, > 75% Proficient
1 Point
2 Points
3 Points
4 Points, > 75% Proficient
1 Point
Results by Subgroup
How is the proficiency index calculated?Hover here for information
Math Achievement Points: 1 out of 4School points are based on All Students performance shown inchart on right.Four points matches RI's long-term goal of 75% proficiency.
Filled bars above show proficiency index. Lines within bars show % proficient.Dotted and dashed lines in chart correspond to cut points in table on left.
Mount Pleasant High's participation rate for math accountability is 94%.2% of Mount Pleasant High students are proficient in math.Their math proficiency index, which includes partial points for level 2, is 10 out of 100.
Mount Pleasant High School Math AchievementMeasures performance on the SAT and DLM assessments in 2017-18 and 2018-19 combined
Students who were not enrolled from Oct. 1 through the end of the testing window and students who moved to the US in the past year are not included.*Blank rows indicate too few students to report.**Subgroups with 10-19 students are reported, but not included in accountability determinations.
Group
0.00 0.20 0.40 0.60 0.80 1.00 1.20
ELA Growth Index
All Students
American Indian or Alaska..
Asian
Black or African American
Hispanic
Native Hawaiian or Other ..
Two or More Races
White
Economically Disadvanta..
English Learners
Students with Disabilities
0.61
0.58 **
0.50 **
0.74
0.58
*
*
*
0.63
0.46
0.50
2 Points
3 Points
1 Point
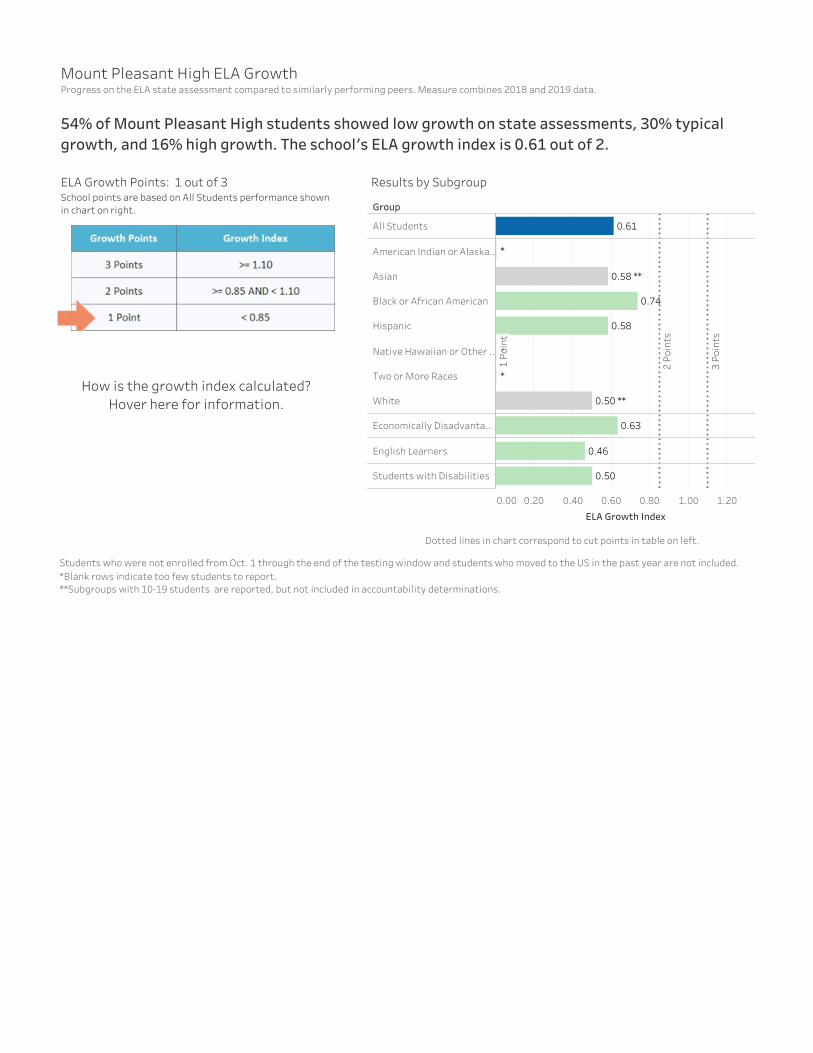
Results by SubgroupELA Growth Points: 1 out of 3School points are based on All Students performance shownin chart on right.
How is the growth index calculated?Hover here for information.
Dotted lines in chart correspond to cut points in table on left.
54% of Mount Pleasant High students showed low growth on state assessments, 30% typicalgrowth, and 16% high growth. The school's ELA growth index is 0.61 out of 2.
Mount Pleasant High ELA GrowthProgress on the ELA state assessment compared to similarly performing peers. Measure combines 2018 and 2019 data.
Students who were not enrolled from Oct. 1 through the end of the testing window and students who moved to the US in the past year are not included.*Blank rows indicate too few students to report.**Subgroups with 10-19 students are reported, but not included in accountability determinations.
Group
0.00 0.20 0.40 0.60 0.80 1.00 1.20
Math Growth Index
All Students
American Indian or Alaska..
Asian
Black or African American
Hispanic
Native Hawaiian or Other ..
Two or More Races
White
Economically Disadvanta..
English Learners
Students with Disabilities
0.73
1.17 **
0.88 **
0.74
0.68
*
*
*
0.75
0.63
0.73
2 Points
3 Points
1 Point
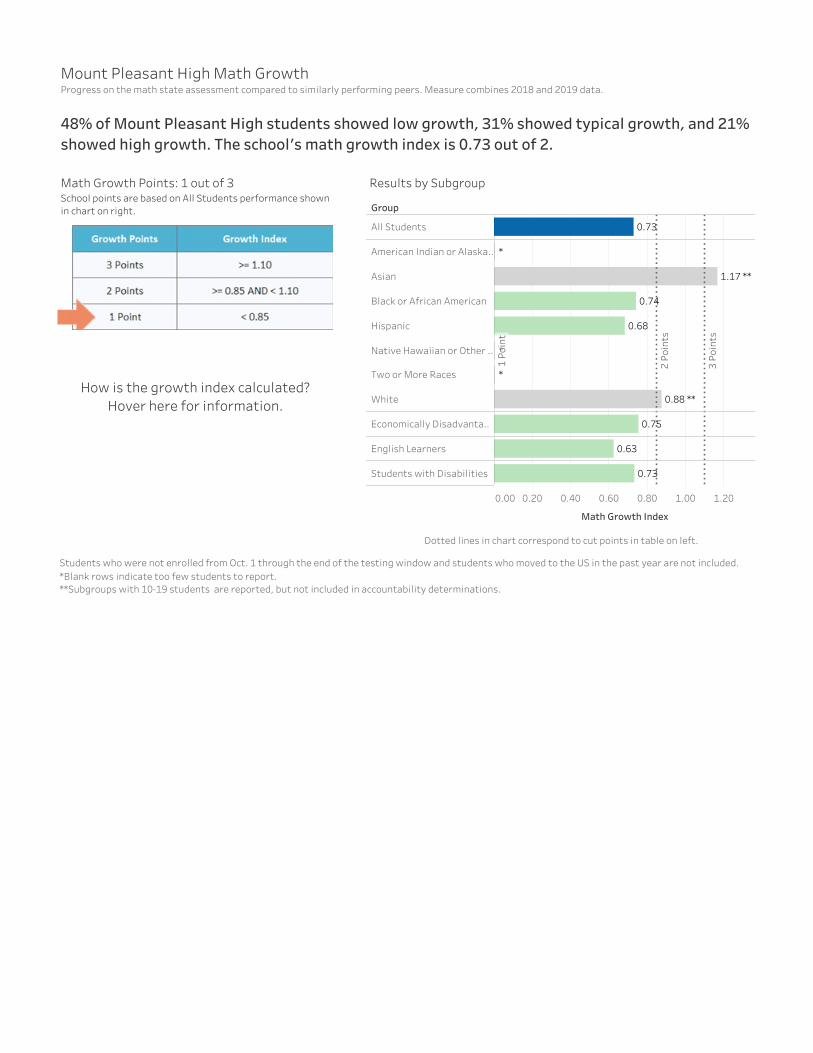
Results by SubgroupMath Growth Points: 1 out of 3School points are based on All Students performance shownin chart on right.
How is the growth index calculated?Hover here for information.
Dotted lines in chart correspond to cut points in table on left.
Students who were not enrolled from Oct. 1 through the end of the testing window and students who moved to the US in the past year are not included.*Blank rows indicate too few students to report.**Subgroups with 10-19 students are reported, but not included in accountability determinations.
48% of Mount Pleasant High students showed low growth, 31% showed typical growth, and 21%showed high growth. The school's math growth index is 0.73 out of 2.
Mount Pleasant High Math GrowthProgress on the math state assessment compared to similarly performing peers. Measure combines 2018 and 2019 data.

0 20 40 60 80 100
All Students
American Indian or AlaskaNative
Asian
Black or African American
Hispanic
Native Hawaiian or OtherPacific Islander
Two or More Races
White
EconomicallyDisadvantaged
Students with Disabilities
53
65 **
55
51
61
*
*
*
53
39
2 Points
3 Points
>= 75% Met target
1 Point
2 Points
3 Points
>= 75% Met target
1 Point
2 Points
3 Points
>= 75% Met target
1 Point
2 Points
3 Points
>= 75% Met target
1 Point
Results by SubgroupELP Points: 1 out of 4School points are based on All Students performance shown in chart on right.Four points matches RI's long-term goal of 75% meeting annual target.
Filled bars above show ELP index. Lines within bars show % met target.Dotted and dashed lines in chart correspond to cut points in table on left.
How is this calculated?
Individual targets are based on students' initial level of proficiency. Allstudents have the same goal of proficiency in English, but the level at which astudent entered determines how many years they have to reach that goal.
Next, the portion of progress made compared to the target is calculated foreach student.
Finally, this is capped at 0 (no negative scores) and 1.1 (110% of the target),averaged across all students in a school, and multiplied by 100 to get theschool’s ELP index.
28% of Mount Pleasant High English learners met their target for English proficiency.On average, students made 53% of the growth necessary to reach proficiency on target.
Mount Pleasant High English Language Proficiency (ELP)Progress toward English language proficiency on the ACCESS assessment in 2017-18 and 2018-19 combined
*Blank rows indicate too few students to report.**Subgroups with 10-19 students are reported, but not included in accountability determinations.

Graduation data are based on 2017-18 and earlier. Schools and subgroups with fewer than 20 students have up to two additional years of data added.*Blank rows indicate too few students to report.**Subgroups with 10-19 students are reported, but not included in accountability determinations.
Graduation Points: 2 out of 5School points are based on All Students performanceshown in chart on right.Five points matches RI's long-term goal of 95% graduatingwithin 4 years.
Mount Pleasant High's 4-year or "base" graduation rate is 69%.Their 4-, 5-, and 6-year combined or "composite" graduation rate is 69%.
Mount Pleasant High School Graduation RateGraduation data are on a one-year lag; these are from 2018 reporting.
Group
0% 20% 40% 60% 80% 100%
Graduation Rate
All Students
American Indian or Alaska..
Asian
Black or African American
Hispanic
Native Hawaiian or Other ..
Two or More Races
White
Economically Disadvanta..
English Learners
Students with Disabilities
69%
85% **
87%
66%
58%
61%
*
*
70%
66%
58%
2 Points
3 Points
4 Points
5 Points
1 Point
2 Points
3 Points
4 Points
5 Points
1 Point
2 Points
3 Points
4 Points
5 Points
1 Point
2 Points
3 Points
4 Points
5 Points
1 Point
2 Points
3 Points
4 Points
5 Points
1 Point
Results by Subgroup
Filled bars above show Composite Rate. Lines within bars show Base Rate.Dotted and dashed lines in chart correspond to cut points in table on left.To reach 2 or 5 points, the base rate must cross the labelled dashed lines.
To reach 3 or 4 points, the composite rate must cross the labelled dotted lines.

*Blank rows indicate too few students to report.**Subgroups with 10-19 students are reported, but not included in accountability determinations.
Dotted lines in bar chart correspond to cut points in table on left.
0% 20% 40% 60% 80% 100%
% Earned Commissioner's Seal
All Students
American Indian orAlaska Native
Asian
Black or AfricanAmerican
Hispanic
Native Hawaiian orOther Pacific Islander
Two or More Races
White
EconomicallyDisadvantaged
English Learners
Students withDisabilities
6%
14% **
5%
6%
*
*
*
*
7%
1%
0%
2 Points
3 Points
1 Point
Results by SubgroupCommissioner's Seal Points: 1 out of 3School points are based on All Students performance shown inchart on right.
6% of 2018 Mount Pleasant High graduates demonstrated high school proficiency in both ELAand mathematics before graduation.
Mount Pleasant High School Commissioner's Seal MeasureDiploma Plus data are on a one-year lag; these measure 2018 graduates.
*Blank rows indicate too few students to report.**Subgroups with 10-19 students are reported, but not included in accountability determinations.
Dotted lines in bar chart correspond to cut points in table on left.
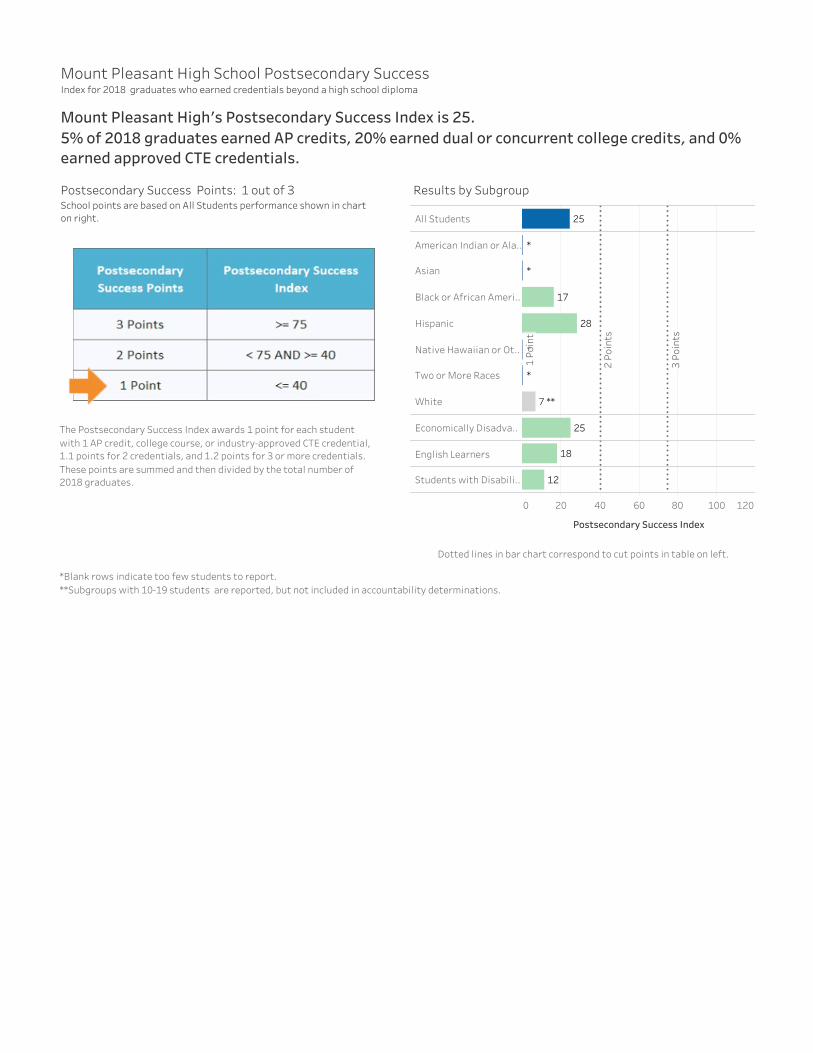
Postsecondary Success Points: 1 out of 3School points are based on All Students performance shown in charton right.
Mount Pleasant High's Postsecondary Success Index is 25.5% of 2018 graduates earned AP credits, 20% earned dual or concurrent college credits, and 0%earned approved CTE credentials.
Mount Pleasant High School Postsecondary SuccessIndex for 2018 graduates who earned credentials beyond a high school diploma
0 20 40 60 80 100 120
Postsecondary Success Index
All Students
American Indian or Ala..
Asian
Black or African Ameri..
Hispanic
Native Hawaiian or Ot..
Two or More Races
White
Economically Disadva..
English Learners
Students with Disabili..
25
7 **
17
28
*
*
*
*
25
18
12
2 Points
3 Points
1 Point
Results by Subgroup
The Postsecondary Success Index awards 1 point for each studentwith 1 AP credit, college course, or industry-approved CTE credential,1.1 points for 2 credentials, and 1.2 points for 3 or more credentials.These points are summed and then divided by the total number of2018 graduates.

49.5% of Mount Pleasant High students are chronically absent.
Mount Pleasant High School Quality and Student Success: Student AbsenteeismStudent Chronic Absenteeism is defined as missing 10% of days or more. That's 18 days or more over a full school year.
Student Absenteeism Points: 1 out of 3School points are based on All Students performance shown inchart on right.
0 20 40 60 80
% Chronically Absent
All Students
American Indian or AlaskaNative
Asian
Black or African American
Hispanic
Native Hawaiian or OtherPacific Islander
Two or More Races
White
EconomicallyDisadvantaged
English Learners
Students with Disabilities
49.5%
65.0%
38.0%
42.0%
49.2%
80.4%
60.4%
*
50.1%
38.3%
60.0%
2 Points
1 Point
3 Points
Results by Subgroup
Dotted lines in bar chart correspond to cut points in table above.
Includes grades K-12. Schools and subgroups with fewer than 20 students have up to two additional years of data added.*Blank rows indicate too few students to report.**Subgroups with 10-19 students over 3 years are reported, but not included in accountability determinations.
Group
0.0 5.0 10.0 15.0
% Teachers Chronically Absent
All Students
American Indian or Alaska..
Asian
Black or African American
Hispanic
Native Hawaiian or Other ..
Two or More Races
White
Economically Disadvanta..
English Learners
Students with Disabilities
3.1%
13.2%
14.8%
1.2%
3.8%
1.8%
8.2%
*
3.2%
1.9%
6.9%
2 Points
1 Point
3 Points
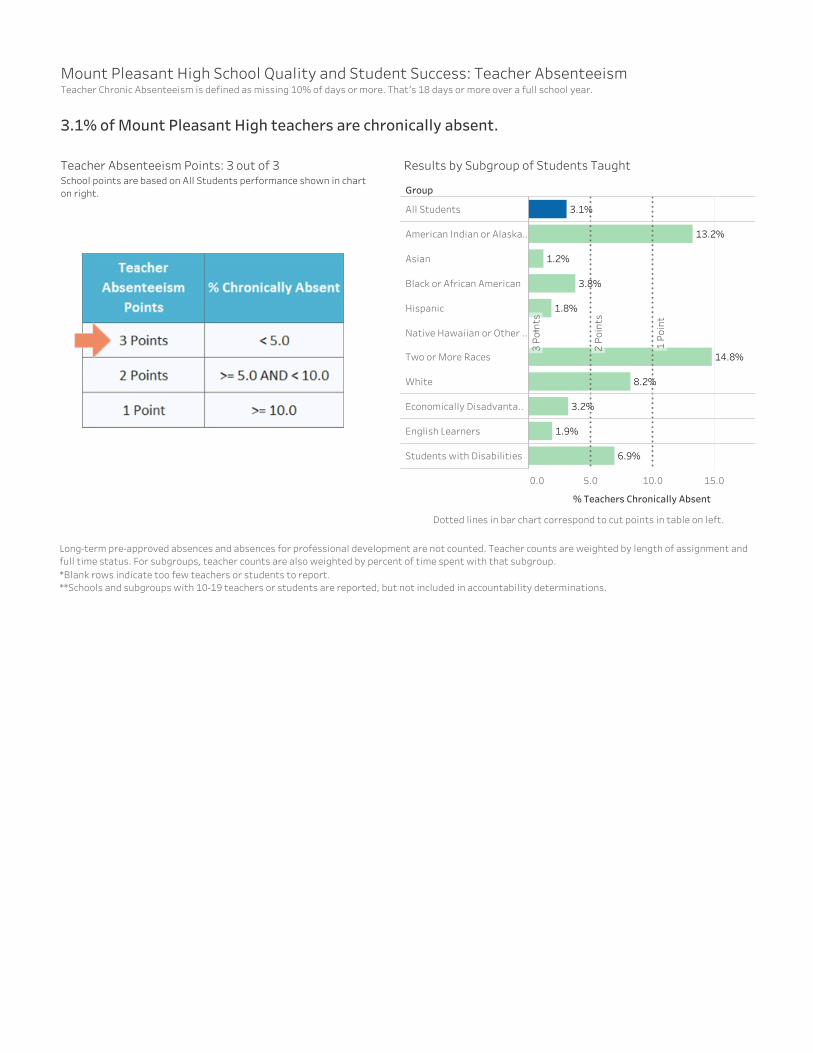
Results by Subgroup of Students TaughtTeacher Absenteeism Points: 3 out of 3School points are based on All Students performance shown in charton right.
Dotted lines in bar chart correspond to cut points in table on left.
3.1% of Mount Pleasant High teachers are chronically absent.
Mount Pleasant High School Quality and Student Success: Teacher AbsenteeismTeacher Chronic Absenteeism is defined as missing 10% of days or more. That's 18 days or more over a full school year.
Long-term pre-approved absences and absences for professional development are not counted. Teacher counts are weighted by length of assignment andfull time status. For subgroups, teacher counts are also weighted by percent of time spent with that subgroup.*Blank rows indicate too few teachers or students to report.**Schools and subgroups with 10-19 teachers or students are reported, but not included in accountability determinations.
Dotted lines in bar chart correspond to cut points in table on left.
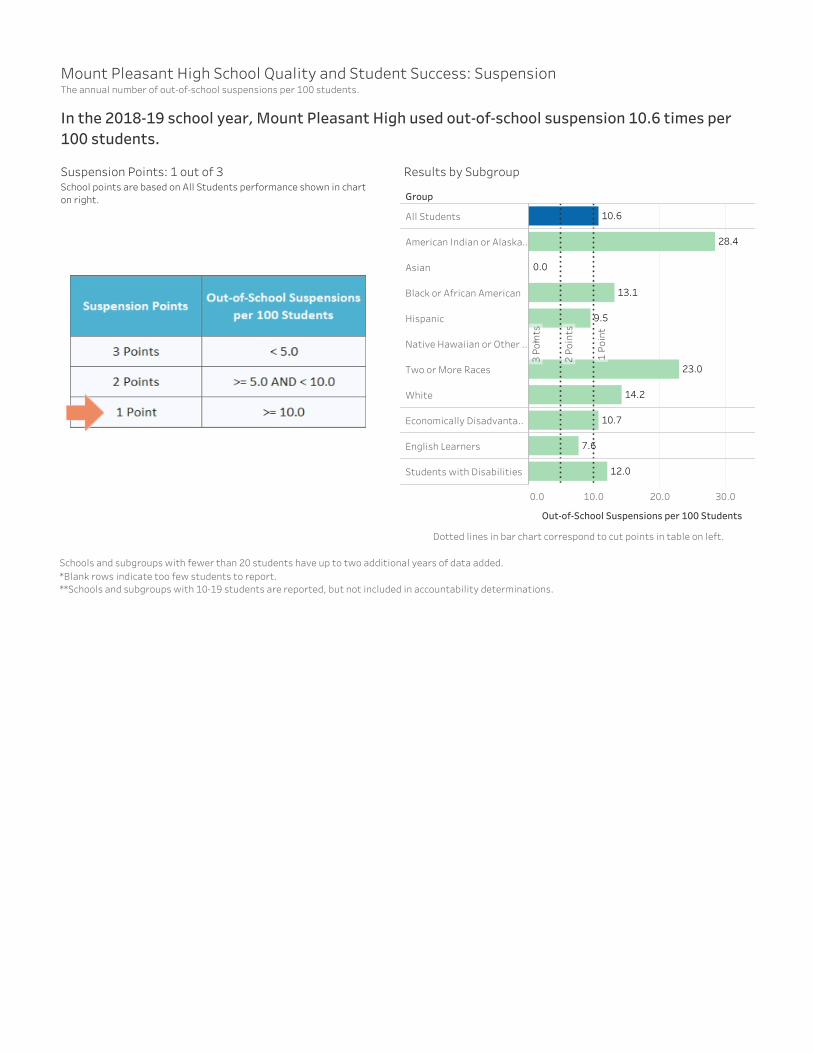
Suspension Points: 1 out of 3School points are based on All Students performance shown in charton right. Group
0.0 10.0 20.0 30.0
Out-of-School Suspensions per 100 Students
All Students
American Indian or Alaska..
Asian
Black or African American
Hispanic
Native Hawaiian or Other ..
Two or More Races
White
Economically Disadvanta..
English Learners
Students with Disabilities
10.6
28.4
13.1
23.0
14.2
0.0
9.5
*
10.7
7.6
12.0
2 Points
1 Point
3 Points
Results by Subgroup
Schools and subgroups with fewer than 20 students have up to two additional years of data added.*Blank rows indicate too few students to report.**Schools and subgroups with 10-19 students are reported, but not included in accountability determinations.
In the 2018-19 school year, Mount Pleasant High used out-of-school suspension 10.6 times per100 students.
Mount Pleasant High School Quality and Student Success: SuspensionThe annual number of out-of-school suspensions per 100 students.

0.0 2.0 4.0 6.0 8.0 10.0
% Exceeds Expectations, ELA
All Students
American Indian or Alaska..
Asian
Black or African American
Hispanic
Native Hawaiian or Other ..
Two or More Races
White
Economically Disadvanta..
English Learners
Students with Disabilities
0.0%
0.0% **
0.0% **
0.0%
0.0%
*
*
*
0.0%
0.0%
0.0%
2 Points
3 Points
1 Point
ELA Results by Subgroup
0.0 2.0 4.0 6.0 8.0 10.0
% Exceeds Expectations, Math
All Students
American Indian or Alaska..
Asian
Black or African American
Hispanic
Native Hawaiian or Other ..
Two or More Races
White
Economically Disadvanta..
English Learners
Students with Disabilities
0.0%
0.0% **
0.0% **
0.0%
0.0%
*
*
*
0.0%
0.0%
0.0%
2 Points
3 Points
1 Point
Math Results by Subgroup
ELA Exceeds Points: 1 out of 3 Math Exceeds Points: 1 out of 3
0.0% of Mount Pleasant High students exceeded expectations on the state assessment in ELA,and 0.0% exceeded expectations in Math.
Mount Pleasant High School Quality and Student Success: Exceeds ExpectationsThe percent of students who score at the top level (Level 4) on the state assessments in 2017-18 and 2018-19 combined
School points are based on All Students performance shown in bar charts. Dotted lines in bar charts correspond to cut points in tables at top.Students who were not enrolled from Oct. 1 through the end of the testing window and students who moved to the US in the past year are not included.*Blank rows indicate too few students to report.**Subgroups with 10-19 students are reported, but not included in accountability determinations.

2018-19 State Assessment Data for Mount Pleasant High School
View Performance and Participation By:
The state assessments include RICAS (grades 3-8), SAT (grade 11), NGSA (grades 5, 8, 11), and DLM Alternate Assessments (grades 3-8, 11).
98.98%
English language proficiency of English language learners
empty cells indicate less than 10 students
11 16.14%75.34% 8.52%
ELA Performance in State AssessmentsSubgroup: Grade
empty cells indicate less than 10 students
11 19.73%78.03%
Math Performance in State AssessmentsSubgroup: Grade
empty cells indicate less than 10 students
11 95.30%
Math Participation in State AssessmentsSubgroup: Grade
empty cells indicate less than 10 students
11 95.30%
ELA Participation in State AssessmentsSubgroup: Grade
empty cells indicate less than 10 students
Data Source: Rhode Island State Assessments include RICAS, NGSA, DLM Alternate Assessment and SAT. English language proficiency of English language learners is assessedwith ACCESS or Alternate ACCESS
11 58.48%38.39%
Science Performance in State AssessmentsSubgroup: Grade
empty cells indicate less than 10 students
11 95.73%
Science Participation in State AssessmentsSubgroup: Grade
empty cells indicate less than 10 students
Proficient Not Proficient
Proficiency Level Legend
1 (Not Meeting Expectations)2 (Partially Meeting Expectat.. 3 (Meeting Expectations) 4 (Exceeding Expectations)
Performance Level Legend
Participant Non-Participant
Participation Legend
11
ELA Math Science
10 10 10
Students Assessed with a DLM Alternate Assessment By Grade and Subject
empty cells indicate less than 10 students
Number of recently arrived English language learnersexempted from the reading/language arts assessments
blank value indicates less than 10 students
Grade

The Civil Rights Data Collection (CRDC) is a publically available federal data collection obtained directly from local education agencies (https://ocrdata.ed.gov/). Data maydiffer slightly from state-provided reports.
Student count
Students who received one or more in-school suspensions
Students who received only one out-of-school suspension
Students who received more than one out-of-school suspension
Students who received an expulsion with educational services
Students who received an expulsion without educational services
Students who received an expulsion under zero tolerance policies
Students who were referred to a law enforcement agency or official
Students who received a school-related arrest
Students who were chronically absent
Students reported as harassed or bullied on the basis of disability
Students reported as harassed or bullied on the basis of race,color or national origin
Students reported as harassed or bullied on the basis of sex 4
0
0
471
19
58
0
0
0
65
55
0
Mount Pleasant High School Suspension Indicators(Not Charter School)
Female Male
All students Student count
American Indian/Alaska Native
Asian
Black
Hispanic
Native Hawaiian/Pacific Islander
Two or More Races
White
Children with Disabilities
English Language Learners n/a
n/a
n/a
n/a
n/a
n/a
n/a
n/a
n/a
n/a
n/a
n/a
n/a
n/a
n/a
n/a
n/a
n/a
n/a
n/a
Mount Pleasant High School:Preschool enrollment demographics(Not Charter School)(n/a means indicator is not applicable to school)
Select CRDC Indicator for Demographic Data
Preschool enrollment
Civil Rights Data Collection (CRDC) for 2015-16
Student count Percent of school enrollment
Preschool enrollment
Student enrollment in at least one Advance Placementcourse
6.8%
n/a
63
n/a
Mount Pleasant High School Enrollment Indicators(Not Charter School)(n/a means indicator is not applicable to school)
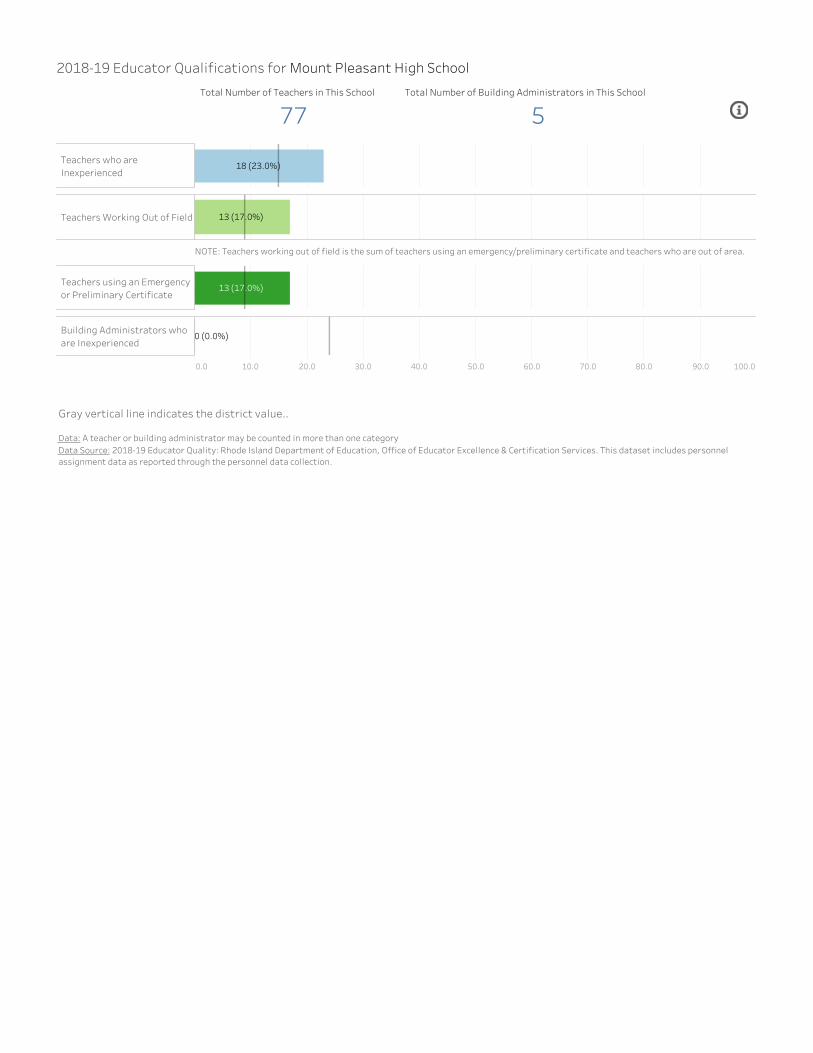
2018-19 Educator Qualifications for Mount Pleasant High School
77Total Number of Teachers in This School
5Total Number of Building Administrators in This School
Teachers who areInexperienced
18 (23.0%)
Teachers using an Emergencyor Preliminary Certificate
13 (17.0%)
0.0 10.0 20.0 30.0 40.0 50.0 60.0 70.0 80.0 90.0 100.0
Building Administrators whoare Inexperienced
0 (0.0%)
Teachers Working Out of Field 13 (17.0%)
Data: A teacher or building administrator may be counted in more than one categoryData Source: 2018-19 Educator Quality: Rhode Island Department of Education, Office of Educator Excellence & Certification Services. This dataset includes personnelassignment data as reported through the personnel data collection.
Gray vertical line indicates the district value..
NOTE: Teachers working out of field is the sum of teachers using an emergency/preliminary certificate and teachers who are out of area.

$0 $5,000 $10,000 $15,000 $20,000 $25,000 $30,000 $35,000
$17,327
Per Pupil Expenditures for The State
$0 $5,000 $10,000 $15,000 $20,000 $25,000 $30,000 $35,000
$17,370
Per Pupil Expenditures for Mount Pleasant High School
$0 $5,000 $10,000 $15,000 $20,000 $25,000 $30,000 $35,000
$17,069
Per Pupil Expenditures for Providence
2017-18 Per Pupil Expenditures
$0 $5,000 $10,000 $15,000 $20,000 $25,000 $30,000 $35,000
Mount Pleasant High School: $17,929
Providence: $18,277
Per Pupil Expenditures for Mount Pleasant High School
$0 $5,000 $10,000 $15,000 $20,000 $25,000 $30,000 $35,000
$16,551
Per Pupil Expenditures for the State
$0 $5,000 $10,000 $15,000 $20,000 $25,000 $30,000 $35,000
Elementary: $14,547
Middle: $13,941
High: $14,519
Per Pupil Expenditures by School Level for Providence
Fund CategoryFederal
State/Local
Total Per PupilLEA
School

Graduated within 4 Years Graduated in 5th Year Graduated in 6th Year Retention Rate GED/Other Completion Rate Dropout Rate
20.6%0.4%10.3%68.7%
Mount Pleasant High School 4 Year Rates for the 2017-18 Graduates
0% 10% 20% 30% 40% 50% 60% 70% 80% 90% 100%
All Students ALL
Armed ForcesActive Duty
AFD
NOT AFD
EconomicallyDisadvantaged
ECD
NOT ECD
English LearnersELL
NOT ELL
Foster Care NOT FOS
Gender Female
Male
Homeless NOT HOM
Race/Ethnicity Asian
American Indian or Alaska Native
Black or African American
Hispanic
Two or More Races
White
Students withDisabilities
SWD
NOT SWD
20.6%10.3%68.7%
20.6%10.3%68.7%
18.8%70.9% 9.8%
32.4%
10.6%
10.8%56.8%
78.8% 9.8%
20.6%10.3%68.7%
27.6%11.2%
82.4%
60.5%
8.8%8.8%
20.4%10.0%69.2%
23.7%
37.5%
10.8%
10.2%
12.5%
89.2%
66.1%
43.8% 6.3%
12.5%
22.2%
27.5%57.5%
70.9% 6.9%
Graduated within 4 Years
Graduated in 5th Year
Graduated in 6th Year
Retention Rate
GED/Other Completion Rate
Dropout Rate
Select Rate:4 Year Rates

Rhode Island
0% 10% 20% 30% 40% 50% 60% 70% 80% 90% 100%
Grade 4 Math All StudentsEnglish Language LearnersStudents with Disabilities
Reading All StudentsEnglish Language LearnersStudents with Disabilities
Grade 8 Math All StudentsEnglish Language LearnersStudents with Disabilities
Reading All StudentsEnglish Language LearnersStudents with Disabilities
98%93%
93%
97%92%
88%
99%
91%95%
98%
90%90%
Student Participation for 2019
Rhode Island
0% 10% 20% 30% 40% 50% 60% 70% 80% 90% 100%Percent of Students
Grade 4 Math All StudentsAmerican Indian/Alaska NativeAsianBlackHispanicNative Hawaiian/Other Pacific IslanderTwo or More RacesWhite
Reading All StudentsAmerican Indian/Alaska NativeAsianBlackHispanicNative Hawaiian/Other Pacific IslanderTwo or More RacesWhite
Grade 8 Math All StudentsAmerican Indian/Alaska NativeAsianBlackHispanicNative Hawaiian/Other Pacific IslanderTwo or More RacesWhite
Reading All StudentsAmerican Indian/Alaska NativeAsianBlackHispanicNative Hawaiian/Other Pacific IslanderTwo or More RacesWhite
13%
34%
39%
22%22%
24%42%
40%
40%
46%44%
45%37%
19%
30%32%
26%12%
7%
5%9%
9%
11%
13%
26%
28%13%
16%
26%32%
31%
33%36%
30%
34%30%
34%
28%49%
50%
33%25%
9%
4%
6%
11%
22%
11%
10%
22%28%
34%
28%
31%
37%36%
36%
56%
56%
38%25%
8%
4%
30%
31%
19%16%
27%39%
36%
36%
37%35%
37%37%
29%
29%
42%48%
31%17%
5%
4%
6%7%
Student Performance for 2019 by Ethinicity
Rhode Island
0% 10% 20% 30% 40% 50% 60% 70% 80% 90% 100%
Percent of Students
Grade 4 Math All StudentsEconomically DisadvantagedNot Economically DisadvantagedEnglish Language LearnersNon-English Language LearnersStudents with DisabilitiesStudents without Disabilities
Reading All StudentsEconomically DisadvantagedNot Economically DisadvantagedEnglish Language LearnersNon-English Language LearnersStudents with DisabilitiesStudents without Disabilities
Grade 8 Math All StudentsEconomically DisadvantagedNot Economically DisadvantagedEnglish Language LearnersNon-English Language LearnersStudents with DisabilitiesStudents without Disabilities
Reading All StudentsEconomically DisadvantagedNot Economically DisadvantagedEnglish Language LearnersNon-English Language LearnersStudents with DisabilitiesStudents without Disabilities
11%
34%24%
45%10%
37%
38%
40%45%
35%39%
40%
32%42%
19%29%
50%15%
58%12%
7%
8%
8%9%
9%
15%
11%
11%
26%17%
34%
29%
29%
31%31%
30%22%
32%18%
33%
34%48%
20%72%
29%73%
27%
9%4%
6%
14%11%
31%
23%
24%
34%35%
36%15%
38%
55%20%
91%32%
78%
29%
9%
9%
6%
7%
30%17%
42%
33%
12%33%
36%38%
35%14%
38%
29%38%
29%44%
15%85%
24%
59%24%
5%
8%
5%
5%
Student Performance for 2019 by Group
Proficiency LevelBelow Basic
Basic
Proficient
Advanced
NAEP is the largest nationally representative and continuing assessment of what America's students know and can do in various subject areas. Data displayed are forNational Public schools. Graphs with no data indicate that NAEP reporting requirements were not met for that subgroup and therefore data are not displayed.
2019 National Assessment of Educational Progress (NAEP) Performance and Participation
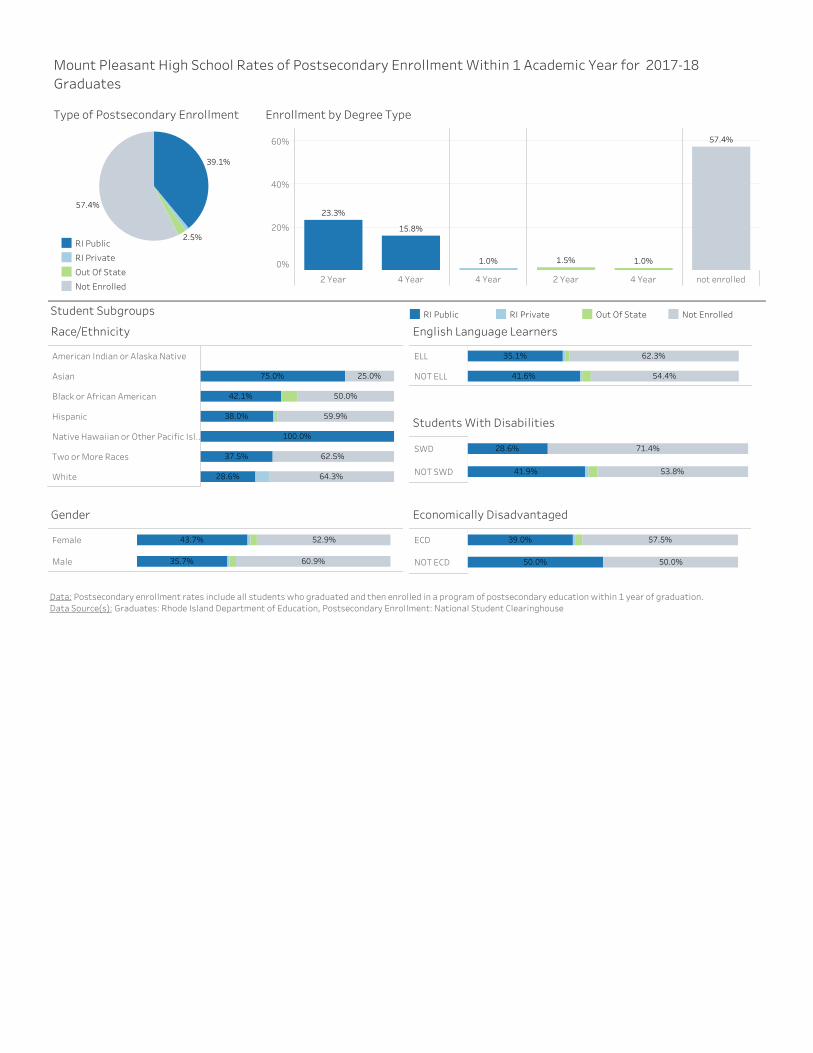
Mount Pleasant High School Rates of Postsecondary Enrollment Within 1 Academic Year for 2017-18Graduates
57.4%
39.1%
2.5%
Type of Postsecondary Enrollment
2 Year 4 Year 4 Year 2 Year 4 Year not enrolled
0%
20%
40%
60%
23.3%
15.8%
1.0% 1.5% 1.0%
57.4%
Enrollment by Degree Type
Data: Postsecondary enrollment rates include all students who graduated and then enrolled in a program of postsecondary education within 1 year of graduation.Data Source(s): Graduates: Rhode Island Department of Education, Postsecondary Enrollment: National Student Clearinghouse
SWD
NOT SWD
71.4%
53.8%
28.6%
41.9%
Students With Disabilities
Female
Male
52.9%
60.9%
43.7%
35.7%
Gender
American Indian or Alaska Native
Asian
Black or African American
Hispanic
Native Hawaiian or Other Pacific Isl..
Two or More Races
White
100.0%
25.0%
50.0%
59.9%
62.5%
64.3%
75.0%
42.1%
38.0%
37.5%
28.6%
Race/Ethnicity
ECD
NOT ECD
57.5%
50.0%
39.0%
50.0%
Economically Disadvantaged
ELL
NOT ELL
62.3%
54.4%
35.1%
41.6%
English Language Learners
RI Public
RI Private
Out Of State
Not Enrolled
RI Public RI Private Out Of State Not EnrolledStudent Subgroups