2018 european semester: assessment of progress on ... · 2018 european semester: assessment of...
TRANSCRIPT

EN EN
EUROPEAN COMMISSION
Brussels, 7.3.2018
SWD(2018) 219 final
COMMISSION STAFF WORKING DOCUMENT
Country Report Poland 2018
Accompanying the document
COMMUNICATION FROM THE COMMISSION TO THE EUROPEAN
PARLIAMENT, THE COUNCIL, THE EUROPEAN CENTRAL BANK AND THE
EUROGROUP
2018 European Semester: Assessment of progress on structural reforms, prevention and
correction of macroeconomic imbalances, and results of in-depth reviews under
Regulation (EU) No 1176/2011
{COM(2018) 120 final}

Executive summary 1
1. Economic situation and outlook 4
2. Progress with country-specific recommendations 11
3. Reform priorities 15
3.1. Public finances and taxation 15
3.2. Financial sector 20
3.3. Labour market, education and social policies 22
3.4. Investment 28
3.5. Sectoral policies 32
Annex A: Overview table 36
Annex B: Macroeconomic Imbalance Procedure scoreboard 40
Annex C: Standard tables 41
References 47
LIST OF TABLES
Table 1.1: Key economic, financial and social indicators - Poland 10
Table 2.1: Assessment of 2017 country-specific recommendations 12
Table 3.2.1: Banking sector financial stability indicators, 2015-2017 20
Table 3.3.1: Differences between activity rates in Poland and EU – by age class and educational
attainment, Q3 2017, percentage points 22
Table B.1: The Macroeconomic Imbalance Procedure scoreboard for Poland (AMR 2018) 40
Table C.1: Financial market indicators 41
Table C.2: Headline Social Scoreboard indicators 42
Table C.3: Labour market and education indicators 43
Table C.4: Social inclusion and health indicators 44
Table C.5: Product market performance and policy indicators 45
Table C.6: Green growth 46
CONTENTS

LIST OF GRAPHS
Graph 1.1: Contributions to real GDP growth, 2008-2019 4
Graph 1.2: Estimated potential growth and its components, 2007-2019 4
Graph 1.3: Employment, wages and unemployment rate, 2013-2017 5
Graph 1.4: Share of companies indicating shortage of labour among factors limiting activity in
selected sectors, 2000-2017 6
Graph 1.5: Gini coefficient of disposable income, 2005-2016 6
Graph 1.6: Average quality rank of manufacturing exports to the EU, 2016 and 2011 7
Graph 1.7: Headline and structural fiscal balances, 2011-2019 9
Graph 2.1: Overall multiannual implementation of 2011-2017 CSRs to date 11
Graph 3.1.1: Tax revenue as % of GDP, 4 quarter moving average 15
Graph 3.1.2: Medium-term public debt scenarios 18
Graph 3.2.1: Credit growth, 2012-2017 (annual % change) 21
Graph 3.3.1: Pre-school participation by 3-5 year olds, 2013-2017 25
Graph 3.4.1: Investment outlays per person employed by firm size, 2015 28
Graph 3.5.1: Total international scientific co-publications as % of total scientific publications, 2007
and 2016 32
Graph 3.5.2: Network of high-speed roads until 2023 33
Graph 3.5.3: Gross electricity generation by fuel - TWh, 2015 34
LIST OF BOXES
Box 2.1: Tangible results delivered through EU support to structural change in Poland 14
Box 3.1.1: Policy highlights: measures to improve tax compliance 16
Box 3.3.1: Monitoring performance in light of the European Pillar of Social Rights 23
Box 3.4.1: Investment challenges and reforms in Poland 31

1
Poland’s social, fiscal and economic situation
offers a good opportunity to address medium-
term challenges. Economic growth is strong, the
financial sector is stable and there are no short-
term risks to fiscal sustainability. Poland could
safeguard medium-term growth prospects by
addressing the challenges connected to shrinking
working-age population and ageing. Boosting
private investment and innovation would help
sustain the successful convergence towards
average EU income levels, which has been
observed in recent years. While some policies,
such as lowering the retirement age, have not been
conducive to growth, other measures have been
undertaken to improve the country’s economic and
social prospects and to improve tax collection (1).
The economy has been growing robustly.
Domestic demand, especially private consumption,
has been the dominant driver of growth over the
last few years. This was particularly evident in
2016 and 2017. However, investment remained
sluggish until mid-2017. Strong private
consumption has been supported by a buoyant
labour market, increased fiscal transfers and
record-high levels of consumer confidence.
The short-term economic outlook remains
favourable. After increasing by 4.6 % in 2017,
real GDP is forecast to grow by 4.2 % in 2018 and
3.6 % in 2019, among the highest rates in the EU.
An increasing utilisation of EU funds should result
in higher investment, in particular public
investment. Private consumption, driven by rapidly
rising wages, is projected to remain robust, albeit
slowing from the exceptionally high rate in 2017.
Solid domestic demand is forecast to enable higher
imports, but favourable developments in foreign
demand and the improving competitiveness of the
Polish economy should support a steady rise in
exports. Inflation is set to increase, driven mainly
by strong wage growth.
Several structural factors weigh on the
economy's long-term growth potential. As the
(1) This report assesses Poland’s economy in light of the
European Commission’s Annual Growth Survey published
on 22 November 2017. In the survey, the Commission calls
on EU Member States to implement structural reforms to
make the European economy more productive, resilient and
inclusive. In so doing, Member States should focus their
efforts on the three elements of the virtuous triangle of
economic policy – boosting investment, pursuing structural
reforms and ensuring responsible fiscal policies.
sources of strong past growth gradually diminish,
Poland faces the challenge to become more
innovative and to better position itself in the global
value chains. An expected decline in the working
age population underlines the need for increasing
labour market participation. The country’s ability
to do so will also depend on its success in building
up the skills of its population. A more skilled
workforce can stimulate innovation and associated
productivity gains, which are key drivers of
economic growth. This is also recognised in the
government’s responsible development strategy.
Future private investment will largely depend on
macroeconomic outlook and on the stability and
quality of law and institutions, including the policy
and regulatory environment. The rule of law,
including the independence of the judiciary and
legal certainty, are also of key importance.
Overall, Poland has made limited progress (2) in
addressing the 2017 country-specific
recommendations (CSRs). Limited progress was
made in addressing the recommendations on public
finance. First steps were taken to reform the
budgetary framework, while the extensive use of
reduced VAT rates has not been addressed.
Limited progress has been made on taking
measures to get more people into the labour
market. No effective measures were taken to
increase the effective retirement age and to reform
special pension arrangements. There was limited
progress on removing obstacles to investment,
including in the transport sector.
Poland is making good progress in reaching the
national targets under the Europe 2020 strategy in
the following areas: greenhouse gas emissions,
poverty, energy efficiency, tertiary education,
reducing early school leaving and the employment
rate. Progress is limited in R&D investment and in
renewable energy.
Poland performs relatively well on the
indicators of the Social Scoreboard supporting
the European Pillar of Social Rights. A
significant gender employment gap is, inter alia,
related to limited access to childcare for children
under three and shortcomings in the provision of
(2) Information on the level of progress and actions taken to
address the policy advice in each respective subpart of a
CSR is presented in the Overview table in the Annex. This
overall assessment does not include an assessment of
compliance with the Stability and Growth Pact.
EXECUTIVE SUMMARY

Executive summary
2
long-term care. High unmet needs in the healthcare
system also emerge as an important challenge.
The main findings of this report and the related
policy challenges are as follows:
There is no short-term risk to fiscal
sustainability. The headline deficit, unlike the
structural one, is estimated to have strongly
declined in 2017 and is projected to broadly
stabilise in 2018-2019. This improvement is to
a large extent driven by strong economic
growth. In the short term, no major risks to
fiscal sustainability are foreseen. Longer term
risks stem primarily from high expected age-
related expenditure.
Measures taken to increase tax revenue are
bearing fruit. In 2017, tax revenues increased
significantly. This was due to the improved
macroeconomic conditions and to a number of
measures implemented in recent years. New
measures are also in the pipeline. Two
important challenges emerge in this respect:
ensuring permanency of stronger revenues and
preventing an increase in the cost of tax
compliance. In 2017, Poland did not tackle the
extensive use of reduced VAT rates. This
results in large foregone tax revenues and
overly complicates the tax system.
Overall, the fiscal framework is strong.
Fiscal rules are effective and stable. The
authorities plan to address deficiencies in
budgetary planning and procedures. Poland is,
however, the only EU Member State that has
not yet set up an independent fiscal council.
The effectiveness and efficiency of increased
social spending and future pension adequacy
raise concerns. Higher social benefits are
expected to further reduce poverty and
inequality that have continued to decline for
several years. However, some elements of the
benefit system appear to be creating
disincentives to work, in particular for the low-
skilled. Unless effective counteracting
measures are taken, the significantly lowered
statutory retirement age will depress pensions
with consequences for inequality and poverty
among older people. A comprehensive
assessment of the efficiency of the social
benefit system is currently not available.
Safeguarding the resources to support
important social policy areas, such as health
and long-term care, is likely to be challenging.
Work to improve the management of public
expenditure has started. Since many recent
measures structurally increase public
expenditure, its effective management is of
crucial importance for both short-term and
long-term fiscal sustainability. Poland has
initiated work to reform the budgetary process
with a view to increase the effectiveness and
efficiency of spending.
The banking sector has remained liquid and
well capitalised. Banks’ profitability has been
reduced by low interest rates, the tax on
financial sector assets and higher contributions
to bank guarantee and relief funds. Risks
related to loans in foreign currency are
gradually diminishing. While a wide range of
related legislative proposals were tabled, none
have as yet been adopted.
The role of strong, independent financial
supervision is increasingly important. This is
especially relevant given the recently
strengthened links between the financial sector
and the public sector, in particular as the state
now controls the two largest banks and the
largest insurer.
Labour market situation is the best in recent
history; yet, getting more people to work
would ease labour shortages. Employment
rates have continued to rise (above 70 % for
those aged 20-64 in 2017), to the point that
labour shortages are affecting business activity.
Barriers to labour market participation include
disincentives to work originating from the
benefit system and limited access to long-term
care and childcare. Arrangements for a better
work-life balance, including part-time work,
are not widely provided. These barriers are
particularly relevant for groups with lower
activity rates: women, low-skilled people, and
older and disabled people. Permanent
employment has been rising fast, but the share
of temporary contracts remains high. High
incidence of self-employment and other
atypical work combined with weaker welfare

Executive summary
3
coverage of these workers creates risks. Labour
mobility is hampered by sector-specific
arrangements (such as the special social
security system for farmers), shortcomings in
the housing market and transport infrastructure.
After a steady rise in immigration to Poland in
recent years, non-EU workers (especially from
Ukraine) now play an important role in the
Polish labour market.
A continued upskilling of the labour force is
crucial to improve employability and to
foster innovation. The currently low number
of adults in education and training and its
impact on skills and competences is an obstacle
to employment. However, the Polish education
system has two strong features: a high
percentage of tertiary graduates and good basic
skills at completion of lower secondary school.
Developing independent, creative and critical
thinking and learning is a key challenge for all
levels of the education and training system.
An improved access to healthcare is key to
better health outcomes. This is particularly
challenging given the low level of public
funding and the low number of doctors and
nurses. In 2017, some efforts were made to
distribute healthcare resources more efficiently.
The business environment overall is
favourable, while investment remains
restrained by barriers related to the quality
of regulation and investor-uncertainty.
Private investment has been low for many
years, while public investment has benefitted
from the wide-spread use of EU funds. The
regulatory framework and other barriers to the
expansion of firms are affecting investment
activity and productivity. Work continues on
some legislative proposals to improve the
conditions for business activity. High
uncertainty, resulting, e.g., from abrupt
regulatory changes, appears to hinder
investment. Inadequate financing may also be a
constraint for some companies. Effective and
efficient public administration, including
procedures for public procurement, spatial
planning, and building permits is key for the
country’s investment climate and regional
development. State-owned and state-controlled
companies continue to gain importance.
Poland adopted reforms of the justice
system which led the Commission to
conclude that there is a clear risk of a
serious breach of the rule of law. An efficient
and independent judicial system is beneficial
for the business environment. Since late 2015,
the Polish authorities have adopted several
laws affecting the structure of the justice
system. The reforms should be carried out in a
way which protects the independence of the
judiciary. In this regard, the Commission has
concluded that a clear risk of a serious breach
of the rule of law exists in Poland within the
meaning of Article 7(1) of the Treaty on
European Union. The Commission also set out
the ways in which this risk could be addressed.
Poland’s efforts to increase the economy’s
innovative capacity have not yet translated
into a significant rise in innovative outputs.
Developing the science base is a critical
challenge for improving scientific excellence
and translating it into innovative market results.
A number of steps towards increasing private
sector innovation have been taken, including
tax incentives for R&D expenditures. Their
effects, however, risk being delayed by limited
collaboration between business and research
institutions, among other factors.
Poland continues to develop its
infrastructure. The road network continues to
improve, with the support of EU funds.
Modernisation of the railway network is also
progressing, although slowed by a lack of long-
term planning and shortcomings in investment
project management. Fixed broadband
coverage is low and only partially offset by
mobile broadband take-up.
Poland faces challenges in moving towards
cleaner energy sources. The electricity sector
relies heavily on coal-fired generation. The
transition to cleaner sources risks being
delayed by legislative changes that in some
areas impose de facto prohibitive conditions for
renewable energy installations. Limiting
greenhouse gas emissions from energy,
transport and industry remains a key concern
from a climate perspective. High air pollution
remains a major health-related concern.

4
GDP growth
Poland is experiencing strong economic growth.
Domestic demand has been the dominant growth
driver for the last 3-4 years. In 2016 and 2017,
private consumption contributed the most to
growth, given the weak performance of investment
during that period. Private consumption was
supported by favourable labour market conditions,
increased fiscal transfers and record-high
consumer confidence. Estimated at 4.6 % in 2017,
real GDP growth was among the highest in the EU.
Graph 1.1: Contributions to real GDP growth, 2008-2019
Source: Eurostat, European Commission
Weak investment continued in the first three
quarters of 2017. Public investment started to
recover in Q2 2017 thanks to an increasing
utilisation of EU structural funds. Private
investment trends differed between sectors,
reflecting a range of economy-wide and sector-
specific factors. Sectors with a significant share of
state-owned or state-controlled enterprises such as
energy, mining and other public utilities recorded a
particularly weak investment performance.
Growth is projected to remain strong in 2018
and 2019. An increasing utilisation of EU funds is
expected to provide a strong stimulus to public
and, to a lesser extent, private investment. Private
consumption growth is projected to moderate from
exceptionally high readings in 2017, while still
remaining robust. It will be supported by strong
wage increases. Strong domestic demand is
forecast to translate into higher imports, but
favourable developments in foreign markets
should support a continued expansion of exports.
As a result, real GDP growth is projected to reach
4.2 % in 2018 and 3.6 % in 2019.
Potential growth
Potential growth has moderated in recent years,
mainly due to a slower increase in productivity
and lower investments. Capital accumulation
contributed the most to potential growth,
especially in 2007-2011, but since then this
contribution declined (Graph 1.2). The slowdown
in total factor productivity (TFP) growth was more
pronounced. Its contribution to potential growth
dropped. It fell from above 3 percentage points up
to around 2003 to around 2 percentage points
during 2005-2010 and to around 1 percentage
point in more recent years. However, some
rebound is expected in the coming years.
Significantly rising employment rates were
supporting potential growth during the last decade.
Graph 1.2: Estimated potential growth and its
components, 2007-2019
Source: European Commission
In the future, the labour market is expected to
be a drag on potential growth. Poland’s
population has been falling since 2013, while the
working age (15-74) population has been slowly
shrinking already since 2008 and is projected to
continue declining in the decades to come. The
most recent Eurostat's projection sees working age
population (aged 15-74) falling by around 18 %
between 2015 and 2050 (see also European
-4
-2
0
2
4
6
8
10
07 08 09 10 11 12 13 14 15 16 17 18 19
%, pps
Inventories investment Investment (GFCF)
Consumption Net exports
Real GDP growth
forecast
0
0.5
1
1.5
2
2.5
3
3.5
4
4.5
5
07 08 09 10 11 12 13 14 15 16 17 18 19
TFP
Capital
Labour
PPS
1. ECONOMIC SITUATION AND OUTLOOK
1. Economic situation and outlook
5
Commission, 2017a). Migration flows are likely to
be an increasingly important factor for future
working age population trends. Fertility rates,
currently very low despite a small improvement in
2017, are expected to play only a limited role.
Given the current record low unemployment rate,
further gains in labour force participation and
investment in skills become key for the potential
growth outlook (Section 3.3).
Capital accumulation is expected to remain
muted in the near future, while the longer term
outlook will depend on a combination of
factors. In the long run, investment can play a
stronger role of supporting potential growth in
Poland. The capital-output ratio in Poland has
hovered around two for the last few years, whereas
it was closer to three (although declining) in the
Czech Republic and Germany. Future investment
developments will be determined in particular by
perceptions of macroeconomic prospects and
stability and the quality of institutions, including
the rule of law and policy and regulatory
environment.
Labour market
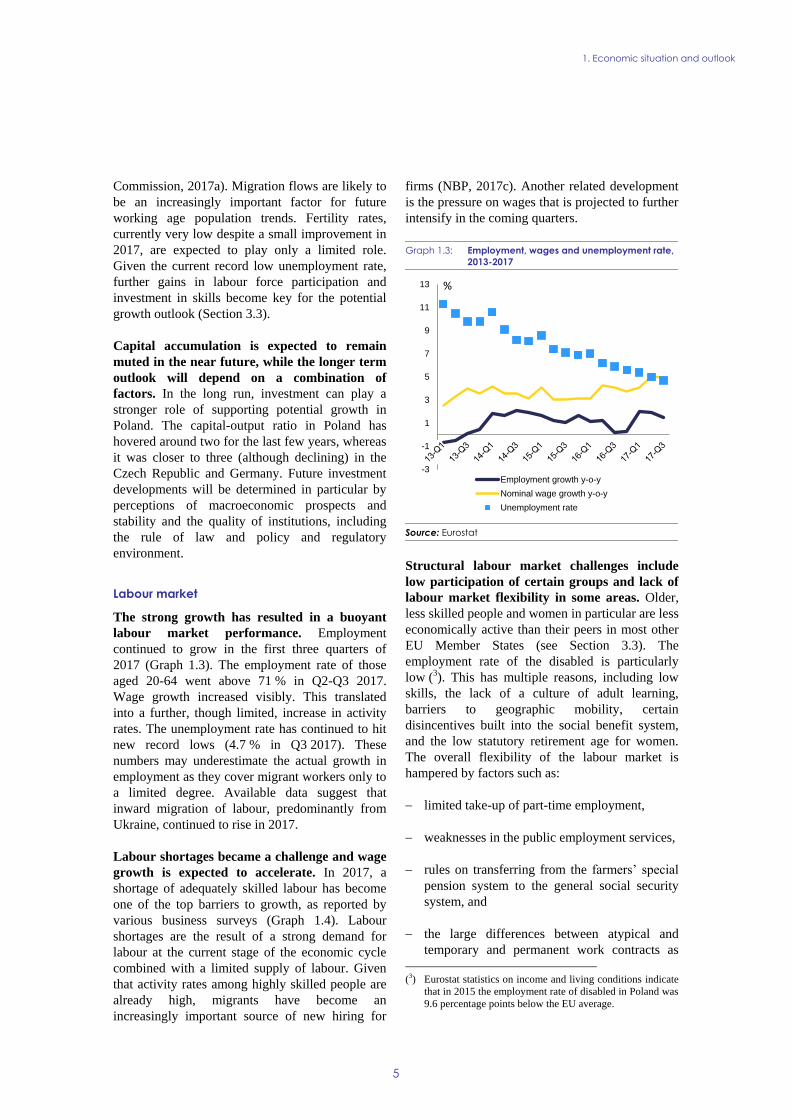
The strong growth has resulted in a buoyant
labour market performance. Employment
continued to grow in the first three quarters of
2017 (Graph 1.3). The employment rate of those
aged 20-64 went above 71 % in Q2-Q3 2017.
Wage growth increased visibly. This translated
into a further, though limited, increase in activity
rates. The unemployment rate has continued to hit
new record lows (4.7 % in Q3 2017). These
numbers may underestimate the actual growth in
employment as they cover migrant workers only to
a limited degree. Available data suggest that
inward migration of labour, predominantly from
Ukraine, continued to rise in 2017.
Labour shortages became a challenge and wage
growth is expected to accelerate. In 2017, a
shortage of adequately skilled labour has become
one of the top barriers to growth, as reported by
various business surveys (Graph 1.4). Labour
shortages are the result of a strong demand for
labour at the current stage of the economic cycle
combined with a limited supply of labour. Given
that activity rates among highly skilled people are
already high, migrants have become an
increasingly important source of new hiring for
firms (NBP, 2017c). Another related development
is the pressure on wages that is projected to further
intensify in the coming quarters.
Graph 1.3: Employment, wages and unemployment rate,
2013-2017
Source: Eurostat
Structural labour market challenges include
low participation of certain groups and lack of
labour market flexibility in some areas. Older,
less skilled people and women in particular are less
economically active than their peers in most other
EU Member States (see Section 3.3). The
employment rate of the disabled is particularly
low (3). This has multiple reasons, including low
skills, the lack of a culture of adult learning,
barriers to geographic mobility, certain
disincentives built into the social benefit system,
and the low statutory retirement age for women.
The overall flexibility of the labour market is
hampered by factors such as:
limited take-up of part-time employment,
weaknesses in the public employment services,
rules on transferring from the farmers’ special
pension system to the general social security
system, and
the large differences between atypical and
temporary and permanent work contracts as
(3) Eurostat statistics on income and living conditions indicate
that in 2015 the employment rate of disabled in Poland was
9.6 percentage points below the EU average.
-3
-1
1
3
5
7
9
11
13
Employment growth y-o-y
Nominal wage growth y-o-y
Unemployment rate
%

1. Economic situation and outlook
6
regards the costs associated with employment
protection.
Graph 1.4: Share of companies indicating shortage of
labour among factors limiting activity in
selected sectors, 2000-2017
Source: Central Statistical Office
Inequality
Strong growth of incomes of less affluent
households lowered inequality. Income
inequality in Poland has been falling for several
years (Graph 1.5). Based on the most commonly-
used indicators, it fell below the EU average by
around 2012 and has stayed slightly below it since
then (4). This improvement can be explained by a
combination of rising employment and wages, and
certain changes in the tax and benefit system. The
most recent benefit changes (not yet fully reflected
in available data) are expected to have further
lowered income inequality.
The role of social benefits in reducing
inequalities is expected to increase while various
factors affect the equality of opportunities. The
tax and benefit system as a whole used to play a
relatively limited role in reducing inequality
(4) The ratio of the total income received by the 20 % of the
population with the highest income to that received by the
20 % of the population with the lowest income (S80/S20
income quintile share ratio) declined to 4.8 in 2015. This
placed Poland in the middle of the EU countries for this
indicator. For the EU as a whole, S80/S20 equalled 5.2 in
that year. These data are based on 2016 EU-SILC survey
that refer to the previous year for all Member States except
Ireland and the United Kingdom.
(European Commission 2017b). Within the tax-
benefit system, it is mainly the pension system
which has the most significant impact on reducing
income inequality and the risk of poverty.
However, recent changes in social benefits appear
to have increased the impact of these benefits on
the redistribution of income. Difficulties pertain to
accessing healthcare as well as early childcare and
pre-school education. This can increase the
inequality of opportunities (see Section 3.3). While
the education system as a whole appears to have
reduced inequalities, recent changes to the school
structure may limit this role in the future. This is
because the separation into vocational and general
education tracks will now happen after less years
of school (5).
Graph 1.5: Gini coefficient of disposable income, 2005-
2016
(1) SILC stands for the Survey of Income and Living
Conditions. HBS stands for the Household Budget Survey.
Data labelled year T refer to the income situation in year T.
The Gini coefficient takes values between 0 and 100 and is a
measure of equality of distribution. Higher values indicate a
higher level of inequality.
Source: Central Statistical Office and Eurostat
External position
External competitiveness remains strong.
Poland has been consistently increasing its share in
total world exports, by around one third over the
decade up to 2016. The strong performance of
services trade has been reflected in a gradually
increasing surplus in trade in services.
Telecommunications, computer, and information
services, transport and other business services saw
(5) For analysis see e.g. IBE (2014), Woessmann (2016).
0
10
20
30
40
50
60
2000
2000
2001
2002
2003
2004
2005
2006
2007
2008
2009
2010
2011
2011
2012
2013
2014
2015
2016
2017
Manufacturing(skilled labour)
Construction(skilled labour)
Retail Trade-(all labour)
%
29
30
31
32
33
34
35
2005
2006
2007
2008
2009
2010
2011
2012
2013
2014
2015
2016
EU27 (SILC) PL (SILC) PL (HBS)

1. Economic situation and outlook
7
their global export shares rising quite strongly
during the last decade. The cost competitiveness of
exports has been supported by contained unit
labour costs growth and a stable EUR/PLN
exchange rate.
The composition of export of goods is changing
gradually, with average quality remaining
below the EU average. The composition of
exports reflects competitive advantages of the
Polish economy. Production costs below the EU
average are associated with the average quality of
Polish manufacturing exports to other EU
countries remaining below the EU average (Graph
1.6) (6). For some sectors, such as computer,
electronic and optical products or furniture, the
average quality has been improving in recent
years. In other sectors, the quality has been
stagnating or declining compared to the EU
average. In the future, the export performance of
the economy will be determined by the extent to
which the expected faster growth of labour and
other production costs lead to a gradual shift in
export composition towards high-tech, high-
quality products.
The current account remained close to balance
in 2017. The current account position has been
broadly stable since mid-2015, gradually moving
towards a balanced position. This results from
consistent deficits in the primary income balance
(around 4 % of GDP), a high and growing surplus
in the trade of services (around 3.5 % of GDP as of
late 2017) and a minimal surplus in the trade of
goods (below 0.5 % of GDP).
Poland's negative net international investment
position (NIIP) widened slightly. The NIIP
was -63 % of GDP at the end of Q3 2017. This
slight widening followed rapid improvement in the
position in late 2016, and these swings mainly
reflect changes in official reserves. The
accumulated stock of net foreign direct
investments (nearly 37 % of GDP in Q3 2017)
accounts for the major part of the NIIP. Given the
relative stability of direct investments, this limits
the risks associated with a negative NIIP.
(6) The averages are calculated for 23 broad categories of the
statistical classification of economic activities. The quality
is proxied by an index estimated using the methodology of
Vandenbussche (2014).
Graph 1.6: Average quality rank of manufacturing exports
to the EU, 2016 and 2011
(1) The 7 sectors shown accounted for 63 % of
manufacturing exports to the EU in 2016. The EU average
import quality from all EU other Member States, US, China
and Japan is around 0.5.
Source: European Commission calculations based on
Comext and Orbis databases.
Price developments
Consumer price inflation gradually increased in
the second half of 2017, and this trend is
expected to continue. Swings in energy and food
prices had the strongest impact on inflation
(measured by the harmonised index of consumer
prices – HICP) during 2017. After an initial surge
at the end of 2016 and in early 2017, HICP
inflation first decreased and then went above 1.5 %
later in the year. The index targeted by the central
bank followed a very similar path, increasing to
2.5 % in November, before falling in December.
Core inflation (excluding energy and unprocessed
food) stayed in a narrow band between 1 % and
1.5 % since March 2017. Stronger wage growth is
projected to translate into higher price increases
especially in the services sector. Overall HICP
inflation is expected to reach 2.5 % in the middle
of 2018 and stay just below 3 % in late 2019. Price
pressures from higher wage growth are expected to
be counterbalanced by low foreign inflation and
broadly stable energy prices.
2017 was a good year for asset prices. The main
index of the Warsaw Stock Exchange was rising
throughout 2017, increasing by 23 % since end-
2016. Shares performed well across the sectors,
including in the energy and financial sectors. This
0.0 0.5 1.0
Furniture
Chemicals And Chemical Products
Machinery And Equipment N.E.C.
Electrical Equipment
Computer, Electronic And OpticalProducts
Food Products
Motor Vehicles, Trailers And Semi-Trailers
2011
2016
Average quality rank (1 = the highest)

1. Economic situation and outlook
8
followed the general trend in European markets,
and was broadly in line with developments in other
Central European markets. House prices were on
the rise, although the pace remained modest –
around 5 % annually in the secondary market in
the largest cities.
Monetary policy
The National Bank of Poland has kept interest
rates unchanged since March 2015 despite a
gradual rebound in inflation and stronger wage
growth. The central bank sees the strong impact of
external factors (especially global energy and food
prices) driving inflationary trends. The statements
issued by Poland’s Monetary Policy Council
stressed the relatively low core inflation, despite
stronger wage growth. The Council expected
inflation to remain close to the target over the
projection horizon. As a result, in early 2017 real
interest rates turned negative. This has likely
contributed to some changes in the structure of
bank deposits (see Section 3.2) and might have
been a factor supporting housing demand.
Financial sector
The banking sector remains strong and resilient
with adequate profitability. Strong capital
buffers, comfortable liquidity and sound asset
quality limit the risks to financial stability. After
falling between 2014 and 2015, banks’
profitability appears to have stabilised, although
the situation differs among banks. The inter-
linkages between the financial sector and the state
have grown for two reasons. First, state ownership
in the sector increased in 2017 with the two largest
banks now directly or indirectly controlled by the
state. Moreover, the design of the tax on financial
sector assets gives an incentive to banks to hold a
substantial amount of government bonds (around
40 % of the outstanding amount of Polish
sovereign bonds). The problems of the small
segment of credit unions are being dealt with. The
risks related to uncertain outcome of policy
discussions on reducing the remaining stock of
foreign currency-denominated mortgage loans
appear to have receded somewhat in 2017.
Public finances
The headline deficit contracted in 2017,
primarily due to stronger revenues. A
combination of strong growth in wages, private
consumption and imports, better collection of VAT
and lower-than-projected investment expenditure
facilitated a continued decline in the general
government deficit. In 2017, it is estimated to have
significantly decreased from 2.5 % of GDP in
2016. Based on the Commission’s autumn 2017
forecast, the deficit should remain broadly stable in
2018 and 2019.
Projections suggest an expansionary fiscal
stance in 2018. While the headline deficit should
remain broadly stable, the fiscal situation looks
differently when considering the structural fiscal
balance, i.e. the balance adjusted for the economic
cycle and excluding one-off and temporary
measures. Following a period of fast decline until
2015, the estimated structural deficit remained
broadly stable. The Commission autumn 2017
forecast predicts a gradual increase in the
structural deficit in 2018 and 2019 (Graph 1.7).
Hence, despite a favourable economic situation,
the structural deficit remains far from the medium-
term objective of 1 % of GDP (7). In 2016 and
2017 public spending increased also due to the
lowering of the statutory retirement age and the
introduction of a child benefit. This puts more
pressure on the structural deficit, as other
expenditure items were not adjusted. By
consequence, the room for countercyclical fiscal
policy will be more limited when economic
conditions worsen. Public expenditure for these
two items is rather inelastic and cannot be easily
adjusted over the economic cycle.
The general government debt decreased from
its 2016 peak and is projected to broadly
stabilise. A combination of faster nominal
economic growth, a lower headline deficit and
appreciation of the zloty contributed to the decline
in the general government debt-to-GDP ratio in
2017 (from 54.1 % at the end of 2016). The public
debt is expected to broadly stabilise until the end
of 2019.
(7) A medium-term budgetary objective is a budget deficit (or
surplus) target defined in structural terms. This means that
business cycle swings are taken into consideration and the
effects of one-off and other temporary measures are filtered
out.

1. Economic situation and outlook
9
Graph 1.7: Headline and structural fiscal balances, 2011-
2019
Source: European Commission
-7
-6
-5
-4
-3
-2
-1
0
1
2
3
2010
2011
2012
2013
2014
2015
2016
2017
2018
2019
Structural fiscal balance Output gap
Headline fiscal balance
forecast% of GDP

1. Economic situation and outlook
10
Table 1.1: Key economic, financial and social indicators - Poland
(1) NIIP excluding direct investment and portfolio equity shares .
(2) Domestic banking groups and stand-alone banks, EU and non-EU foreign-controlled subsidiaries and EU and non-EU
foreign-controlled branches.
Source: Eurostat and ECB as of 30 Jan 2018, where available; European Commission for forecast figures (Winter forecast 2018
for real GDP and HICP, Autumn forecast 2017 otherwise)
2004-07 2008-12 2013-14 2015 2016 2017 2018 2019
Real GDP (y-o-y) 5.5 3.5 2.3 3.8 2.9 4.6 4.2 3.6
Potential growth (y-o-y) 3.6 4.0 3.0 3.1 2.9 3.1 3.3 3.4
Private consumption (y-o-y) 4.1 3.4 1.4 3.0 3.9 . . .
Public consumption (y-o-y) 3.9 1.7 3.3 2.4 1.7 . . .
Gross fixed capital formation (y-o-y) 12.3 2.5 4.3 6.1 -7.9 . . .
Exports of goods and services (y-o-y) 10.0 5.1 6.4 7.7 8.8 . . .
Imports of goods and services (y-o-y) 12.0 3.0 5.8 6.6 7.9 . . .
Contribution to GDP growth:
Domestic demand (y-o-y) 5.7 2.9 2.3 3.4 1.0 . . .
Inventories (y-o-y) 0.7 -0.3 -0.2 -0.2 1.2 . . .
Net exports (y-o-y) -1.0 0.8 0.3 0.6 0.7 . . .
Contribution to potential GDP growth:
Total Labour (hours) (y-o-y) 0.1 0.5 0.6 0.5 0.5 0.5 0.4 0.4
Capital accumulation (y-o-y) 1.3 1.9 1.5 1.7 1.3 1.3 1.4 1.4
Total factor productivity (y-o-y) 2.2 1.6 0.9 0.9 1.1 1.3 1.5 1.6
Output gap -0.7 1.5 -1.3 -0.5 -0.5 0.6 1.1 1.1
Unemployment rate 15.1 8.9 9.7 7.5 6.2 5.0 4.2 4.0
GDP deflator (y-o-y) 3.2 3.0 0.4 0.8 0.4 2.1 2.0 2.5
Harmonised index of consumer prices (HICP, y-o-y) 2.4 3.7 0.4 -0.7 -0.2 1.6 2.1 2.6
Nominal compensation per employee (y-o-y) 3.1 5.9 1.9 1.7 4.4 4.8 5.7 7.1
Labour productivity (real, person employed, y-o-y) 2.6 3.0 1.5 2.3 2.3 . . .
Unit labour costs (ULC, whole economy, y-o-y) 0.4 2.8 0.4 -0.6 2.1 2.1 2.6 3.8
Real unit labour costs (y-o-y) -2.7 -0.2 0.0 -1.3 1.7 0.0 0.6 1.3
Real effective exchange rate (ULC, y-o-y) 3.1 -1.6 0.3 -3.2 -2.8 4.4 4.2 1.9
Real effective exchange rate (HICP, y-o-y) 3.6 -1.2 0.6 -2.1 -3.5 2.2 4.0 .
Savings rate of households (net saving as percentage of net
disposable income) 2.2 0.7 -0.2 -0.4 1.7 . . .
Private credit flow, consolidated (% of GDP) 6.5 6.9 4.0 3.5 4.6 . . .
Private sector debt, consolidated (% of GDP) 46.3 70.3 76.8 78.9 81.6 . . .
of which household debt, consolidated (% of GDP) 17.3 33.0 35.3 36.0 36.7 . . .
of which non-financial corporate debt, consolidated (% of GDP) 29.0 37.3 41.4 42.9 44.9 . . .
Gross non-performing debt (% of total debt instruments and total
loans and advances) (2) 3.9 5.7 5.7 5.0 4.7 . . .
Corporations, net lending (+) or net borrowing (-) (% of GDP) 1.1 5.1 7.6 8.0 5.7 6.6 6.4 6.6
Corporations, gross operating surplus (% of GDP) 22.4 23.8 25.1 25.9 24.8 25.6 25.6 25.8
Households, net lending (+) or net borrowing (-) (% of GDP) -1.9 -2.8 -2.7 -2.8 -1.5 -2.2 -2.4 -2.6
Deflated house price index (y-o-y) . . -1.8 2.6 2.5 . . .
Residential investment (% of GDP) 3.4 3.3 3.0 2.5 3.0 . . .
Current account balance (% of GDP), balance of payments -4.6 -5.0 -1.7 -0.6 -0.3 0.0 -0.7 -0.9
Trade balance (% of GDP), balance of payments -2.3 -2.1 1.6 3.1 4.0 . . .
Terms of trade of goods and services (y-o-y) 1.5 -0.5 1.5 2.4 0.8 1.3 -0.1 -0.1
Capital account balance (% of GDP) 0.6 1.7 2.4 2.4 1.1 . . .
Net international investment position (% of GDP) -44.2 -61.2 -69.0 -62.1 -60.7 . . .
Net marketable external debt (% of GDP) (1) -10.4 -24.0 -26.7 -26.0 -22.9 . . .
Gross marketable external debt (% of GDP) (1) 36.8 51.9 57.1 58.4 61.0 . . .
Export performance vs. advanced countries (% change over 5 years) 69.2 37.7 9.8 11.2 14.8 . . .
Export market share, goods and services (y-o-y) 8.9 0.4 5.4 2.4 6.2 . . .
Net FDI flows (% of GDP) -3.5 -1.9 -1.6 -2.1 -1.2 . . .
General government balance (% of GDP) -3.6 -5.3 -3.9 -2.6 -2.5 -1.7 -1.7 -1.9
Structural budget balance (% of GDP) . -5.9 -3.1 -2.3 -2.2 -2.1 -2.3 -2.5
General government gross debt (% of GDP) 45.6 51.3 53.0 51.1 54.1 53.2 53.0 53.0
Tax-to-GDP ratio (%) 34.2 33.1 32.9 33.3 34.4 35.1 35.3 35.3
Tax rate for a single person earning the average wage (%) 28.2 24.7 24.3 24.9 25.0 . . .
Tax rate for a single person earning 50% of the average wage (%) 25.6 22.5 21.9 23.2 23.3 . . .
forecast

11
Progress with implementing the
recommendations addressed to Poland in 2017
has to be seen as part of a process which started
with the introduction of the European Semester
in 2011. Looking at the multi-annual assessment of
the implementation of the CSRs since these were
first adopted, Poland implemented 44 % of all the
CSRs with at least 'some progress', while in 56 %
of CSRs Poland recorded 'limited' or 'no progress'
(see Graph 2.1). Some CSRs in the fields of public
finance and product markets have been fully
implemented or saw 'substantial progress' with
introduction of the expenditure rule and
liberalisation of access to the professional services.
Some measures tackling the labour market
segmentation and participation helped to achieve
'some progress' for labour market related CSRs.
The introduction of tax incentives and improving
access to finance for R&D activities was also
assessed as achieving 'some progress' in relevant
CSRs. Only limited progress was observed in life-
long learning, enforcing contracts, and removing
obstacles to infrastructure investment. There was
no progress in reforming special pension regimes
for farmers and miners, in establishing an
independent fiscal council and limiting the use of
reduced VAT rates. As the statutory pension age
increase was reversed in 2017, there is also no
progress in this area.
Poland corrected its excessive deficit and
increased tax compliance, but only limited or no
progress was observed in other public finance
areas. Poland had corrected its excessive fiscal
deficit and the corresponding excessive deficit
procedure was closed in 2015. No progress was
made to limit the extensive use of reduced VAT
rates, but a number of effective measures to
increase tax compliance, in particular regarding
VAT, were implemented. At the same time, work
to reform budgetary planning and processes was
initiated. Efforts were made to tackle the long-term
sustainability of public finances, with a 2012
reform gradually increasing the statutory
retirement age to 67 years. However, the reversal
of the statutory retirement age increase
implemented in October 2017 (back to 65 years for
men and 60 for women) was not accompanied by
substantial measures to increase the effective
retirement age. Only limited action was taken to
reform special pension arrangements, and the
measures did not cover miners and farmers.
Graph 2.1: Overall multiannual implementation of 2011-
2017 CSRs to date
* The overall assessment of the country-specific
recommendations related to fiscal policy excludes
compliance with the Stability and Growth Pact
** 2011 annual assessment: Different CSR assessment
categories
** The multiannual CSR assessment looks at the
implementation until 2018 Country Report since the CSRs
were first adopted.
Source: European Commission
Poland has been tackling labour market
segmentation but at the same time took actions
with a mixed impact on labour market
participation. Poland has been continuing actions
to tackle labour market segmentation by limiting
the possibility to abuse temporary employment,
increasing social security contributions on some
non-standard labour contracts and introducing
minimum hourly wage for some of these contracts.
In addition, new labour codes are being prepared.
Poland has also increased the availability of
childcare so that more women can work. However,
increasing the school starting age and removing
the obligation for five-year-olds to attend pre-
school have the opposite effect. Some steps were
taken to address the recommendations on
vocational education and training. The lifelong
learning strategy was adopted in September 2013,
but coordination of adult learning policy is not
efficient and there has been no increase in
participation. The decrease of the statutory
retirement age is likely to reduce the number of
people working or actively looking for a job.
18%
38%
36%
5%
3%
No Progress
Limited Progress
Some Progress
SubstantialProgress
FullImplementation
2. PROGRESS WITH COUNTRY-SPECIFIC RECOMMENDATIONS

2. Progress with country-specific recommendations
12
Poland has been continuously improving its
transport and energy infrastructure. While the
pace of road transport investment is satisfactory,
the rail sector is still lagging behind due to
problems with timely preparation and
implementation of rail projects. Infrastructure
investment hinges to a large extent on EU funding
and is thus prone to cyclical peaks and downturns.
This adversely affects the stability of the
construction sector. Progress was observed in
developing domestic energy transmission and
distribution networks. This included opening of the
liquefied natural gas terminal and some new power
generation capacity. Investment in gas and
electricity interconnectors has been delayed, while
recent legislative changes hindered the
development of renewables.
Overall, Poland has made limited progress (8) in
addressing the 2017 CSRs. Limited progress was
made in addressing recommendations on public
(8) Information on the level of progress and actions taken to
address the policy advice in each respective subpart of a
CSR is presented in the Overview Table in the Annex. This
overall assessment does not include an assessment of
compliance with the Stability and Growth Pact.
Table 2.1: Assessment of 2017 country-specific recommendations
Overall assessment of progress with 2017 CSRs: Limited
CSR 1: Pursue a substantial fiscal effort in 2018, in line with the requirements of the preventive arm of the Stability and Growth Pact, taking into account the need to strengthen the ongoing recovery and to ensure the sustainability of Poland’s public finances. Take steps to improve the efficiency of public spending and limit the use of reduced VAT rates.
Limited progress
Limited progress has been made in improving the efficiency of public spending.
No progress was made on limiting the extensive use of reduced VAT rates.
CSR 2: Take steps to increase labour market participation, in particular for women, the low-qualified and older people, including by fostering adequate skills and removing obstacles to more permanent types of employment. Ensure the sustainability and adequacy of the pension system by taking measures to increase the effective retirement age and by starting to reform the preferential pension arrangements.
Limited progress
Limited progress in measures to increase participation in the labour market. Some policy measures can be expected to increase activity. No government decision has been made on the reform of the higher education. Lowered statutory retirement age acts towards limiting labour market participation.
No progress in ensuring the sustainability and adequacy of the pension system. No progress in measures to increase the effective retirement age. No progress in reforming the preferential pension arrangements.
CSR 3: Take measures to remove barriers to investment, particularly in the transport sector.
Limited progress
No progress in ensuring legal certainty and trust in the quality and predictability of policies and institutions. Limited progress in simplifying construction-related procedures. Some progress in removing obstacles to investment in the transport sector.
* This overall assessment of CSR1 does not include an assessment of compliance with the Stability and Growth Pact.

2. Progress with country-specific recommendations
13
finance. First steps were undertaken to reform the
budgetary framework, while the extensive use of
reduced VAT rates was not addressed. There has
been limited progress with the recommendation to
increase labour force participation. In addition, no
measures were taken to increase the effective
retirement age and to reform special pension
arrangements. There was also limited progress on
removing obstacles to investment, including the
transport sector.
The European Structural and Investment (ESI)
Funds are pivotal in addressing key challenges
to inclusive growth and convergence in Poland.
Notably, these include improving investment and
business conditions, promoting R&D in the private
sector and strengthening links between research
and industry, and reducing obstacles to railway
investments by fostering planning and
administrative capacities. The ESI Funds also
support women's participation in the labour
market, particularly through developing childcare
facilities, strengthening links between vocational
training and adult learning and the labour market.
Member States can request from the
Commission technical support to prepare,
design, and implement growth-enhancing
structural reforms. The Structural Reform
Support Service (SRSS) provides, in cooperation
with the relevant Commission services, tailor-
made technical support, which does not require co-
financing and is provided at a Member State's
request. The support addresses priorities identified
in the context of the EU economic governance
process (i.e., implementation of country-specific
recommendations), but the scope of the SRSS
support is wider as it can also cover reforms linked
to other Commission priorities, or reforms
undertaken at the initiative of Member States.
Poland has requested technical support from
the SRSS to help implement reforms in various
areas such as: public administration, growth and
the business environment, public financial
management, taxation, and the financial sector. In
particular, the SRSS provides support to strengthen
the administrative capacity of the National
Revenue Administration, improve public financial
management, and enhance research, development
and innovation.

2. Progress with country-specific recommendations
14
Box 2.1: Tangible results delivered through EU support to structural change in Poland
Poland is the largest beneficiary of the European Structural and Investment Funds (ESI Funds)
support and can receive up to EUR 86 billion until 2020. This represents around 3 % of GDP annually over
the period 2014-2018 and 56% of public investment (1). By 31 December 2017, an estimated EUR 48 billion
(55 % of the total) was allocated to projects on the ground. This has paved the way for over 750 enterprises
to cooperate with research institutions; over 1 700 firms are being supported to introduce new products to
their markets; the capacity of childcare infrastructure is raised to accommodate an additional 146 000
children. Out of the EU financing, EUR 3.4 billion is to be delivered via financial instruments, which is a
three-fold increase compared to the 2007-2013 period.
ESI Funds help address structural policy challenges and implement country-specific
recommendations. Actions financed cover, among others, promoting R&D in the private sector;
strengthening links between R&D, innovation and industry; improving investment conditions and the easing
of registering business; reducing obstacles to railway investments by fostering project planning and building
administrative capacities; supporting women's participation in the labour market, particularly through
developing childcare facilities; strengthening links between vocational training and the labour market and
adult learning development. The Catching-up Regions Initiative aims at enhancing technology transfers
between academia and business, helping speeding up and easing administrative processes related to business
registration, spatial planning and business inspections; and aims at improving the employability of graduates
of secondary schools.
Various reforms were undertaken already as precondition for ESI Funds support (2). Smart
Specialisation Strategies for research and innovation were developed to focus efforts on product
specialisation with strong market potential. This has also helped improve cooperation between enterprises
and public research institutions. The national and regional transport plans have allowed the timely
preparation of projects, implemented not only with support from ESI Funds, but also from the Connecting
Europe Facility, European Investment Bank (EIB) loans and national funding. Reform of public
procurement, including e-procurement is increasing the efficiency of public spending. The mapping of
health infrastructure intends to enhance coordination and targeting of investments improving access to
healthcare by shifting the system away from hospital based care towards ambulatory care. However, in
certain instances this has entailed additional amount of time and resources.
Poland is advancing the take up of the European Fund for Strategic Investments (EFSI). As of
December 2017, overall financing volume of operations approved under the EFSI amounted to EUR 2.5
billion, which is expected to trigger total private and public investment of EUR 8.9 billion. More
specifically, 35 projects under the Infrastructure and Innovation Window have been approved so far,
amounting to EUR 2.4 billion in EIB financing under the EFSI. This is expected to trigger nearly EUR 6.5
billion in investments (3). Under the SME Window, 9 agreements with financial intermediaries have been
approved so far. European Investment Fund financing enabled by the EFSI amounts to EUR 56 million,
which is expected to mobilise more than EUR 1.1 billion in total investment. Some 26 000 smaller
companies or start-ups will benefit from this support.
Funding under Horizon 2020, the Connecting Europe Facility and other directly managed EU funds is
additional to the ESI Funds. By the end of 2017, Poland has signed agreements for EUR 4.1 billion for
projects under the Connecting Europe Facility.
https://cohesiondata.ec.europa.eu/countries/PL
(1) Public investment is defined as gross fixed capital formation + investment grants + national expenditure on agriculture
and fisheries.
(2) Before programmes are adopted, Member States are required to comply with a number of so-called ex-ante
conditionalities, which aim at improving conditions for the majority of public investments areas.
(3) Figures relating to the Infrastructure and Innovation Window exclude multicountry projects.

15
Tax system
In Poland, the share of direct taxes, in
particular on labour, in total tax revenue is
lower than in the EU. In 2016, the overall tax-to-
GDP ratio at 34.4 % was lower than the EU
average of 40.0 %. This compares to, respectively,
33.3 % and 39.7 % in 2015. The difference in the
tax-to-GDP ratio was mainly driven by lower
revenue from taxes on labour in Poland, one of the
lowest in the EU. At the same time, revenue from
taxes on consumption remained close to the EU
average (9).
Tax compliance is improving. Stronger tax
collection is driven to a large extent by VAT
revenue. According to an EU wide study, the gap
between the VAT amount expected to be collected
and actually collected in Poland was 24.5 % in
2015, significantly above the EU average of
12.8 % (CASE/IAS, 2017). However, these
estimates do not yet reflect the effects of recent
reforms. The VAT gap is the only tax gap for
which there are comparative estimates for all EU
countries. The increase in tax revenues in 2016 and
notably in 2017 seems to indicate that the gap is
being significantly reduced (see Graph 3.1.1).
National estimates also confirm this trend. For
example, one source estimated that in 2017 around
one fourth of the 2016 VAT gap was closed (PwC,
2017). A strong increase in revenue from corporate
and personal income taxes is also visible.
Robust macroeconomic conditions and a
number of reforms helped to increase tax
revenue. The current buoyant macroeconomic
environment, including strong consumption and
rising inflation and wages (see Section 1), boosts
tax revenues. However, part of the recently
observed increase in tax revenue can be attributed
to efforts strengthening the legal framework with a
view to curbing tax evasion and avoidance (for
details see Box 3.1.1). They followed the
substantial reforms implemented in 2016 which
covered mainly VAT, excise duties and corporate
income tax (CIT) (European Commission, 2017a).
(9) The composition is based on European Commission
(2017c).
Graph 3.1.1: Tax revenue as % of GDP, 4 quarter moving
average
(1) other taxes exclude social security contributions
Source: European Commission
Poland continues its drive to tackle tax fraud.
Following the 2017 implementation of a large
number of changes to VAT and excise legislations,
further reforms are planned for 2018. They include
the implementation of: a voluntary split payment
for VAT (10), a law to prevent the use of the
financial sector for tax fraud (11), a register of
public receivables, on-line cash register, and the
tobacco package focusing on the tobacco product
trade.
(10) This consists of paying the invoiced amount to two
separate accounts:
– net value of a good / service to an account where the
supplier has full access;
– the amount of VAT to a VAT account from which the
supplier can pay its VAT obligations (to the tax authorities
or to its suppliers’ VAT accounts).
(11) The objective of the law is to be achieved via a risk
assessment using information from bank and credit union
accounts. The clearing house, based on information on
opened accounts and on transactions performed by
businesses, is to calculate on a daily basis a risk score to be
communicated to tax authorities. It will be then used by the
authorities to perform a risk analysis. In case of a suspicion
of tax fraud, tax authorities may block the account for 72
hours, with a possible extension to three months. A daily
analysis of information from taxpayers' accounts and the
possibility to block accounts based on a risk analysis are a
novelty in the Polish tax system, potentially raising
concerns regarding their proportionality.
0
5
10
15
20
25
2015-Q3 2016-Q3 2017-Q3
other taxes VAT revenue
% of GDP% of GDP
3. REFORM PRIORITIES
3.1. PUBLIC FINANCES AND TAXATION

3.1. Public finances and taxation
16
Box 3.1.1: Policy highlights: measures to improve tax compliance
In 2013-2016, Poland received country-specific recommendations to increase tax compliance. It has been
addressing this challenge through a number of legislative changes, in particular related to VAT. Their
implementation started in 2014 and significantly intensified in 2016-2017. Initially, anti-fraud measures
included reverse charge and joint responsibility of vendor and client for the payment of VAT in some
sectors. In 2016, the country modified a number of laws under the ‘fuel package’ with a view to curbing
organised VAT fraud activity in the fuel sector. Also in 2016, a general anti-avoidance rule for taxation
entered into force. In 2017, an amendment to the VAT law further extended the application of the reverse
charge mechanism and joint liability as well as limited the use of quarterly VAT returns. Additionally, some
100 000 companies were obliged to regularly submit to the tax authorities a standard audit file containing
transaction details. Also, the law on tracking the transport of certain goods became applicable. On top of
that, the tax and customs administrations merged and underwent a restructuring process. They were also
equipped with new IT tools facilitating detection of fraud.
Also, the scope of application of the Standard
Audit File was extended further to micro-
companies (some 1.5 million taxpayers) and an
amendment of the framework tax law is being
prepared.
The National Revenue Administration became
operational in 2017. To improve effectiveness
and create synergies, the customs and tax
administrations were merged into one body. The
new institution has more powers. The way tax
audits are performed has changed considerably.
For instance, in many cases the appeal against the
findings of an audit needs to be lodged with the
authority that issued it. This may limit the chances
of a positive outcome for businesses. There is
broad consensus that tax authorities need adequate
organisation, tools and powers to combat fraud
(European Commission, 2016a; IMF, 2015). It is
important, however, to ensure a proper balance so
that effective enforcement does not adversely
affect honest businesses, in particular small ones.
An efficient tax administration remains crucial
for systemic improvement in tax compliance.
The amount of resources invested in information
technology (IT) can be taken as a proxy for how
modernised a tax administration is and tends also
to go hand in hand with good performance. The
recurrent budget allocated to IT expenditures in
Poland was among the lowest in OECD countries,
at 1 % of the administration’s total budget in 2015
(OECD, 2017a). Although, the National Revenue
Administration became operational in early 2017,
some processes are still being developed and
remain fragmented, for example databases. To
date, IT applications have been developed to
process information collected from Standard Audit
Files and there are plans to set up an IT centre in
2018. Some effects are already visible, with more
focus on desk audits, automated analysis of
available tax-related data and prompt feedback to
taxpayers on issues identified. This is in line with
the OECD findings on how tax administrations can
use technology to become more effective (OECD,
2016a). In addition, the Supreme Audit Office has
positively assessed the previous legal and
organisational reforms in its recent audit of tax
administration performance in terms of respecting
taxpayer’s rights and protecting state revenue
(NIK, 2017a).
Changes to the tax system yielded higher
revenues but increased uncertainty. In 2016, a
record number of almost 32 000 pages of legal acts
entered into force in Poland (Grant Thornton,
2017a). Over 40 % of them had an impact on
business activity, including nearly 1 800 pages of
tax-related laws. The practical application and
legal interpretation of several recent measures have
posed many challenges. For instance, the Standard
Audit File became compulsory for large companies
only a few months after the relevant law was
adopted. It required some quick modifications of
companies’ bookkeeping systems. Another
example is the construction sector which raised
concerns that the interpretation of new regulations
could potentially expose honest taxpayers to the
risk of wrong interpretation and non-compliance.
Tax compliance remains burdensome in Poland
but simplification efforts are ongoing. The 260
hours spent in 2016 by a model company in Poland
to meet its tax obligations (11 hours fewer than in

3.1. Public finances and taxation
17
2015) was the third longest time in the EU (World
Bank, 2017). The efficiency of post-filing
processes such as obtaining tax refunds or being
audited remained moderate (World Bank and PwC,
2017) but simplification efforts are underway.
Rates of e-filings have substantially increased. The
authorities consulted the private sector on some
issues. In 2017, the Ministry of Finance initiated a
set of tax consultations with businesses to increase
certainty and simplify procedures. For example, a
consultation was run on improving the Standard
Audit File and creating a list of practices for VAT
which, when followed, would provide certainty for
honest taxpayers.
Poland continues to apply reduced VAT rates to
an extensive number of goods and services. This
leads to high foregone revenue and complicates the
VAT system. The VAT policy gap, capturing the
effects of applying reduced rates and exemptions,
was the highest in the EU (CASE/IAS, 2017).
More than half of the gap comes from applying
reduced rates (12). The wide application of reduced
rates significantly increases the cost of
compliance. For instance, Grant Thornton (2017b)
reported that in 2015 and 2016, taxpayers made
respectively 1 825 and 1 193 requests to tax offices
for individual interpretations of the applicable
VAT rates for food products alone (5 % vs 8 %).
Poland is currently analysing its system of reduced
VAT rates and acknowledges the need to improve
it, particularly to ensure clearer definitions of
goods and services for the application of reduced
rates (13). It is not yet known whether and to what
extent this analysis will result in actual changes
and structural improvements.
Poland does not use environmental taxes to
stimulate a more efficient use of energy and
reduce greenhouse emissions. The implicit tax
rate on energy, at below 60% of the EU average,
remains relatively low (European Commission,
2017c). Rates on transport fuels are below the EU
average and a number of tax exemptions are
available e.g. for agriculture and energy-intensive
industries. Also, vehicles taxation in Poland is not
(12) The so-called actionable VAT policy gap stood at 27.9 %.
The reduced rate gap was 15.5 % and the actionable
exemption gap was 12.4 %.
(13) Reply from the Ministry of Finance to a parliamentary
question by a member of the parliament on 4 August 2017,
http://www.sejm.gov.pl/sejm8.nsf/interpelacja.xsp?docume
ntId=15DF0FD0A937504FC1258155004AFB86
linked to CO2 emissions. In 2017, the work on
amending legislation on car taxation (excise duty
on cars) – which included linking it to CO2
emissions – was suspended; however, excise duties
on electric vehicles were abolished in 2018.
Fiscal framework
The fiscal framework remained unchanged in
2017 with numerical fiscal rules as its strongest
element. The fiscal framework comprises
numerical fiscal rules, a medium-term budgetary
framework, independent fiscal institutions and
budgetary procedures. Numerical fiscal rules cover
debt (including a ceiling enshrined in the
Constitution) and an expenditure rule
encompassing almost the whole general
government sector as well as individual spending
limits for local governments. The stabilising
expenditure rule – used for the first time for the
2015 budget – determines a maximum amount of
public expenditure in a given year. Unlike a simple
debt rule, it is countercyclical in nature because of
its design and permanent character – it prevents
policymakers from over-spending also in good
times. However, the amendments to the rule in late
2015 that allowed for higher expenditure limits in
the 2016 budget raised concerns about its
credibility. Since then, the rule has not been
modified and in the 2017 convergence programme
the authorities underlined their commitment to it.
Poland is the only EU Member State without a
fiscal council (14
). Such councils are watchdogs
for monitoring fiscal policy. Their remit
significantly differs across countries, but usually
includes assessing macroeconomic and budgetary
forecasts, assessing compliance with fiscal rules
and analysis of long-term sustainability of public
finances. Fiscal councils are important because
they help inform the public about the key
challenges of fiscal policy and public finances.
Poland has no plans to set up a fully-fledged fiscal
council. Some of the functions mentioned above
are currently performed by several bodies in
Poland, but this fragmented set-up weakens their
impact.
(14) The Czech Republic does not yet have a functioning fiscal
council either but is in the process of nominating its
members.

3.1. Public finances and taxation
18
Budget planning and procedures do not support
efficient use of available funds. As highlighted
by the Commission (European Commission,
2017a), the current setup creates a situation ‘in
which an effective and efficient management and
reallocation of funds pose challenge’. This was
also underlined by the IMF (2017a) which pointed
to various factors that hamper efficient
management of public funds. They include the
complexity of the current budget structure; a lack
of robust and binding medium-term planning;
substantial spending decided outside the budget;
and a lack of a structured assessment of the
effectiveness of expenditure. Although the
government adopts a medium-term budgetary
framework every year (in the form of a
Multiannual State Financial Plan), the public
finance targets set in it do not constitute targets for
the budgets laws for the years it covers. In the
current situation, it is difficult to identify
inefficient spending and reallocate funds to areas
where expenditure would add most value; also as
spending reviews are not part of the budget
process. The need for tools to do this is even more
acute as the share of inelastic expenditure has
recently increased (Section 1). As also underlined
by the Ministry of Finance (MF, 2015), such a
situation may lead to a suboptimal allocation of
funds.
Poland is committed to improving budget
planning and procedures. In 2016, the
government announced a reform of the budget
process and work continued in 2017. The reform is
intended to address the major issues in public
finance management. It includes the introduction
of more binding medium-term planning, a formal
inclusion of spending reviews in the budget
process and a simplification of the budget
structure. It also includes several operational
changes, for instance a new calendar for preparing
the budget and a change of forecasting models.
Work is ongoing to strengthen macroeconomic
forecasting, modernise the Chart of Accounts, and
strengthen the medium term budgetary framework.
The reform has the potential to make the spending
significantly more effective and efficient, but the
change from the current budget decision-making
process to the new process will require time and a
strong commitment. No implementation date for
the entire comprehensive reform has yet been set.
Long-term sustainability
No major risks to fiscal sustainability have been
identified. The Commission's 2017 analysis of
debt sustainability (European Commission, 2018a)
indicates low short-term fiscal sustainability risks
for Poland. In the medium term, the S1 fiscal
sustainability indicator points to a medium risk
given that the debt-to-GDP ratio is expected to rise
somewhat in the different scenarios (see Graph
3.1.2). The long-term fiscal sustainability indicator
S2 points to a similar conclusion. It indicates that
an upfront adjustment effort of 3.1 pps of GDP
would be needed to ensure that the debt-to-GDP
ratio is not on an ever-increasing path. The
medium risk over the long term is driven by the
initial budgetary position (i.e. still sizeable fiscal
deficit projected at 1.9 % of GDP for 2019) and
the outlook for age-related expenditure (1.2 pps of
GDP).
Graph 3.1.2: Medium-term public debt scenarios
Source: European Commission
The lowering of the statutory retirement age in
2017 will be a drag on public finances. In late
2017, Poland lowered the statutory retirement age
to 60 years for women and 65 years for men,
reversing an ongoing gradual increase to 67 years
for all. Mainly as a result of this factor, public
pension expenditure is expected to increase by
around 1.0 pp. of GDP in the years 2030-2040 and
to a lower extend in the following decades. The
lowering of the statutory retirement age, without
any accompanying measures to increase the
effective retirement age, will also affect the
pension replacement rate which is expected to
decrease strongly in the decades to come (see
Section 3.3). With a significant share of pensioners
projected not to accumulate sufficient
contributions, the budget will need to top up their
pensions to a certain minimum level. As a
consequence, public expenditure on minimum
45
47
49
51
53
55
57
59
61
63
65
2017 2018 2019 2020 2021 2022 2023 2024 2025 2026 2027 2028
% of GDP
Baseline no-policy change scenario
Standardized (permanent) negative shock (-1p.p.) to the short- and long-term interest rates on newly issued androlled over debtStandardized (permanent) positive shock (+1p.p.) to the short- and long-term interest rates on newly issued androlled over debt
Baseline no-policy change scenario
Permanent decrease of the interest rates on debt by 1 percentage point
Permanent increase of the interest rates on debt by 1 percentage point

3.1. Public finances and taxation
19
pensions is expected to increase. As an example, in
the scenario simulated by EC-EPC (2018), it raises
from 0.1 % of GDP in 2016 to 2.4 % of GDP in
2070.
The change of rules on social security
contributions, that could increase the short-
term revenue and increase pension expenditure
in the long-term, was put on hold. The
Parliament, in a relatively short procedure, decided
that from 2019, the cap on social security
contributions would be abolished. The pension and
disability allowance contributions would be paid
based on the actual salary, instead of being capped
at 30 average monthly wages. In the short term, the
reform was expected to generate additional social
contributions revenue of some 0.3 % of GDP
annually. This assumed that there would be no
significant shift to other forms of employment
among the highest-paid individuals (e.g. self-
employment). Given the defined-contribution
pension system, in the long term, this change
would create obligations to pay higher pensions.
The reform was put on hold as the President
decided not to sign the law and sent it to the
Constitutional Tribunal for review (15).
Special pension arrangements remained
broadly unchanged in 2017. The lowering of
pension-related emoluments for officials of certain
former special services was the only major change
to the special pension schemes that entered into
force in 2017. However, its impact on the budget,
estimated at some 0.02 % of GDP per year, is
negligible. At the same time, the costly special
pension schemes, particularly for farmers (KRUS)
and miners, enjoyed privileges compared to the
general system (ZUS). Actual contributions to the
farmers’ pension scheme cover less than 10 % of
its total bill. In turn, the public subsidy to the
farmers’ pension scheme, although in nominal
terms lower than in 2016, was nearly 1 % of GDP
in 2017. The preferential contribution rates of the
farmers’ pension scheme and the low financial
incentives for switching to the general system
combined with a special tax system for farmers
hamper labour mobility (see Section 3.3). In 2017,
the average miner’s pension was almost twice the
(15) The President expressed concerns regarding the law-
making process, in particular as regards its public
consultation phase. See Section 3.4 for a broader
discussion of, often, fast legislative procedures in Poland.
average pension paid by the general system (ZUS,
2017), while the average age of newly retired
miners was less than 49 in 2016.

20
The banking sector remains liquid and well
capitalised. Banks are well capitalised with an
average capital adequacy ratio of 17.5 % and
Tier 1 capital ratio of 16.1 % in Q2 2017, about
two percentage points higher than in 2015.
Liquidity indicators, such as the loan to deposit
ratio (94.7 % in Q2 2017), point to a comfortable
buffer as a result of private sector deposit growth
averaging 9 % over 2015-2016. Polish banks are
predominantly funded through domestic deposits,
which represented close to 60 % of the balance
sheet total, and liabilities towards foreign financial
entities, mostly parent banks, were equivalent to
around 12 % of total funding. The quality of assets
in the sector has remained sound on the back of
strong macroeconomic data, with the non-
performing loans ratio at 4.9 % in Q2 2017 (Table
3.2.1). But the performance of individual banks
varies and some may need to increase their capital.
Table 3.2.1: Banking sector financial stability indicators,
2015-2017
Source: ECB
Low interest rates, the bank levy as well as
contributions to the Bank Guarantee Fund
weigh on banks’ profitability. Profitability
indicators declined in 2015 and have remained
broadly stable since then. On top of record low
interest rates, profits have been reduced by two
factors. First, the bank levy introduced in February
2016 was equivalent, in nominal terms, to some
19% of total 2015 profits. Second, in 2016 banks
needed to contribute approximately EUR 1 billion
into the Bank Guarantee Fund (BGF), which had
to be regularly replenished following the
bankruptcies of SK Bank and credit unions. In
2017 the BGF and resolution fund contributions
were governed by the newly implemented bank
recovery and resolution directive and amounted to
some EUR 0.5 billion. The profitability outlook for
the sector is uncertain given the policy discussions
on various measures to address foreign-currency
loans and additional provisions for disputes on
loans in a foreign currency.
The stock of mortgage loans denominated in a
foreign currency has declined and is not a
systemic risk per se, though it does pose
challenges for some banks. Neither the central
bank nor the financial supervisory authority
consider the stock of foreign currency mortgages
to be generating systemic risks. In the banking
system, the stock of foreign-currency mortgage
loans has been decreasing on average by some 6 %
a year for the last five years to the level equivalent
to 7.2 % of GDP and 35 % of the total mortgage
loan stock in October 2017. However, some banks
still have a sizeable foreign-currency mortgage
loan book. This has two implications. First, these
banks are exposed to valuation and compensation
losses, if their loan book were to be converted into
domestic currency based on historical exchange
rates (either through legislation or court
judgements). Second, a sizeable foreign-currency
position forces lenders to rely for risk management
either on funding from a foreign parent bank, from
foreign currency bonds or the derivatives market.
No major legislation on loans denominated in a
foreign currency was adopted, despite multiple
draft proposals. The authorities’ approach has
both legislative and regulatory elements. The
legislative proposals tabled so far aimed on the one
hand to offer some compensation for excessive,
unfairly charged, foreign-currency spreads and on
the other hand tried to strongly incentivise banks to
convert foreign-currency mortgages into PLN.
This operation would use a fund financed by
mandatory bank contributions, proportionate to
their foreign-currency mortgage exposure (in the
version proposed by the President’s Office in
August 2017). The main regulatory element takes
the form of the nine recommendations released by
the Financial Stability Committee in January 2017.
The key incentive is in the form of risk weights of
150 % for foreign-currency mortgage loans
(compared with the normal weight of 100 %).
Sovereign-bank interconnections became
stronger. The financial crisis drew attention to
sovereign-bank linkages, which in some instances
have increased exposure to market and liquidity
risks, ultimately becoming a major liability for
some countries. In Poland, the sovereign-bank
nexus became more relevant in the last two years.
The introduction of the bank levy, which exempts
Polish sovereign bonds from the tax, increased
banks’ holdings of these bonds in the first half of
2015 2016 2017Q2
Non-performing debt [% of total] 5.0 4.7 4.9
Coverage ratio [%] 54.5 55.8 55.2
Loans to Deposits Ratio [%] 94.4 91.2 94.7
Tier 1 Ratio [%] 14.5 15.4 16.1
Solvency Ratio [%] 15.8 16.9 17.5
Return on Equity [%] 7.7 7.5 6.9
Return on Assets [%] 0.9 0.8 0.8
3.2. FINANCIAL SECTOR

3.2. Financial sector
21
2016. In 2017, Polish banks held about 40 % of the
outstanding amount of Polish sovereign bonds,
equivalent to some 14 % of banks’ balance sheet.
In addition, with the acquisition of the controlling
stake in Pekao SA now the first and the second
largest banks in Poland are controlled by the state,
bringing the share of directly and indirectly state-
controlled banks up to around 36 % of the sector’s
total assets in mid-2017. This acquisition also
presents the financial supervision with the
challenge given the ownership links between the
leading insurance company and the second largest
bank.
Financial and macro-prudential supervision are
playing an increasingly important role. Over the
crisis years, Poland’s financial supervision proved
to be prudent and forward-looking. Currently,
discussions are ongoing on some form of merger
between financial supervision and the central bank.
The reasons given for this are potential synergies
between the micro-prudential supervision of banks
and macro-supervision of the banking sector. The
increasing role of the state in the financial sector
together with a higher share of government bonds
held by banks underline the paramount importance
of strong and independent supervision and a robust
macro-prudential framework.
Credit growth was supported by low interest
rates and strong economic growth, though the
dominance of variable-interest-rate mortgage
loans might become a challenge in the future.
The growth in loans to the private sector has been
broadly in line with nominal GDP growth. Loans
to the corporate sector grew by around 7-8 % in
the second half of 2017, driven by investment
loans (Graph 3.2.1). The stock of loans to
households increased by some 5-6 % annually,
driven by a strong increase in consumer lending on
the back of improved households’ creditworthiness
and record-high consumer confidence. The stock
of housing loans grew only by around 3 %, a result
of robust growth of Polish zloty denominated
mortgages and falling foreign-currency loans.
Banks have tightened rules on housing loans,
primarily due to regulatory factors, including new
rules on acquiring agricultural real estate and more
stringent risk parameters following supervisory
recommendations. Mortgage lending products are
predominantly based on variable interest rates
(adjusted on a quarterly or half-yearly basis). The
limited use of fixed-interest-rate contracts reflects
relatively little traction in the covered bond
market. And the dominance of flexible-rate
contracts may become a challenge in future, given
the current record low interest rates.
Graph 3.2.1: Credit growth, 2012-2017 (annual % change)
(1) The graph shows annual growth rates in indices of
notional debt stocks. This data does not include revaluations
and only reflects transactions.
Source: ECB
Poland’s capital market is one of the largest and
most developed in central Europe, though
growth has slowed in recent years. Following an
exceptionally good 2017, the Warsaw Stock
Exchange (WSE) market capitalisation increased
to some EUR 170 billion or 36 % of GDP in
December 2017. The Polish capital market has all
the features of a developed market, including
secure trading and post-trade services as well as an
advanced infrastructure. From September 2018,
the market will be upgraded to the status of
‘developed market’ from the ‘advanced emerging’
category by the FTSE Russel indices. Over the
past 20 years, the WSE has become a hub for
foreign institutional investors targeting equity
investments in the region as well as the preferred
capital market for initial public offerings of foreign
companies from neighbouring countries. But the
Polish market still faces challenges including the
relatively small size of both the market itself and
the listed companies, the low free float resulting in
low turnover, the uncertainty about the future of
the sizeable stock held by open pension funds, and
the underdeveloped individual savings and pension
plans.
0
2
4
6
8
10
12
14
16
Total credit to private sectorLoans to non-financial corporationsLoans to households & NPISHMortgage loans to households
y-o-y % change

22
Labour market
Employment grew stronger in 2017 while
unemployment hit record lows. Employment
growth was particularly strong in manufacturing
and certain service sectors. This benefitted all
population groups, with employment rates
increasing for both men and women in almost all
age groups (except women aged 30-34), people
with different educational backgrounds and
persons with disabilities. In the first half of 2017,
the employment rate of those aged 20-64 exceeded
70 % for the first time since data has been
available. In parallel, the unemployment rate
continued to decline, hitting record lows in
subsequent quarters. Falls in unemployment were
observed for both female and male populations,
and in both rural and urban areas. Youth
unemployment (i.e. people aged 15-24) also
declined steadily: at 14.7 % it was well below the
EU average of 16.6 % in Q3 2017. Finally, the
share of long-term job seekers among all
unemployed people also decreased.
The supply of skilled labour has become a
significant challenge. Companies are reporting
shortages of skilled workers in various sectors (see
Section 1). The unemployment rate is at the record
lows and the demographic outlook is negative (see
European Commission, 2017a). This emphasises
the challenge of increasing labour force
participation and investment in skills.
The number of people in work or actively
looking continued to grow, but low
participation by specific groups remains a
challenge. The activity rate was improving, but at
69.7 % in Q2 2017 (for ages 15-64) it was still
below the EU average of 73.3 %. The activity rate
is close to the EU average in the 25-49 age group,
while remaining visibly lower among people aged
55-64 and the youngest generation (15-24). Also,
women with below-tertiary education are
participating to a significantly lesser extent than
the EU average (Table 3.3.1). Economic activity
by the disabled increased in 2017, yet still
remaining low at 29.9 % in Q3 2017 (16).
(16) Data on economic activity of disabled are based on the
Polish Labour Force Survey but cannot be easily compared
with other countries due to methodological differences.
Table 3.3.1: Differences between activity rates in Poland
and EU – by age class and educational
attainment, Q3 2017, percentage points
Source: Eurostat
Limited access to childcare, an underdeveloped
long-term care system and disincentives built
into the social benefits system can discourage
especially women from participating in the
labour market. Insufficient access to early
childcare and pre-school facilities is particularly
detrimental to women’s participation in the labour
market. Formal enrolment in child care for
children under 3 stood at 7.9 % in 2016, compared
to the EU average of 32.9 %. Since 2011 Poland
has been taking action to develop early child
education and care facilities and the requirements
for service provision were liberalised in January
2018. The effects of this measure are yet to be
seen. Another important factor is the design of
financial support for people who provide long-term
care to family members, which prohibits the take-
up of paid employment. For low-income
households with young children, the incentives to
take up low-paid work appear weak because of the
eligibility conditions of some social benefits
(Bargu and Morgandi, 2018). The child benefit
appears to have played a discouraging role
(Magda, 2017). The design features of the special
pension regime for farmers continue to discourage
workers from moving from agriculture into other
sectors, while deficiencies in the housing market
and transport infrastructure limit geographical
mobility (European Commission, 2017a).
Economic activity by older people is hindered
by low skills, the recently lowered retirement
age, health-related issues and low take-up of
part-time work. The over 50s have a significantly
worse self-declared health status than in other EU
countries (Myck and Oczkowska, 2017). Mental
health appears to be particularly problematic, with
a more mixed picture for physical health,
depending on the indicator used. Participation in
sex
educational level non-tertiary tertiary non-tertiary tertiary
20 to 24 years 2.1 -2.8 -8.9 -9.0
25 to 34 years 2.8 3.9 -10.7 -0.2
35 to 49 years -1.0 0.4 -2.1 1.9
50 to 59 years -7.2 -2.6 -5.4 1.5
60 to 64 years -4.4 10.9 -13.8 -11.9
65 to 69 years 0.9 11.3 -3.4 1.3
males females
3.3. LABOUR MARKET, EDUCATION AND SOCIAL POLICIES

3.3. Labour market, education and social policies
23
Box 3.3.1: Monitoring performance in light of the European Pillar of Social Rights
The European Pillar of Social Rights, proclaimed on 17 November 2017 by the European Parliament, the
Council and the European Commission, sets out 20 principles and rights to benefit citizens in the EU. In
light of the legacy of the crisis and changes in our societies driven by population ageing, digitalisation and
new ways of working, the Pillar serves as a compass for a renewed process of convergence towards better
working and living conditions.
Poland performs relatively well on the indicators of the Social Scoreboard (1) supporting the
European Pillar of Social Rights. The situation is favourable in terms of access to the labour market. Indicators related to poverty and income inequality have been improving over the past years. At the same
time, the country faces challenges on issues such as providing formal childcare for young children and the
development of digital skills. This also reflects a rapidly evolving labour market situation. Access to quality
healthcare and long-term care are issues of
concern.
The gender employment gap remains
relatively high. Although female employment
and activity rates have been increasing, they
are still well behind those of men. A number
of institutional factors leading to inadequate
work-life balance provisions, including a very
low childcare coverage for children aged less
than three, play a key role in this respect.
Poland took steps to address this challenge,
but it is too early to assess its effects.
Gross disposable household income has
been increasing very fast, and
unemployment is at record lows. The strong
household income gains in recent years have
been related to rising employment and wages
in the low inflation environment. The
education system overall performs well, as
witnessed by the low number of early school
leavers (5.2 % in 2016, below half of the EU
average) and high tertiary attainment. Early
school leaving has stayed low for a long time,
inter alia owing to effective enforcement of
educational obligation up till the age of 18
and to the well-established reintegration
programme organised by the Voluntary Youth
Corps for young people who dropped out of
school.
(1) The Social Scoreboard includes 14 headline indicators, of which 12 are currently used to compare Member States
performance. The indicators "participants in active labour market policies per 100 persons wanting to work" and
"compensation of employees per hour worked (in EUR)" are not used due to technical concerns by Member States.
Possible alternatives will be discussed in the relevant Committees. Abbreviation: GDHI – gross disposable household
income.
education and training and the incidence of
informal learning among people aged 55-64 is
among the lowest in the EU (17). The statutory
retirement age used to be a major factor affecting
(17) Based on the 2016 edition of the Adult Education Survey.
labour force participation. The growth in activity
in recent years was related to the removal of early
retirement schemes and a gradual increase in the
statutory retirement age. In this context, the
significant lowering of the retirement age
Early leavers from education
and training (% of population
aged 18-24)
Better than average
Gender employment gap To watch
Income quintile ratio (S80/S20) On average
At risk of poverty or social
exclusion (in %)On average
Youth NEET (% of total
population aged 15-24)On average
Employment rate (%
population aged 20-64)On average
Unemployment rate (%
population aged 15-74)Better than average
GDHI per capita growth Best performers
Impact of social transfers
(other than pensions) on
poverty reduction
To watch
Children aged less than 3 years
in formal childcareCritical situation
Self-reported unmet need for
medical care Critical situation
Individuals' level of digital skills To watch
Social
protection
and inclusion
Dynamic
labour
markets and
fair working
conditions
Equal
opportunities
and access to
the labour
market
POLAND
Members States' are classified according to a statistical methodology agreed with
the EMCO and SPC Committees. The methodology looks jointly at levels and changes
of the indicators in comparison with the respective EU averages, and classifies
Member States in seven categories (from "best performers" to "critical situations").
For instance, a country can be flagged as "better than average" if the level of the
indicator is close to EU average, but it is improving fast. For methodological details,
please consult the draft Joint Employment Report 2018, COM (2017) 674 final.
NEET: neither in employment nor in education or training; GDHI: gross disposable
household income

3.3. Labour market, education and social policies
24
(particularly for women) is a source of concern.
Poland is one of the only two EU Member States
where legislation does not foresee equalisation of
retirement age for men and women. Part-time work
is not as popular among older people in Poland
(only 13 % of all employed people aged 55-74
worked part-time in the first half of 2017) as in the
EU as a whole (over 25 %).
Migrant workers are helping to ease labour
shortages in Poland. Immigration continued to
increase fast in 2017, according to the available
data (18). While more permanent forms of
employment among foreigners appear to be
increasing rapidly (120 % annual increase in the
number of work permits in the first half of 2017),
most non-EU nationals (especially from Ukraine)
in Poland still work through a simplified procedure
that enables work for 6 months within a given 12-
month period. Such temporary labour migration
may not fully utilise migrants’ skills and may be
sensitive to developments affecting the relative
attractiveness of work in their home countries,
Poland and other EU Member States (NBP,
2017c). Developing a migration strategy to enable
the recognition of qualifications and a better
matching of job offers with migrants’ skills could
help maximise gains from migration.
Public employment services and other
institutions face increasing challenges getting
people with low skills and competencies into
work. While the number of unemployed was
falling fast, the average time of job search
decreased more modestly (10.4 months in
Q3 2017, down from 11.1 a year earlier). In their
efforts to find a job, the unemployed in Poland rely
on public employment services more often than the
EU average, while direct applications to employers
are less common. Private employment services are
barely used. People who currently remain
unemployed or are not economically active are
likely to have low skills and competencies. To
improve the situation, the government is
considering changes to its active labour market
policies. In addition, coverage of unemployment
benefits for the short-term unemployed remain
(18) There is no source enabling a precise assessment of labour
migration level and trends. In the first half of 2017 the
number of employers’ declarations on the intention to hire
foreigners increased by 49 % from a year earlier. In the
first 3 quarters of 2017 the number of requests for
residence permits increased by 37 % from a year earlier.
among the lowest in the EU (19). This may be
linked to the persistent segmentation of the labour
market, as the self-employed face administrative
difficulties in accessing unemployment benefits
and not all civil law contracts are covered by the
social security contributions allowing for
unemployment benefits.
Permanent contracts dominate among newly
created jobs, but the share of temporary
contracts remains high. Temporary employment
accounted for 26.1 % of employees in Q3 2017,
down by 1.3 percentage points from a year earlier,
but still among the highest in the EU. This is
accompanied by one of the lowest transition rates
from temporary to permanent contracts in the EU.
The underlying reasons and implications of
ensuing labour market segmentation into different
categories of workers and types of contracts were
discussed e.g. in European Commission (2016a,
2017a). Some legislative changes relevant for
labour market duality might be included in new
draft labour codes that are to be presented in early
2018 by the Codification Commission.
Social dialogue and collective bargaining
The Social Dialogue Council has worked
intensively on several policy areas, although not
all important legislative proposals are
submitted to it. Since its creation in 2015, the
Council has played a key role in the dialogue
between employers, workers and the Polish
government. However, it has not discussed several
major legislative proposals, such as removing the
cap on social security contributions (see Sections
3.1 and 3.4).
Collective bargaining between social partners is
decentralised. Poland has one of the lowest
collective bargaining coverages across Member
States (Visser, 2016a, 2016b). There is almost no
coordination in wage bargaining, as it
predominantly takes place at the company level.
Collective bargaining coverage is particularly low
among young workers, based on self-reported data
(European Commission, 2017d). A new collective
labour code, now under preparation, might change
the situation.
(19) According to the results of the benchmarking exercise
carried out by the Employment, Social Policy, Health and
Consumer Affairs Council.

3.3. Labour market, education and social policies
25
Education and skills
Educational performance has been strong in
recent years. Poland’s rate of early school leaving
is low: in 2016 it was 5.2 %, less than half the EU
average of 10.7 %. Poland had improved its PISA
results in recent years. Despite some decline in
overall performance between 2012 and 2015,
Poland still scored better than both the EU and
OECD averages in all areas (European
Commission, 2016b).
The education system still faces various
challenges in light of the changing demand for
skills and intensifying global competition for
talent. Major issues include making schools better
at developing independent, creative and critical
thinking, teaching problem-solving skills and
teamwork, helping pupils learn to learn
independently and developing a positive attitude to
life-long-learning, including through the use of
information technology tools (see IBE, 2015). In
addition, there is scope for improving the role of
schools in equalising socioeconomic opportunities.
Coverage of early childhood education and care
partly recovered in the school year 2017/18
after a decline in 2016/17. Participation in early
childhood education and care was increasing fast
until the 2015/16 school year. The coverage then
reached 93.1 % of children between age 4 and the
compulsory education starting age, still below the
EU average of 94.8 % in 2014/15. In turn,
participation declined in 2016/17 (for policies
triggering this decline see European Commission,
2017a). Provisional data suggest a rebound in
2017/18, particularly for three-year-olds who have
a guaranteed right to a place in preschool as of
September 2017 (Graph 3.3.1). In addition,
funding was recently increased for the opening of
new childcare places for children under three, for
whom coverage is still very low. Enrolment in
early child education and care is geographically
uneven: it is much lower in rural areas, particularly
eastern and north-eastern Poland (GUS, 2017a).
Ongoing change of the school system is utilising
considerable resources and attracting the
attention of stakeholders. The phasing out of
lower secondary schools started in September
2017, affecting schools, teachers and local
governments, which are responsible for the school
network. The operation has numerous logistical
challenges and substantial costs (European
Commission, 2017e). This risks significantly
reducing the resources that could be devoted to
addressing challenges in the Polish educational
system, like the ones mentioned above.
Graph 3.3.1: Pre-school participation by 3-5 year olds,
2013-2017
(1) 2017 data are provisional.
(2) Size of respective cohorts approximated based on
Central Statistical Office population data in June 2017.
Source: Central Statistical Office; PL Ministry of Education.
Tertiary education attainment is high, but
challenges remain with learning outcomes. The
share of tertiary graduates struggling with basic
quantitative reasoning and understanding simple
written communication was well above the OECD
average in the Survey of Adult Skills (PIAAC)
(OECD, 2016b). To address the quality of
teaching, social relevance and scientific outcomes,
Poland intends to reform its higher education
system. In 2017, the draft law (Constitution for
Science) was officially presented, following a
broad public consultation. If implemented, the
changes are expected to cover e.g. governance, the
organisation of doctoral studies, and the funding of
higher education. Some steps have already been
taken to address shortcomings in the system.
Improving basic skills and increasing the
employers’ involvement remain the key
challenges facing initial vocational education.
The weakness of vocational schools in helping
students develop basic skills has repeatedly been
identified in PISA and PIAAC surveys (e.g. IFiS,
2013). The forthcoming re-organisation of
vocational schools creates an opportunity to
strengthen cooperation with employers and the role
of apprenticeships. It is, however, as yet unclear
whether effective action will be taken in this area.
Formal and especially non-formal adult
learning in Poland remains underdeveloped.
50%
55%
60%
65%
70%
75%
80%
85%
90%
95%
100%
2013/14 2014/15 2015/16 2016/17 2017/18P
3Y4Y5Y
% of age cohort
school year

3.3. Labour market, education and social policies
26
The PIAAC results show that key information-
processing skills of adult population were below
the average across participating countries,
particularly among people aged 35-54 and those
with low educational attainment (OECD, 2016b).
The share of adult population (16-74 years) with at
least basic digital skills is relatively low in Poland
(46 % in 2017) as compared to the EU average
(57 % in 2017), even if there has been marked
improvement in the recent years (from 40 % in
2015). These underscore the challenge of
upgrading skills for adults in the context of
population ageing and changing demand for skills.
This is the particular focus of the EU’s Upskilling
Pathways Recommendation (Council, 2016). In
2016, only 3.7 % of those aged 25-64 reported
participation in education or training in the month
before the survey, one third of the EU average of
10.8 % (20). The gap is wider still among the least
qualified. Both demand and supply-side issues are
likely at play. Adults are frequently not interested
in developing their competencies or acquiring new
skills or qualifications. At the same time,
companies may be relatively less willing to
provide training to certain categories of workers.
The implementation of the Integrated
Qualifications System has had a limited impact so
far. The Polish authorities plan to develop a new
skills strategy.
Poverty and social inclusion
Poverty continued to decline fast. While Poland
performs around EU average for the indicators
related to adequacy of minimum income benefits,
its level is below the national poverty
threshold (21). The share of people at risk of
poverty or social exclusion fell to 21.9 % in 2016
down from 27.8 % in 2009, and most recent labour
market trends and changes in the social benefits
system suggest further improvement in 2016-2017
(see Section 1) (22). This is also confirmed by 2016
household budget survey data (GUS, 2017b). In
(20) This compares to the EU2020 target of 15 %. The
Eurostat’s Adult Education Survey confirms low and stable
or declining participation in adult learning. Between 2011
and 2016 participation declined minimally for all groups
aged 25-64 defined by educational attainment level.
(21) According to the benchmarking exercise in the area of
minimum income schemes conducted within the Social
Protection Committee, see the draft Joint Employment
Report 2018.
(22) The survey was carried out in 2016, but the income data
that form the core of the poverty assessment refer to 2015.
parallel, the number of at risk people has fallen by
almost 3.3 million since 2008, by far the biggest
fall in the EU. The pace of improvement,
nevertheless, differs between groups.
Expenditure on social benefits increased
significantly, but there are questions about their
effectiveness and efficiency. Recent policy
developments show a clear focus on selected areas,
namely family/children income support. The
introduction of a child benefit in early 2016 was
not accompanied by any significant adjustments to
the whole social benefit system. As a result, the
relative generosity of the system has changed, with
families with more children now benefitting the
most. However, an overall assessment of the social
benefit system is lacking and there appears to be
little public debate about the distribution of public
resources to different policy areas, such as
healthcare, long-term care, support for the
disabled, family support, etc.
Welfare coverage for self-employed and
atypical workers is emerging as a potential
issue. Most welfare benefits in Poland are based
on the insurance principle. Self-employed and
those employed on certain non-standard contracts
are not obliged by law to be covered by health
insurance, even if they can voluntarily opt in.
Because of the high incidence of self-employment
and other forms of atypical work, Poland is one of
the countries with the highest share of employed at
risk of not being entitled to sickness benefits.
Pension contributions are also lower or not
obligatory for certain atypical work arrangements.
This will lead to very low future pensions for
many people.
Pensions currently provide adequate protection
against poverty but the recent change in the
pension system is expected to reduce benefit
levels. In 2015, the at-risk-of-poverty rate among
Polish pensioners was below the EU average and
only slightly higher than among employed people.
The pension replacement rate, i.e. the ratio
between pensions in retirement relative to earnings
when working, was supposed to decline fast even
with the statutory retirement age at 67. Its recent
lowering is expected to worsen the situation
significantly, unless working careers are
lengthened well beyond the new statutory age.
Women are expected to be particularly affected
given that, for those retiring from 2040 onwards,

3.3. Labour market, education and social policies
27
their statutory retirement age will be reduced by
seven years (23). Depending on the indexation of
minimum pensions, a significant proportion of
future female pensioners could be at risk of
poverty. So far, the only government initiative
attempting to increase the effective retirement age
consisted of informing potential pensioners about
the link between the level of benefit and the length
of professional career.
Healthcare
Life expectancy in Poland has continued to
increase, with the gap with the EU average
narrowing in the last decade. In 2015, life
expectancy in Poland stood at 77.5 years, above
the levels in most neighbouring countries, but
about 3 years below the EU average. An eight-year
gap in life expectancy between Polish men and
women (73.5 and 81.6 years, respectively) is above
the EU average of 5.5 years. Differences by the
socioeconomic status also remain higher than in
most other EU Member States.
Access to and the effectiveness of the healthcare
system is affected by low health spending and a
low number of health workers in some
specialisations. In 2015, total health expenditure
was 6.3 % of GDP, well below the EU average of
9.9 % of GDP (24). The government intends to
increase public health expenditure from around
4.5 % of GDP at present to 6 % of GDP by 2025.
Poland has amongst the lowest number of
practising doctors and nurses relative to population
size. The shortages in particular affect certain
specialisations. This has implications for access to
healthcare. Self-reported unmet needs for medical
care rank among the highest in the EU, and waiting
times for certain health care interventions are
particularly long. The effectiveness of the
healthcare system varies. For example, hospital
acute care for cardiac patients appears to be very
effective, while outcomes for cancer care are less
favourable. Mortality rates for conditions that are
amenable to medical treatment remain above the
EU average.
(23) This comes on top of delaying the start of working careers,
due to an increase in the school starting age introduced in
September 2016.
(24) More information and data cited in this section can be
found in OECD/European Observatory (2017).
Inefficiencies remain in the distribution of
healthcare resources. The number of hospital
beds is high but not optimally distributed
geographically. In contrast outpatient and primary
healthcare are generally underdeveloped. While
preliminary diagnoses are meant to be conducted
at primary care level, the system of financial
incentives means that doctors often push the cost
of investigation onto specialist providers. Few
resources are devoted to preventive medicine,
through public health initiatives and health
promotion. All the above, together with a
relatively high share of out-of-pocket health
spending by patients also leads to unequal access
to health services depending on patients’ income
and place of residence.
Certain measures are being taken that could
improve efficiency. Preparing maps of healthcare
needs can improve efficiency of healthcare
investments as these enable assessment on the
basis of criteria including identified needs,
demographics, available infrastructure, medical
staff, etc. The introduction of new pharmaceuticals
and medical technologies, an area potentially
resulting in sharp cost increases, is being managed
by a specialised agency. Potential savings by
aggregating the procurement of medicinal products
largely remain untapped.
Recently-adopted laws are changing how the
hospitals and primary healthcare operate. The
introduction of the hospital network could improve
services for patients, through better coordination of
services (including after hospital discharge), easier
access to specialists and reduced waiting times for
medical treatment. In addition, the new solutions
for primary healthcare should improve
coordination of healthcare, including preventive
medicine. The new primary healthcare set-up will
be piloted until 2019, with a view to fully
implementing it after that. The combined effects of
these two new laws are yet to be assessed.
Long-term care faces multiple challenges. Most
long-term care is provided by informal carers,
often family members who have almost no
institutional support. Such a system has negative
implications for social inclusion and labour market
participation. In the longer term, it is
unsustainable, given population ageing.
Furthermore, better coordination of long-term care
and healthcare could help curb costs.

28
Corporate investments, particularly in
intangible assets, have been low for many years.
In 2009-2016, the average investment of the
corporate sector amounted to 10.3 % of GDP,
compared to the EU-28 average of 11.9 % and to
significantly higher values in regional peer
countries (e.g. 16.7 % in the Czech Republic).
There is a particularly large gap in investments in
intellectual property products (this category
includes for example software or patent rights) that
averaged 1.3 % of GDP in Poland, compared to the
EU-28 average of 3.7 % of GDP. Private
investment declined in 2016 and remained weak in
early 2017 but is expected to gradually recover
(see Box 3.4.1 and Section 1).
Public investment is higher than the EU
average, largely because of the utilisation of the
European Structural and Investment Funds
(ESIF). In addition to public investment at
national level, a particularly large share of
investment (2.3 % of GDP during 2009-2016,
compared to the EU-28 average of 1.3 % of GDP)
is by local governments. A significant share of
public and also private investment is supported by
the ESIF. This has several implications. First,
Poland is exposed to swings in the utilisation of
EU funds. Second, a long-term challenge of
ensuring adequate public resources to maintain an
appropriate investment level could emerge, should
the ESIF allocation decrease after 2020. Third, the
large amount of ESIF funding also underscores the
importance of effective administration, strategic
planning of infrastructure investment and public
procurement (See Box 2.1) (25).
The relatively small size of companies limits
overall investment, especially in R&D. There is a
strong link between firm size and investment
intensity: larger firms invest more per person
employed (Graph 3.4.1). Given the particularly
high share of small companies in Poland, this may
be one of the factors lowering total investment in
the country. In 2014-2015, 34 % of all those
employed in Poland worked in firms with at least
10 employees, well below the EU average of 44 %.
In turn, microenterprises account for a high share
of Poland’s corporate sector. The small
employment share of the largest companies has an
even stronger impact on aggregate R&D
(25) For an overview of the challenges with ESIF supporting
innovation see Breznitz and Ornston (2017).
investment given that this is even more
concentrated on the biggest companies.
Graph 3.4.1: Investment outlays per person employed by
firm size, 2015
Source: European Commission calculations based on
Central Statistical Office
The quality of the regulatory framework
remains a weak element of the overall
favourable business environment. A large
domestic market, strong and stable economic
growth, human capital, and quality of
infrastructure have remained the strong elements
of the business environment, compared to other
countries. This is confirmed by various
international rankings, such as the Global
Competitiveness Index (WEF, 2017). However,
the quality of institutions weighs on Poland’s rank.
For instance, the most problematic factors for
doing business as identified by WEF (2017)
include tax and labour regulations, policy
instability and inefficient government bureaucracy.
High uncertainty appears to still hinder
investment. The perception of relatively high
uncertainty, especially surrounding the legal and
tax environment, remained an important factor
limiting investment in 2017 (NBP, 2017a). This
may be related to measures taken to improve tax
compliance (see Section 3.1) but can also reflect
other abrupt regulatory changes. In 2017, several
measures impacting the conditions for businesses
were adopted in a fast legislative procedure.
Examples include a significant increase in social
security contributions on high-wage earners,
changes in the conditions for the renewable energy
0
5
10
15
20
25
30
35
40
0-9employees
10-49employees
50-249employees
250 and moreemployees
thousand PLN per employee
3.4. INVESTMENT

3.4. Investment
29
sector or new limitations on setting up pharmacies.
The practice of avoiding and limiting the scope of
public and social consultations on key draft laws
continued in 2017 (Obywatelskie Forum Legislacji
– Fundacja Batorego, 2017).
Poland adopted reforms of the justice system
which led the Commission to conclude that
there is a clear risk of a serious breach of the
rule of law. An efficient and independent judicial
system is crucial for the business environment.
Since late 2015, the Polish authorities have
adopted several laws affecting the structure of the
justice system. The reforms should be carried out
in a way which protects the independence of the
judiciary. In this regard, the Commission has
concluded that a clear risk of a serious breach of
the rule of law exists in Poland within the meaning
of Article 7(1) of the Treaty on European Union.
The Commission also set out the ways in which
this risk could be addressed. Respect for the rule of
law is not only a prerequisite for the protection of
all the fundamental values listed in Article 2 TEU.
It is also a prerequisite for upholding all rights and
obligations deriving from the Treaties and for
establishing mutual trust of citizens, businesses
and national authorities in the legal systems of all
other Member States. The Commission underlines
that the proper functioning of the rule of law is
also essential in particular for the seamless
operation of the Internal Market and an investment
friendly environment, because economic operators
must know that they will be treated equally under
the law. Respect for the rule of law is also essential
for mutual trust in the area of justice and home
affairs, in particular for effective judicial
cooperation in civil and criminal matters which is
based on mutual recognition. This cannot be
assured without an independent judiciary in each
Member State.
Several policy measures to improve the business
climate are at the advanced stage of the
legislative process. Poland slipped three places in
the 2018 Doing Business ranking (World Bank,
2017) because other countries progressed with
implementation of reforms. This points to the
importance of a sustained effort to improve the
business environment. A legislative package of
five laws known as the ‘Constitution for business’
was approved by the lower house of the parliament
in January 2018. Its general objective is to simplify
the legal business environment and to set more
favourable conditions for starting and carrying out
economic activity. It will also clarify rules for
foreign companies setting up or providing cross-
border services in Poland. The package was
extensively consulted and business representatives
were generally supportive. New laws, if effectively
implemented, may improve the relations between
business and public administration. Another law
discussed by the government proposes to introduce
a new mechanism of support for companies
investing throughout Poland by offering income
tax breaks. This new system is meant to replace the
tax exemptions in special economic zones.
Poland has reformed its R&D tax incentives
with new regulations in 2016-2018. The changes
aim to make R&D tax breaks more attractive and
encourage their wider use. Based on international
experience with similar solutions, these reforms
can be expected to lead to more private investment
in R&D (CPB et al., 2014) (26).
Barriers to expansion of firms affect investment
activity and productivity. Given the link between
firm size and investment intensity, barriers to firm
growth constitute also investment barriers. For
example, burdensome administrative procedures
for social security can prevent certain one-person
companies from hiring as this is associated with
the need to report monthly with multiple forms and
annexes. Other factors hindering the growth of
firms include issues surrounding inheritance in
family firms, lack of trust, credit market
imperfections, administrative burdens for
workplace security, business inspections or sector-
specific regulations (see also EBRD, 2017). Also,
shortages of skilled labour (see Section 3.3) can be
expected to limit the room for firm growth, while
additionally directly impeding investment,
especially in sectors where capital and labour are
complementary. Barriers to firm growth have
further implications for productivity,
competitiveness and innovativeness of the whole
economy, as discussed by EBRD (2017).
Access to credit is not a crucial investment
barrier overall, but adequate financing may be
(26) At the same time, part of the expected rise of business
R&D spending (between 2015 and 2016 it increased by
around half) may be of a purely statistical nature. Identical
transactions previously not reported as R&D investment
due to tax disincentives may now be reported as R&D (see
Białek-Jaworska et al., 2016).

3.4. Investment
30
a constraint for some companies. Own resources
remain the dominant source of funding for
corporate investments (NBP, 2017a). The same
applies to investment in housing by households
(NBP, 2017b). At the same time,
underdevelopment of certain capital market
instruments may be limiting investment, especially
in some market segments (27). In 2017, the Warsaw
Stock Exchange noted the lowest number of new
listings since 2009 and the highest ever number of
withdrawals. Meanwhile, the Polish Development
Fund is expected to gain importance increasing the
role of public entities on the capital market.
Effective and efficient public procurement is
important for public investment. In 2017, public
procurement processes were adapting to the
changes introduced in July 2016 and preparing for
a wider roll-out of electronic public procurement.
A broader use of non-price-related tender criteria
is already visible in data. It remains to be seen to
what extent the various players will cooperate in
aggregating their tenders (e.g. in the health sector
or local governments through integrated territorial
investment). Managing complex infrastructure or
information technology projects remains
challenging even at the central government level.
Deficiencies in the spatial planning framework
and in the issuing of building permits affect the
investment climate and regional development.
The non-binding role of documents setting spatial
development guidelines at the local level (28), the
limited coverage of spatial development plans (29)
and the dominant role of ad hoc administrative
decisions for building permits create distorted
spatial development patterns (NIK, 2017b). This
makes investing in certain localities less attractive,
leads to building in risk areas (e.g. flooding), and
creates urban sprawl that puts pressure on existing
infrastructure. The draft Building Code has the
potential to address some of these deficiencies by
(27) For example, in 2016, private equity investments accounted
for 0.17 % of GDP, compared to the EU average of 0.32 %
(Invest Europe, 2017).
(28) In Polish: studium uwarunkowań i kierunków
zagospodarowania przestrzennego.
(29) In Polish: miejscowy plan zagospodarowania
przestrzennego.
aiming at policies encouraging a more sustainable
use of land. However, its final shape and the
effects of its eventual implementation remain to be
seen.
State-owned and state-controlled companies
(SOEs) continue to gain importance. SOEs are
key players in crucial sectors of the Polish
economy (European Commission, 2017a). The
government sees SOEs as drivers and leaders of its
innovation policy agenda and significantly
increased in 2017 the state ownership in the
banking and energy sectors (30). So far the SOEs’
performance remained overall strong and broadly
similar to private companies. However,
international evidence suggests that a dominant
role of SOEs can pose fiscal, financial and macro-
stability risks (Böwer, 2017). Given their size, the
current patterns of investment by SOEs translate
into overall investment trends (European
Commission, 2017f). High turnover in top
management at several major SOEs may have
played a role affecting investment decisions.
The new SOE governance framework is being
gradually implemented. The new governance law
of 2017 formally kept the oversight of the SOE
supervision centralised, while transferring the
responsibilities from the Ministry of the Treasury
to the Chancellery of the Prime Minister.
However, the supervision was delegated to line
ministries, some of which (e.g. the Ministry of
Energy) set their own supervisory guidelines. In
October 2017, the Chancellery issued supervisory
guidelines as a reference governance framework
for line ministries. The Chancellery is preparing a
revision of the January 2017 governance law,
which increases the Chancellery's supervisory
rights. The objective of the SOEs’ management is
defined as ‘sustainable growth in shares values,
considering an economic policy of the
state’ (Republic of Poland, 2016). It remains to be
seen how this will be operationalised and to what
extent considering it will help make economic
investment decisions.
(30) For example, several energy SOEs set up a company to
develop electro mobility.

3.4. Investment
31
Box 3.4.1: Investment challenges and reforms in Poland
Macroeconomic perspective
Investment activity was volatile in recent years. After falling in 2012-2013, investment activity rebounded
strongly in 2014-2015. However, 2016 saw a strong decline in investment and investment weakness
continued into 2017, with some revival only in the second half of the year. By Q3 2017 the ratio of total
investment to GDP fell to 17.3 %, the lowest since 1995. Factors explaining these swings include
fluctuations in the utilisation of the EU structural funds, changing perceptions of uncertainty and risks,
including on economic policy directions, and on overall macroeconomic conditions. A recovery in
investment is expected to strengthen in 2018. Public investment is estimated to have rebounded strongly
already in 2017, whereas private investment is projected to increase more gradually.
Assessment of barriers to investment and ongoing reforms
A number of investment barriers persist affecting Poland's investment climate. These include in particular:
1. An unstable regulatory environment. Several implemented and still discussed changes in taxation (see
Sections 3.1 and 3.3) increase uncertainty, especially if implemented through a fast-track legislative process
with no public consultation. Lack of a long-term strategy for the energy sector and 2016-2017 regulatory
changes are examples of sector-specific regulatory barriers (see Section 3.4). Such specific barriers exist
also in other areas, as evidenced by recent legislation constraining the opening of new pharmacies and by
discussions on taxes targeting the retail sector.
2. The increased role of the state. In some key sectors the government's control on investment decision by
some key companies may discourage private investments if public involvement is perceived as distorting
competition (see Section 3.5,Wise-Europa, 2016).
3. Limited co-operation between academic and business sectors. This along with the subpar quality of
scientific research in some areas hampers the development of corporate R&D investment (Sections 3.3, 3.4).
4. Lack of capacity of public administration. This in particular applies to the capacity to carry out public
procurement in a way that ensures good value for money for the public sector but also gives the contractors
sufficient stability and predictability to adequately adjust capacity (see Section 3.3). This also applies to the
knowledge of the applicable laws and willingness to share the knowledge with potential investors (see e.g.
by Fundacja Republikańska, 2017). It also refers to spatial planning and the issuing of building permits.
Regulatory/ administrative burden Taxation
Public administration CSR Access to finance
Public procurement /PPPs Cooperation btw academia, research and business
Judicial system Financing of R&D&I
Insolvency framework Business services / Regulated professions
Competition and regulatory framework Retail
EPL & framework for labour contracts Construction
Wages & wage setting Digital Economy / Telecom
Education, skills, lifelong learning CSR Energy
Legend: Transport
No barrier to investment identified
CSR Investment barriers that are also subject to a CSR Some progress
No progress Substantial progress
Limited progress Fully addressed
Public
administration/
Business
environment
Financial
Sector /
Taxation
R&D&I
Sector
specific
regulation
Labour
market/
Education

32
R&D and Innovation
Despite efforts to enhance the economy's
capacity to innovate, scientific and innovation
inputs and outputs have been weak in recent
years. Between 2007 and 2016, the expenditure on
R&D increased by 0.41 % of GDP to 0.97 % of
GDP. However, this still matched only about half
of the EU average (2.03 % of GDP). The increase
has been supported by public R&D spending, of
which 60 % is ensured by the European Structural
and Investment Funds (European Commission,
2017g). Business R&D expenditure, although
almost tripling in recent years (from 0.22 % of
GDP in 2011 to 0.63 % in 2016), was still far
below the EU average of 1.3 % of GDP. Poland
scores low for most indicators of the European
Innovation Scoreboard, including SME in-house
innovations (lowest in the EU), science-business
linkages and number of PhD graduates (European
Commission, 2017h). Employment in high-tech
manufacturing and knowledge intensive sectors is
also low (Applica et al, 2016). Recently, major
steps have been taken to encourage more
innovation in the private sector, including
programmes for innovative start-ups and tax
incentives for R&D (Section 3.3). The effects of
these measures cannot yet be fully evaluated, but
they are likely to support business expenditure on
R&D in the coming years.
Developing the science base is critical for
enhancing scientific excellence and translating
it into innovations and technological progress.
Despite past efforts to reform the research system
(European Commission 2016a & 2017a), it still
ranks third to last in the 2017 European Innovation
Scoreboard (European Commission, 2017h),
poorly performing for scientific outputs(31) and
international scientific co-publications (Graph
3.5.1). In particular, the Polish research system
lacks openness and does not create favourable
conditions for knowledge flows (32). A major
reform to address these shortcomings, the
‘Constitution for Science’ (see also Section 3.2),
has been prepared in consultation with
(31) Only 5 % of all Polish scientific publications were among
the top 10% most cited publications worldwide, compared
to the EU average of 10.6 %. On a more positive note,
Poland recorded one of the fastest improvements for this
indicator between 2010 and 2016.
(32) On the importance of science openness and knowledge
flows for innovations see: European Commission (2016c,
2018b), Jonkers and Wagner (2017).
stakeholders. The reform takes into account key
recommendations of the international Peer Review,
conducted by the Horizon 2020 Policy Support
Facility at the request of the Polish authorities
(Winckler et al, 2017). The reform provides for
measures to overcome the fragmentation of higher
education (consolidation) and to encourage
broadening the teaching offer (e.g. ‘Excellence
Initiative’ project). It also focuses on reinforcing
the management and autonomy of universities
combined with their greater societal involvement,
simplification of the university funding system and
reporting obligations. Moreover, the reform
envisages setting up doctoral schools and
reorienting university evaluation processes from a
bureaucratic exercise to a system of promoting
teaching quality, scientific excellence and impact.
Graph 3.5.1: Total international scientific co-publications as
% of total scientific publications, 2007 and
2016
Source: European Commission
The private sector’s long-term engagement in
R&D is subdued by weak collaborative links
with research institutions. Despite several
support schemes offered by the Ministry of
Science and Higher Education, the National Centre
for Research and Development, and the
Foundation for Polish Science, the quantifiable
outcomes of collaborative R&D are modest, with a
low number of co-patents and public-private
scientific co-publications. Many Polish companies
only embark on formal R&D projects if public co-
funding and grants are available (Winckler et al,
2017). In 2015, only 10 % of innovative
companies in Poland cooperated with universities.
In addition, only a few higher education
institutions and research institutes were funded by
the private sector (Klincewicz et al, 2018). A
competitive call for industrial doctorates launched
0
10
20
30
40
50
60
70
80
90
LU
MT
CY
AT
BE
EE
SE
DK
IE NL
UK
LV
FI
BG
FR
PT
SK
HU
EL
SI
DE
CZ
ES
HR
IT LT
RO
PL
2016 2007
3.5. SECTORAL POLICIES

3.5. Sectoral policies
33
in May 2017 is expected to increase researchers’
mobility. The draft ‘Constitution for Science’ law
could better enable universities to deliver demand-
side services to enterprises. In addition, the
planned ‘Łukasiewicz Research Network’ aims at
integrating selected research institutes and creating
synergies to ensure an efficient management of
major projects under the Strategy for Responsible
Development.
Infrastructure and network industries
The road network in Poland continues to
improve. In 2017, more than 370 km of new
national roads were added to the network. The
newly amended national road construction
programme provides a financial framework to
continue the development of high-speed roads until
2023, with EU funds covering around 40 % of
their total costs. However, the programme and its
financial allocation were often subject to sudden
changes, jeopardising the means invested to
prepare certain projects. In principle, the
programme priorities were selected to match the
growing traffic demand and the requirements for
European connectivity, but the mobility needs of
northern regions remain only partly addressed. In
particular, insufficient connectivity may affect the
growth potential of the Pomerania region (Graph
3.5.2).
Road safety remains poor, particularly for
pedestrians and cyclists. With fatalities dropping
by a cumulative 23 %, Poland made substantial
progress in 2010-2016. However, in 2016 the
number of road fatalities increased to 79 deaths per
1 million inhabitants, and Poland was still among
the EU Member States with the highest rate of
road fatalities. The 2016 EU average was 50 per 1
million. In cities, pedestrians and cyclists are
disproportionately affected, as they account for
more than 50 % of the fatal victims of road
accidents. The main factors behind the poor safety
record include lack of appropriate regulatory
solutions, such as an absolute priority of
pedestrians over vehicles at pedestrian crossings,
ineffective law enforcement against dangerous
driving habits and inadequate safety infrastructure.
Graph 3.5.2: Network of high-speed roads until 2023
Source: European Commission
Modernisation of the railway network is
accelerating, although most of the challenges in
the sector persist. In 2017, EU funds financed
over 50 % of the overall investments implemented
under the national railway programme. The
implementation of Rail Baltica progressed with the
first section to the north of Białystok. Despite a
faster contracting of railway projects, there is still
risk that all railway investments planned until 2023
will not be completed on time. This is mainly due
to a limited capacity in the construction sector and
institutional weaknesses of the infrastructure
managing authority. In comparison to the road
sector, complex administrative and financial
procedures are still affecting the effectiveness of
the railway managing body. The railway network
high vulnerability to traffic disruptions and a
limited coordination of works are affecting the
already low speed of average commercial freight
rail. The risk of missing the programme objectives
is further aggravated by a lack of appropriate
measures to address the challenges of increased
investments, as well as too few reserve projects
with secured funding under the national railway
programme. The High Level Group on Railway
Investments is working to resolve the main
bottlenecks to investments in the railway with EU
funds.
Strategic long-term planning of transport
investments is missing. There is still no strategic
regulatory framework for the long-term (beyond
2023) development of the transport networks for
all modes, including clear identification and
attribution of their roles and safeguarding of

3.5. Sectoral policies
34
appropriate financing solutions. Poland's transport
development strategy, which is currently under
review, may eventually accommodate these needs.
Poland is still challenged by a low fixed
broadband coverage and take-up. The number
of households with a broadband connection
remains low; with only 78 % of households
connected in 2017, Poland was significantly below
the EU average of 85 %. The negative effects of
low fixed broadband coverage are only partially
offset by high mobile broadband take-up. Local
authorities charge telecom operators high fees for
using installation space on roads, hampering the
effective roll-out of broadband infrastructure and
raising its maintenance cost.
Energy
Despite ongoing changes, the electricity sector is
challenged by the need to expand capacity,
modernise and to reduce greenhouse gas
emissions. Without additional investment, the
projected growth in electricity demand may lead to
electricity shortages after 2020 (PSE, 2016). The
large part of ageing generation capacity does not
meet the pollutant emissions standards and would
not work flexibly with plants producing energy
from intermittent renewables. Currently, around
80 % of power generation relies on coal (Graph
3.5.3) and will thus be exposed to the changing
price of emission allowances under the EU
emissions trading system (EU ETS). An update of
the strategic outlook for the Polish energy mix is
missing, but the most recent government
declarations indicate that coal is to keep its
dominating share. To support the transition of
mining regions towards clean energy, the
Commission initiated a pilot programme for
Silesia region under the Coal and Carbon-Intensive
Regions in Transition initiative.
In the short term, expansion of electricity
supply capacity is planned mainly in the form
of coal-fired generation. Over 3 GW of new coal-
fired and over 1 GW of new gas-fired capacity is
being built. More mainly gas-fired generation
projects are also being analysed. Some efficient
coal combustion and pollution control technologies
are to be applied and coal gasification feasibility is
considered. The development of co-generation is
suffering from regulatory uncertainty over the
regulation of its support system. The Polish
nuclear power programme has been delayed.
Poland is making little use of electricity
interconnectors and only scarce progress on their
development has been observed (see European
Commission, 2017a). Constrained by insufficient
capacity and facing difficulties to finance the
necessary investment, Poland is planning to use the
capacity mechanism, which is to be operational as
of 2018.
Graph 3.5.3: Gross electricity generation by fuel - TWh, 2015
Source: European Commission
Despite renewables becoming more competitive,
their deployment was hampered by recent
legislative changes. The 2016 regulation set de
facto prohibitive requirements for new on-shore
wind installations. The 2017 change of certain
provisions related to the green certificates affected
existing renewable energy installations that were
receiving this support. In conjunction, the
renewables operators also suffered from unilateral
termination of long-term contracts by state-
controlled entities. It is also not clear how much
additional renewable capacity Poland plans to
develop. On a positive note, Poland introduced an
auction-based scheme to support new producers of
electricity from renewable sources. These elements
create a mixed investment climate for renewables.
Hence, the achievements of the 2020 national
renewables target will be challenging (33).
(33) The preliminary ESTAT data suggest a 2016 decline in the
share of renewables in final energy consumption to 11.3 %,
down from 11.7 % in 2015.
0%
10%
20%
30%
40%
50%
60%
70%
80%
90%
100%
PL EU28
Nuclear
Other
Gases
Renewables
Solid Fuels

3.5. Sectoral policies
35
The electricity market has become increasingly
competitive, but coal-based generation and lack
of interconnections have an impact on prices.
While domestic coal is still relatively cheap, the
operation of inefficient old power plants is costly.
Lack of and limited use of interconnections likely
makes prices higher (34). While market
competition has been improving in recent years,
state-controlled enterprises dominate the market.
In 2017 state ownership was further expanded.
Retail prices for electricity are regulated for
households, and currently there is no roadmap for
deregulation in this sector. The restructuring of
coal mines might affect electricity bills.
Gas supply security is gradually improving.
Poland has been developing its gas
interconnectivity. The liquefied natural gas
terminal in Świnoujście and a significant reverse-
flow interconnection with Germany are
operational. While connections with other EU
Member States are not yet developed (35), the
situation is to improve, with the construction of
additional interconnectors, notably between Poland
and Denmark (BalticPipe), as well as with
Lithuania (GIPL).
While competition in the gas wholesale market
is becoming restricted, the gas retail market is
being liberalised. In 2016, the number of firms
holding licences and actively participating in the
wholesale trade of gas was increasing. However,
this positive trend may be reversed. As a result of
legislative changes in 2016 and 2017, companies
importing gas on the wholesale market are obliged
to ensure mandatory gas stocks in Poland or
abroad. If abroad, they must be able to
permanently secure the interconnector capacity in
addition to capacity reserved for supplying their
customers. Currently, the only existing storage
capacities in Poland are those of the state-owned
company with the leading role in the market. In the
first three quarters of 2017, the wholesale gas
prices were similar to the prices of neighbouring
central European countries but higher than in
Germany. In October 2017, gas prices were
liberalised for all customer groups except for
households, which is scheduled for 2024.
(34) Wholesale electricity prices have been above those in some
neighbouring countries. See European Commission (2017i)
and Market Observatory (2017).
(35) The existing connection with the Czech Republic allows
only for 0.5 bcm/year flow.
Climate and environmental issues
Poland is one of the most energy-intensive
economies in the EU, contributing to substantial
greenhouse gas emissions. Although the primary
energy intensity declined in Poland much faster
than the EU average from 2005 to 2015 (3.4 % and
2 %, respectively), the economy is still among the
most energy-intensive in the EU. In addition,
against the background of a strong economic
growth, final energy consumption has been
increasing. However, greenhouse gas emissions
per capita are just above the EU average. Poland
faces the challenge of mitigating the energy
demand and exploiting the potential for energy
efficiency in all sectors.
Poland is on track to meet its greenhouse gas
emissions target, but transport emissions are on
the rise. Poland aims to limit the increase of its
greenhouse gas emissions in sectors outside the
EU ETS to 14 % by 2020 from the 2005 levels.
Poland’s non-ETS emissions increased by 7.1 %
between 2005 and 2016, staying below the interim
target. The biggest contributor to total greenhouse
gas emissions is the energy sector, due to its
dependence on coal. Transport emissions,
however, remain a growing source of concern as
emissions and energy consumption from this sector
have increased in recent years. According to
national projections, Poland will reach its 2020
greenhouse gas emissions target with a wide
margin, limiting the increase to 5.6 % against the
target ceiling of +14 %.
The measured concentration of air pollutants
continues to exceed EU standards and classifies
Polish cities as top-polluted in Europe. The most
severe situation has been reported for
benzo[a]pyrene (in some cases more than 10 times
the target value) and particle pollution. Air
pollution is reported to have strong health
implications, causing a large number of premature
deaths (EEA, 2017). In September 2017, Poland
adopted a long-awaited regulation setting
standards for coal and wood biomass boilers below
500kW, i.e. those used in individual houses. The
regulation entered into force in October 2017. The
key measure introducing standards for solid fuels
used for individual heating is still in consultations.

36
Commitments Summary assessment(36
)
2017 Country-specific recommendations (CSRs)
CSR 1: Pursue a substantial fiscal effort in 2018, in
line with the requirements of the preventive arm of
the Stability and Growth Pact, taking into account
the need to strengthen the ongoing recovery and to
ensure the sustainability of Poland’s public
finances. Take steps to improve the efficiency of
public spending and limit the use of reduced VAT
rates.
Pursue a substantial fiscal effort in 2018, in line
with the requirements of the preventive arm of the
Stability and Growth Pact, taking into account the
need to strengthen the ongoing recovery and to
ensure the sustainability of Poland’s public
finances.
Take steps to improve the efficiency of public
spending
Poland has made limited progress in addressing
CSR1.
This overall assessment of CSR 1 does not include an
assessment of compliance with the Stability and
Growth Pact.
The compliance assessment with the Stability and
Growth Pact will be carried out in spring when final
data for 2017 is available.
Limited progress has been made in improving the
efficiency of public spending. In 2017, work
continued on a reform of the budget process that was
announced in 2016. Measures are planned to support
macroeconomic forecasting, help modernise the Chart
of Accounts to facilitate a move towards accrual
accounting, and to strengthen the medium-term
budgetary framework. The work also continued on
amendments to the public finance law that would in
particular incorporate spending reviews in the
budgetary process and strengthen the role of internal
audit in the public sector. No implementation date for
(36) The following categories are used to assess progress in implementing the 2017 country-specific recommendations (CSRs):
No progress: The Member State has not credibly announced nor adopted any measures to address the CSR. This category covers a
number of typical situations, to be interpreted on a case-by-case basis taking into account country-specific conditions. They
include the following:
no legal, administrative, or budgetary measures have been announced in the national reform programme, in any other
official communication to the national Parliament/relevant parliamentary committees or the European Commission,
publicly (e.g. in a press statement or on the government's website);
no non-legislative acts have been presented by the governing or legislative body;
the Member State has taken initial steps in addressing the CSR, such as commissioning a study or setting up a study
group to analyse possible measures to be taken (unless the CSR explicitly asks for orientations or exploratory actions).
However, it has not proposed any clearly-specified measure(s) to address the CSR.
Limited progress: The Member State has:
announced certain measures but these address the CSR only to a limited extent; and/or
presented legislative acts in the governing or legislative body but these have not been adopted yet and substantial further,
non-legislative work is needed before the CSR is implemented;
presented non-legislative acts, but has not followed these up with the implementation needed to address the CSR.
Some progress: The Member State has adopted measures:
that partly address the CSR; and/or
that address the CSR, but a fair amount of work is still needed to address the CSR fully as only a few of the measures
have been implemented. For instance, a measure or measures have been adopted by the national Parliament or by
ministerial decision, but no implementing decisions are in place.
Substantial progress: The Member State has adopted measures that go a long way towards addressing the CSR and most of them
have been implemented.
Full implementation: The Member State has implemented all measures needed to address the CSR appropriately.
ANNEX A
OVERVIEW TABLE

A. Overview Table
37
and limit the use of reduced VAT rates.
the reform of the budget planning and budgetary
procedures has been set.
No progress was made on limiting the extensive use
of reduced VAT rates.
CSR 2: Take steps to increase labour market
participation, in particular for women, the low-
qualified and older people, including by fostering
adequate skills and removing obstacles to more
permanent types of employment. Ensure the
sustainability and adequacy of the pension system
by taking measures to increase the effective
retirement age and by starting to reform the
preferential pension arrangements.
Take steps to increase labour market participation,
in particular for women, the low-qualified and older
people, including by fostering adequate skills and
removing obstacles to more permanent types of
employment.
Ensure the sustainability and adequacy of the
pension system by taking measures to increase the
effective retirement age and by starting to reform
the preferential pension arrangements.
Poland has made limited progress in addressing
CSR2.
Limited progress has been made as regards measures
to increase labour market participation. Some policy
measures can be expected to increase activity. In
particular the creation of nurseries should become
easier and the public funding for them was increased.
The number of places in kindergartens was also
increased. Some barriers to permanent employment
may potentially be removed by new labour codes, but
the drafts have not yet been published. No government
decision has been made on the higher education
reform. Simultaneously, the lowered statutory
retirement age acts towards limiting labour market
participation. Labour market participation of the
respective groups increased during the last 3-4
quarters thanks to a strong cyclical position of the
economy.
No progress has been achieved in ensuring the
sustainability and adequacy of the pension system.
The sustainability and adequacy of the pension system
was weakened by lowering of the statutory retirement
age which came into force on 1 October 2017. No
measures have been implemented to increase the
effective retirement age. Also no measures have been
taken to start reforming the preferential pension
arrangements.
CSR 3: Take measures to remove barriers to
investment, particularly in the transport sector.
Take measures to remove barriers to investment,
particularly in the transport sector.
Poland has made limited progress in addressing
CSR3.
There was no progress in ensuring legal certainty and
trust in the quality and predictability of policies,
including regulatory changes, and institutions.
Limited progress has been made as regards the
construction-related procedures: the government is
working on legislative proposals that, if effectively

A. Overview Table
38
implemented, could simplify environmental
procedures and issuing construction permits. Some
progress has been made in removing obstacles to
investment in the transport sector. The contracting and
implementation of rail and road projects was
accelerated and some new legislative and non-
legislative measures were implemented or are in the
legislative process.
Europe 2020 (national targets and progress)
Employment rate target: 71 % Employment rate among people aged 20-64 has
increased strongly since 2013 reaching 69.3 % in
2016. Data for the first three quarters of 2017 show a
continuation of a positive trend.
R&D target set in the 2013 NRP: R&D intensity
target is 1.7 % for 2020
0.97% of GDP (2016).
Limited progress towards the target. Public R&D
intensity has been growing on average by 6.2%
annually over the period 2007-2016, Poland will reach
its national target for 2020 if further substantial
increase of R&D intensity is achieved with the
minimum average annual growth of 15.2% over the
period 2016-2020.
Greenhouse gas emissions target:
- National greenhouse gas emissions target:
+14 % in 2020 compared to 2005 (in non-ETS
sectors)
According to estimates, greenhouse gas emissions in
sectors not covered by the EU ETS increased by 7.1 %
between 2005 and 2016, i.e. below the 2016 ceiling of
+9.7 %. According to the latest national projections,
based on existing measures, non-ETS emissions will
increase by 5.6 % between 2005 and 2020. The target
is consequently expected to be met with a substantial
margin of 8.4 percentage points.
2020 Renewable energy target: 15%
Share of renewable energy in all modes of
transport: 10%
According to preliminary ESTAT 2016 data, a share
of renewable energy in final energy consumption
decreased to 11.3 % in 2016.
Poland is lagging behind in reaching the target of
10 % for renewable energy share in transport. In 2016
the share equalled 3.9 %, displaying a sharp decline
from 2015.
Energy efficiency: reduction of energy
consumption
Poland has set an indicative national energy
The preliminary ESTAT 2016 data show the levels of
primary (94.3 Mtoe) and final energy consumption
(66.7 Mtoe) below the 2020 indicative national
targets. Following a period of decline both energy

A. Overview Table
39
efficiency target of reaching a 2020 level of 96.4
Mtoe primary consumption and 71.6 Mtoe final
energy consumption.
consumption indicators increased slightly in 2015 -
2016, compared to 2014. Poland will need to continue
efforts to keep energy consumption levels in check
until 2020.
Early school leaving target: 4.5 % Poland is one of the best EU performers on early
school leavers with the rate of 5.2 % in 2016 being
less than half the EU average of 10.8 %.
Tertiary education target: 45 % Poland is among the EU countries with a high tertiary
education attainment. The share of the population
aged 30-34 who have successfully completed tertiary
studies have been increasing for the last several years.
The rate was 44.6 % in 2016 and it is likely that the
national target of 45 % was already reached in 2017.
Risk of poverty or social exclusion target: Target
on the reduction of population at risk of poverty or
social exclusion in number of persons: 1 500 000
Poland has achieved the target since 2012. By 2016
the number of people at risk of poverty or social
exclusion declined by 3.3 million.

40
ANNEX B
MACROECONOMIC IMBALANCE PROCEDURE SCOREBOARD
Table B.1: The Macroeconomic Imbalance Procedure scoreboard for Poland (AMR 2018)
Flags: b:Break in series. e:Estimated. p:Provisional.
1) This table provides data as published under the Alert Mechanism Report 2018, which reports data as of 24 Oct 2017. Please
note that figures reported in this table may therefore differ from more recent data elsewhere in this document. 2) Unit labour
cost: 2010 break in time series. Since the indicator is a three year % change the break affects the series until the 2012 figure. 3)
Unemployment rate: i = Eurostat back-calculation to include 2011 Population Census results. 4) Figures highlighted are those
falling outside the threshold established in the European Commission's Alert Mechanism Report.
Source: European Commission 2017, Statistical Annex to the Alert Mechanism Report 2018, SWD(2017) 661.
Thresholds 2011 2012 2013 2014 2015 2016
Current account balance, % of GDP 3 year average -4%/6% -4.8 -4.8 -3.4 -2.4 -1.3 -1.0
Net international investment position % of GDP -35% -62.4 -65.3 -68.9 -69.1 -62.1 -60.7
Real effective exchange rate - 42 trading
partners, HICP deflator3 year % change
±5% (EA)
±11% (Non-EA)-11.5 1.4 -4.3 -1.0 -1.3 -5.0
Export market share - % of world exports 5 year % change -6% 15.3 1.9 0.2 5.2 9.6 18.1
Nominal unit labour cost index
(2010=100)3 year % change
9% (EA)
12% (Non-EA)4.2 5.3 3.1 2.9 0.3 2.1p
House price index (2015=100), deflated 1 year % change 6% -4.6 -6.6 -4.8 1.2 2.6 2.5
Private sector credit flow, consolidated % of GDP 14% 6.7 4.8 3.3 4.6 3.5 4.7
Private sector debt, consolidated % of GDP 133% 73.9 73.4 75.4 78.1 78.9 81.6
General government gross debt % of GDP 60% 54.1 53.7 55.7 50.2 51.1 54.1
Unemployment rate 3 year average 10% 9.2i 9.8 10.0 9.8 8.9 7.6
Total financial sector liabilities, non-
consolidated1 year % change 16.5% 4.8 10.7 7.4 0.7 2.4 8.9
Activity rate - % of total population aged
15-643 year change in pp -0.2 pp 1.9 1.8 1.7b 2.2 1.6 1.8
Long-term unemployment rate - % of
active population aged 15-743 year change in pp 0.5 pp 1.2 1.6 1.4 0.2 -1.1 -2.2
Youth unemployment rate - % of active
population aged 15-243 year change in pp 2 pp 8.6 5.9 3.6 -1.9 -5.7 -9.6
Ex
tern
al
imb
ala
nc
es
an
d c
om
pe
titi
ve
ne
ss
Inte
rna
l im
ba
lan
ce
sE
mp
loy
me
nt
ind
ica
tors

41
ANNEX C
STANDARD TABLES
Table C.1: Financial market indicators
(1) Latest data Q3 2017. Includes not only banks but all monetary financial institutions excluding central banks.
(2) Latest data Q2 2017.
(3) As per ECB definition of gross non-performing debt instruments.
(4) Quarterly values are not annualised.
(5) Latest data April 2017.
* Measured in basis points.
Source: European Commission (long-term interest rates); World Bank (gross external debt); Eurostat (private debt); ECB (all
other indicators).
2012 2013 2014 2015 2016 2017
Total assets of the banking sector (% of GDP)(1) 90.9 91.5 92.4 91.7 95.3 91.6
Share of assets of the five largest banks (% of total assets) 44.4 45.2 48.3 48.6 47.7 -
Foreign ownership of banking system (% of total assets)(2) 61.9 61.3 59.1 58.9 56.5 45.2
Financial soundness indicators:2)
- non-performing loans (% of total loans)(3)
6.4 6.0 5.4 5.0 4.7 4.9
- capital adequacy ratio (%) 14.9 15.6 14.9 15.8 16.9 17.5
- return on equity (%)(4) 10.8 10.0 9.4 7.7 7.5 3.5
Bank loans to the private sector (year-on-year % change)(1) 7.3 4.0 5.4 5.8 3.8 6.5
Lending for house purchase (year-on-year % change)(1) 6.8 3.0 3.5 4.5 2.9 2.8
Loan to deposit ratio(1) 101.7 99.5 98.3 97.2 93.9 97.3
Central Bank liquidity as % of liabilities(5) 0.0 0.0 0.0 0.0 0.0 0.0
Private debt (% of GDP) 73.4 75.4 78.1 78.9 81.6 -
Gross external debt (% of GDP)(2)
- public 29.6 28.3 29.3 29.2 28.4 27.0
- private 28.7 28.5 29.0 28.8 30.5 28.4
Long-term interest rate spread versus Bund (basis points)* 350.5 246.3 235.3 220.6 294.6 311.5
Credit default swap spreads for sovereign securities (5-year)* 154.1 77.4 60.8 61.1 75.9 58.7

C. Standard Tables
42
Table C.2: Headline Social Scoreboard indicators
† The Social Scoreboard includes 14 headline indicators, of which 12 are currently used to compare Member States
performance. The indicators "participants in active labour market policies per 100 persons wanting to work" and
"compensation of employees per hour worked (in EUR)" are not used due to technical concerns by Member States. Possible
alternatives will be discussed in the relevant Committees.
(1) People at risk of poverty or social exclusion (AROPE): individuals who are at risk of poverty (AROP) and/or suffering from
severe material deprivation (SMD) and/or living in households with zero or very low work intensity (LWI).
(2) Unemployed persons are all those who were not employed but had actively sought work and were ready to begin
working immediately or within two weeks.
(3) Gross disposable household income is defined in unadjusted terms, according to the draft Joint Employment Report 2018.
(4) Reduction in percentage of the risk of poverty rate, due to social transfers (calculated comparing at-risk-of poverty rates
before social transfers with those after transfers; pensions are not considered as social transfers in the calculation).
(5) Average of first three quarters of 2017 for the employment rate and gender employment gap.
Source: Eurostat.
2012 2013 2014 2015 2016 2017 5
Equal opportunities and access to the labour market
Early leavers from education and training
(% of population aged 18-24)5.7 5.6 5.4 5.3 5.2 :
Gender employment gap (pps) 14.5 14.5 14.2 13.8 14.2 14.3
Income inequality, measured as quintile share ratio (S80/S20) 4.9 4.9 4.9 4.9 4.8 :
At-risk-of-poverty or social exclusion rate1 (AROPE) 26.7 25.8 24.7 23.4 21.9 :
Young people neither in employment nor in education and
training (% of population aged 15-24)11.8 12.2 12.0 11.0 10.5 :
Dynamic labour markets and fair working conditions†
Employment rate (20-64 years) 64.7 64.9 66.5 67.8 69.3 70.8
Unemployment rate2 (15-74 years) 10.1 10.3 9.0 7.5 6.2 4.9
Gross disposable income of households in real terms per capita3
(Index 2008=100) : : 113.2 117.0 : :
Public support / Social protection and inclusion
Impact of social transfers (excluding pensions) on poverty
reduction4 25.3 24.8 26.4 23.1 24.5 :
Children aged less than 3 years in formal childcare 6.0 5.0 5.5 5.3 7.9 :
Self-reported unmet need for medical care 9.0 8.8 7.8 7.3 6.6 :
Individuals who have basic or above basic overall digital skills
(% of population aged 16-74): : : 40.0 44.0 46.0

C. Standard Tables
43
Table C.3: Labour market and education indicators
* Non-scoreboard indicator
(1) Long-term unemployed are people who have been unemployed for at least 12 months.
(2) Difference between the average gross hourly earnings of male paid employees and of female paid employees as a
percentage of average gross hourly earnings of male paid employees. It is defined as "unadjusted", as it does not correct for
the distribution of individual characteristics (and thus gives an overall picture of gender inequalities in terms of pay). All
employees working in firms with ten or more employees, without restrictions for age and hours worked, are included.
(3) PISA (OECD) results for low achievement in mathematics for 15 year-olds.
(4) Impact of socio-economic and cultural status on PISA (OECD) scores. Values for 2012 and 2015 refer respectively to
mathematics and science.
(5) Average of first three quarters of 2017, unless for the youth unemployment rate (annual figure).
Source: Eurostat, OECD.
Labour market indicators 2012 2013 2014 2015 2016 2017 5
Activity rate (15-64) 66.5 67.0 67.9 68.1 68.8 :
Employment in current job by duration
From 0 to 11 months 11.8 11.0 11.7 11.1 11.5 :
From 12 to 23 months 9.4 9.2 9.3 9.6 10.0 :
From 24 to 59 months 17.7 16.4 15.8 15.6 15.9 :
60 months or over 60.8 62.7 62.5 62.3 61.1 :
Employment growth*
(% change from previous year) 0.1 -0.1 1.7 1.5 0.6 1.2
Employment rate of women
(% of female population aged 20-64) 57.5 57.6 59.4 60.9 62.2 63.7
Employment rate of men
(% of male population aged 20-64)72.0 72.1 73.6 74.7 76.4 78.0
Employment rate of older workers*
(% of population aged 55-64)38.7 40.6 42.5 44.3 46.2 48.2
Part-time employment*
(% of total employment, aged 15-64)7.2 7.1 7.1 6.8 6.4 6.6
Fixed-term employment*
(% of employees with a fixed term contract, aged 15-64)26.8 26.8 28.3 28.0 27.5 26.3
Transition rate from temporary to permanent employment
(3-year average)20.8 18.8 18.4 18.8 : :
Long-term unemployment rate1 (% of labour force) 4.1 4.4 3.8 3.0 2.2 1.5
Youth unemployment rate
(% active population aged 15-24)26.5 27.3 23.9 20.8 17.7 14.6
Gender gap in part-time employment 6.1 5.9 5.9 5.7 6.0 6.4
Gender pay gap2 (in undadjusted form) 6.4 7.1 7.7 7.7 : :
Education and training indicators 2012 2013 2014 2015 2016 2017
Adult participation in learning
(% of people aged 25-64 participating in education and training)4.5 4.3 4.0 3.5 3.7 :
Underachievement in education3 14.4 : : 17.2 : :
Tertiary educational attainment (% of population aged 30-34 having
successfully completed tertiary education)39.1 40.5 42.1 43.4 44.6 :
Variation in performance explained by students' socio-economic
status4 16.6 : : 13.4 : :

C. Standard Tables
44
Table C.4: Social inclusion and health indicators
* Non-scoreboard indicator
(1) At-risk-of-poverty rate (AROP): proportion of people with an equivalised disposable income below 60 % of the national
equivalised median income.
(2) Proportion of people who experience at least four of the following forms of deprivation: not being able to afford to i) pay
their rent or utility bills, ii) keep their home adequately warm, iii) face unexpected expenses, iv) eat meat, fish or a protein
equivalent every second day, v) enjoy a week of holiday away from home once a year, vi) have a car, vii) have a washing
machine, viii) have a colour TV, or ix) have a telephone.
(3) Percentage of total population living in overcrowded dwellings and exhibiting housing deprivation.
(4) People living in households with very low work intensity: proportion of people aged 0-59 living in households where the
adults (excluding dependent children) worked less than 20 % of their total work-time potential in the previous 12 months.
(5) Ratio of the median individual gross pensions of people aged 65-74 relative to the median individual gross earnings of
people aged 50-59.
(6) Fixed broadband take up (33%), mobile broadband take up (22%), speed (33%) and affordability (11%), from the Digital
Scoreboard.
Source: Eurostat, OECD.
2012 2013 2014 2015 2016 2017
Expenditure on social protection benefits* (% of GDP)
Sickness/healthcare 4.1 4.2 4.0 : : :
Disability 1.6 1.6 1.5 : : :
Old age and survivors 10.9 11.3 11.2 : : :
Family/children 1.3 1.4 1.5 : : :
Unemployment 0.3 0.3 0.2 : : :
Housing 0.1 0.1 0.1 : : :
Social exclusion n.e.c. 0.1 0.1 0.1 : : :
Total 18.4 18.9 18.7 : : :
of which: means-tested benefits 0.7 0.8 0.7 : : :
General government expenditure by function (% of GDP, COFOG)
Social protection 15.9 16.3 16.2 16.0 16.9 :
Health 4.6 4.6 4.6 4.7 4.6 :
Education 5.4 5.3 5.3 5.3 5.0 :
Out-of-pocket expenditure on healthcare (% of total health expenditure) : 23.7 23.1 23.3 : :
Children at risk of poverty or social exclusion (% of people
aged 0-17)*29.3 29.8 28.2 26.6 24.2 :
At-risk-of-poverty rate1 (% of total population) 17.1 17.3 17.0 17.6 17.3 :
In-work at-risk-of-poverty rate (% of persons employed) 10.4 10.7 10.6 11.2 10.8 :
Severe material deprivation rate2 (% of total population) 13.5 11.9 10.4 8.1 6.7 :
Severe housing deprivation rate3, by tenure status
Owner, with mortgage or loan 3.6 3.4 2.5 3.0 2.8 :
Tenant, rent at market price 20.8 18.4 14.2 19.8 19.5 :
Proportion of people living in low work intensity households4
(% of people aged 0-59)6.9 7.2 7.3 6.9 6.4 :
Poverty thresholds, expressed in national currency at constant prices* 10548 10549 10847 11247 11994 :
Healthy life years (at the age of 65)
Females 7.8 7.8 8.1 8.4 : :
Males 7.4 7.2 7.5 7.6 : :
Aggregate replacement ratio for pensions5 (at the age of 65) 0.6 0.6 0.6 0.6 0.6 :
Connectivity dimension of the Digital Economy and Society Inedex
(DESI)6
: : 41.7 40.1 45.9 52.4
GINI coefficient before taxes and transfers* 47.7 47.7 47.8 47.9 46.6 :
GINI coefficient after taxes and transfers* 30.9 30.7 30.8 30.6 29.8 :

C. Standard Tables
45
Table C.5: Product market performance and policy indicators
(1) The methodologies, including the assumptions, for this indicator are shown in detail here:
http://www.doingbusiness.org/methodology.
(2) Average of the answer to question Q7B_a. "[Bank loan]: If you applied and tried to negotiate for this type of financing
over the past six months, what was the outcome?". Answers were codified as follows: zero if received everything, one if
received most of it, two if only received a limited part of it, three if refused or rejected and treated as missing values if the
application is still pending or don't know.
(3) Percentage population aged 15-64 having completed tertiary education.
(4) Percentage population aged 20-24 having attained at least upper secondary education.
(5) Index: 0 = not regulated; 6 = most regulated. The methodologies of the OECD product market regulation indicators are
shown in detail here: http://www.oecd.org/competition/reform/indicatorsofproductmarketregulationhomepage.htm
(6) Aggregate OECD indicators of regulation in energy, transport and communications (ETCR).
Source: European Commission; World Bank — Doing Business (for enforcing contracts and time to start a business); OECD (for
the product market regulation indicators); SAFE (for outcome of SMEs' applications for bank loans).
Performance Indicators 2010 2011 2012 2013 2014 2015 2016
Labour productivity (real, per person employed, year-on-year %
change)
Labour productivity in Industry 13.56 6.80 3.57 -1.50 1.99 1.86 0.14
Labour productivity in Construction 10.47 11.05 -0.66 1.17 8.93 5.04 -7.50
Labour productivity in Market Services 3.42 3.10 2.18 4.75 -1.48 3.08 3.89
Unit labour costs (ULC) (whole economy, year-on-year % change)
ULC in Industry -3.17 -1.42 2.35 0.16 1.11 -1.17 2.67
ULC in Construction 2.92 -1.09 1.82 1.47 -7.05 -2.22 11.84
ULC in Market Services 4.28 2.33 3.69 -0.13 3.28 -0.05 2.23
Business Environment 2010 2011 2012 2013 2014 2015 2016
Time needed to enforce contracts(1)
(days) 830.0 830.0 685.0 685.0 685.0 685.0 685.0
Time needed to start a business(1)
(days) 39.0 39.0 39.0 37.0 37.0 37.0 37.0
Outcome of applications by SMEs for bank loans(2) na 0.52 na 0.59 0.75 0.46 0.53
Research and innovation 2010 2011 2012 2013 2014 2015 2016
R&D intensity 0.72 0.75 0.88 0.87 0.94 1.00 0.97
General government expenditure on education as % of GDP 5.50 5.40 5.40 5.30 5.30 5.20 na
Persons with tertiary education and/or employed in science and
technology as % of total employment37 37 39 40 41 42 43
Population having completed tertiary education(3) 19 20 22 23 24 24 25
Young people with upper secondary level education(4) 91 90 90 90 90 91 91
Trade balance of high technology products as % of GDP -2.30 -2.21 -1.97 -1.68 -1.44 -1.59 na
Product and service markets and competition 2003 2008 2013
OECD product market regulation (PMR)(5)
, overall 2.42 2.04 1.65
OECD PMR5, retail 2.52 2.43 2.55
OECD PMR5, professional services 3.29 3.33 3.24
OECD PMR5, network industries(6) 3.20 2.70 2.34

C. Standard Tables
46
Table C.6: Green growth
All macro intensity indicators are expressed as a ratio of a physical quantity to GDP (in 2010 prices)
Energy intensity: gross inland energy consumption (in kgoe) divided by GDP (in EUR)
Carbon intensity: greenhouse gas emissions (in kg CO2 equivalents) divided by GDP (in EUR)
Resource intensity: domestic material consumption (in kg) divided by GDP (in EUR)
Waste intensity: waste (in kg) divided by GDP (in EUR)
Energy balance of trade: the balance of energy exports and imports, expressed as % of GDP
Weighting of energy in HICP: the proportion of 'energy' items in the consumption basket used for the construction of the HICP
Difference between energy price change and inflation: energy component of HICP, and total HICP inflation (annual %
change)
Real unit energy cost: real energy costs as % of total value added for the economy
Industry energy intensity: final energy consumption of industry (in kgoe) divided by gross value added of industry (in 2010 EUR)
Real unit energy costs for manufacturing industry excluding refining : real costs as % of value added for manufacturing
sectors
Share of energy-intensive industries in the economy: share of gross value added of the energy-intensive industries in GDP
Electricity and gas prices for medium-sized industrial users: consumption band 500–20 00MWh and 10 000–100 000 GJ; figures
excl. VAT.
Recycling rate of municipal waste: ratio of recycled and composted municipal waste to total municipal waste
Public R&D for energy or for the environment: government spending on R&D for these categories as % of GDP
Proportion of GHG emissions covered by EU emissions trading system (ETS) (excluding aviation): based on GHG emissions
(excl land use, land use change and forestry) as reported by Member States to the European Environment Agency.
Transport energy intensity: final energy consumption of transport activity (kgoe) divided by transport industry gross value
added (in 2010 EUR)
Transport carbon intensity: GHG emissions in transport activity divided by gross value added of the transport sector
Energy import dependency: net energy imports divided by gross inland energy consumption incl. consumption of
international bunker fuels
Aggregated supplier concentration index: covers oil, gas and coal. Smaller values indicate larger diversification and hence
lower risk.
Diversification of the energy mix: Herfindahl index covering natural gas, total petrol products, nuclear heat, renewable
energies and solid fuels
* European Commission and European Environment Agency
Source: European Commission and European Environment Agency (Share of GHG emissions covered by ETS); European
Commission (Environmental taxes over labour taxes and GDP); Eurostat (all other indicators).
Green growth performance 2011 2012 2013 2014 2015 2016
Macroeconomic
Energy intensity kgoe / € 0.27 0.25 0.25 0.23 0.23 0.23
Carbon intensity kg / € 1.07 1.03 1.01 0.95 0.92 -
Resource intensity (reciprocal of resource productivity) kg / € 2.10 1.80 1.68 1.62 1.53 1.46
Waste intensity kg / € - 0.42 - 0.44 - -
Energy balance of trade % GDP -3.3 -3.4 -2.7 -2.6 -1.6 -1.4
Weighting of energy in HICP % 13.94 15.41 15.67 14.93 15.65 13.47
Difference between energy price change and inflation % 3.4 2.9 -1.3 -0.1 0.6 -1.9
Real unit of energy cost% of value
added21.0 20.9 19.9 18.9 - -
Ratio of environmental taxes to labour taxes ratio 0.22 0.20 0.19 0.19 0.20 -
Environmental taxes % GDP 2.6 2.6 2.4 2.6 2.7 2.7
Sectoral
Industry energy intensity kgoe / € 0.17 0.17 0.17 0.16 0.16 0.16
Real unit energy cost for manufacturing industry excl.
refining
% of value
added23.9 22.8 22.4 20.3 - -
Share of energy-intensive industries in the economy % GDP 14.38 14.41 14.23 14.15 14.22 -
Electricity prices for medium-sized industrial users € / kWh 0.10 0.09 0.09 0.08 0.09 0.08
Gas prices for medium-sized industrial users € / kWh 0.03 0.04 0.04 0.04 0.04 0.03
Public R&D for energy % GDP - 0.01 0.01 0.01 0.01 0.01
Public R&D for environmental protection % GDP - 0.02 0.02 0.03 0.03 0.02
Municipal waste recycling rate % 17.5 19.6 24.2 32.3 42.5 44.0
Share of GHG emissions covered by ETS* % 52.5 51.7 52.4 51.9 52.1 50.7
Transport energy intensity kgoe / € 0.92 0.83 0.76 0.77 0.81 0.87
Transport carbon intensity kg / € 2.51 2.25 2.06 2.08 2.20 -
Security of energy supply
Energy import dependency % 33.4 30.6 25.6 28.6 29.2 30.3
Aggregated supplier concentration index HHI 28.9 29.8 27.0 27.4 27.2 -
Diversification of energy mix HHI 0.38 0.36 0.37 0.36 0.35 0.34

47
Applica sprl, Cambridge Econometrics, Vienna Institute for International Economic Studies (2016),
Economic Challenges of Lagging Regions, annex 2, Task 2- Country report Poland,
http://ec.europa.eu/regional_policy/sources/docgener/studies/pdf/challenges_lagging/econ_challenges_lag
ging_annex7_en.pdf.
Bargu A. and M. Morgandi (2018), Can Mothers Afford to Work in Poland? Labor Supply Incentives of
Social Benefits and Childcare Costs, forthcoming in: Policy Research Working Papers, The World Bank.
Washington D.C.
Białek-Jaworska A., M. Ziembiński, D. Zięba (2016), Innowacyjność polskich przedsiębiorstw.
Działalność badawczo-rozwojowa i współpraca z biznesem, Polska Rada Biznesu and DELab, Warszawa.
Breznitz D. and D. Ornston (2017), EU financing and innovation in Poland, EBRD Working Paper No.
198, European Bank for Reconstruction and Development.
Böwer U. (2017), State-Owned Enterprises in Emerging Europe: The Good, the Bad, and the Ugly, IMF
Working Paper no 17/221, International Monetary Fund, Washington, DC.
CASE/IAS (2107), Study and Reports on the VAT Gap in the EU 28 Member States: 2017 Final Report.
TAXUD 2015/CC/131, available at: https://ec.europa.eu/taxation_customs/sites/taxation/files/
study_and_reports_on_the_vat_gap_2017.pdf.
CPB et al (2014), A study on R&D tax incentives. Final report, European Commission Taxation Papers n.
54, Luxembourg.
Council (2016), Council Recommendation of 19 December 2016 on Upskilling Pathways: New
Opportunities for Adults (2016/C 484/01).
EBRD (2017), Sustaining Growth. Transition Report 2017-2018, European Bank for Reconstruction and
Development, tr-ebrd.com.
EEA (2017), Air quality in Europe — 2017 report, European Environment Agency, EEA Report No
13/2017, available at https://www.eea.europa.eu/publications/air-quality-in-europe-2017.
EC – EPC (2018), 2018 Ageing Report: Economic and Budgetary Projections for the EU Member States
(2016-2070), (forthcoming), European Commission – Economic Policy Committee (Ageing Working
Group).
European Commission (2016a), Country Report Poland 2016, SWD (2016) 91 final.
European Commission (2016b), PISA 2015: EU Performance and initial conclusions regarding
education policies in Europe, https://ec.europa.eu/education/sites/education/files/pisa-2015-eu-policy-
note_en.pdf.
European Commission (2016c), Science, Research and Innovation performance of the EU, available at
https://publications.europa.eu/en/publication-detail/-/publication/744d5735-e1d4-11e5-8a50-
01aa75ed71a1.
European Commission (2017a), Country Report Poland 2017, SWD (2017) 86 final.
European Commission (2017b) – Labour Market and Wage Developments in Europe, Annual Review
2017, Publications Office of the European Union.
REFERENCES

References
48
European Commission (2017c), Taxation Trends in the European Union, Data for the EU Member States,
Iceland and Norway, 2017 Edition, Luxembourg.
European Commission (2017d), Employment and Social Developments in Europe, Annual Review 2017,
Publications Office of the European Union.
European Commission (2017e), The Education and Training Monitor 2017, available at
https://ec.europa.eu/ education /sites/education/files/monitor2017_en.pdf.
European Commission (2017f), European Economic Forecast Autumn 2017, Institutional Papers 063.
European Commission (2017g), My Region, My Europe, Our Future, Seventh report on economic, social
and territorial cohesion, SWD(2017) 330 final, Brussels.
European Commission (2017h), European Innovation Scoreboard 2017.
European Commission (2017i), Energy Union Factsheet Poland, 0020SWD(2017) 407 final, Brussels.
European Commission (2018a), Debt Sustainability Monitor 2017, Institutional Paper no. 071.
European Commission (2018b), Science, Research and Innovation performance of the EU, forthcoming.
EIU et al. (2015), Risk and Return. Foreign Direct Investment and the Rule of Law, Economist
Intelligence Unit, Hogan Lovells, Bingham Centre for the Rule of Law and the Investment Treaty Forum,
available at https://www.biicl.org/newsitem/6112.
Fundacja Republikańska (2017), Główne ryzyka i bariery działalności gospodarczej w Polsce:
Perspektywa mikroprzedsiębiorców i małych przedsiębiorstw, Warszawa.
Grant Thornton (2017a), Barometr stabilności otoczenia prawnego w Polsce, Warszawa.
Grant Thornton (2017b), Niestrawny VAT od żywności. Szacunek wpływu ujednolicenia stawek
podatkowych dla produktów spożywczych, Warszawa.
GUS (2017a), Oświata i wychowanie w roku szkolnym 2016/2017, Główny Urząd Statystyczny,
Warszawa.
GUS (2017b), Budżety gospodarstw domowych w 2016 r., Główny Urząd Statystyczny, Warszawa.
IBE (2015), Dynamika przemian w edukacji i diagnoza problemów, Instytut Badań Edukacyjnych,
Warszawa.
IFiS (2013), Program Międzynarodowej Oceny Umiejętności Uczniów OECD PISA. Wyniki Badania
2012 w Polsce, Instytut Filozofii i Socjologii PAN.
IMF (2015), Republic of Poland: Technical Assistance Report-Tax Administration-Modernization
Challenges and Strategic Priorities, Country Report No. 15/112, International Monetary Fund,
Washington, DC.
IMF (2017a), Republic of Poland: Developing a Medium-Term Budget Framework, Technical Assistance
Report, International Monetary Fund, Washington, DC.

References
49
IMF (2017b), Regional Economic Outlook: Europe Hitting Its Stride, International Monetary Fund,
Washington, DC.
Invest Europe (2017), Central and Eastern Europe Private Equity Statistics 2016, available at
https://www.investeurope.eu/media/671537/invest-
europe_cee_privateequitystatistics2016_24082017.pdf.
Jonkers, K. and C.S. Wagner (2017), Open countries have strong science, Nature Vol 550, pp. 32–33.
Klincewicz, K., Marczewska, M., Szkuta K. (2018), RIO country report 2017; forthcoming.
Magda, I. (2017), Family 500+ and women’s labour market participation, Presentation at the Institute for
Structural Research seminar, 24 October.
Market Observatory (2017), Quarterly Report on Energy on European Electricity Markets, Market
Observatory for Energy DG Energy Volume 10 (issue 1; first quarter of 2017), European Commission,
Brussels.
MF (2015), Analiza elastyczności wydatków budżetowych w Polsce, Podsumowanie wyników współpracy
z OECD, Ministerstwo Finansów, Warszawa.
Myck M. and M. Oczkowska (eds.) (2017), Pokolenie 50+ w Polsce na tle Europy: aktywność, zdrowie i
jakość życia. Wyniki na podstawie badania SHARE, Centrum Analiz Ekonomicznych CenEA.
Moody's (2018), Sovereigns – Central & Eastern Europe: 2018 outlook stable as solid growth offsets
structural and institutional challenges, Outlook, 17 January.
NBP (2017a), Szybki Monitoring NBP. Analiza Sytuacji Sektora Przedsiębiorstw, nr 04/17, Narodowy
Bank Polski, Warszawa.
NBP (2017b), Informacja o cenach mieszkań i sytuacji na rynku nieruchomości mieszkaniowych i
komercyjnych w Polsce - II kwartał 2017, Narodowy Bank Polski, Warszawa.
NBP (2017c), Kwartalny raport o rynku pracy w I kw. 2017 r., nr 02/17, Narodowy Bank Polski,
Warszawa.
NIK (2017a), Informacja o wynikach kontroli: Poszanowanie przez Urzędy Skarbowe interesów
podatników oraz zabezpieczenie interesów Skarbu Państwa przy wykonywaniu egzekucji
administracyjnej, KBF.430.003.2017, nr ewid. 14/2017/P/16/011/KBF, Najwyższa Izba Kontroli,
Warszawa, available at https://www.nik.gov.pl/plik/id,13888,vp,16325.pdf.
NIK (2017b), System gospodarowania przestrzenią gminy jako dobrem publicznym, Nr ewid.
193/2016/KIN, Najwyższa Izba Kontroli, Warszawa.
Obywatelskie Forum Legislacji – Fundacja Batorego (2017), X Komunikat Obywatelskiego Forum
Legislacji o jakości procesu legislacyjnego na podstawie obserwacji w okresie od 16 listopada 2016 do
15 listopada 2017 roku, available at
http://www.batory.org.pl/programy_operacyjne/przeciw_korupcji/przejrzystosc_w_procesie_stanowienia
_prawa_1/obserwacje_rzadowego_procesu_tworzenia_prawa.
OECD (2016a), Technologies for Better Tax Administration: A Practical Guide for Revenue Bodies,
OECD Publishing, Paris.

References
50
OECD (2016b), Skills Matter: Further Results from the Survey of Adult Skills, OECD Publishing, Paris.
OECD (2017a), Tax Administration 2017: Comparative Information on OECD and Other Advanced and
Emerging Economies, OECD Publishing, Paris.
OECD/European Observatory (2017), Poland: Country Health Profile 2017, State of Health in the EU,
OECD Publishing, Paris/European Observatory on Health Systems and Policies, Brussels.
PSE (2016), Prognoza pokrycia zapotrzebowania szczytowego na moc w latach 2016 – 2035, Polskie
Sieci Elektroenergetyczne, Konstancin-Jeziorna.
PwC (2017), Wyłudzenia VAT - luka podatkowa w 2016 r. i prognoza na 2017, Warszawa.
Republic of Poland (2016), Ustawa z dnia 16 grudnia 2016 r. o zasadach zarządzania mieniem
państwowym, available at http://dziennikustaw.gov.pl/du/2016/2259/1.
Vandenbussche H., (2014), Quality in Exports, Economic Papers 528, European Commission,
Directorate-General for Economic and Financial Affairs, Brussels.
Visser (2016a), ICTWSS Data base. version 5.1, Amsterdam: Amsterdam Institute for Advanced Labour
Studies (AIAS), University of Amsterdam.
Visser J. (2016b), What happened to collective bargaining during the great recession?, IZA Journal of
Labour Policy 2016 5:9.
WEF (2017), Global Competitiveness Index 2017-2018, World Economic Forum.
Winckler, G. et al. (2017), Horizon 2020 Policy Support Facility Peer Review of Poland's Higher
Education and Science system, European Commission, Brussels.
Wise-Europa (2016), Wiatr w żagle. Obywatelska strategia dla polskiego rynku kapitałowego, Warszawa.
Woessmann, L. (2016), The Importance of School Systems: Evidence from International Differences in
Student Achievement, Journal of Economic Perspectives, 30(3): 3-32.
World Bank (2017), Doing Business 2018: Reforming to Create Jobs, World Bank, Washington, DC.
World Bank and PwC (2017), Paying Taxes 2018, available at: https://www.pwc.com/gx/en/services/tax/
publications/paying-taxes-2018.html.
ZUS (2017), Informacja o świadczeniach pieniężnych z funduszu ubezpieczeń społecznych oraz o
niektórych świadczeniach z zabezpieczenia społecznego, III kwartał/okres I-IX 2017, Zakład Ubezpieczeń
Społecznych Warszawa.