2018 european semester: assessment of progress on structural reforms… · · 2018-03-07private...
TRANSCRIPT

EN EN
EUROPEAN COMMISSION
Brussels, 7.3.2018
SWD(2018) 209 final
COMMISSION STAFF WORKING DOCUMENT
Country Report Croatia 2018
Including an In-Depth Review on the prevention and correction of macroeconomic
imbalances
Accompanying the document
COMMUNICATION FROM THE COMMISSION TO THE EUROPEAN
PARLIAMENT, THE COUNCIL, THE EUROPEAN CENTRAL BANK AND THE
EUROGROUP
2018 European Semester: Assessment of progress on structural reforms, prevention and
correction of macroeconomic imbalances, and results of in-depth reviews under
Regulation (EU) No 1176/2011
{COM(2018) 120 final}
Executive summary 1
1. Economic situation and outlook 4
2. Progress with country-specific recommendations 9
3. Summary of the main findings from the Macroeconomic Imbalance Procedure
indepth review 13
4. Reform priorities 18
4.1. Public finances* and taxation 18
4.2. Private sector debt and financial sector* 24
4.3. Labour market, social policies and education* 31
4.4. Competitiveness and investment* 39
4.5. Public governance* 47
Annex A: Overview table 54
Annex B: Macroeconomic Imbalance Procedure scoreboard 60
Annex C: Standard tables 61
References 67
LIST OF TABLES
Table 2.1: CSR progress 11
Table 3.1: MIP Matrix 16
Table 4.1.1: Tax wedge comparison with peers 21
Table 4.2.1: Financial soundness indicators, all banks in Croatia 29
Table 4.5.1: Hospital beds by type, per 100 000 inhabitants, 2015 52
Table B.1: The MIP scoreboard for Croatia (AMR 2018) 60
Table C.1: Financial market indicators 61
Table C.2: Headline Social Scoreboard indicators 62
Table C.3: Labour market and education indicators 63
Table C.4: Social inclusion and health indicators 64
Table C.5: Product market performance and policy indicators 65
Table C.6: Green growth 66
CONTENTS
LIST OF GRAPHS
Graph 1.1: Real GDP growth by demand component 4
Graph 1.2: Current account composition, gross external debt and net international investment
position 5
Graph 1.3: Inflation and main components in Croatia and the EU 5
Graph 1.4: Contributions to rate of change in yearly unit labour costs 6
Graph 1.5: Actual and potential output growth 7
Graph 2.1: Level of implementation of 2014-2017 CSRs 9
Graph 4.1.1: General government debt trends 18
Graph 4.1.2: Active government guarantees 19
Graph 4.1.3: Primary expenditure compared to peers in 2016 19
Graph 4.1.4: Expenditure by main functions in 2015 compared to peers 20
Graph 4.2.1: Debt composition of non-financial corporations 24
Graph 4.2.2: Contributions to change in total corporate debt-to-GDP ratio 24
Graph 4.2.3: Interest rates on bank loans to corporations 25
Graph 4.2.4: Composition of household lending 26
Graph 4.2.5: Contributions to change in total households debt-to-GDP ratio 26
Graph 4.2.6: Dwellings price developments 27
Graph 4.2.7: Evolution of NPLs and coverage ratio 29
Graph 4.2.8: NPL sales and other NPL flows 29
Graph 4.3.1: Activity, unemployment, long-term unemployment, youth unemployment, NEET and
employment rates 31
Graph 4.3.2: Employment rate by educational attainment 33
Graph 4.3.3: Employment change year-on-year 34
Graph 4.3.4: At-risk-of-poverty or social exclusion rate and two of its components (SMD, LWI) 35
Graph 4.3.5: Early childhood education and care 36
Graph 4.4.1: Exports of goods (volumes) in Croatia, EU15 and CEE10, index (2013=100) 39
Graph 4.4.2: Goods' export growth (values) between 2013 and 2016 by markets and product type 39
Graph 4.4.3: Global competitiveness index scores of Croatia and peers 40
Graph 4.4.4: Connectivity index in Croatia and peers 42
Graph 4.5.1: Cohesion Policy funding as an estimated share of public investment, 2015-2017 48
Graph 4.5.2: Healthcare expenditure 51
Graph 4.5.3: Staff in hospitals, 2015 52

LIST OF BOXES
Box 2.1: Tangible results delivered through EU support to structural change in in Croatia 12
Box 4.1.2: Efficiency of spending in Croatia 22
Box 4.2.3: Crisis and restructuring of Agrokor 30
Box 4.3.4: European Pillar of Social Rights in Croatia 32
Box 4.4.5: The role of Tourism in the Croatian economy 41
Box 4.4.6: Investment challenges and reforms in Croatia 46
Box 4.5.7: Policy Highlight: Developing a Comprehensive Curricular Reform 53

1
The favourable economic environment lends
itself to stepping up reform efforts and ensuring
sustainable and inclusive growth. Croatia's
potential growth remains insufficient to enable
faster convergence although projected to increase
somewhat over the medium term. As the working
age population continues shrinking and labour
utilisation remains chronically low, Croatia's
prospects of speeding up its economic growth will
increasingly depend on the capacity to implement
structural reforms. Raising potential growth
requires structural reforms that will allow for faster
productivity growth, higher participation in the
labour market, and a business environment that is
more attractive for investment (1).
As the economy enters its fourth year of
recovery, economic growth remains broad-
based and robust. Following a sizeable
acceleration in 2016, the real GDP growth rate in
2017 is projected to have remained at 3.2 %.
Household consumption continues to be the main
driver of growth, underpinned by resumed wage
growth, steadily increasing employment and high
consumer confidence. Investment is recovering,
albeit at a slower pace than anticipated. On the
external side, strong global demand and further
market share gains pushed exports up, but the
associated surge in imports of goods is projected to
have resulted in net exports slightly detracting
from growth in 2017.
The recovery is expected to continue in the next
two years, with somewhat lower growth rates.
Low potential output is preventing the economy
from reaching higher growth rates in the longer
run. Following several sharp declines in previous
years, unemployment is set to continue decreasing
at slower rates, on the back of an expected
slowdown in outbound migration. Private
consumption is expected to remain the driver of
(1) This report assesses Croatia’s economy in the light of the
European Commission’s Annual Growth Survey published
on 22 November 2017. In the survey, the Commission calls
on EU Member States to implement reforms to make the
European economy more productive, resilient and
inclusive. In so doing, Member States should focus their
efforts on the three elements of the virtuous triangle of
economic policy - boosting investment, pursuing structural
reforms and ensuring responsible fiscal policies. At the
same time, the Commission published the Alert
Mechanism Report (AMR) that initiated the seventh round
of the macroeconomic imbalance procedure. The AMR
found that Croatia warranted an in-depth review, which is
presented in this report
growth, as rising wages are projected to offset the
effects of the rebound in inflation on disposable
income. In 2018 and 2019, investment is expected
to intensify, as uncertainties surrounding the
restructuring of Agrokor unwind and the use of EU
funding improves. Exports are projected to
continue performing strongly, but imports are
expected to increasingly weigh on the contribution
of net exports to growth. With its steady
expansion, tourism creates opportunities for
employment and growth. However, challenges for
policy planning to anticipate and respond to the
growing and diversifying tourism demand lay
ahead if this sector is to become a key driver of
continued economic growth. In all, real GDP is
forecast to expand by 2.8 % in 2018 and a further
2.7 % in 2019.
Public and private debt ratios continue
decreasing, aided by the sustained economic
recovery and domestic currency appreciation.
With revenues boosted by the recovering economic
activity, and spending contained, the general
government is keeping a low deficit and the public
debt ratio on a steadily declining path. Debt levels
in the private sector are also falling, while credit
activity is slowly picking up. Corporate debt
remains only slightly above prudential levels, but
vulnerable to foreign currency shocks. Reflecting
declining private and public debt, and as the
current account remains in a comfortable surplus,
external debt is set to continue reducing.
Croatia has made limited progress in
addressing the 2017 country-specific
recommendations. Fiscal policy, supported by
favourable macroeconomic conditions, has ensured
a declining debt ratio, but structural measures have
not advanced. Legislation needed to reinforce the
fiscal framework has not been adopted, while the
previously legislated recurrent property tax has
been abandoned. Some steps are being taken to
rationalise the healthcare system, in particular for
hospitals. However, payment arrears in healthcare
continue to grow. Measures planned for the social
benefits system have been narrowed in scope,
while the package of pension system reforms has
been further postponed. Active labour market
policy measures for low-skilled and long-term
unemployed remain largely underutilised, while
the education reform is still pending, despite some
encouraging steps. Major public administration
reforms are largely at a standstill. Measures to
EXECUTIVE SUMMARY

Executive summary
2
improve the business environment have advanced
somewhat as regards relieving the administrative
burden and reducing parafiscal charges. Some
progress has been made in the sale of minority
shares in state-owned enterprises and activating
state property, while backlogs in the judicial
system have marginally reduced. Some measures
to address the high level of non-performing loans
were put in place. The Croatian Bank for
Reconstruction and Development has undergone
an Asset Quality Review, the results of which are
yet to be unveiled.
Regarding progress towards the national targets
under the Europe 2020 strategy, Croatia is on track
to reaching its targets, or has already done so, in
energy efficiency, greenhouse gas emissions,
renewables (except in transport), early school
leaving and poverty and social exclusion. The
target for tertiary education attainment by 2020
does not appear within reach, while the largest
distance to target remains in R&D investment.
Croatia faces challenges with regard to a
number of indicators of the Social Scoreboard
supporting the European Pillar of Social Rights.
These are related to equal opportunities, access to
the labour market and fair working conditions.
Economic growth has translated into reducing
unemployment, but the employment rate remains
comparatively very low. Croatia still faces a high
rate of young people not in employment, education
or training and low participation in active labour
market policy measures. Croatia has a high share
of people at-risk-of poverty or social exclusion.
The main findings of the in-depth review
contained in this report and the related policy
challenges are as follows:
In 2017, the general government debt ratio
is projected to have declined further on the
back of continued growth and fiscal
discipline. During the protracted crisis, the
general government debt more than doubled,
driven largely by deficits and reclassifications
of state-owned enterprises' debt. The decline in
the debt ratio from a high of almost 86 %
started in 2015 and picked up pace in 2016. It
is expected to have shrunk to around 80 % of
GDP in 2017 and continue declining in the
short term. The decrease has been driven by
economic growth but also expenditure restraint.
Nevertheless, public debt is still high in
comparison with both pre-crisis levels and peer
countries. Sustainability risks in the medium
term have declined but remain relatively high,
especially under some stress scenarios.
Furthermore, it is subject to foreign currency
risk, as the bulk of it is issued or denominated
in foreign currency. Positive developments are
the sustained reduction in the cost of debt
servicing, the lengthening of maturities
achieved in recent years as well as some
improvements in debt management.
Private sector debt reduction progressed,
while still heavily exposed to currency risk.
The decrease in private debt was driven by
intensified economic activity. Furthermore, the
continued appreciation of the national currency
against the euro reduced the value of
outstanding liabilities indexed to or
denominated in foreign currency – a positive
development that however highlights foreign
currency risk. The pace of corporate and
household debt reduction slowed down in
2017, following a pickup in net credit flows,
which is supporting investment. However, in
the corporate sector, debt is concentrated in a
few segments and remains high relative to the
sectors' financial assets, which may indicate
potential solvency risks.
Indirect credit risk weighs on the well-
capitalised and increasingly profitable
financial sector. Credit demand is recovering
thanks to better macroeconomic conditions and
lower interest rates. This, coupled with
continued improvement in the quality of banks'
assets and profitability, helped turn net credit
flows positive in 2017. The relatively fast
reduction of the non-performing loans ratio
seen in 2016 was halted in 2017, as the
underlying declining trend was partially offset
by a net inflow of non-performing loans related
to Agrokor's defaulted loans. Overall, indirect
credit risk remains a source of vulnerability for
the banking sector, in particular due to the
extensive exposure to foreign currency of its
corporate and household clients.
The labour market continued to improve,
but participation remains very low. In 2017,
the unemployment rate fell to 11.1 %.

Executive summary
3
Migration outflows and population ageing
contributed to the reduction of the working age
population, while activity and employment
rates for both men and women are very low,
partly due to care responsibilities and the
availability of multiple pathways to early exit
from the labour market. Despite an increase in
employment on permanent contracts in 2017,
the share of temporary contracts in total
employment remains sizable. Youth and long-
term unemployment are also on a downward
path, but remain high. The social dialogue
between the government and the social partners
is overall underdeveloped.
Competitiveness and investment are
hindered by a restrictive business
environment. The functioning of the product
and capital markets is constrained, inhibiting
the smooth allocation of resources to the most
productive companies and sectors. The
suboptimal performance of the research,
development and innovation system represents
an additional barrier to increasing the
competitiveness of Croatian businesses.
Liberalisation is progressing slowly as
numerous professions and major sectors remain
highly regulated. There remain a number of
distortions to competition in the legal
consultancy and tax advisory. Parafiscal
charges and the administrative burden continue
to constrain business creation and expansion.
The implementation of the anti-corruption
strategy suffers delays.
Other key structural issues analysed in this report,
– which point to particular challenges for Croatia’s
economy – are the following:
The fragmentation of the public
administration continues to weigh on
efficiency in the provision of public services.
Croatia’s marked territorial fragmentation and
complex relations across levels of government
are not conducive to the efficient utilisation of
resources and delivery of public services. Weak
administrative capacity hinders the
implementation of public policies and a more
effective use of European Structural Investment
Funds. The wage setting framework lacks
consistency across the public administration
and public services. While backlogs in courts
were reduced largely on the back of a reduced
inflow of new cases, measures to improve the
efficiency and quality of the justice system
remain on the agenda. Some progress has been
made in the disposal of minority ownership,
and the government's list of companies of
strategic and special interest has been further
reduced. A more determined progress on the
planned privatisation of state-owned
enterprises has yet to be seen.
Although falling, poverty and social
exclusion levels are still high. This is
particularly the case for the low skilled, the
elderly and the disabled. Territorial differences
are marked, with very high at-risk-of-poverty
rates in some counties. The uneven provision
of social services and a fragmented coverage of
the population by the social protection system
across the territory exacerbate existing
disparities in labour market outcomes. The
length of working lives is one of the shortest in
Europe, impacting negatively on the adequacy
of both current and future pensions and
creating high risks of poverty in old age.
Education and health outcomes point to
structural weaknesses. Education system
performance indicators have stagnated or
worsened in most relevant areas, highlighting
the need for reform. The recent measures to
implement the national strategy for education,
science and technology should, if maintained,
help address the quality and inclusiveness
challenges. Efforts to improve vocational
education and training and equip the workforce
with the skills needed in the labour market
remain insufficient. Participation in adult
education remains very low. Health outcomes
continue to improve, but remain below the EU
average. Some measures aimed at rationalising
the hospital system were initiated in 2017.
Hospitals, however, remain inadequately
financed and overburdened with arrears.

4
GDP growth
Croatia's economy continues on its path of
recovery from one of the longest and deepest
recessions in the EU. In the last three years, the
economic recovery has been robust and broad-
based, with economic growth on a more solid
ground than the credit-driven growth leading up to
the 2008 financial crisis. In 2017, domestic
demand, and especially private consumption,
remained the main engine of growth. Public
consumption also contributed to growth following
years of negative to neutral contribution. After a
long-awaited rebound in 2015, investment picked
up further in 2016, but showed signs of slowing
down in 2017, under the impact of lower public
sector investment and the operational and financial
restructuring of the distressed food-processing and
retail giant Agrokor (see Box 4.2.1). Exports
continued to perform strongly, with goods'
exporters gaining further market shares and
tourism adding on its record growth achieved the
year before. However, the strong internal demand
and the relatively high import content of tourism
boosted imports further, edging the overall
contribution of net exports to GDP growth to the
negative side (see Graph 1.1). Overall, in 2017 the
real GDP growth rate is projected to have matched
the rate of 3.2 % from the previous year.
Growth is expected to remain robust and real
GDP is projected to finally reach the pre-crisis
level in 2019. The economy continues to benefit
from favourable external conditions, most notably
from the positive trends in global trade and still
increasing demand for Croatian exports. As the
effects of the recent tax reform fade, private
consumption is expected to maintain the
momentum thanks to slow but steady employment
growth and the pick-up in wage growth. Higher
growth rates are projected for investment in 2018
and 2019, driven by the continued favourable
financing conditions and increased use of EU
funds. In all, the macroeconomic outlook is
favourable, but short-run risks remain on the
downside, as structural challenges keep weighing
on the long-run growth potential, and uncertainties
surrounding the outcome of Agrokor’s
restructuring linger. The Commission’s winter
2018 forecast sees real GDP growth slowing down
to 2.8 % in 2018 and 2.7 % in 2019.
Graph 1.1: Real GDP growth by demand component
Year-on-year contributions are obtained as the moving
average of four quarters GDP component compared to the
moving average of the respective components in the same
quarters of previous year.
Source: Eurostat.
External position
Despite the deteriorating trade balance, the
current account surplus increases. Declining net
exports combined with worsening terms of trade
are set to drive a decrease in the overall trade
balance of goods and services in 2017. However,
the current account balance is projected to have
increased to 3.1 % in 2017, in part thanks to the
temporary improvement in the primary income
balance owing to the profits in the largely
foreign-owned banking sector having fallen due to
Agrokor-related provisioning. The cyclically
adjusted current account surplus of 4.2 % in 2017
was considerably above level of -1.5 % of GDP
suggested by fundamentals (2). The surplus is
projected to remain at around 2 % during the
forecast period.
The continued current account surplus
translates into a further reduction of Croatia's
external liabilities. By September 2017, gross
external debt had fallen to just above 81 % of GDP
2017, and the NIIP had improved to -62 % of
GDP, more than 30 pps above its lowest level
(2) The current account 'norm' benchmark is derived from
reduced-form regressions capturing the main determinants
of the saving-investment balance, including fundamental
determinants (European Commission, 2017c).
-15
-10
-5
0
5
10
15
06Q
1
07Q
1
08Q
1
09Q
1
10Q
1
11Q
1
12Q
1
13Q
1
14Q
1
15Q
1
16Q
1
17Q
1
18Q
1
19Q
1
pps
Imports of goods and services Investment
Public consumption Private consumption
Exports of services Exports of goods
GDP
forecast
1. ECONOMIC SITUATION AND OUTLOOK

1. Economic situation and outlook
5
attained in the aftermath of the crisis (see
Graph 1.2). A continued kuna appreciation
contributed to the reduction of the external debt
ratio in 2017, but it also reminded of the extent of
Croatia's debt exposure to currency shocks. The
net external debt ratio is expected to continue
declining in line with the continued growth and
current account surpluses.
Graph 1.2: Current account composition, gross external
debt and net international investment position
Gross external debt is expressed in absolute terms.
Source: Eurostat, Croatian National Bank.
Inflation and interest rates
Wage pressures and higher energy prices set
the scene for a modest rebound in inflation.
Tightening labour market conditions and wage
increases in the public sector are projected to raise
the cost of labour in both 2017 and 2018. This,
coupled with rising energy prices, pushed inflation
up to 1.3 % in 2017, after more than three years of
negative or stagnant price dynamics. The headline
inflation rate is projected to keep increasing
slightly, with core inflation outpacing it and
picking up towards the end of 2019.
Continued abundant liquidity in the financial
system and the decreasing country risk
premium are contributing to a further decline
in interest rates. Interest rates on all new loans to
households and non-financial corporations are
decreasing, and most notably on loans for house
purchases indexed in euro. These favourable trends
in interest rates are expected to continue as the
perception of country risk improves thanks to a
solid economic outlook and improved public
finances. Notably, Croatia's risk premium has
reduced strongly, as reflected by the spread
between the yield on Croatia's sovereign debt and
the German bund dropping to just about 200 basis
points at the end of 2017 from 390 in mid-2016.
However, it remains higher than for most EU
countries.
Graph 1.3: Inflation and main components in Croatia and
the EU
Source: Eurostat.
Public finances
The general government deficit decreases
further as revenues surge and expenditures are
contained. The general government deficit
decreased sharply to 0.9 % of GDP in 2016, from
3.3 % the year before, leading Croatia out of the
excessive deficit procedure in 2017. Revenues
were boosted by the pick-up in economic activity,
especially household consumption, employment
and corporate profits. Primary expenditure growth
was contained well below nominal GDP growth,
while interest expenditure declined as debt was
reduced and refinanced at lower interest rates. In
spite of the negative budgetary impact of the recent
tax rate reductions in 2017, the headline deficit is
expected to have reduced further in 2017. Solid
growth rates and low deficits in the coming years
are set to keep the general government debt ratio
on a declining path. The ratio is expected to have
declined to below 80 % in 2017, and is set to fall
below 75 % by 2019.
-120
-100
-80
-60
-40
-20
0
-15
-10
-5
0
5
10
08Q
1
09Q
1
10Q
1
11Q
1
12Q
1
13Q
1
14Q
1
15Q
1
16Q
1
17Q
1
% of GDP% of GDP
Balance of primary and secondary incomes (other) (lhs)Net investment income (lhs)Balance of trade (goods and services) (lhs)Current account balance (lhs)NIIP (rhs)Gross external debt (rhs)
-2
0
2
4
6
8
10
Ja
n 0
8
Ja
n 0
9
Ja
n 1
0
Ja
n 1
1
Ja
n 1
2
Ja
n 1
3
Ja
n 1
4
Ja
n 1
5
Ja
n 1
6
Ja
n 1
7
pps
Other FoodEnergy HICP HRHICP EA One year interest rates

1. Economic situation and outlook
6
Private indebtedness
The reduction of private debt progressed
further, but bank lending to households and
corporates has resumed. By mid-2017,
consolidated corporate and household debt
decreased to roughly 67.8 % and 34.6 % of GDP,
respectively – some 15 and 7 pps below the peaks
registered in 2010. In 2017, the private debt ratio
continued to decrease, mainly on account of GDP
growth and, to a lesser extent, valuation effects, as
the kuna continued appreciating against the euro,
reducing the value of outstanding liabilities
indexed to or denominated in foreign currency. In
the corporate sector, debt reduction during 2016
was also driven by active deleveraging, with net
aggregate credit flows remaining mildly negative.
In 2017, however, loans to the non-bank private
sector (adjusted for sales and securitisation) from
domestic credit institutions increased by 3.4 %,
with a sharp increase in new loans contracted in
kuna with fixed rates, particularly in the household
sector. While debt levels are still high, the
decreasing debt servicing burden for both
households and corporates is expected to continue
supporting new credit. The private debt ratio is
therefore set to keep decreasing, but at a slower
pace than in recent years.
Labour market
The labour market continued to improve in
2017, but labour utilisation remains chronically
low. Despite moderate improvements in the
aftermath of the crisis, both the activity and the
employment rates, respectively at 71.7 % and
65.6 % in Q3 2017 (see Graph 4.3.1), were among
the lowest in the EU (average 78.2 % and 72.6 %
respectively). The decline in the labour force was
driven by negative migration flows and population
ageing. Also as a result of this decline, the
unemployment rate has been on a rapid declining
path and is projected to have dropped to around
11.1 % in 2017, from 17.6 % in early 2014. The
share of young people who are not in employment,
education or training has decreased, but remains
very high, as does the youth unemployment rate
and the rate of long-term unemployed. With
outbound migration pressures expected to ease and
stable employment growth, the unemployment rate
is projected to fall below 8 % in 2019. In 2017,
new hiring on permanent contracts increased, but
the share of temporary contracts in total
employment remains sizable.
Despite low labour utilisation, the tightening
labour market has resulted in renewed wage
growth. The nominal compensation per employee
has decreased every year since 2013, but it is
projected to have increased by 2.5 % in 2017.
Coupled with modest productivity growth, unit
labour cost is projected to have increased by just
over 1 % (see Graph 1.4). Wages are expected to
continue increasing, following upward pressures
from the legislated increases in the public sector,
as well as from workforce shortages in several key
sectors, such as tourism and construction.
Graph 1.4: Contributions to rate of change in yearly unit
labour costs
Forecast: European Commission's Autumn forecast data.
Source: Eurostat, European Commission.
Social developments
The share of people at risk of poverty and social
exclusion declined in 2016, but remains high.
Risks of poverty and social exclusion (AROPE)
are still high in Croatia, particularly for some
vulnerable groups such as the disabled and the
elderly (see Section 4.3). Croatia registers high
shares of population living in severe material
deprivation and in households with very low work
intensity, exceeding the EU average by 5.0 and 3.2
pps, respectively. The share of people at risk of
poverty (AROP) at 19.5 % is above the EU
average and exceeds most of the peer countries
(income data from 2015). Regional differences are
-8
-6
-4
-2
0
2
4
6
8
10
12
01 02 03 04 05 06 07 08 09 10 11 12 13 14 15 16 17 18 19
y-o-y %
Inflation (GDP deflator growth)
Real compensation per employee
Productivity contribution (negative sign)
Nominal unit labour cost
forecast

1. Economic situation and outlook
7
particularly marked, with the AROP rate
exceeding 40 % in some counties.
Inequality of income is close to the EU average,
but risks of poverty and social exclusion remain
particularly high among the low skilled. In
2016, the richest 20 % of Croatian households had
five times as much income as the poorest 20 %, a
ratio just below the EU average (2015 data). The
distribution of market income was slightly less
unequal than the EU average, while the impact of
social transfers on poverty reduction was below
EU average in 2016. The concentration of the risk
of poverty and social exclusion among the low
skilled, often living in rural areas, poses crucial
challenges and weighs on the capacity of the
country to reduce inequalities (see section 4.3.2).
Potential growth
Croatia is currently growing well above its
estimated potential. The negative output gap is
projected to have closed in 2017, and forecast to
turn positive in 2018. The solid pick-up in
investment is adding to potential growth, but the
utilisation of labour input and the contribution of
total factor productivity remain low, especially for
a catching-up economy. Negative migration flows
and population aging, in the context of one of the
lowest activity rates in the EU weigh on the size of
the working age population, with negative impact
on the long-term prospects for employment
growth. In the absence of policy measures capable
of boosting the participation rate, the shrinking
labour force is set to continue detracting from the
growth potential (see Graph 1.5).
Graph 1.5: Actual and potential output growth
Potential output: production function approach.
Source: European Commission, DG ECFIN.
-8
-6
-4
-2
0
2
4
6
02 03 04 05 06 07 08 09 10 11 12 13 14 15 16 17 18 19
pps
Total factor productivityContribution from capital deepeningContribution from labourPotential output growthActual growth
forecast

1. Economic situation and outlook
8
Table 1.1: Key economic and financial indicators - Croatia
(1) NIIP excluding direct investment and portfolio equity shares .
(2) Domestic banking groups and stand-alone banks, EU and non-EU foreign-controlled subsidiaries and EU and non-EU
foreign-controlled branches.
Source: Eurostat and ECB as of 30 Jan 2018, where available; European Commission for forecast figures (Winter forecast 2018
for real GDP and HICP, Autumn forecast 2017 otherwise)
2004-07 2008-12 2013-14 2015 2016 2017 2018 2019
Real GDP (y-o-y) 4,5 -1,9 -0,4 2,3 3,2 3,2 2,8 2,7
Potential growth (y-o-y) 3,0 -0,1 -0,2 0,5 1,2 1,1 1,4 1,9
Private consumption (y-o-y) 4,4 -2,1 -1,7 1,1 3,5 . . .
Public consumption (y-o-y) 4,5 -0,1 0,7 -0,9 1,9 . . .
Gross fixed capital formation (y-o-y) 6,6 -5,7 -0,7 3,8 5,3 . . .
Exports of goods and services (y-o-y) 4,9 -1,3 4,6 9,4 5,6 . . .
Imports of goods and services (y-o-y) 6,2 -4,3 3,1 9,2 6,2 . . .
Contribution to GDP growth:
Domestic demand (y-o-y) 5,1 -2,6 -1,0 1,2 3,4 . . .
Inventories (y-o-y) 0,3 -0,7 0,0 0,8 -0,2 . . .
Net exports (y-o-y) -0,9 1,3 0,6 0,3 -0,1 . . .
Contribution to potential GDP growth:
Total Labour (hours) (y-o-y) 0,7 -0,3 -0,5 -0,8 -0,3 -0,6 -0,4 0,0
Capital accumulation (y-o-y) 2,0 1,2 0,7 0,6 0,7 0,7 0,8 0,9
Total factor productivity (y-o-y) 0,4 -1,0 -0,4 0,8 0,9 0,9 0,9 0,9
Output gap 3,3 -0,4 -4,5 -3,2 -1,5 0,6 2,0 2,8
Unemployment rate 12,1 11,8 17,3 16,1 13,4 11,1 9,2 7,5
GDP deflator (y-o-y) 3,8 2,5 0,4 0,0 -0,1 1,2 2,1 2,1
Harmonised index of consumer prices (HICP, y-o-y) 2,8 2,9 1,3 -0,3 -0,6 1,3 1,6 1,7
Nominal compensation per employee (y-o-y) 4,8 2,1 -3,1 0,4 -0,2 2,5 2,5 2,5
Labour productivity (real, person employed, y-o-y) 2,4 0,1 -0,4 1,1 2,9 . . .
Unit labour costs (ULC, whole economy, y-o-y) 2,3 2,0 -2,8 -0,7 -3,0 1,1 1,3 1,3
Real unit labour costs (y-o-y) -1,5 -0,4 -3,2 -0,7 -2,9 0,0 -0,7 -0,8
Real effective exchange rate (ULC, y-o-y) 1,9 -1,0 -3,3 -3,2 -3,1 1,8 1,4 -0,5
Real effective exchange rate (HICP, y-o-y) 0,8 -0,7 0,8 -1,5 1,2 -0,1 1,9 .
Savings rate of households (net saving as percentage of net
disposable income) 2,2 6,0 . . . . . .
Private credit flow, consolidated (% of GDP) 14,8 3,6 -0,3 -1,4 -0,1 . . .
Private sector debt, consolidated (% of GDP) 86,5 119,6 118,0 113,2 105,9 . . .
of which household debt, consolidated (% of GDP) 32,5 40,7 40,2 38,5 35,3 . . .
of which non-financial corporate debt, consolidated (% of GDP) 53,9 78,9 77,8 74,7 70,6 . . .
Gross non-performing debt (% of total debt instruments and total
loans and advances) (2) . . 12,3 12,5 10,1 . . .
Corporations, net lending (+) or net borrowing (-) (% of GDP) -3,1 -1,0 . . . . . .
Corporations, gross operating surplus (% of GDP) 20,4 19,3 . . . . . .
Households, net lending (+) or net borrowing (-) (% of GDP) 0,9 3,5 . . . . . .
Deflated house price index (y-o-y) 9,8 -5,1 -3,4 -2,4 2,1 . . .
Residential investment (% of GDP) . . . . . . . .
Current account balance (% of GDP), balance of payments -5,9 -3,3 1,5 4,4 2,4 3,1 1,9 1,9
Trade balance (% of GDP), balance of payments -6,6 -2,4 1,1 2,2 2,8 . . .
Terms of trade of goods and services (y-o-y) 1,3 0,5 0,2 0,5 1,4 -0,7 0,6 0,6
Capital account balance (% of GDP) 0,0 0,1 0,1 0,7 1,1 . . .
Net international investment position (% of GDP) -66,5 -87,4 -86,9 -76,5 -70,0 . . .
Net marketable external debt (% of GDP) (1) -29,3 -47,6 -46,2 -36,2 -25,3 . . .
Gross marketable external debt (% of GDP) (1) 68,6 88,9 93,7 90,5 78,3 . . .
Export performance vs. advanced countries (% change over 5 years) 37,3 -4,3 -16,0 -4,4 5,1 . . .
Export market share, goods and services (y-o-y) -1,8 -5,3 2,8 2,7 7,8 . . .
Net FDI flows (% of GDP) -4,7 -3,1 -1,7 -0,6 -4,2 . . .
General government balance (% of GDP) -3,7 -5,6 -5,2 -3,3 -0,9 -0,9 -0,9 -0,7
Structural budget balance (% of GDP) . -5,4 -3,1 -1,8 -0,3 -0,9 -1,9 -2,0
General government gross debt (% of GDP) 39,6 56,5 83,8 85,4 82,7 80,1 77,3 74,4
Tax-to-GDP ratio (%) 36,6 36,0 36,4 37,0 37,7 37,6 37,2 37,0
Tax rate for a single person earning the average wage (%) . . 30,3 29,1 . . . .
Tax rate for a single person earning 50% of the average wage (%) . . 23,1 21,9 . . . .
forecast

9
Progress with the implementation of the
recommendations addressed to Croatia in
2017 (3) has to be seen in a longer term
perspective since the introduction of the
European Semester in 2014. Looking at the
multi-annual assessment of the implementation of
the CSRs since these were first adopted, almost
half of all the CSRs addressed to Croatia have
recorded at least 'some progress'. The rest recorded
'limited' or 'no progress' (see Graph 2.1). Most
progress has been seen in the areas of labour
market reform and fiscal policy.
Graph 2.1: Level of implementation of 2014-2017 CSRs
(1) The overall assessment of the country-specific
recommendations related to fiscal policy excludes
compliance with the Stability and Growth Pact.
(2) The multiannual CSR assessment looks at the
implementation until 2018 Country Report since the CSRs
were first adopted.
Source: European Commission.
Croatia has secured a timely and durable
correction of its excessive general government
deficit. In 2016, the general government headline
deficit decreased markedly to 0.9% of GDP from
3.3% in 2015. This sharp reduction was driven by
the economic recovery, but also by expenditure
containment. The decrease in the headline deficit
combined with GDP growth has resulted in a
decrease in the debt ratio, which is expected to
continue. Croatia exited the Excessive Deficit
Procedure in June 2017.
Over the past years, Croatia has taken
measures to reform the labour market, but the
(3) For the assessment of other reforms implemented in the
past, see in particular Section 4.
challenge of low labour participation has not
been addressed. Two successive reforms,
implemented in 2013 and 2014, enhanced the
flexibility of the labour market. In particular, they
facilitated the use of fixed-term contracts and
flexible types of work (distance work, part-time
work, seasonal work and agency work), and
simplified in various ways the procedures for
terminating employment contracts. The challenge
of low labour utilisation however has still not
received an adequate response, as measures
encouraging longer working lives and a
streamlining of pension provisions have not yet
been carried out. In 2015, the assessment of
disability claims was harmonised and moved to a
new Single Expert Evaluation Body.
Steps have been taken to improve the judiciary
system, the business environment, and the
resilience of the financial sector. Insolvency
procedures have been thoroughly revised, and the
reformed judicial map has improved the efficiency
of the system. There has been a reduction of
backlogs in the judiciary, however challenges
remain. Some parafiscal charges and the
administrative burden for businesses have been
reduced. In 2014, the comprehensive portfolio
screening of the banking sector confirmed its
robustness, and some identified weaknesses have
been addressed. The share of non-performing loans
remains relatively high, but they are well
provisioned, and their sale has accelerated lately.
The Croatian Bank for Reconstruction and
Development (HBOR) has undergone an asset
quality review.
Reforms of healthcare, state-owned enterprises
and EU funds implementation have progressed
slowly. The healthcare system continues to
generate payment arrears. However, the authorities
have taken initial steps towards the long-planned
functional integration of hospitals. The
management of state assets was transferred to a
newly established ministry and their sale has
advanced, but the announced improvement of
corporate governance in state-owned enterprises
has encountered delays. The implementation of
projects co-funded from EU funds has improved
over the past years, but remains hindered by
limited administrative capacity and strategic
planning.
No Progress
19%
Limited Progress
33%
Some Progress
31%
Substantial Progress
12%
Full Implemen-
tation 5%
2. PROGRESS WITH COUNTRY-SPECIFIC RECOMMENDATIONS

2. Progress with country-specific recommendations
10
Croatia has made limited (4) progress in
addressing the 2017 country-specific
recommendations (see Table 2.1). The unfolding
of the Agrokor crisis in 2017 protracted a period of
reform standstill during which Croatia undertook
limited policy action. The introduction of the
recurrent property tax, due in January 2018, has
been postponed indefinitely. The reform agenda in
the area of social protection has been narrowed in
scope. The planned reforms in areas such as fiscal
framework, pension system, public administration
and public sector wages have been largely delayed.
European Structural and Investment Funds
(ESI Funds) are pivotal in addressing key
challenges to inclusive growth and convergence
in Croatia. This is achieved by supporting the
reduction of administrative procedures for
businesses, reinforcing capacities in the research
and business sectors and improving cooperation
between enterprises and public research institution.
ESI Funds are also instrumental in addressing
challenges related to employment and social
policies and via investments in infrastructure
which help increase productivity and improve the
access to healthcare for vulnerable groups and
people living in deprived areas.
Member States can request from the
Commission technical support to prepare,
design, and implement growth-enhancing
structural reforms. The Structural Reform
Support Service (SRSS) provides, in cooperation
with the relevant Commission services, tailor-
made technical support, which does not require co-
financing and is provided at a Member State's
request. The support addresses priorities identified
in the context of the EU economic governance
process (i.e., implementation of country-specific
recommendations), but the scope of the SRSS
support is wider as it can also cover reforms linked
to other Commission priorities, or reforms
undertaken at the initiative of Member States.
Croatia has requested technical support from
the SRSS to help implement reforms in various
areas, such as: public administration and justice,
growth and the business environment, healthcare,
(4) Information on the level of progress and actions taken to
address the policy advice in each respective subpart of a
CSR is presented in the Overview Table in the Annex. This
overall assessment does not include an assessment of
compliance with the Stability and Growth Pact.
education, and the financial sector. In particular,
the SRSS provides support for the implementation
of curriculum reform; for measures aimed at
improving adult education; for measures
strengthening the governance of state-owned
enterprises and monitoring of their restructuring
plans; and for streamlined and increased
transparency of social policies.

2. Progress with country-specific recommendations
11
Table 2.1: CSR progress
(*) This does not include an assessment of compliance with the Stability and Growth Pact
Source: European Commission.
Croatia Overall assessment of progress with
2017 CSRs: limited progress
CSR 1: Pursue its fiscal policy in line with the
requirements of the preventive arm of the Stability
and Growth Pact, which entails remaining at its
medium-term budgetary objective in 2018. By
September 2017, reinforce budgetary planning and
the multiannual budgetary framework, including by
strengthening the independence and mandate of the
Fiscal Policy Commission. Take the necessary steps
for the introduction of the value-based property tax.
Reinforce the framework for public debt
management, including by ensuring annual updates
of the debt management strategy.
Croatia has made limited progress (*) in
addressing CSR 1:
No progress in reinforcing the fiscal
frameworks
No progress in introducing a value-
based property tax
Some progress in reinforcing public
debt management
CSR 2: Discourage early retirement, accelerate the
transition to the higher statutory retirement age and
align pension provisions for specific categories
with the rules of the general scheme. Improve
coordination and transparency of social benefits.
Croatia has made limited progress in
addressing CSR 2:
No progress in reforming the pension
system
Limited progress in improving the
social benefits system
CSR 3: Improve adult education, in particular for
older workers, the low-skilled and the long-term
unemployed. Accelerate the reform of the education
system.
Croatia has made limited progress in
addressing CSR 3:
Limited progress in improving adult
education
Limited progress in reforming the
education system
CSR4: Reduce the fragmentation and improve the
functional distribution of competencies in public
administration, while enhancing the efficiency and
reducing territorial disparities in the delivery of
public services. In consultation with social
partners, harmonise the wage-setting frameworks
across the public administration and public
services.
Croatia has made no progress in
addressing CSR 4:
No progress in the public
administration reform
No progress in harmonising the wage-
setting frameworks in the public
sector
CSR 5: Speed up the divestment of state-owned
enterprises and other state assets, and improve
corporate governance in the state-owned enterprise
sector. Significantly reduce the burden on
businesses stemming from costs of regulation and
from administrative burdens. Remove regulatory
restrictions hampering access to and the practice of
regulated professions and professional and
business services. Improve the quality and
efficiency of the justice system, in particular by
reducing the length of civil and commercial cases.
Croatia has made limited progress in
addressing CSR 5:
Limited progress in SOEs divestment
and improving corporate governance
Limited progress in reducing
administrative and regulatory burdens
Limited progress in removing
restrictions to regulated professions
and services
Limited progress in improving
quality and efficiency of justice

2. Progress with country-specific recommendations
12
Box 2.1: Tangible results delivered through EU support to structural change in Croatia
Croatia is a beneficiary of significant European Structural and Investment Funds (ESI Funds) and
can receive up to EUR 10.73 billion until 2020. This represents around 3 % of GDP annually over the
period 2014-2018 and 80 % of public investment (1). By end-2017, an estimated EUR 4.2 billion (39 % of
the total) was allocated to projects on the ground. This has paved the way for 734 new full-time equivalent
employments having been created in the supported enterprises; supporting sustainable tourism and adding
more than 314 000 visits per year of the cultural and natural heritage and attractions; increasing capacity of
childcare and education for an additional 6 000 persons in the future. Out of the ERDF financing,
approximately EUR 330 million will be delivered via financial instruments, which is a novelty compared to
the 2007-2013 period, where financial instruments were not used.
ESI Funds help address structural policy challenges and implement country-specific
recommendations. Actions cover, among others, a shift to a digital economy and e-systems, aimed at
reducing the burden on businesses by making administrative procedures more efficient and effective.
Support is provided to improve the effectiveness of the justice system. Investments in infrastructure (namely
rail, road, broadband, energy and environment) are aimed at reducing regional disparities, promoting growth
and increasing productivity. ESI Funds address challenges related to employment and social policies. The
Action Plan for the Implementation of the Public Administration Development Strategy 2017-2020 defines
actions on the strategic, legal, organisational and procedural level to develop quality management systems,
rationalise administrative procedures, and implement human resources policies that foster skill development
at all levels of public administration.
Various steps have been undertaken already as a precondition for ESI Funds support. A Smart
Specialisation Strategy for research and innovation was developed with a view of building R&I capacities in
research and business sectors and improving cooperation between enterprises and public research
institutions. The comprehensive Transport Strategy adopted in August 2017 enables streamlining of projects
in all modes of transport by defining the measures and setting the priorities on supranational and national
level. The Sustainable Urban Mobility Plans at the level of functional regions focus on public transport,
low/zero emission modes and will be accompanied by complementary mobility management policies. To
ensure a more sustainable use of water resources, the River Basin Management Plan for Croatia has been
adopted. In the health sector, specific actions are directed towards improving the access to healthcare in
deprived areas and for vulnerable groups; supporting education of medical personnel in primary healthcare;
and promoting specialisation programmes and the development of analytical tools in health management.
Croatia is advancing in the take up of the European Fund for Strategic Investments (EFSI). As of
December 2017, the overall financing volume of operations approved under the EFSI amounted to
EUR 187 million, which is expected to trigger total private and public investments of EUR 745 million.
More specifically, 5 projects have been approved so far under the Infrastructure and Innovation Window
(including 2 multi-country projects), amounting to EUR 120 million in EIB financing under the EFSI. This
is expected to trigger nearly EUR 494 million in investments. Under the SME Window, 5 agreements with
financial intermediaries have been approved so far. The European Investment Fund financing enabled by the
EFSI amounts to EUR 67 million, which is expected to mobilise more than EUR 251 million in total
investment. Close to 800 smaller companies or start-ups will benefit from this support. The energy sector
ranks first in terms of operations and volume approved, closely followed by SMEs.
Funding under Horizon 2020, the Connecting Europe Facility and other directly managed EU funds is
additional to the ESI Funds. By end-2017, Croatia has signed agreements for EUR 424 million for projects
under the Connecting Europe Facility.
https://cohesiondata.ec.europa.eu/countries/HR
(1) Public investment is defined as the sum of gross fixed capital formation, investment grants, and national expenditure
on agriculture and fisheries.
13
The in-depth review for the Croatian economy
is presented in this report. In spring 2017,
Croatia was identified as having excessive
macroeconomic imbalances, in particular relating
to the high levels of external and domestic debt,
both largely denominated in foreign currency, in a
context of low potential output growth. The 2018
Alert Mechanism Report (European Commission,
2017b) concluded that a new in-depth review
should be undertaken for Croatia to assess
developments relating to identified imbalances.
Analyses relevant for the in-depth review can be
found in section 4.1 for government debt, section
4.2 for private sector debt and the financial sector,
section 4.3 for the labour market, section 4.4 for
business environment and investment, and section
4.5 for public sector governance (5).
Imbalances and their gravity
Government debt remains high. The debt ratio
peaked at 85.8 % in 2014, driven by large
government deficits and the materialisation of
contingent liabilities in SOEs. It is expected to
have declined to below 80 % of GDP in 2017,
thanks to robust nominal growth and a declining
general government deficit. Furthermore, the kuna
appreciation decreased the value of the large
portion of debt denominated in foreign currency.
Sustainability risks for Croatia's public finances
remain high in the medium term largely on account
of the still high stock of debt. The fact that a large
portion of the debt is denominated in foreign
currency is also a source of risk.
The private debt-to-GDP ratio keeps reducing,
but exposure to foreign currency and over-
leverage of corporations are sources of risk. In
the second quarter of 2017, consolidated corporate
and household debt had decreased to 67.8 % and
34.6 % of GDP, respectively – some 15 and 7 pps
below the peak registered in 2010. By mid-2017,
private sector debt was close to or below the
prudential country-specific threshold and only
slightly above the level suggested by
fundamentals, indicating that Croatia still faces
(5) An asterisk indicates that the analysis in the section
contributes to the in-depth review under the MIP.
limited deleveraging needs (see Section 4.2).
Although their level of debt no longer appears
exceedingly high, households and non-financial
corporations are still exposed to foreign currency
risk. Furthermore, in non-financial corporations,
debt is high relative to gross financial assets or
equity, signalling potential solvency risks for the
corporate sector. Finally, a high stock of non-
performing loans weighs on the private sector,
with a particularly high share of such loans in
construction and real-estate activities, but also in
wholesale and retail trade and manufacturing.
Continued current account surpluses are
translating into a fast reduction of Croatia's net
external liabilities. Thanks to a continued strong
performance of exports, the current account stood
at 2.5% of GDP in 2016. It increased further to
3.8 % of GDP in the third quarter of 2017, mainly
due to the improvement in the income balance.
The NIIP improved to -70 % of GDP in 2016 and
declined further to -62.1 % by the third quarter of
2017, 36.5 pps above its record low from third
quarter of 2011. In the third quarter of 2017, it
declined further to 61.8% of GDP. Despite these
notable improvements, the NIIP remains very
negative. In particular, in 2016, the NIIP was still
below its fundamental level and prudential
threshold (6). However, the composition of
Croatia's external liabilities in terms of asset type –
in particular, the high share of FDI and portfolio
investment in equity – mitigates the vulnerability
risks associated to the high level of the NIIP.
Low labour utilisation and slow productivity
growth weigh on Croatia's potential output and
adjustment capacity. Despite moderate
improvements, in Q3 2017 both the activity rate
(71.7 %) and the employment rate (65.6 %) were
(6) The European Commission has developed new country-
specific NIIP benchmarks to better assess the need of
additional adjustment in the NIIPs of EU countries. From a
prudential point of view, NIIP thresholds are determined as
the predictors of the likelihood of a balance of payment
crisis (see QREA "Assessing prudent NIIP and current
account positions", forthcoming). In the fundamentals-
based approach, NIIP benchmarks are derived from the
accumulation of current account norms since the mid-
1990s. For Croatia, the prudential and fundamental-based
benchmarks are estimated to be around -37 % and -38 % of
GDP in 2016, respectively.
3. SUMMARY OF THE MAIN FINDINGS FROM THE
MACROECONOMIC IMBALANCE PROCEDURE INDEPTH
REVIEW
3. Summary of the main findings from the MIP indepth review
14
among the lowest in the EU, pointing to
chronically low labour utilisation. Productivity
growth remains low compared to the EU
economies of Central and Eastern Europe. Total
factor productivity (TFP) contributed negatively to
potential growth in the crisis period, and continues
to be relatively low. A strong presence of state-
owned enterprises hinders a more efficient
allocation of resources throughout the economy
(see Section 4.5). Weak administrative capacity in
the public sector as well as a burdensome business
environment (see Section 4.4) weighs on
productivity developments and on the economy's
overall adjustment capacity.
Evolution, prospects, and policy responses
The debt ratio is expected to continue
decreasing. The primary balance is expected to
remain in surplus as the nominal GDP growth-
interest rate differential, having turned positive,
increases further, also owing to the refinancing of
maturing debt at lower interest rates. Recent
improvements to debt management could be
conducive to an improved fiscal risk management.
In addition, a significant portion of the debt
previously financed through bank loans was
refinanced by a bond, reducing and fixing the
interest rate, extending the maturity and enabling
better management.
The private debt ratio is set to keep decreasing,
though at a slower pace than in recent years as
new credit started to grow. During 2016, private
debt reduction was mainly driven by real GDP
growth and valuation effects, since the
appreciation of the kuna against the euro reduced
the value of outstanding liabilities indexed to or
denominated in foreign currency. In the household
sector, debt decreased notably due to a large
number of write-offs following the statutory
conversion of CHF-denominated loans into EUR-
denominated loans at the end of 2015. In 2017, the
slight rebound in inflation also supported debt
reduction, whereas credit flows turning slightly
positive worked in the opposite direction, slowing
down the debt reduction pace. In 2017, the growth
rate of loans to the non-bank private sector
(adjusted for sales and securitisation) from
domestic credit institutions increased to 3.4 %. The
strongest impetus to credit growth in the non-
financial corporate sector came from the increase
in investment loans and working capital loans,
while in the households sector it came from non-
housing loans.
The banking sector remains well capitalised
overall and banks' profitability has been
increasing since 2016. Vulnerabilities are linked
to the high exposure of corporations and
households to foreign currency risk and, to some
extent, interest rate risk. Maturity mismatches
between assets and liabilities in the banking sector
are also emerging, particularly in the increasing
segment of kuna-denominated credit. Risks related
to this mismatch are limited by the fact that, in the
current low-interest rate environment, transaction
deposits are increasingly fed with long-run
savings. Bank asset quality has continued to
improve, but the NPL ratio remains high,
especially in the construction and real estate
segment. By June 2017, the total stock of NPLs
declined to 11.7 % (from a record high of 14.2 %
in 2014) despite the inflow of loans classified as
non-performing in the aftermath of the Agrokor
crisis earlier in the year.
The impact of the Agrokor crisis on the
Croatian economy has been limited so far, but
related risks remain. Despite the fact that most of
the Agrokor Group impairments have already been
incurred in the first half of 2017, risks remain as
the restructuring of Agrokor's may affect
profitability during the rest of 2017 through greater
provisioning in 2017 and possibly 2018. While the
activation of measures on extraordinary
administration in systematically important
companies (7) contained the risk of a disorderly
restructuring, the outcome of Agrokor's
restructuring, in particular if the settlement is not
reached, poses a significant downside risk to
economic activity and the banking sector, in
particular as financial losses and possible
operational disruptions in the group and its supply
chain may still materialize.
Croatia's current account surplus is above the
norm suggested by the country's fundamentals
(7) In April 2017, following the unveiling of financial distress
in Agrokor, the Croatian parliament adopted a law on
extraordinary administration in "systemically important
companies" aimed at maintaining business operations and
reducing the risk of a chaotic restructuring. The law
authorises the court appointed extraordinary administrator
supervised by the creditor's council to administer the
processes of operational restructuring and negotiation of a
settlement with the company's creditors and suppliers.

3. Summary of the main findings from the MIP indepth review
15
and the NIIP-reducing benchmark. Continued
current account surpluses are underpinned by the
strong performance in exports, with exporters
gaining further market shares and tourism
expanding. In 2016, the current account balance
exceeded the level suggested by fundamentals –
that is, the current account norm, estimated at a
deficit of around 1.5% of GDP. According to the
Commission 2017 autumn forecast, the current
account surplus is projected to remain at around
2 % over the forecast horizon. This is above the
level needed over the medium term to bring the
NIIP up to more sustainable levels – e.g. the levels
suggested by the prudential and fundamentals-
based benchmarks, even under pessimistic
scenarios for nominal GDP growth. The country's
net international investment position is set to
further improve.
Croatia's economy is still growing well above its
estimated potential growth rate. The output gap
is projected to have closed in 2017 and turn
positive in 2018. A strong pick-up in investment,
somewhat delayed by the temporary decline in
public sector investments and by the Agrokor
crisis during 2017, is expected to support the
growth potential. However, negative migration
flows and population ageing restrain growth of the
labour force (see section 4.3). After having
attained a record high of 17.6 % in mid-2013, the
unemployment rate is estimated to have contracted
to around 11 % in 2017. It is expected to fall to
pre-crisis levels by the end of 2019, aided by
modest employment creation and labour force
shrinking. Croatia continues to score poorly on
several measures of goods and service market
efficiency, and total factor productivity growth
remains subdued (see Sections 4.4 and 4.5).
Overall assessment
The unwinding of debt-related imbalances is
supported by a solid recovery, however
vulnerabilities remain. Both public and private
debt ratios to GDP keep reducing, but still
represent sources of vulnerability for the economy.
Despite significant improvements, public debt
weighs on the country's credit rating and risk
premium, and the related debt servicing costs
weigh on the budget. Despite significant decreases,
the remaining private deleveraging needs hinder
the recovery of credit flows and a more substantial
pick-up in investment. A large share of both public
and private debt remains denominated in foreign
currency, which implies exchange rate risks. The
unemployment rate has reduced sharply, but
remains high, while labour market participation
lags significantly behind the EU average.
In the long run, low potential growth hinders
the resolution of stock-related imbalances.
Economic growth is projected to be robust over the
forecast horizon. However, for a lasting
adjustment, economic growth will need to remain
sustained for a long period. This underlines the
challenges that the persistently low labour
utilisation and subdued productivity growth
represent for the economy's potential growth.
Policy action has not yet contributed to boost
the long-run growth potential and the
economy's overall adjustment capacity. In the
absence of effective policy measures to boost the
participation rate, low labour utilisation is set to
keep weighing on potential growth in the long run.
Policy action to improve the business environment
and modernise public sector governance, in
support of TFP growth, have been largely delayed.
Structural reforms are crucial to ensuring that
Croatia can fully grasp the benefit of greater
monetary and financial stability, while furthering
the process of real economic convergence.

3. Summary of the main findings from the MIP indepth review
16
Table 3.1: MIP Matrix
(Continued on the next page)
Gravity of the challenge Evolution and prospects Policy response
Imbalances (unsustainable trends, vulnerabilities and associated risks)
Public debt In 2016 the debt ratio decreased
to 82.9 % of GDP, still
significantly above the Treaty
reference value of 60 %.
A large portion of the debt is
indexed to or denominated in
foreign currency.
The debt sustainability analysis indicates high risks in the
medium term, in particular under
some stress scenario.
Between 2008 and 2014, public debt rose from
39.6 to 85.8 % of GDP on account of large
government deficits and the materialisation of
contingent risks related to state-owned
enterprises. The debt ratio started declining in
2015, thanks to a declining deficit and
recovering GDP growth.
The general government deficit surprised in 2016, shrinking from 3.3 % to 0.9 % of GDP.
The deficit is expected to decrease further,
allowing the debt ratio to continue decreasing.
The Commission 2017 autumn forecast
expects the debt-to-GDP ratio to have declined
to 80.3 % of GDP in 2017, and recent data
point to an even lower figure. It is set to decline further over the forecast horizon, as
the deficit shrinks and nominal growth
continues.
In 2017 debt continued to be
refinanced at considerably cheaper
rates, extending maturities and
lowering debt servicing costs. Part of
the central government debt related
to loans of SOEs was transferred to
the Treasury as the government
refinanced it by issuing bonds. This has de facto broadened the scope of
central debt management.
The Office for public debt
management within the Ministry of
Finance was upgraded to a
Directorate and staffing has been
improved.
Household and
corporate debt
and the
financial sector
In the second quarter of 2017,
consolidated corporate and
household debt stood at 67.8 %
and 34.6 % of GDP,
respectively.
In mid-2017, the NPL rate declined to 11.7 %. However, the
rate is still relatively high in both
the corporate and household
sector – 26.3 % and 8.8 %
respectively.
Around 52 % of household debt
and approximately 75 % of
(domestic and external) corporate debt was denominated
in foreign currency
(predominantly EUR) in
mid-2017.
Household and corporate debt increased
rapidly in the previous decade reaching their
respective peaks of 41.9 % and 83.4 % of
GDP in 2010.
Following the steady reduction of their debt,
both sectors faced limited deleveraging needs in 2016, based on the prudential and
fundamental-based benchmarks calculated by
the European Commission. As debt reduction
progressed in the first half of 2017, the
deleveraging needs declined further.
The pace of deleveraging in both the
household and corporate sector is set to abate,
as credit flows turn positive, in the context of low interest rates and accelerated economic
activity.
Despite improvements on both dimensions, the
still high exposure to currency risks and
interest rate hikes may put at risk the
repayment capacity of households and non-
financial corporations and therefore translate
into credit risk for the banking sector.
Non-performing loans in the corporate sector
decreased markedly in 2017, thanks to their
sales and improving economic conditions. The
pace of the NPL rate reduction slowed down
somewhat on account of increased
provisioning for Agrokor-related losses. The
banking sector could be indirectly affected due its exposure to Agrokor’s suppliers, and by the
potential wider impact on the Croatian
economy of the Agrokor crisis.
The authorities facilitated the write
off of non-performing loans through
a one-off tax-treatment in 2016, but
the impact of the measure has yet to
be fully assessed.
The revised corporate insolvency legislation led to the closure of
thousands of illiquid companies
without assets in its first few waves.
The authorities also plan to enhance
the monitoring of the reformed
corporate and personal insolvency
framework.
In April 2017, the Croatian parliament adopted a law on
extraordinary administration in
systemically important companies,
which allowed for Agrokor's
operations to resume, thus reducing
the risk of bankruptcy or a chaotic
restructuring. The outcome of the
restructuring is still uncertain, but the company's creditors, including a
number of domestic banks, are
expected to suffer considerable
losses.

3. Summary of the main findings from the MIP indepth review
17
Table (continued)
Source: European Commission.
External
liabilities and
trade
performance
The NIIP improved to -70 % of
GDP in 2016, but remained well
below its fundamental level and
prudential threshold.
Gross external debt declined to
81.7 % of GDP in September
2017.
The current account balance
stood at 2.5 % of GDP in 2016.
It increased to 3.8 % of GDP in
the third quarter of 2017.
The NIIP continued to improve in 2017,
declining to -61.8 % of GDP at the end of the
third quarter, which is more than 30 pps above
its record low in 2010. The NIIP is projected
to keep improving on account of continued
current account surpluses and GDP growth.
The current account has moved from a record deficit of 9 % of GDP in 2008 to a surplus in
2013. It is forecast to have reached 3.1 % of
GDP in 2017 as a whole, and remain in a
comfortable surplus at around 2 % throughout
the forecast horizon, also thanks to continued
strong performance of exports.
The economy has more than recovered the
previously lost market shares, while tourism boasts record physical indicators year after
year.
Croatian firms are still burdened by
costly administrative procedures.
Persisting weaknesses in the business
environment result in limited
attractiveness of Croatia for FDIs and
higher costs of doing business for
Croatian enterprises.
Most reform initiatives aimed at
improving the business environment
have been delayed.
Potential output The unemployment rate is
estimated to have contracted to
around 11 % in 2017. However,
at 71.7 % and 65.6 % in Q3,
activity and employment rates
are among the lowest in the EU.
The contribution of total factor
productivity remains low for a catching-up economy.
Low labour utilisation and
sluggish productivity dynamics
weigh on potential growth,
undermining the durability of the
adjustment process.
After having attained a record high of 17.6 %
in early 2014, unemployment continues to
reduce rapidly, while employment increases at
a moderate pace. A large share of the
unemployment reduction was driven by the
shrinking population of working age, due to
negative migration flows and population
aging. In 2017, permanent contracts outnumbered the temporary ones in new
employment, but the share of temporary
contracts in total employment remains very
high.
Following the rapid growth rates in pre-crisis
years, wages stagnated or decreased in the
post-crisis period. They have started growing again in 2017, but so far not outpacing
productivity growth in real terms.
The government had undertaken a
review of wage setting in the broader
public sector (including state-owned
enterprises), but has so far failed to
propose reform measures. The
adoption of the new Act on Public
Sector Wages has been postponed by
more than two years. Active labour market measures remain largely
unutilised and insufficiently targeted.
Some steps have been taken in
simplifying the business
environment, including the reduction
of parafiscal charges. Most other
areas, however, register significant delays.
Expected Conclusions from IDR analysis
Corporate debt still burdens the economy, constraining investment. The still high general government debt implies high sustainability
risks in the medium term. The large share of foreign currency denominated debt is a source of vulnerability to potential currency
shocks. Despite the losses incurred from provisioning for Agrokor-related loans, the financial sector remains profitable and well-
capitalised. The net international investment position is improving, but remains at levels that exceed the prudential threshold, contributing to the vulnerability of the economy. Persistently low activity rates and the shrinking labour force hold back the growth
potential.
The continued economic growth is expected to contribute to a further reduction in the private and public debt-to-GDP ratio. The current account is expected to remain in surplus, supporting a further reduction in external debt. The pace of deleveraging is set to
abate as household and corporate credit activity intensifies, supporting investment.
Improvements are needed in order to ensure a durable correction of the primary balance and solid management of public debt. With
investment growing again, increase in potential growth could be ensured by improving the business environment and addressing the low activity rates.

18
Croatia's deficit decreased markedly and the
debt ratio was put on a declining path. In June
2017, the Council decided to abrogate the
excessive deficit procedure for Croatia (8), after the
general government deficit reached 0.9 % of GDP
in 2016, well below the 3 % Treaty threshold. The
improvement was largely driven by economic
growth supporting tax revenue and restraint of
expenditure growth. The lower deficit contributed
to the decrease in the debt ratio from 85.4 % in
2015 to 82.7 % in 2016. Nominal GDP growth and
the appreciation of the kuna (which reduced the
value of the large portion of debt in foreign
currency) also contributed to the reduction of the
debt-to-GDP ratio. In spite of the continued
decrease in 2017 (to below 80 %), the debt ratio
remains high, especially compared to peers (9). It is
expected to continue decreasing as the primary
balance remains in surplus and the nominal GDP
growth-interest rate differential grows having
turned positive, also owing to the refinancing of
debt at lower interest rates.
Graph 4.1.1: General government debt trends
Source: Eurostat.
Fiscal policy aims to turn the general
government deficit into a surplus in the medium
term. The 2018 budget, adopted in November
2017, is consistent with the policy direction in the
(8) Council Decision (EU) 2017/1191
(9) Slovenia, Hungary, Czech Republic, Slovakia and Poland.
previous two years and the 2017 convergence
programme. In particular, the general government
balance was planned at -0.5 % of GDP in 2018,
before turning to a balanced budget in 2019 and a
surplus of 0.8% of GDP in 2020. These targets
seem within reach, also in light of the prudent
projections for revenue growth in the budget and
the fact that the deficit reductions achieved in 2016
and 2017 provide a good basis for further
improvements. Based on the latest available data,
the 2017 deficit is expected to turn out
significantly lower than forecasted. Risks for
public finances arise in the form of healthcare
arrears (see Section 4.5), pending legal disputes
(10), guarantees and the impact of the Agrokor
crisis. In particular, after slightly decreasing in the
aftermath of the crisis, the level of guarantees
issued by the government, mainly on the debt of
SOEs, has been rising recently. Agrokor-related
fiscal risks include HBOR's stock of outstanding
loans issued to companies within Agrokor (ca.
0.15 % of GDP) as well as possible negative
effects on tax revenue from creditors and suppliers
to the Agrokor group.
Refinancing risks appear low in the short term.
The government financing needs were met without
difficulty in 2017, also thanks to ample liquidity in
the banking sector and low and declining interest
rates. Yields on government securities have
continued to fall in 2017, significantly lowering
the cost of refinancing maturing debt. Overall,
short-term fiscal risks stemming from the fiscal
and broader macro-financial conditions in Croatia
have continued to decrease, thanks to the
improving state of the public finances as well as
GDP growth and deleveraging in the private
sector, and appear low (11). The key risk remains
the depreciation of the kuna, since 70 % of public
debt is denominated in foreign currency, mainly
euros.
(10) Including arbitration cases against the government of
Croatia on account of some commercial banks' claims for
compensation for the losses incurred in the aftermath of the
2015 legislated conversion of CHF-denominated loans.
(11) Short term fiscal risks are estimated using the S0 "early
detection" composite indicator which relies on 28 fiscal
and macro-financial variables with a proven track record of
signalling upcoming fiscal stress (Berti et al., 2012).
-6
-4
-2
0
2
4
6
8
10
12
05 06 07 08 09 10 11 12 13 14 15 16 17 18 19
pps
Primary deficit Interest Real growth
Inflation Stock-flow adjust. Debt/GDP, change
forecast
4. REFORM PRIORITIES
4.1. PUBLIC FINANCES* AND TAXATION

4.1. Public finances and taxation*
19
Graph 4.1.2: Active government guarantees
Source: Croatian National Bank.
Fiscal sustainability risks remain low in the
long term and declined somewhat in the
medium term. Assessed on the basis of the
autumn 2017 forecast, fiscal risks in the medium
term declined since spring 2017, but remain high
overall. In particular, the improved budgetary
position implies that the size of fiscal adjustment
in primary structural terms required to reduce the
debt ratio to the 60 % Treaty reference value by
2032 has declined. Still, a sensitivity analysis of
the public debt trajectory points to high
sustainability risks in the medium term under a
scenario which maintains the historic structural
primary balance through 2028. It should
nevertheless be noted that a 2017 outturn for the
deficit and debt ratio better than expected and
forecasted in autumn 2017 would further improve
the fiscal sustainability risks in the medium term.
In the long term, Croatia continues to face low
fiscal risks (12), largely related to the projected
decrease in the spending requirements on pensions
which is offset only partially by increased
spending requirements on health. The improving
country risk was reflected in the first upgrade of
Croatia's rating since 2004 (13), bringing it to a
notch below investment grade.
(12) The long-term sustainability is assessed using the S2
indicator. It estimates the fiscal adjustment in structural
terms required to stabilise the debt ratio over an infinite
period, taking into account the costs of ageing. However, it
does not entail a specific reference value at which the debt
is stabilized.
(13) In January 2018, Fitch upgraded Croatia's rating to BB+.
As Croatia's deficit decreases, improving the
quality of expenditure can help maintain or
improve the quality of services provided. The
focus of fiscal policy in recent years has been on
decreasing the deficit in line with the requirements
of the Stability and Growth Pact. This has been
instrumental in restraining the build-up of public
debt and subsequently putting the debt ratio on a
declining path. Nevertheless, government
expenditure in proportion to GDP remains higher
compared to peer countries (see Graph 4.1.3), in
line with the observed strong influence of the state
in the economy.
Graph 4.1.3: Primary expenditure compared to peers in
2016
Source: Eurostat.
High spending in public administration and low
spending in transport, education and R&D
stands out for Croatia. In most categories,
Croatia's expenditure ratio is in line with that of its
peers. Social protection spending is slightly below
the average in spite of the comparatively more
severe economic situation in recent years. Even
when the cost of debt servicing is excluded,
Croatia spends considerably above average on
general public services, which is mostly related to
the cost of public administration at all levels of
government. This confirms the conclusions on the
analysis of territorial fragmentation in the 2017
Country report, which noted that in local units the
administrative functions absorb more than one
third of current expenditure, and in some cases the
financing of the administration itself takes up to
half of the units’ budgets. At the same time,
spending is relatively low in Transport, as well as
0
1
2
3
0
2
4
6
8
10
11Q
1
12Q
1
13Q
1
14Q
1
15Q
1
16Q
1
17Q
1
% of GDPbillion HRK
International (lhs)
Other domestic (lhs)
Guarantees - HBOR loans (lhs)
Total (rhs)
-10
-8
-6
-4
-2
0
34
36
38
40
42
44
46
Croatia Hungary Slovenia Slovakia Poland Czech R.
pps % of GDP
Primary expenditure (lhs)
Decrease from 2010-2015 average (rhs)

4.1. Public finances and taxation*
20
in Education and R&D spending – two areas that
are crucial for sustainable growth. Trends indicate
that, as a share of total, spending on Transport and
Education has decreased in the period 2008-2015,
while spending on Health has stagnated.
Meanwhile, spending on economic affairs and
recreation, culture and religion have been rising.
Graph 4.1.4: Expenditure by main functions in 2015
compared to peers
(1) Expenditure based on COFOG classification.
(2) Peer group consists of countries in footnote 10.
(3) General public services exclude public debt
transactions.
(4) Economic affairs exclude transport expenditure, shown
separately.
Source: Eurostat.
The estimated efficiency of spending is low in
many areas. In order to assess the quality of
public expenditure, a review of its composition has
to be complemented by an analysis of its
efficiency. The focus on efficiency allows
reconciling the goal of sustainable public finances
with the continued provision of adequate levels of
public services to citizens. Measuring efficiency of
public expenditures is a complex task. It crucially
requires identifying the goals or outcomes that the
public sector aims to achieve in each spending area
examined. Public expenditures may fulfil various
objectives, such as fairness and redistribution,
macroeconomic stabilisation, the promotion of
employment and growth. Box 4.1.1 presents the
results of the analysis of expenditure efficiency in
eight areas: police services, law courts, transport,
health, education, research & innovation, social
protection and social protection of the elderly.
After defining the objectives in terms of output
indicators for each expenditure area, it assesses the
efficiency with which such expenditure is
translated into the set outputs, using the best
performing country in the sample as the
benchmark. Overall, the analysis suggests there is
scope for considerably improving the efficiency of
spending in most areas, Social protection and
Education being among those in which
socioeconomic benefits could be highest.
Fiscal-structural issues
The long overdue adoption of new Fiscal
Responsibility and Budget acts has again been
delayed. The national budgetary framework
remains underdeveloped. The transparency of
fiscal policy suffers from the non-systematic use of
sensitivity analyses in budgetary planning and a
lack of methodological publications and ex-post
evaluations of the official forecasts. The design of
the national numerical fiscal rule remains flawed,
as no consequences are defined for non-
compliance. The domestic medium-term budgetary
framework is only indicative for annual fiscal
planning and the role of the Fiscal Policy
Commission remains weak.
Croatia has initiated the ratification of the
Treaty on Stability, Coordination and
Governance. In the context of Croatia's
announced intention to introduce the Euro, in
January 2018 the Parliament adopted legislation
whereby Croatia became a signatory to the Treaty
on Stability, Coordination and Governance.
Croatia is exercising its right of exemption from
the Fiscal Compact provisions (such as the
stipulation of the structural budget balance rule
monitored by an independent institution) of the
Treaty until Eurozone accession.
Improvements were made to the management
of public debt. In November 2017, the
government issued a EUR 1.25 billion bond as part
of the refinancing of SOEs' debt. Besides reducing
and fixing the interest rate and extending
maturities, this enabled the authorities to
concentrate a higher share of general government
debt under the Treasury. In addition, the body
assigned with debt management was upgraded to
the level of a Directorate in the ministry of
Finance, with increased staffing. Both these
developments are expected to improve the
effectiveness of debt management.
0
5
10
15
20% of GDP
HR Peer average (simple) Min Max

4.1. Public finances and taxation*
21
Taxation
The Croatian tax system strongly relies on
indirect taxes. In proportion to GDP, indirect tax
revenues (19.7 %) in Croatia are three times higher
than direct taxes (6 %). They are significantly
above EU average (13.6 %), but also the average
for the peer countries. (14) The already legislated
introduction of the property tax was postponed
with no indication of whether and when will it be
implemented. This type of tax is generally
regarded as one of the least detrimental to growth.
The 2017 tax reform is expected to benefit only
certain types of households. The reform, which
most notably cut personal income tax rates and
raised the personal tax allowance(15), is projected
to have decreased the tax liability for all
households that were subject to income tax and
increased the number of households that pay no
tax. Simulations (16) project that the gains from the
reform are largest at the lower end of the wage
distribution in the cases of single earners and two-
earner households with no children or one child.
The tax wedge for a single worker (average wage)
is projected to have decreased by 0.5 pp, with
larger decreases for those earning 67 % and 50 %
of the average wage (-2.3 pp and -1.2 pp,
respectively). Decreases in the tax wedge for a
two-earner household with two children are
slightly larger at average wage level (-1.5 pp).
(14) 2015 peer (see footnote 10) average is 14.1 % for indirect
taxes and 7.2 % for direct taxes. As a % of GDP, Croatia
collects the highest amount of VAT among EU member
states (European Commission 2017k).
(15) The specifics of the tax reform were outlined in the 2017
Country report, which also included an analysis of the
impact of the reform on disposable income and marginal
tax rates across the income distribution.
(16) Calculated by the European Commission using the OECD
Tax-Benefits model
However, the tax wedge for this household type
does not decrease at lower wage levels (67 % and
50 % of average wage), as these incomes were not
taxed already before the reform. Significant
increases in the (non means-tested and non-
capped) child tax allowances mean that the gains
will have been highest for larger families at the
upper end of the earnings distribution.
The reform is projected to increase inequality
and provide limited support to employment.
Although the tax burden and tax wedge were
already low before the reform, the reduction of the
tax wedge should benefit employment. However,
the increase in the dependent spouse allowance
could decrease incentives to work for second
earners. Since households in the lowest deciles of
the overall income distribution are unlikely to
benefit from the reform (17), the Gini coefficient
which measures income inequality (18) is projected
to have increased.
Table 4.1.1: Tax wedge comparison with peers
(1) Peer group consists of countries in footnote 10.
(2) Simple averages were used for EU and peers.
(3) 2017 projection based on EUROMOD simulation.
Source: European Commission, OECD.
(17) Results of the EUROMOD simulation (European
Commission 2017f).
(18) For incomes the coefficient is bound by 0 (no inequality)
and 1 (maximum inequality). Income data from EU-SILC
refer to the previous year.
Tax wedgeSingle person,
50% AW
Single person,
67% AW
Single person,
AW
Croatia 2016 32.9% 34.9% 38.8%
Croatia 2017 31.7% 32.6% 38.3%
EU average 2016 32.5% 36.8% 40.6%
Peer average 2016 37.3% 40.2% 42.2%
Peer range 2016 32.6%-48.3% 35.1%-48.3% 35.8%-48.3%
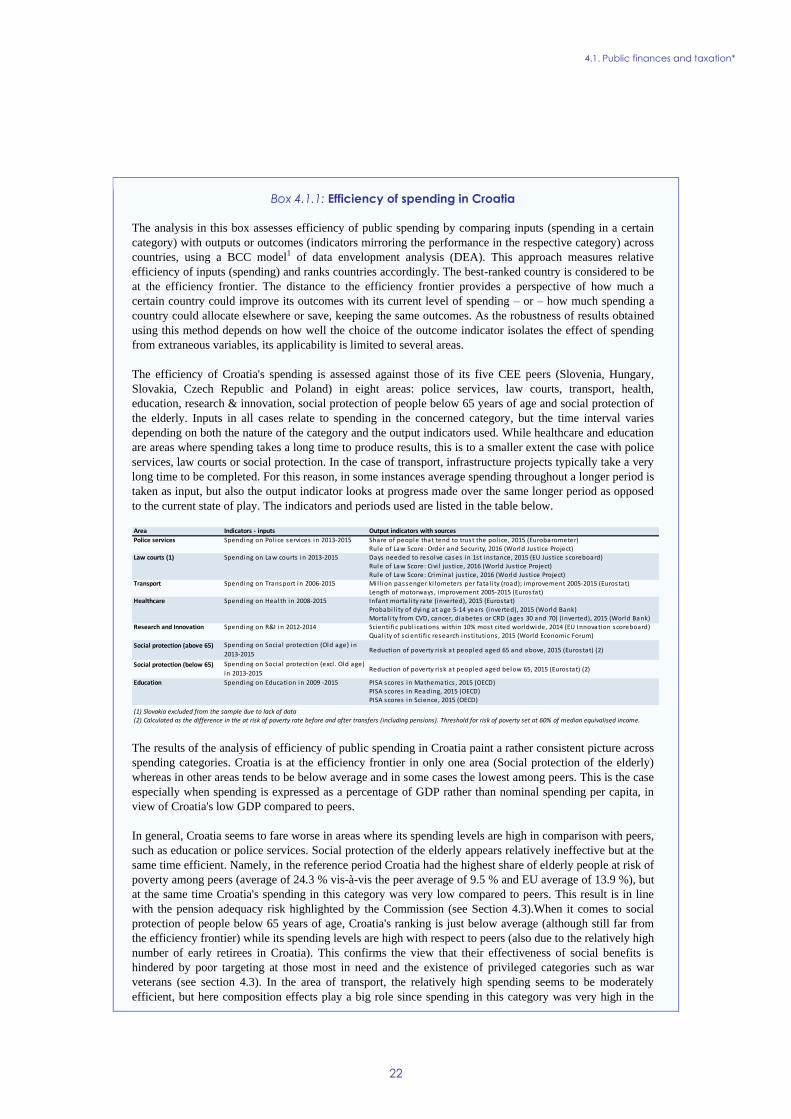
4.1. Public finances and taxation*
22
Box 4.1.1: Efficiency of spending in Croatia
The analysis in this box assesses efficiency of public spending by comparing inputs (spending in a certain
category) with outputs or outcomes (indicators mirroring the performance in the respective category) across
countries, using a BCC model1 of data envelopment analysis (DEA). This approach measures relative
efficiency of inputs (spending) and ranks countries accordingly. The best-ranked country is considered to be
at the efficiency frontier. The distance to the efficiency frontier provides a perspective of how much a
certain country could improve its outcomes with its current level of spending – or – how much spending a
country could allocate elsewhere or save, keeping the same outcomes. As the robustness of results obtained
using this method depends on how well the choice of the outcome indicator isolates the effect of spending
from extraneous variables, its applicability is limited to several areas.
The efficiency of Croatia's spending is assessed against those of its five CEE peers (Slovenia, Hungary,
Slovakia, Czech Republic and Poland) in eight areas: police services, law courts, transport, health,
education, research & innovation, social protection of people below 65 years of age and social protection of
the elderly. Inputs in all cases relate to spending in the concerned category, but the time interval varies
depending on both the nature of the category and the output indicators used. While healthcare and education
are areas where spending takes a long time to produce results, this is to a smaller extent the case with police
services, law courts or social protection. In the case of transport, infrastructure projects typically take a very
long time to be completed. For this reason, in some instances average spending throughout a longer period is
taken as input, but also the output indicator looks at progress made over the same longer period as opposed
to the current state of play. The indicators and periods used are listed in the table below.
The results of the analysis of efficiency of public spending in Croatia paint a rather consistent picture across
spending categories. Croatia is at the efficiency frontier in only one area (Social protection of the elderly)
whereas in other areas tends to be below average and in some cases the lowest among peers. This is the case
especially when spending is expressed as a percentage of GDP rather than nominal spending per capita, in
view of Croatia's low GDP compared to peers.
In general, Croatia seems to fare worse in areas where its spending levels are high in comparison with peers,
such as education or police services. Social protection of the elderly appears relatively ineffective but at the
same time efficient. Namely, in the reference period Croatia had the highest share of elderly people at risk of
poverty among peers (average of 24.3 % vis-à-vis the peer average of 9.5 % and EU average of 13.9 %), but
at the same time Croatia's spending in this category was very low compared to peers. This result is in line
with the pension adequacy risk highlighted by the Commission (see Section 4.3).When it comes to social
protection of people below 65 years of age, Croatia's ranking is just below average (although still far from
the efficiency frontier) while its spending levels are high with respect to peers (also due to the relatively high
number of early retirees in Croatia). This confirms the view that their effectiveness of social benefits is
hindered by poor targeting at those most in need and the existence of privileged categories such as war
veterans (see section 4.3). In the area of transport, the relatively high spending seems to be moderately
efficient, but here composition effects play a big role since spending in this category was very high in the
Area Indicators - inputs Output indicators with sources
Police services Spending on Pol ice services in 2013-2015 Share of people that tend to trust the pol ice, 2015 (Eurobarometer)
Rule of Law Score: Order and Securi ty, 2016 (World Justice Project)Law courts (1) Spending on Law courts in 2013-2015 Days needed to resolve cases in 1st instance, 2015 (EU Justice scoreboard)
Rule of Law Score: Civi l justice, 2016 (World Justice Project)
Rule of Law Score: Criminal justice, 2016 (World Justice Project)Transport Spending on Transport in 2006-2015 Mil l ion passenger ki lometers per fata l i ty (road); improvement 2005-2015 (Eurostat)
Length of motorways , improvement 2005-2015 (Eurostat)Healthcare Spending on Health in 2008-2015 Infant mortal i ty rate (inverted), 2015 (Eurostat)
Probabi l i ty of dying at age 5-14 years (inverted), 2015 (World Bank)Mortal i ty from CVD, cancer, diabetes or CRD (ages 30 and 70) (inverted), 2015 (World Bank)
Research and Innovation Spending on R&I in 2012-2014 Scienti fic publ ications within 10% most ci ted worldwide, 2014 (EU Innovation scoreboard)
Qual i ty of scienti fic research insti tutions , 2015 (World Economic Forum)
Social protection (above 65) Spending on Socia l protection (Old age) in
2013-2015Reduction of poverty ri sk at peopled aged 65 and above, 2015 (Eurostat) (2)
Social protection (below 65) Spending on Socia l protection (excl . Old age)
in 2013-2015Reduction of poverty ri sk at peopled aged below 65, 2015 (Eurostat) (2)
Education Spending on Education in 2009 -2015 PISA scores in Mathematics , 2015 (OECD)PISA scores in Reading, 2015 (OECD)PISA scores in Science, 2015 (OECD)
(1) Slovakia excluded from the sample due to lack of data
(2) Calculated as the difference in the at risk of poverty rate before and after transfers (including pensions). Threshold for risk of poverty set at 60% of median equivalised income.

4.1. Public finances and taxation*
23
first part of the period under consideration but sharply declined in the second part.
In order to assess the robustness of the results, alternative indicators were tested, largely confirming the
initial results. In three areas, alternative input indicators were tested, namely: the number of judges (law
courts) and medical doctors (health) per 100 000 inhabitants and teachers per 100 pupils (education). In the
case of health and particularly law courts, the use of the alternative indicator decreases Croatia's efficiency
score, suggesting that inefficiencies could in part be traced back to the sub-optimal allocation of human
resources, which is in line with the observed uneven workload of judges. In that sense, the reorganization of
the judicial network (see section 4.5) could help reduce inefficiencies. On the other hand, in education the
use of an alternative input indicator substantially improves Croatia's efficiency score.
It should be noted that this analysis is based on data up to 2015. Given the extent of expenditure restraint
recorded in 2016 and 2017 it is possible that the efficiency of spending has since improved. For a broader
analysis of efficiency of spending in the EU, see European Commission (2016d).
1 Banker, Charnes, Cooper model, which assumes variable returns to scale.

24
Corporate debt
Corporate debt decreased as a percentage of
GDP and corporations lowered their exposure
to foreign currency. In the first half of 2017, the
corporate debt-to-GDP ratio decreased by an
additional 2.8 pps, to 67.8 % of GDP. Overall, the
debt ratio dropped by approximately 15.6 pps from
its 2010 peak value of 83.4 % of GDP. The
reduction has been driven mainly by a substantial
contraction in domestic loans denominated in
foreign currency (by 7.5 pps) and in external
corporate debt (by 7.9 pps). However, the exposure
of Croatian companies to currency risk remains
high, as 75 % of corporate debt, equivalent to
approximately 51 % of GDP, was debt contracted
abroad or denominated in foreign currency (see
Graph 4.2.1).
Graph 4.2.1: Debt composition of non-financial
corporations
* Mid-2017.
(1) 'Other debt' is the debt to domestic leasing companies,
insurance companies and other financial institutions. NFC:
non-financial corporations; CI: credit institutions; F/C: foreign
currency.
(2) Intercompany lending is assumed to belong to external
debt of private NFCs.
Source: Croatian National Bank and Eurostat.
The economic recovery is supporting the
reduction of corporate debt. Since 2015, the
decrease in corporate debt has been mainly driven
by dynamic economic activity, supported by the
moderate pick-up in inflation in 2017. Write-offs
and valuation effects, i.e. the appreciation of the
Kuna against the Euro, also contributed to the
reduction of corporate indebtedness since the first
reduced the amount of non-performing loans,
whereas the latter reduced the value of outstanding
liabilities indexed to or denominated in foreign
currency (see Graph 4.2.2). Debt reduction mainly
took place in businesses in the hotel and restaurant
sector as well as in the trade and construction
sectors, which reduced their external loans by
principal repayment, in addition to considerable
write-offs. Taking into account the domestic
banking sector only, negative credit flows to the
corporate sector were still contributing to the
reduction of corporate debt in 2015 and, to a small
extent, 2016. However, in 2017, credit flows to the
corporate sector had turned positive rising by 3.4
% - due to positive growth rates in the foreign
currency segment more than compensating for the
slightly decrease in flows in the domestic segment
(see Graph 4.2.2).
Graph 4.2.2: Contributions to change in total corporate
debt-to-GDP ratio
* Mid-2017.
(1) 'Other changes' include write-offs and valuation effects.
Source: Croatian National Bank and Eurostat.
Interest rates have been on a declining trend
over the last few years and are expected to stay
at low levels. This trend is more pronounced in
loans indexed to and denominated in foreign
currency. The decrease started in the second half
of 2014 with big-size loans, followed by medium-
sized loans in 2016, stabilizing between 2 and 3 %
thereafter. Interest rates on loans denominated in
domestic currency also decreased, but remain
above those of peers (see Graph 4.2.3). The
decrease is least visible in the short-term segment.
The decrease in interest rates in the long-term
segment reflects the mild fall in yields to maturity
0
20
40
60
80
100
06 07 08 09 10 11 12 13 14 15 16 17*
% of GPD
Other debtDomestic loans in F/CDomestic loans in KunaExternal debt of private NFCsExternal debt of public NFCsTotal corporate debtTotal external debt of NFCsExternal debt + debt from domestic CI
-6
-4
-2
0
2
4
6
8
10
12
14
02 03 04 05 06 07 08 09 10 11 12 13 14 15 16 17*
y-o-y change - %
of GDP
Credit flow Real growth Inflation
Other changes D/GDP, change
4.2. PRIVATE SECTOR DEBT AND FINANCIAL SECTOR*

4.2. Private sector debt and financial sector*
25
on Croatian long-term government bonds, ample
liquidity and greater competition among domestic
banks, particularly in offering more competitive
(re)financing conditions. However, the continued
parallel decline in interest rates in the euro area
together with the still relatively high country risk
premium for Croatia resulted in a widening spread
between interest rates on corporate loans in Croatia
for short-term loans, but a narrowing one with
regard to long-term loans (see CNB, 2017).
Graph 4.2.3: Interest rates on bank loans to corporations
(1) Mid-size loans (EUR 0.25-1 million) from domestic credit
institutions to non-financial corporations with an initial rate
fixation period 5-10 years issued in domestic currency, new
business
(2) Peer countries relate to the peer group defined in
footnote [10], excluding Poland (no data)
Source: European Central Bank.
The corporate debt ratio is not particularly
high but subject to a number of vulnerabilities.
Overall, by June 2017 the corporate debt ratio was
close to the prudential threshold indicating
potential risks and less than 10% of GDP above
the level suggested by fundamentals19. The
decrease in the corporate debt ratio since 2010 has
thus reduced risks significantly. One of the
vulnerabilities is the high concentration of
corporate debt in a few big companies, including
also the Agrokor Group (see Box 4.2.1). Risks also
(19) Fundamentals-based benchmarks are derived from
regressions capturing the main determinants of credit
growth. Prudential thresholds represent the debt threshold
beyond which the probability of a banking crisis is high,
obtained from the minimisation of the probability of
missed crisis and that of false alerts (European
Commission, 2017c).
arise in the form of high share of loans in foreign
currency, especially for non-exporting companies.
Notwithstanding the greater availability of less
costly funding, corporate sector debt is also still
exposed to interest rate hikes. However, this risk
has been slightly reduced, due to an increase in the
duration of average fixation period. In addition,
both the ‘debt-to-gross financial assets’ and the
‘debt-to-equity’ ratios of the non-financial
corporate sector are relatively high, highlighting
potential solvency risks.
Household debt
Household debt as a percentage of GDP
decreased further, despite the recovery of
borrowing in 2017. By June 2017, the debt-to-
GDP ratio in the household sector was down to
34.6 %, 7.3 pps below its 2010 peak value. In
2016, the reduction in the debt ratio was notably
impacted by the statutory conversion of CHF-
denominated loans into EUR-denominated loans
(with interest rates capped at historical averages of
equivalent EUR-denominated loans) at the end of
2015. In 2017, the pace of debt reduction slowed
down despite intensifying economic activity, due
to an upswing in credit flows (see Graph 4.2.5). On
the one hand, credit standards for granting housing
and consumer loans continued to ease throughout
2016 and early 2017, due to stronger competition
among banks in offering more competitive
(re)financing conditions, reduced costs of sources
of financing and positive growth expectations. On
the other, demand by households for loans picked
up, due to growing consumer confidence, positive
trends in the labour market and a favourable real
estate market outlook (see Graph 4.2.4).
0
1
2
3
4
5
6
7
8
Jun
17
Dec 1
6
Jun
16
Dec 1
5
Jun
15
Dec 1
4
Jun
14
Dec 1
3
pps
Peer range Croatia
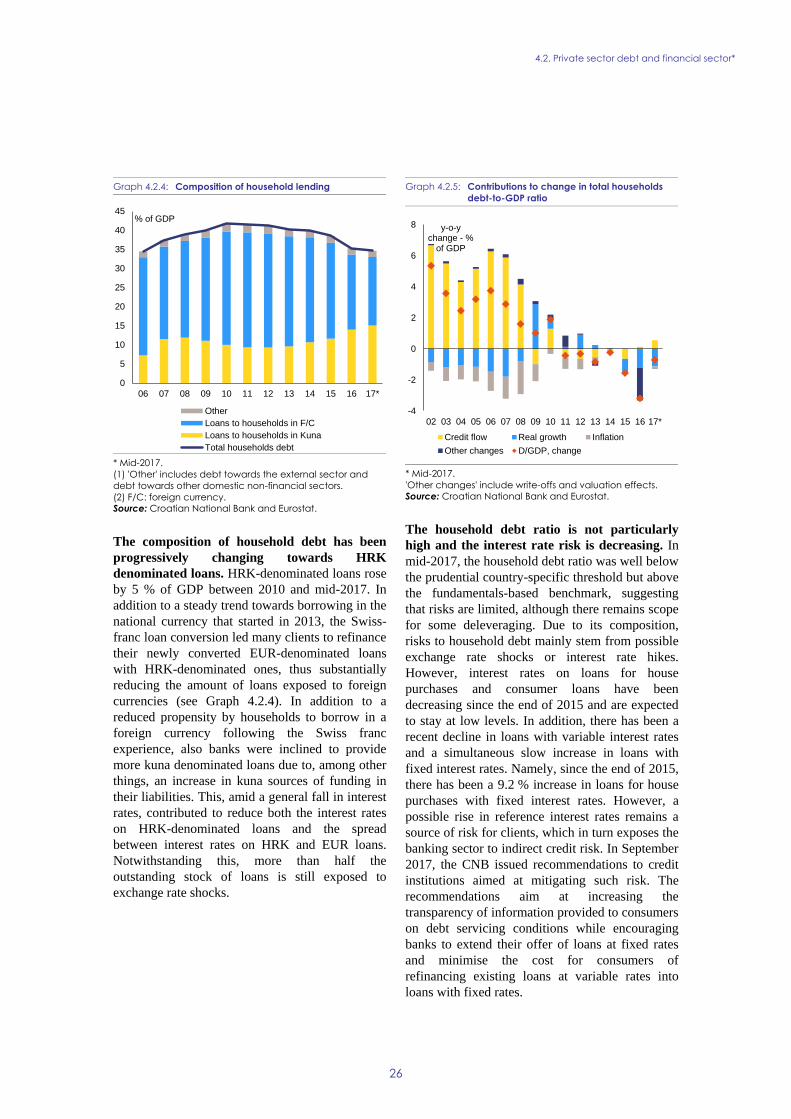
4.2. Private sector debt and financial sector*
26
Graph 4.2.4: Composition of household lending
* Mid-2017.
(1) 'Other' includes debt towards the external sector and
debt towards other domestic non-financial sectors.
(2) F/C: foreign currency.
Source: Croatian National Bank and Eurostat.
The composition of household debt has been
progressively changing towards HRK
denominated loans. HRK-denominated loans rose
by 5 % of GDP between 2010 and mid-2017. In
addition to a steady trend towards borrowing in the
national currency that started in 2013, the Swiss-
franc loan conversion led many clients to refinance
their newly converted EUR-denominated loans
with HRK-denominated ones, thus substantially
reducing the amount of loans exposed to foreign
currencies (see Graph 4.2.4). In addition to a
reduced propensity by households to borrow in a
foreign currency following the Swiss franc
experience, also banks were inclined to provide
more kuna denominated loans due to, among other
things, an increase in kuna sources of funding in
their liabilities. This, amid a general fall in interest
rates, contributed to reduce both the interest rates
on HRK-denominated loans and the spread
between interest rates on HRK and EUR loans.
Notwithstanding this, more than half the
outstanding stock of loans is still exposed to
exchange rate shocks.
Graph 4.2.5: Contributions to change in total households
debt-to-GDP ratio
* Mid-2017.
'Other changes' include write-offs and valuation effects.
Source: Croatian National Bank and Eurostat.
The household debt ratio is not particularly
high and the interest rate risk is decreasing. In
mid-2017, the household debt ratio was well below
the prudential country-specific threshold but above
the fundamentals-based benchmark, suggesting
that risks are limited, although there remains scope
for some deleveraging. Due to its composition,
risks to household debt mainly stem from possible
exchange rate shocks or interest rate hikes.
However, interest rates on loans for house
purchases and consumer loans have been
decreasing since the end of 2015 and are expected
to stay at low levels. In addition, there has been a
recent decline in loans with variable interest rates
and a simultaneous slow increase in loans with
fixed interest rates. Namely, since the end of 2015,
there has been a 9.2 % increase in loans for house
purchases with fixed interest rates. However, a
possible rise in reference interest rates remains a
source of risk for clients, which in turn exposes the
banking sector to indirect credit risk. In September
2017, the CNB issued recommendations to credit
institutions aimed at mitigating such risk. The
recommendations aim at increasing the
transparency of information provided to consumers
on debt servicing conditions while encouraging
banks to extend their offer of loans at fixed rates
and minimise the cost for consumers of
refinancing existing loans at variable rates into
loans with fixed rates.
0
5
10
15
20
25
30
35
40
45
06 07 08 09 10 11 12 13 14 15 16 17*
% of GDP
Other
Loans to households in F/C
Loans to households in Kuna
Total households debt
-4
-2
0
2
4
6
8
02 03 04 05 06 07 08 09 10 11 12 13 14 15 16 17*
y-o-y change - %
of GDP
Credit flow Real growth Inflation
Other changes D/GDP, change

4.2. Private sector debt and financial sector*
27
Housing market
As the economic recovery gained ground, real
prices of dwellings picked up by 2.1 % in 2016
in spite of low demand from the household
sector. The rebound in house prices witnessed
since 2016 has been driven by increases in the
prices of existing real estate, which are
nevertheless still below their 2010 levels. By
contrast, the prices of new residential properties
have continued to decline. House prices on the
Adriatic coast and in Zagreb have contributed to
the growth, while prices in other parts of the
country remain subdued. In recent years, helped by
increasing incomes on the one hand and subdued
price dynamics on the other, the price-to-income
ratio has decreased, signalling improved
affordability of housing. Nevertheless, private
demand remains subdued. This can partly be
explained by a combination of negative
demographic trends and an already high rate of
home ownership.
Graph 4.2.6: Dwellings price developments
Source: Croatian Bureau of Statistics.
The abolition of tax exemptions was partly
offset by the introduction of a subsidy scheme
for first-time buyers. As part of the 2016 tax
reform, the exemption from the property
transaction tax for first time buyers was abolished.
However, the new Act on State-subsidised
Housing Loans aims to compensate, subject to
certain criteria, first time buyers of residential
property by providing more favourable borrowing
conditions. The subsidy, funded from the state
budget, covers half of the annuity during the first
four years of the repayment period.
Access to finance
Companies' access to bank loans is gradually
improving, also for small firms. Banks’ lending
activity remains subdued, especially in the small
business segment. According to the latest findings
from the Survey on the Access to Finance of
Enterprises, access to finance has generally
improved, but on average remains more difficult
for Croatian firms. In 2017, among the surveyed
companies that applied for a bank loan, 71 % of
them were granted a loan, compared with 61 % the
year before. However, many surveyed companies
(21 %) were still awaiting the outcome of their
application, compared with 13 % the year before.
Moreover, 11 % of all surveyed small firms did not
apply for a bank loan due to fear of rejection, more
than twice the EU average of 5 %. According to
banks' responses to the bank lending survey, credit
standards on loans to enterprises tightened mildly
in the second and third quarters of 2017, with
standards on loans to medium and small
enterprises tightening the most. On the contrary,
the latter experienced easing credit standards in the
fourth quarter of 2017, while standards on loans to
large enterprises kept tightening. Apart from direct
bank lending, other sources of financing include
loans and credit lines with subsidised interest rates
from the Croatian Bank for Reconstruction and
Development (HBOR), implemented through
commercial banks (20) and loans from the Croatian
Agency for SMEs, Innovations and Investments
(HAMAG-BICRO), mainly to fund innovation and
its commercialisation in entrepreneurship.
The European Structural and Investment
Funds aim to facilitate financing for small
firms. A set of new financial instruments
supported by the European Regional Development
Fund (ERDF) are meant to ease access to finance
for small businesses and consequently boost
entrepreneurship in Croatia. The debt instruments
amount to a total of EUR 280 million and are
expected to leverage approximately EUR 800
million of private investment. They are being
developed under two financing agreements. One is
implemented by the government agency HAMAG-
BICRO and mobilises EUR 170 million in micro
(20) However, more than half of HBOR assets are direct loans.
-8
-6
-4
-2
0
2
4
6
15Q
1
15Q
2
15Q
3
15Q
4
16Q
1
16Q
2
16Q
3
16Q
4
17Q
1
17Q
2
% change y-o-y
New dwellings Existing dwellings
Zagreb Adriatic
Other

4.2. Private sector debt and financial sector*
28
and small loans, individual guarantees and
guarantees combined with interest subsidy. This
instrument has proved successful, with a total
disbursement rate of 41 % with the cut-off date 31
December 2017. The other, signed in October
2017, will be implemented by the Croatian Bank
for Reconstruction and Development (HBOR). It
will make a total of EUR 110 million available in
growth and development loans. Implementation of
this agreement is expected to start soon, and is
planned to raise total private capital of EUR 105
million. The first tranche was paid from HBOR to
financial intermediaries (3 selected commercial
banks) in December 2017, but nothing has been
disbursed yet.
Other sources of financing for companies
remain largely underdeveloped. Over the past
few years there has been very little progress in
developing new venture capital funds in Croatia.
The 2015 World Bank initiative on Innovation and
Entrepreneurship Venture Capital Project – which
aimed to strengthen risk capital financing for
innovative small and medium-sized firms and
start-ups in Croatia – did not produce results.
However recently, thanks to incentive of ESI
Funds funding, the Croatian government started
negotiations with the EIF aiming at addressing
early stage equity market needs. ESI Funds are
expected to contribute EUR 35 million and the
total expected leverage amounts to more than EUR
70 million. The agreement is planned to be signed
by mid-March 2018 and the funds to start reaching
beneficiaries by end 2018. In parallel, HBOR and
EIF are discussing to jointly commit around EUR
70 million for later stage equity market needs.
Both initiatives should provide significant support
for Croatian venture capital and private equity
market. EU funding recently supported a private
equity fund with a target size of EUR 100 million,
focusing on small firms in Croatia, Slovenia and
Serbia (European Investment Bank, 2017), a sign
that a venture capital ecosystem might be
gradually taking shape.
Financial sector
Despite the Agrokor crisis, Croatian banks’
profitability and solvency have continued to
improve since 2015. With a return on equity of
8.9 % in 2016, banks' profitability has largely
recovered from the negative impact of the
conversion of CHF-denominated loans (see Table
4.2.1). The solvency ratio is back to the level it had
reached before the CHF conversion. Liquidity
indicators remain relatively high. In 2016, the
loan-to-deposit ratio dropped to its lowest level
since 2004, before increasing mildly in the first
half of 2017 as lending to the private sector started
to recover.
The stock of non-performing loans (NPLs)
continues to decline in the private sector, albeit
at a slower pace. Both the NPL stock and NPL
ratio have continued their downward trend,
although more slowly than in 2016 (see Graph
4.2.7). By June 2017, the NPL ratio stood at
11.7 %, up from 11.6 % in June 2016. As of June
2017, NPLs were still significant in the private
sector. Among non-financial corporations, the
NPL ratio is about 26.3 %. Based on CNB data
(21), NPLs particularly affect the construction
sector, which alone constitutes 17 % of the total
NPL stock and where the NPL ratio has been
above 60 % since June 2014. A high level of NPLs
may hamper the ability of banks to extend new
credit to firms, thus (partly) explaining why credit
flows for the corporate sector are still weak. In the
household sector the NPL ratio reached 8.8 % in
June 2017, about 3 pps lower than its 2015 peak.
NPLs in the household sector are predominantly
found among mortgage loans. The reduction in the
coverage ratio, namely the ratio between
accumulated impairments and NPLs, has been
mainly due to (i) the use of provisions, as certain
banks wrote-off their Agrokor exposures and (ii)
amendments to the automatic provisioning
rules(22), which led to some amount of
provisioning reversals (see Table 4.2.1).
(21) The Croatian National Bank data on NPLs, which provides
a more granular analysis than ECB data, are based on the
local loan classification rules. Accordingly, they cover
partly recoverable loans (i.e. loans for which there exists
objective evidence of partial impairment) and fully
irrecoverable loans (i.e. loans for which there exists
objective evidence of full impairment). As a general rule,
the local figures are broader than those cited by the
European Central Bank.
(22) In March 2017, the CNB introduced an amendment to the
automatic provisioning rules that were first introduced in
2013. The guidelines continue to encourage banks to
increase the coverage ratio of past-due loans by 10 % each
additional year they spend as being past-due, now with a
cap of 80 %.

4.2. Private sector debt and financial sector*
29
Graph 4.2.7: Evolution of NPLs and coverage ratio
NFCs: non-financial corporations. Domestic (CNB) definition
of NPLs is used.
Source: Croatian National Bank.
NPL sales continue to be the main contributor
to the reduction in NPLs. NPL sales in 2017 are
likely to compare closely to the previous year
when total sales were already at historically high
levels (see Graph 4.2.8). In addition, the overall
economic improvement has led to an increasing
share of restructured loans being reclassified as
performing. In the upcoming period, this beneficial
development may also be supported by the
recently introduced amendment of reclassification
rules by the CNB that enables banks to cure loans
more easily and in line with the European Banking
Authority guidelines. These positive developments
have been offset by a net inflow of NPLs, which
are partly due to defaulted exposures of banks to
Agrokor entities. Well-functioning insolvency
frameworks may facilitate the further reduction in
NPLs.
Graph 4.2.8: NPL sales and other NPL flows
* Mid-2017.
Domestic (CNB) definition of NPLs is used.
Source: Croatian National Bank.
The impact of the Agrokor crisis on Croatian
banks has been limited so far, but risks remain.
Roughly one fifth of Agrokor’s total loans are
estimated to be from Croatian banks, and most of
their impairments have already been incurred in
the first half of 2017. The resulting flow of new
NPLs and the relevant losses have been less than
those predicted under an orderly restructuring
scenario in CNB’s top-down stress test exercise,
conducted in early 2017 (Croatian National Bank,
2017). Nevertheless, the banking sector could be
indirectly affected by its exposure to Agrokor’s
suppliers and by the wider impact on the Croatian
economy of the Agrokor crisis.
0
10
20
30
40
50
60
70
09 10 11 12 13 14 15 16 17
% of loans
Coverage ratio Households
NFCs All sectors -12
-7
-2
3
8
10 11 12 13 14 15 16 17*
billion HRK
Other NPL flows
NPL sales
Change in NPLs from previous period
Table 4.2.1: Financial soundness indicators, all banks in Croatia
(1) Defined as accumulated impairments / NPLs.
(2) ECB aggregated balance sheet: loans excl. to gov. and MFI / deposits excl. from gov. and MFI.
(3) For comparability only annual values are presented.
(4) The variability in 2017 Q2 NPL figures have been partly driven by a broadening of the coverage of the database.
Source: European Central Bank, Consolidated Banking Data.
(%) 2010 2011 2012 2013 2014 2015 2016 2017Q2
Non-performing debt ratio - - - 11.8 12.9 12.5 10.1 10.7
NPL ratio (total) - - - - 13.6 13.0 10.7 11.7
NPL ratio (NFC) - - - - 31.2 29.9 24.2 26.3
NPL ratio (HH) - - - - 12.0 11.8 9.7 8.8
Coverage ratio(¹) - - - 48.1 54.3 59.1 65.8 60.5
Loan to deposit ratio(²) 111.2 100.5 95.6 91.0 83.7 77.3 78.5
Tier 1 ratio - - - 18.6 19.4 17.7 19.4 19.6
Capital adequacy ratio - - - 19.6 20.4 19.2 20.8 20.9
Return on equity(³) - - - 0.6 3.9 -6.8 8.9 -
Return on assets(³) - - - 0.1 0.5 -0.9 1.2 -

4.2. Private sector debt and financial sector*
30
Box 4.2.1: Crisis and restructuring of Agrokor
With around 30 000 employees and 2.2 % of the total gross value added in the economy, the Agrokor group
is the largest private employer in Croatia. Having faced serious financial distress in early 2017, Agrokor was
put under extraordinary administration in April. The potentially large impact on the Croatian economy and
financial stability prompted the government to introduce a special law intended at minimizing the risk of a
disorderly restructuring in systemically important companies. The law authorised a court-appointed
extraordinary administrator, supervised by a council of creditors, to administer the processes of operational
restructuring and negotiation of a settlement with the company's creditors. Agrokor's core business
operations thus suffered only minor disruptions, which allowed the group to benefit from another record
tourist season in Croatia.
In September an audit revealed that total liabilities in 2015 were over 20 % higher than previous official
figures. Agrokor's equity thus turned out to be negative as borrowings stood at just over HRK 40 billion in
2016, representing more than 16 % of the country's total corporate debt or 11.5 % of GDP. Other liabilities,
including most notably trade payables, amounted to more than HRK 16 billion (4.6 % of GDP).
In January 2018, the Commercial Court in Zagreb issued a final list of creditors' valid claims towards
Agrokor, which formed the basis for determining voting rights in the council of creditors (1). After the
establishment of voting rights, a negotiation period ensues which is required by the special law to result in a
settlement by mid-2018, or else the procedure will turn into regular insolvency.
The still uncertain outcome of Agrokor's restructuring, particularly if no settlement is reached, poses a
significant downside risk to the economic activity, as financial losses and possible operational disruptions in
the group and its supply chain could be sizeable. However, the direct risk to the stability of the domestic
financial sector should be contained, since the majority of Agrokor's borrowing relates to external debt
contracted abroad, whereas Agrokor's debt held by the well-capitalised domestic banking sector is not highly
concentrated.
(1) In the meantime, a provisional formation of the council is operational.
The high exposure of the private sector to
currency risks leads to indirect credit risk for
the banking sector. At the end of December 2016,
86 % of total loans denominated in or indexed to a
foreign currency were not hedged against
currency-induced credit risk. Alongside the CNB
recommendations to credit institutions discussed
above and aimed at mitigating credit risk on
consumer loans, the CNB enabled easier access to
HRK funding of banks by amending the regulatory
framework for monetary policy operations, as the
high demand for HRK-denominated loans is
putting pressure on the banking sector, due to an
increasing problem of maturity mismatch. Indeed,
banks may find it challenging to provide fixed-
rate, long-term lending in HRK, given the lack of
long-term HRK funding.
In 2017 the Parliament passed a number of
financial laws. In summer 2017, the parliament
introduced new legislation which annuls the
validity of certain existing loans taken with foreign
creditors. The CNB and the ECB were not
consulted on the draft law, the implementation of
which may prove problematic given the lack of
precise data on the loans concerned and the lack of
clarity on some of its key provisions. The most
affected bank has lodged a complaint with the
Constitutional Court. In October 2017, the
parliament adopted a law to transpose the
Mortgage Credit Directive, and the related by-laws
were enacted by the CNB subsequently.
The authorities have not yet communicated the
results and possible follow-up to the Asset
Quality Review of HBOR in 2017. The Croatian
National Bank oversaw the quality assurance and
ensured that the AQR methodology closely
followed the ECB methodology developed in
2014. One of the purposes of the AQR is to inform
the government decisions on possible changes in
the regulatory and governance structure of HBOR.
The latter is indeed a development and
promotional state-owned bank that presents a
number of specificities, like a high share of direct
lending (European Commission, 2017f).

31
Labour market developments
The unemployment rate in Croatia has been
falling considerably over the past year, but
labour utilisation remains low. The
unemployment rate decreased from 13.4 % in 2016
to 11.1 %in 2017. The drop resulted from the
combined effect of increases in the employment
rate and in the activity rate. However, at 65.6 % in
Q3 2017, the employment rate was still one of the
lowest in the EU; the activity rate was 71.7 %
(Graph 4.3.1), compared to the EU average of
78.2 %. Between Q3 2016 and Q3 2017, the rate of
long-term unemployment (LTU) declined to 3.9 %
of the labour force (-1.5 pps), moving closer to the
EU average of 3.3 % (23). Overall, the chronically
low labour utilisation in the Croatian economy
continues to weigh on potential growth and on the
country's adjustment capacity. There are also large
territorial disparities in labour market outcomes.
Based on 2016 registered unemployment data by
county (Croatian Bureau of Statistics), the highest
unemployment rate was almost four times the
lowest rate. Most counties with the highest
unemployment rates were located in the Eastern
and Central part of the country.
Low participation and low employment are
widespread across age groups and genders, and
vulnerable groups are particularly affected. The
activity and employment rate of both men and
women are well below EU average. Men recorded
the second lowest employment rate in the EU,
while the employment rate of women is 10 pp
lower than for men (56.6 % and 66.2 %
respectively). Discouragement, skills gaps, care
responsibilities as well as multiple pathways to
early exits represent important barriers to
(23) Croatia has undertaken steps to implement the Council
Recommendation on the integration of long-term
unemployed into the labour market. However, challenges
still remain, including the establishment of the Single Point
of Contact (SPOC) for the beneficiaries.
employment (European Commission, 2017f). The
rate of young people not in employment, education
or training (NEET) (16.9 % in 2016) and the youth
unemployment rate (26.4 % in 2017) both remain
high. The employment rate of older workers in
2016 was the second lowest in the EU (38.1 %).
Besides the numerous pathways to early exit from
the labour market, this could also reflect
insufficient focus on training for this age group. In
2016 at 37.9 %, the employment rate of low skilled
workers was well below the EU average (53.6 %)
and much lower than for medium and high skilled
workers (see Graph 4.3.2). Finally, the activity gap
between people with and without disabilities in
2015 was 28.9 pp above the EU average.
Graph 4.3.1: Activity, unemployment, long-term
unemployment, youth unemployment, NEET
and employment rates
* Based on Q1-Q3, except for unemployment.
(1) NEET: Not in employment, education or training.
(2) Activity, employment and NEET rates: % of population.
(3) Unemployment, youth unemployment and long-term
unemployment rates: % of labour force.
Source: Eurostat, Labour Force Survey (LFS).
4.3. LABOUR MARKET, SOCIAL POLICIES AND EDUCATION*

4.3. Labour market, social policies and education*
32
Box 4.3.1: Monitoring performance in light of the European Pillar of Social Rights
The European Pillar of Social Rights, proclaimed on 17 November 2017 by the European Parliament, the
Council and the European Commission, sets out 20 key principles and rights to benefit citizens in the EU. In
light of the legacy of the crisis and changes in our societies driven by population ageing, technological
change and new ways of working, the Pillar serves as a compass for a renewed process of convergence
towards better working and living conditions.
Croatia faces challenges with regard to a number of indicators of the Social Scoreboard24
supporting the
European Pillar of Social Rights. This is notably the case for equal opportunities and access to the labour
market and fair working conditions. Unemployment rate is decreasing. However, Croatia still faces a high
rate of young people not in employment, education or training (NEETs), and low employment rates while
only few of the jobseekers participate in active
labour market policy measures. Croatia has high
shares of people at-risk-of poverty or social
exclusion. Nonetheless, the share of early school
leavers is relatively low.
Low participation in the labour market applies
in particular to older workers. Among 55-64
years olds the employment rate stands at 38.1 %.
Croatia has in recent years not been successful in
addressing this issue, and this is raising concerns
for the adequacy of the pension system in a
context of demographic change.
The establishment of a network of
Lifelong Career Guidance (LLCG)
Centres across Croatia is a step forward
in the integration of employment
programmes. The Centres provide
individual and tailored career guidance
support to all Croatian citizens. One of their
main aims is to create targeted measures for
the identification and activation of youth
NEETs. The Centres use a partnership-
based model and work with relevant
stakeholders at local and county levels. So
far there are 13 Centres and the plan is to
reach at least 22 by 2020. In addition, the Croatian Public Employment Service and the Ministry
of Science, Education and Sports as well as the Ministry of Labour and Pension System have
signed agreements on the establishment of data exchange systems between them. This will allow
tracking the youth NEETs and exchanging changing data on the career intentions of students in
their final year of study.
24 The Social Scoreboard includes 14 headline indicators, of which 12 are currently used to compare Member States performance.
The indicators "participants in active labour market policies per 100 persons wanting to work" and "compensation of employees
per hour worked (in EUR)" are not used due to technical concerns by Member States. Possible alternatives will be discussed in
the relevant Committees. GDHI: gross disposable household income.
Early leavers from education
and training (% of population
aged 18-24)
Best performers
Gender employment gap On average
Income quintile ratio (S80/S20) On average
At risk of poverty or social
exclusion (in %)To watch
Youth NEET (% of total
population aged 15-24)Critical situation
Employment rate (%
population aged 20-64)Critical situation
Unemployment rate (%
population aged 15-74)Weak but improving
GDHI per capita growth N/A
Impact of social transfers
(other than pensions) on
poverty reduction
To watch
Children aged less than 3 years
in formal childcareTo watch
Self-reported unmet need for
medical care On average
Individuals' level of digital skills Critical situation
Members States' are classified according to a statistical methodology agreed with the
EMCO and SPC Committees. The methodology looks jointly at levels and changes of the
indicators in comparison with the respective EU averages, and classifies Member States
in seven categories (from "best performers" to "critical situations"). For instance, a
country can be flagged as "better than average" if the level of the indicator is close to EU
average, but it is improving fast. For methodological details, please consult the draft
Joint Employment Report 2018, COM (2017) 674 final.
NEET: neither in employment nor in education or training; GDHI: gross disposable
household income.
Equal
opportunities
and access to
the labour
market
Dynamic
labour markets
and fair
working
conditions
Social
protection and
inclusion
CROATIA

4.3. Labour market, social policies and education*
33
Active labour market measures are
insufficiently targeted at vulnerable groups. In
2016 the participation of unemployed persons in
active labour market measures (ALMPs) was very
low, at 7 %. In early 2017, new ALMPs were
announced, but from a preliminary evaluation, they
do not seem to address the difficulties in entering
the labour market for the long term unemployed
and the low-skilled (25). At the same time, the
Croatian Youth Guarantee scheme is showing
some promising results: it reached more than half
(54 %) of NEETs aged 15-24 in 2016 (EU average
42.5 %), and 18 months after leaving the scheme,
68.3 % of participants were in employment.
Regarding passive measures, the duration of
unemployment benefits (relative to the qualifying
contribution period) is short in Croatia, and the
coverage (less than 15 % of the eligible
population) remains low (European Commission,
2017a).
As of 2017, there has been a decrease in the
number of new hires on temporary contracts
and a sharp increase in new permanent
contracts. The pick-up in economic activity and
the improving conditions on the labour market
favoured an increase in permanent contracts
(Graph 4.3.3). In Q3 2017 however, temporary
employees as a percentage of total employment
still stood at 22.5 %, against an EU average of
14.8 %. As far as self-employed workers are
concerned, in 2016 their share in total employment
decreased to 12 %, of which the largest group were
farmers (30%).
(25) From January to September 2017, the majority of
participants of ALMP measures were in "Traineeship for
work without employment" (32.5 %) or public works
(30.4 %). The first measure tends to favour young
beneficiaries with a higher education level who are more
likely to find a job without any intervention (the so called
"creaming" effect), whereas the impact of public works on
employability of, primarily, older workers was evaluated as
small or even negative (Bejaković, and al., 2016). Only
1.3 % of all ALMP participants took part in educational
programmes offering the possibility to acquire additional
skills needed to enter the labour market.
Graph 4.3.2: Employment rate by educational attainment
Source: Eurostat.
After years of wage moderation, wages have
started growing again. Both nominal and real
(GDP deflated) wage growth was negative in 2013
and 2014, followed by a slight increase in 2015. In
2016, nominal wages decreased marginally, while
real wages stabilised as inflation was negative.
Between 2014 and 2016, Croatia was amongst the
EU countries with the highest gap between
productivity and real wage growth, which
supported cost-competitiveness gains (European
Commission, 2017j). In 2017, the negotiated
increase in public wages, combined with the
improving economic conditions and the further
tightening of the labour market are putting some
upward pressure on wages. Nominal wages started
growing again, at a projected rate of 2.5 % for the
year as a whole, and are expected to continue
growing at the same rate in 2018 and 2019. As
inflation has turned positive, real wages are
projected to have increased by 1.3 % in 2017 and
to continue growing at a moderate rate of 0.4 %
over the forecast horizon, remaining below
productivity growth.
The authorities have adopted changes to the
minimum wage. At the end of 2017, the gross
minimum wage was raised by 5 % to EUR 456,
which corresponds to the 42.9 % of the gross
average wage in Croatia. In order to minimise the
impact on labour costs, the base on which the
employer contribution is calculated was cut by
50 % for those workers that have been employed
for a period of more than 12 months on the
30
40
50
60
70
80
90
08 09 10 11 12 13 14 15 16
% of population,
20-64
High skilled Medium skilled Low skilled

4.3. Labour market, social policies and education*
34
minimum-wage, which risks creating an important
low wage trap. In 2016, the coverage of the
minimum wage was relatively low (6.6 % of the
employed) and its incidence most pronounced in
the poorest counties of Croatia and in a few
sectors.
Graph 4.3.3: Employment change year-on-year
Employment (thousand), total, ages 20-64, year-on-year
change based on non-seasonally adjusted data.
Source: Eurostat, Labour Force Survey (LFS).
The adoption of the announced legislation to
harmonise wage setting for civil servants across
the public administration has been further
postponed. Initially planned to cover wage setting
in the public sector as a whole, the new legislation
will be enacted in two steps, first covering civil
servants only, and at a second stage, public sector
workers. Greater harmonisation of wage setting
across the public administration would be achieved
through the introduction of common wage grids
and job complexity coefficients, based on more
consistent job descriptions and skills frameworks.
According to the authorities, the new legislation
would also cover areas of the employment
relationship of civil and public servants that are
currently negotiated through collective bargaining.
In the meantime however, the basic collective
agreement regulating the rights of civil and public
servants was renegotiated in December 2017, with
validity until 2021. The collective agreements for
six sectors expired in 2017 and are still due to be
renegotiated. As far as state-owned enterprises
(SOEs) are concerned, no further steps have been
taken in setting up a coordinated system for
collective bargaining.
Social Dialogue is not yet a well-developed
practice in Croatia. Formally, Croatia has an
established social dialogue structure in the form of
a National Economic and Social Council. Social
partners are invited to provide written
contributions before the adoption of National
Reform Programmes and other relevant legislative
initiatives. However, the interaction between the
authorities and the stakeholders is over all limited,
and mostly confined to the provision of written
feedback on some of the government proposed
measures. Another inhibiting factor is that
fragmentation seems to be central to limiting the
overall capacity of trade unions to engage in social
dialogue.
Social protection system
The rate of at-risk-of poverty and social
exclusion declined in 2016, but remains high. In
2016, a large share of the population – 27.9% –
was at risk of poverty or social exclusion
(AROPE), compared to 23.5 % in EU (Graph
4.3.4). The share of people persistently facing a
high at-risk-of-poverty rate (AROP) (26) was
14.5 %, whereas the percentage of the population
living in overcrowded households (27) was more
than double that of the EU average. Regional
disparities are high and persistent, with at risk of
poverty rates reaching over 40 % in many eastern
and central municipalities and in rural areas
(Croatian Bureau of Statistics). Particularly
affected are the elderly and the disabled (28).
Moreover, 73.2 % of children of low skilled
parents were at risk of poverty in 2016, against just
the 2.9 % of children of high-skilled parents. This
is the reflection of the very low employment rates
among the low skilled. Parental education levels
and poverty have strong impacts on children's
chances to do well in school, to have access to
(26) The indicator is defined as the share of persons with an
equalised disposable income below the risk-of-poverty
threshold in the current year and in at least two of the
preceding three years.
(27) A person is considered as living in an overcrowded
household if the household does not have at its disposal a
minimum of rooms equal to one room for each of the
following categories: the household; by couple in the
household; for each single person aged 18 and more; by
pair of single people of the same sex between 12 and 17
years of age; for each single person between 12 and 17
years of age and not included in the previous category; by
pair of children under 12 years of age.
(28) The risk of poverty or social exclusion for disabled persons
is high (40.0 %), especially for the elderly disabled (65+).
-150
-100
-50
0
50
100
150
200
250
07Q
1
08Q
1
09Q
1
10Q
1
11Q
1
12Q
1
13Q
1
14Q
1
15Q
1
16Q
1
17Q
1
y-o-y change in thousands
Permanent employees Temporary employees
Self employment Overall

4.3. Labour market, social policies and education*
35
quality health care and to reach their full potentials
later in life.
Graph 4.3.4: At-risk-of-poverty or social exclusion rate and
two of its components (SMD, LWI)
(1) AROPE: At-risk-of-poverty or social exclusion rate (% of
total population). People who are at-risk-of poverty (AROP)
and/or suffering from severe material deprivation (SMD)
and/or living in household with zero or very low work intensity
(LWI).
(2) SMD: Severe material deprivation rate (% of total
population). People who experience at least 4 out of 9
deprivations: people cannot afford to i) pay their rent or
utility bills, ii) keep their home adequately warm, iii) face
unexpected expenses, iv) eat meat, fish, or a protein
equivalent every second day, v) enjoy a week of holiday
away from home once a year, vi) have a car, vii) have a
washing machine, viii) have a colour TV, or ix) have a
telephone.
(3) LWI: People living in very low work intensity households
(% of population 0-59). People living in households where the
adults work less than 20% of their total work-time potential
during the previous 12 months.
(4) AROP: based on previous year income data, SMD:
current year, LWI: status over previous 12 months.
Source: Eurostat, European Union Statistics on Income and
Living Conditions (EU-SILC).
The income support schemes on average seem
inadequate to reduce poverty. The level of the
minimum income offered by the Guaranteed
Minimum Benefit (GMB) is inadequate, in
particular for jobless households (European
Commission, 2017a). Family benefits, and in
particular child allowances do not cover
adequately the poorest counties and their poverty
reduction capacity is limited (29). A number of
steps have been taken recently to strengthen
income support and support for households with
(29) The project "Evaluation of the efficiency of social help",
was implemented in 2017 by the Croatian authorities and
the World Bank.
children. Since February 2017, GMB recipients are
allowed to take part in paid public works without
losing entitlement to the benefit, thus combining
the income support with incentives to (re)integrate
in the labour market. In July 2017, parental and
child benefits (30) were increased as a measure in
support of demographic renewal (see Section 4.1).
With a similar policy objective, in July 2017 the
authorities also introduced a non-refundable
subsidy that, under certain conditions, covers half
of the monthly instalments of the first four years of
new loans to purchase the first home (see Section
4.2).However, the success of this measure in
hampering migration outflows of working age
individuals would come with the downside of also
hindering labour mobility within the highly
fragmented national labour market.
Territorial disparities in the provision of social
benefits result in increased inequality. The
provision of social benefits in Croatia is shared
between the central and sub-national government
units. Following the decentralization of public
functions initiated in 2001, regional and local sub-
national units assumed the responsibility to
provide and administer some social benefits (such
as housing benefits, the lump-sum grant for new-
born children and childcare services). However,
due to the lower fiscal capacity of poorer local
units to finance such benefits, this system results in
an unequal treatment of citizens and exacerbates
existing inequalities across the territory and
weakens the social inclusion impact of the social
safety net (31) (see Section 4.5).
The large variation in fiscal capacities of
counties also affects the provision and use of
child care services. High quality formal Early
Childhood Education and Care (ECEC) plays an
important role in children's development and
supports participation in the labour market,
especially of women. In 2015, only 11.8 % of
children up to 3 years of age and 73.8 % of pupils
(30) Under the law, the maximum allowance for the second half
of the year-long maternity leave for employed parents will
rise from HRK 2 660 to HRK 3 991 (appx. EUR 532). For
unemployed parents who do not meet the criterion of 12 or
18 months of service, the parental allowance will increase
from HRK 1 663 to 2 328 (appx. EUR 310).
(31) More than half of local-government social programmes are
cash benefits. The city of Zagreb and the counties of
Dubrovnik and Istria record the largest spending per capita,
whereas in Virovitica-Podravina County spending is almost
6 times lower.
0
5
10
15
20
25
30
35
10 11 12 13 14 15 16
pps
AROPE EU28 AROPE HR SMD EU 28
SMD HR LWI EU28 LWI HR

4.3. Labour market, social policies and education*
36
aged between 4 and 6 were enrolled in ECEC.
Local government units cover the large majority of
ECEC expenses (Dobrotić and Matković, 2017)
according to the current financing model, thus
creating a strong link between ECEC access and
counties' income (32). As a result, and with the
exception of counties with major city centres, the
coverage of ECEC increases in line with GDP per
capita in each county (Graph 4.3.5). The
authorities announced plans to increase the
participation in ECEC to 95 % by 2020. This will
be difficult in the absence of a major reform of the
ECEC financing system and possibly of the
distribution of competences between central and
sub-national government levels.
Graph 4.3.5: Early childhood education and care
ECEC: Early Childhood Education and Care.
Source: Centre for Peace Studies (2016) and Croatian
Bureau of Statistics.
The consolidation of the benefits system with
the aim to improve targeting and reduce
poverty has not advanced. The authorities
abandoned the establishment of the one-stop-shops
as a central point for the administration and
provision of social benefits and services, which
used to be a flagship measure in successive past
NRPs. The previously announced harmonisation of
eligibility criteria and plans to consolidate more
benefits under the GMB have also been suspended.
The focus has instead shifted to improving the
information system on benefits allocated
(32) In the city of Zagreb 91 % of children aged 3-5 attended
some form of ECEC in 2014, whereas only 22 % of
children did so in the Brod-Posavina county (Centar za
Mirovne Studije, 2016).
throughout the territory. To this purpose, the
authorities plan to harmonize the definitions of the
benefits granted at local government level on the
basis of the ESSPROS (European System of
integrated Social Protection Statistics)
nomenclature, and establish regular reporting
channels from the local to the central government
level.
The Croatian pension system continues to face
medium and long term challenges. In 2017, the
ratio of contributing workers to pension
beneficiaries was at 1.2, reflecting unfavourable
demographic trends, but also the existence of
numerous pathways to early retirement and a still
low statutory retirement age, especially for
women. In 2016, only 38.1 % of people aged 55-
64 were employed and only 14.8 % of all
pensioners had 40 or more qualifying years. The
average duration of working life is one of the
lowest in EU (32.1 years in 2016). In 2016, the
aggregate replacement ratio of pensions (0.39) was
significantly lower than the EU average, resulting
in a higher at risk of poverty rate for people aged
65+ (26.5 % vs 14.6 % EU in 2016). The 2018
Aging Report (forthcoming) projects that by 2070
the public pension expenditure as percentage of
GDP will further fall by 3.8pp. Ensuring pension
adequacy in the future will require increased
pension contributions and/or longer working lives.
Existing discrepancies in the pension system
pose also short term challenges. Successive
interventions in the pension system – starting from
the 1999 reform and including the establishment of
a supplementary pillar in 2002 and the
introduction, in 2007, of a pension supplement for
those insured under the first pillar only – have left
the cohort of people born between 1962 and 1984
with prospective pensions that could be up to 30 %
lower than those for the older cohort. This is
because of their short contribution history into the
second pillar. Inflows into retirement from this
cohort have just started and are expected to
intensify in 2019. People with shorter working
lives, and in particular women, will be most
penalised. The authorities are exploring different
options to tackle the situation.
The announced changes to the pension system,
aimed at encouraging longer working lives,
have not been implemented. Reform measures
planned for December 2017 have been further
0
10
20
30
40
50
60
70
80
90
100
0
2,000
4,000
6,000
8,000
10,000
12,000
14,000
16,000
18,000
20,000
Bro
d-P
osavin
aV
ukovar-
Srije
mV
iro
vitic
a-P
odra
vin
aPožega-Slavonia
Bje
lovar-
Bilo
gora
Kra
pin
a-Z
agorje
Lik
a-S
enj
Osije
k-B
ara
nja
Koprivnica-Križevci
Sis
ak-M
osla
vin
aVaraždin
Ka
rlo
vac
Međimurje
Zadar
Zagre
b C
ounty
Šibenik-Knin
Sp
lit-D
alm
atia
Prim
orje
-Gors
ki K
ota
rD
ubro
vnik
-Ne
retv
aIs
tria
City o
f Z
agre
b
ppsGDP per head
ECEC access 3-5 year-olds (rhs) GDP/capita (lhs)
4.3. Labour market, social policies and education*
37
postponed to mid-2018. These include the
streamlining of the 100+ arduous or hazardous
professions benefitting from more generous
pension provisions, measures aimed at reducing
access to early retirement, the increase of the
statutory retirement age and the acceleration in the
equalisation of retirement age for women and men.
In the meantime, improvements have been
introduced in the methodology applied for the
medical assessment of disability pensions. The
authorities have proposed to further extend the
benefits granted to war veterans and their family
members (33),resulting in further increases of their
pension ceilings (34). Little progress has been made
to support war veterans' re-integration into the
labour market.
Education and skills
The low performance of Croatia's education
system underlines the urgency of reform. The
performance of the education system – measured
in the context of the EU Education and Training
2020 process stagnates or has worsened in most of
the relevant areas. These include performance in
the 2015 OECD Programme for International
Student Assessment (PISA) survey of 15 year-
olds, tertiary education attainment, adult education,
education investment and learning mobility
(European Commission, 2017h). At the same time
Croatia exhibits the lowest rate of early leaving
from education and training in the EU (2.8 % vs
10.7 % EU average in 2016). The gap for early
school leavers between pupils with and without
disabilities however is one of the largest in the EU
(14.5pps vs the EU average of 10.3pps in 2015).
The implementation of the education reforms
announced in the Strategy for Education,
Research and Technology faced delays. This
affected in particular one of the strategy's most
prominent priorities: the comprehensive curricular
reform aimed at improving the quality and
(33) The law adopted by government in November 2017
reopens the possibility to register as war veteran, reduces
their retirement age and extends the rights of family
members to inherit veterans' pensions. The law also
introduces a number of additional social benefits for
veterans and mandatory financing of veterans' associations
(in the range of 0.3-1.0 % of local government budgets).
(34) General pensions for war veterans tend to be more than
twice as high compared to the general scheme (Statistical
Information of the Croatian Pension Insurance Institute,
September 2017).
relevance of education. After a delay of almost a
year, in autumn 2017 work began on the revision
of the reform's draft documentation on the basis of
a public consultation. The documentation is
expected to undergo external reviews by spring
2018, with pilot implementation due to start in
September 2018 in 3-5 % of schools. The
introduction of obligatory subject Computer
Science in the 5th and 6th grades of primary school
is also planned for 2018. Currently, 10 % of
Croatian schools are taking part in the ESI Funds-
supported e-Schools project designed to prepare
strategic documents, plans and policies to
systematically integrate ICT into activities of all of
primary and secondary schools by 2022.
Growth in tertiary graduates has slowed, while
their employment rates have not yet returned to
pre-crisis levels. Tertiary educational attainment
in Croatia had been on an upward trend for the last
decade but started declining in 2014. The
proportion of 30- to 34-year-olds with tertiary
education in 2016 was 29.5 % (35), significantly
below the EU average of 39.1 % and Croatia’s
national 2020 target of 35 %. In 2008, 86.3 % of
people who had completed tertiary education
within the previous 1-3 years was in employment,
while in 2016 this share was down to 74.7 % (EU
average of 82.8 %), despite the recent pick-up in
economic activity. The unemployment rate of
tertiary graduates was at 7.8 % in 2016, the fourth
highest in the EU.
Croatia lacks mechanisms to address the skills
mismatch of tertiary education graduates. A
2017 employers' survey on how the tertiary
education meets the needs of a competitive
economy ranked Croatia 112th out of 137 global
economies and among the lowest in the EU (World
Economic Forum, 2017). Despite the annual
recommendations from the Croatian Employment
Service (CES) to reduce enrolment rates in
business administration and law, there was no
change between 2012 and 2016. Almost one in
three Croatian students graduated in business and
law, among the highest in the EU (31.4 % vs
24.3 %). The recent introduction of an ESF-
supported 'science, technology, engineering and
math' scholarship scheme aims to increase the
pupils' interest in these subjects. Despite the
(35) The same rate for people with disabilities is the lowest in
the EU (15.6% vs. 29.4% in 2015).

4.3. Labour market, social policies and education*
38
analysis of CES on skills needed in the labour
market, Croatia does not have a mechanism to
match tertiary education admissions quotas with
skills needs.
The implementation of the Croatian
Qualifications Framework (CROQF) has
begun. In order to improve the labour market
relevance of education, the CROQF established 25
sectoral councils, consisting of educators,
employers, stakeholders and representatives from
the public administration. They were tasked to
review and update the country's qualifications
system. After delays in 2015 and 2016, the sectoral
councils have now started updating over 300
qualification and occupation standards.
Secondary vocational education would benefit
from further alignment with labour market
needs. While Croatia has the highest percentage of
secondary school students enrolled in vocational
education and training (VET) programmes in the
EU (71 %), their prospects of successful transition
to the labour market remain limited. More than
half of registered unemployed (average over the
period 2010-2015) hold a secondary vocational
education diploma. To increase the labour market
relevance of VET, the authorities announced the
adoption of the National Curriculum for
Vocational Education, which is currently under
review. This will be complemented by plans to
develop sectorial curricula, establish an effective
network of vocational schools and programmes
and a quality assurance system, establish regional
centres of competence and promote international
mobility of teachers and students.
Employers play a marginal role in the provision
of vocational education. VET is more and more
carried out in school classrooms and outside of
firms – which minimised the role of employers in
vocational education. Even though both schools
and employers see the benefits of implementing
work-based learning strategies, a recent study
showed that they would require additional support
from public authorities (South East European
Centre for Entrepreneurial Learning, 2017). A
central role is due to be played by the Croatian
Employment Service, which was tasked to analyse
and forecast labour market skills needs in
cooperation with the employers. Such analysis
should inform the recommendations for the
enrolment policy of various VET courses in
secondary schools. However, so far the impact of
skills anticipation activities on educational policy
has been negligible (European Centre for the
Development of Vocational Training and
European Commission, 2017).
Croatia lags behind in upskilling and reskilling
the working age population. Based on the
European Working Conditions Survey, three out of
four workers in 2015 had not attended any training
over the previous year. EUROSTAT indicators
show that in 2016 only 3 % (vs the EU average
10.8%) of Croatian adults (25-64) reported having
participated in adult learning, with no difference
between unemployed and employed persons and
with slightly higher rates for more educated people
(ISCED 5-8). Most of the participants are young
adults, while older people (55-64) de facto do not
participate. To improve the employability of adults
with low skills, Croatia is working on improving
the assessment of current and missing skills, the
supply of adequate learning offers and the
validation of acquired new skills (36).
Systemic inefficiencies in the adult education
system affect its labour market relevance.
Croatia lacks systematic professional development
programmes for adult educators, and non-formal
and informal learning programmes are not properly
assessed nor recognized. There are around 10 600
programmes, offered by 600 adult education
institutions, many of which established without
adhering to high quality criteria (Brčić Kuljiš and
Koludrović, 2016). Furthermore, the lack of
financial support to participants (37) is among the
reasons behind the low participation rates in adult
education. The regional distribution of institutions
offering formal adult education is highly uneven
(35 % are in Zagreb and in Splitsko-Dalmatinska
County) leading to an increased inequality of
access to learning. The adoption of the new Adult
Education Act, the harmonization of procedures
for adult education programmes with the CROQF
and regular reporting on participation rates, may
help addressing the current weaknesses.
(36) In line with the Council Recommendation on Upskilling
Pathways from 19 December 2016.
(37) According to the Agency for Vocational Education and
Training and Adult Education, the majority of participants
(61%) need to pay the participation fee themselves,
employers finance fees for 18 % of participants, the
Croatian Employment Service supports 9 % and a small
portion is financed from other sources.

39
Trade performance
The competitiveness of the Croatian economy as
gauged by its export performance is improving,
but remains below peers. The 25 % share of
exports of goods in GDP is only half the average
share in Central and Eastern European economies
(CEE10). Still, it is a substantial improvement
compared to the 15 % of GDP in 2000.
Graph 4.4.1: Exports of goods (volumes) in Croatia, EU15
and CEE10, index (2013=100)
Source: Eurostat.
Weak export performance during the crisis can
largely be linked to competitiveness losses and
demand factors. Exports of goods grew strongly
in the early 2000s (Graph 4.4.1), but as domestic
demand boomed, the tightening labour market
combined with a mild currency appreciation
eroded international competitiveness. The real
effective exchange rate (deflated by unit labour
costs) continued to appreciate up until the end of
2009, leading to significant losses in export market
shares. In addition, the slow growth in two of
Croatia's major trading partners, Slovenia and
Italy, weighed on the demand for Croatian goods,
while the restructuring of the shipbuilding industry
(started in 2013) further depressed exports.
Consequently, total exports of goods decreased by
3 % in 2010-2012.
Following EU accession, exports rebounded
strongly. Between the third quarter of 2013 and
the third quarter of 2017, exports of goods
expanded at an average rate of 9 % year-on-year.
Such strong growth is linked to a turnaround in
global demand, as well as policies geared to
restore external competitiveness through wage
restraint – including labour market reforms (2013-
2014). Most notably, however, EU accession has
opened up opportunities for Croatian firms, which
continue making inroads into EU value chains and
gaining market shares. Exports of services –
mainly tourism – have also been growing strongly,
as Croatia attracts more and more tourists from
abroad and global demand for tourism grows in
line with the recovery in disposable incomes.
Graph 4.4.2: Goods' export growth (values) between 2013
and 2016 by markets and product type
(1) New products are products not exported in in 2013
(2) Marginally exported products were exported in the value
<50 000 EUR in 2013.
Source: Eurostat.
The structure of Croatia's goods exports is
changing in terms of both markets and
products. Following EU accession, merchandise
exports grew particularly strongly towards the
CEE10, while exports to countries in the Central
European Free Trade Agreement (CEFTA) grew at
a much slower pace. This suggests a weakening of
historical trade ties with the ex-Yugoslavian
economies and convergence to the export patterns
of CEE10 economies, which are more geared
towards the EU. Greater product differentiation
underpinned the export growth in 2013-2016, as a
number of Croatian products found their export
markets for the first time. While the share of
higher complexity exports (38) has increased in
(38) As measured by the Observatory of economic Complexity,
an analytical tool developed by Simoes and Hidalgo
(2011).
0
20
40
60
80
100
120
140
160
00 01 02 03 04 05 06 07 08 09 10 11 12 13 14 15 16 17
HR EU15 CEE10
HR EUaccession2013=100
0
10
20
30
40
50
60
EU15 EU10 CEFTA OTHER
pps
Old products New products Marginally exported products
4.4. COMPETITIVENESS AND INVESTMENT*

4.4. Competitiveness and investment*
40
recent years, the aggregate complexity of Croatian
exports (0.75) remains below the (simple) average
of the CEE10 countries (0.93). Nevertheless,
Croatia features areas of excellence in exports,
especially in the pharmaceutical industry. Finally,
the decoupling of exports from industrial
production points to a strengthening of the import
content of exports, in line with the increasing
integration of Croatian companies into EU value
chains.
Exports of goods have the potential to sustain
Croatia's long-run growth prospects The
positive trends in recent years suggest that Croatia
could pursue a model of export-led growth to spur
its economic convergence, much like its CEE10
peers (39). Furthermore, a move towards higher
complexity exports, as suggested by the existing
areas of excellence, is more a question of
competitiveness and allocation of resources than
developing essential capabilities. In this sense,
well-functioning product and capital markets
which boost productivity and promote the
reallocation of resources towards faster growing
sectors are crucial. In the longer run, a stronger
R&D&I system can boost competitiveness,
particularly in emerging industries and industries
where Croatia already enjoys a comparative
advantage. Similarly, unlocking Croatia's labour
supply potential and providing the workforce with
the skills needed in innovative sectors could also
help relax capacity constraints.
Business environment
Croatia is lagging behind in the pace of reform
of the business environment. Croatia ranks last
among peers in both performance and progress
regarding the quality of its business environment.
(39) Extensive literature has stressed the link between trade and
growth. The proponents of the export-led growth
hypothesis argue that exports are a key engine of growth,
through the positive externalities that participation in world
markets generates, namely: an improved allocation of
resources; greater capacity utilisation through the use of
economies of scale; the diffusion of technological progress
and promotion of TFP; and labour training effects. Exports
can also boost investment by relaxing the foreign exchange
constraint on the import of foreign capital and intermediate
goods, by increasing the country’s external earnings.
The World Economic Forum's Global
Competitiveness Index shows Croatia stagnating
while its peers advance (see Graph 4.4.3). Croatia's
performance is comparatively low and
deteriorating in the areas of institutions,
innovation, goods and labour market efficiency.
This mirrors the European Commission's findings
on the fragmentation of the public administration
(see Section 4.5), as well as the excessive
regulation in product markets and some
professions and barriers to investment (see Box
4.4.2).
Graph 4.4.3: Global competitiveness index scores of
Croatia and peers
Scale is from 1 to 7.
Source: World Economic Forum.
Progress is gradually being made in addressing
burdensome regulation. The authorities continue
to screen existing legislation for administrative
burdens and subsequently amending legislation in
order to reduce it. Meanwhile, the new SME test
was finally adopted in April 2017. By setting out
the criteria for regulatory impact assessments
focused on SMEs, it has the potential to
significantly improve the business environment for
this class of firms. However, SMEs would need to
be consulted in a more targeted way during the
public consultation stage in order to really improve
impact assessment. Two parafiscal charges were
reduced and further reductions are in the pipeline,
potentially resulting in substantial reductions.
3.5
4.0
4.5
5.0
13-14 14-15 15-16 16-17 17-18
Croatia Czech R. Hungary
Poland Slovakia Slovenia

4.4. Competitiveness and investment*
41
Box 4.4.1: The role of Tourism in the Croatian economy
With its advantageous location and natural beauty, Croatia has been an important tourist destination
ever since the surge in international tourism. International tourists' expenditure in Croatia amounts to
almost 20% of GDP – by far the largest share compared to other European Union countries. Tourism has
consequently generally been considered as a key driver of Croatia's economy. Despite several improvements
in the diversification of the offer, Croatia mainly features a typical "sun and sea" tourism model, with stays
concentrated in coastal areas and over the summer months. The accommodation offer is skewed towards
relatively cheap structures (such as private holiday houses and camping grounds) and average tourist
expenditure is below that recorded in EU peers. Recent econometric analysis sheds more light on the
structural characteristics of the Croatian tourism sector and its contribution to GDP growth.
The international demand for Croatian tourism is more responsive to changes in income of source
countries compared to other destinations in the Mediterranean. Structural differences in tourism models
across countries are reflected in a different sensitivity of demand for tourism services to income and prices.
The international tourism demand for Croatia and three other Mediterranean destinations was estimated
using a comparable specification (Orsini and Ostojić, 2018) . Tourism demand was modelled as a function
of purchasing power in the EU, the relative price of tourism services and travel costs in each country. The
findings provide evidence that each percentage point increase in GDP in the EU drives the number of
arrivals up by 4.3 % in Croatia, 4.0 % in Greece, 3.8 % in Spain and 2.8 % in Italy. This makes Croatia the
most 'income elastic' destination in the Northern Mediterranean. The analysis confirms that tourism demand
can be extremely sensitive to prices. In this respect, Croatia features the lowest price elasticity among the
countries considered, but it is affected more than others by fluctuations in fuel prices. A 10 pps increase in
the relative price of fuel decreases arrivals, overnight stays and spending by roughly 3 %. Tourism revenue
in Croatia – more than other destinations – is found to be driven by the increasing number of tourists'
arrivals and overnights, while the average spending per night per tourist tends to stagnate or even decrease.
The analysis highlights that an excessive reliance on the current model of tourism may not be sustainable in
the long-term. The supply of new and well differentiated tourism services could mitigate the risks of
stagnation, maximise the impact on other sectors of the economy and reduce congestion and environmental
costs.
Tourism is not likely to be a key driver of long-term economic growth in Croatia, but it is also not
likely to have negative effects on other sectors. International economic literature has extensively delved
into testing whether there is a long-run positive causal relation between tourism and economic growth, or
whether tourism has negative effects by crowding out the development of other sectors (often referred to as
the Dutch disease). The empirical findings in (Orsini and Pletikosa, 2018) demonstrate that neither seems to
be particularly relevant for Croatia. The study was conducted using a model of a small open economy with
two exporting sectors – manufactured goods and tourism services, through four key variables – exports of
goods, tourism revenues, the real effective exchange rate and income of trading partners/potential tourists.
Results suggest that the demand for Croatian tourism is less income elastic than the demand for goods, but
more sensitive to changes in prices. The findings are consistent with the peculiarities of the Croatian tourism
sector, including a high leakage rate (high share of imported goods in tourist consumption) and a contained
impact on employment, as these factors insulate the rest of the economy from potential positive or negative
spill-over effects. From a policy perspective, there are evident limitations in over-reliance on tourism for
sustaining Croatia's process of economic convergence towards a more mature economy. Scaling up and
diversifying the tourism model is likely to improve the positive contribution of the sector to GDP growth,
but could also come at the cost of crowding out the more productive manufacturing sector.
Limited progress has been made in reforming
professional services in Croatia. Some limited
reform measures, such as the removal of fixed
prices in several sectors, have been implemented
over the last years. However, according to an
indicator developed by the European Commission,
the level of restrictiveness in Croatia remains
higher than the weighted EU average for six of the
seven analysed professions (architects, certified
civil engineers, tax advisers, lawyers, patent
agents, real estate agents, tourist guides).
Moreover, the 2017 accounting law announced
that compulsory licensing will be introduced for
accounting services by 2019. In addition, with
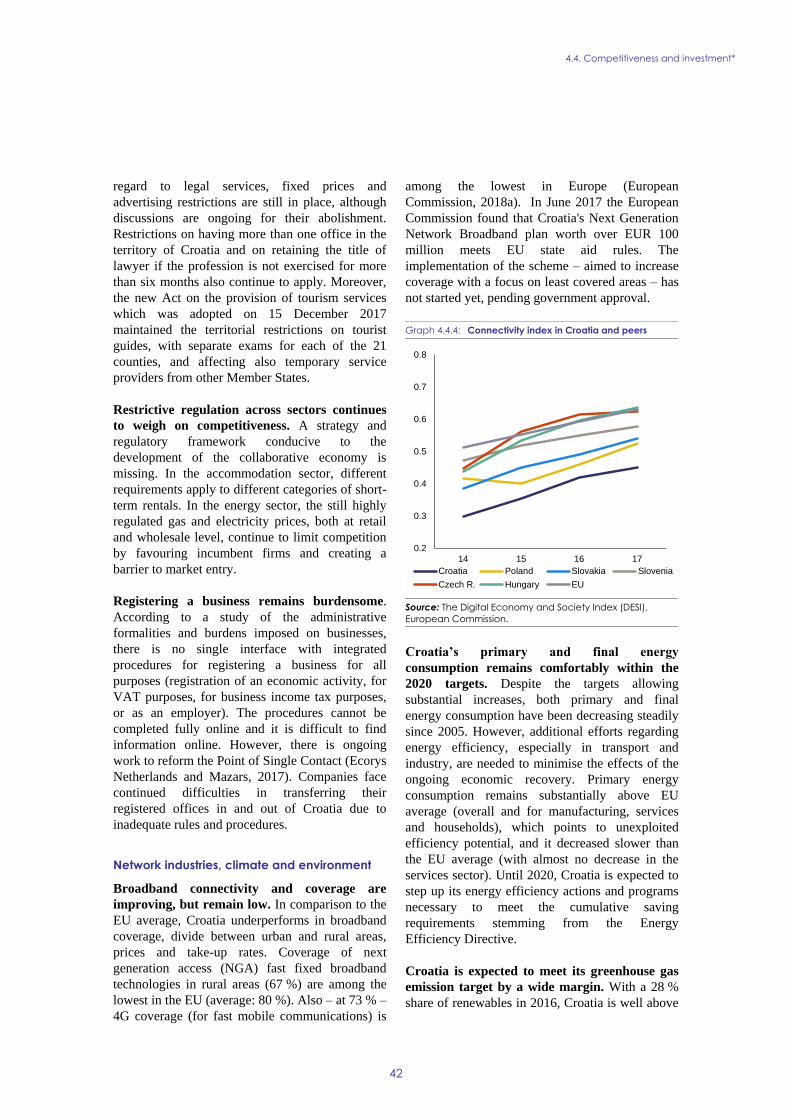
4.4. Competitiveness and investment*
42
regard to legal services, fixed prices and
advertising restrictions are still in place, although
discussions are ongoing for their abolishment.
Restrictions on having more than one office in the
territory of Croatia and on retaining the title of
lawyer if the profession is not exercised for more
than six months also continue to apply. Moreover,
the new Act on the provision of tourism services
which was adopted on 15 December 2017
maintained the territorial restrictions on tourist
guides, with separate exams for each of the 21
counties, and affecting also temporary service
providers from other Member States.
Restrictive regulation across sectors continues
to weigh on competitiveness. A strategy and
regulatory framework conducive to the
development of the collaborative economy is
missing. In the accommodation sector, different
requirements apply to different categories of short-
term rentals. In the energy sector, the still highly
regulated gas and electricity prices, both at retail
and wholesale level, continue to limit competition
by favouring incumbent firms and creating a
barrier to market entry.
Registering a business remains burdensome.
According to a study of the administrative
formalities and burdens imposed on businesses,
there is no single interface with integrated
procedures for registering a business for all
purposes (registration of an economic activity, for
VAT purposes, for business income tax purposes,
or as an employer). The procedures cannot be
completed fully online and it is difficult to find
information online. However, there is ongoing
work to reform the Point of Single Contact (Ecorys
Netherlands and Mazars, 2017). Companies face
continued difficulties in transferring their
registered offices in and out of Croatia due to
inadequate rules and procedures.
Network industries, climate and environment
Broadband connectivity and coverage are
improving, but remain low. In comparison to the
EU average, Croatia underperforms in broadband
coverage, divide between urban and rural areas,
prices and take-up rates. Coverage of next
generation access (NGA) fast fixed broadband
technologies in rural areas (67 %) are among the
lowest in the EU (average: 80 %). Also – at 73 % –
4G coverage (for fast mobile communications) is
among the lowest in Europe (European
Commission, 2018a). In June 2017 the European
Commission found that Croatia's Next Generation
Network Broadband plan worth over EUR 100
million meets EU state aid rules. The
implementation of the scheme – aimed to increase
coverage with a focus on least covered areas – has
not started yet, pending government approval.
Graph 4.4.4: Connectivity index in Croatia and peers
Source: The Digital Economy and Society Index (DESI),
European Commission.
Croatia’s primary and final energy
consumption remains comfortably within the
2020 targets. Despite the targets allowing
substantial increases, both primary and final
energy consumption have been decreasing steadily
since 2005. However, additional efforts regarding
energy efficiency, especially in transport and
industry, are needed to minimise the effects of the
ongoing economic recovery. Primary energy
consumption remains substantially above EU
average (overall and for manufacturing, services
and households), which points to unexploited
efficiency potential, and it decreased slower than
the EU average (with almost no decrease in the
services sector). Until 2020, Croatia is expected to
step up its energy efficiency actions and programs
necessary to meet the cumulative saving
requirements stemming from the Energy
Efficiency Directive.
Croatia is expected to meet its greenhouse gas
emission target by a wide margin. With a 28 %
share of renewables in 2016, Croatia is well above
0.2
0.3
0.4
0.5
0.6
0.7
0.8
14 15 16 17
Croatia Poland Slovakia Slovenia
Czech R. Hungary EU

4.4. Competitiveness and investment*
43
its 2015/2016 indicative overall interim target, as
well as its 2020 target of 20 %. However, with
1.3 % in 2016, Croatia is well below its target for
the share of renewable energy in transport. At the
same time, renewable energy accounted for 37.4 %
in heating and cooling and 46.7 % in electricity
generation. Electricity from renewable sources has
mainly been promoted through a premium tariff
and a guaranteed feed-in tariff for small
installations allocated through tenders. The
surcharge for financing renewable energy projects
has been increased to maintain the sustainability of
the support scheme, while the VAT rate on
electricity was lowered to compensate for this
increase. This could, however, lead to higher and
less-efficient consumption of electricity,
potentially extending the distance to targets.
The competitiveness of Croatia is increasing for
the solar PV sector and decreasing in wind.
Between 2005 and 2015, the revealed comparative
advantage indicator for solar increased to above 1,
meaning that the country increased its
specialisation, while the trend was opposite in the
wind sector, with the indicator having fallen below
1 In 2015, the relative trade balance (40) confirmed
the competitiveness of the country as a net
exporter of solar components, while it became a
net importer of wind technology components, due
to a strong trade deficit in wind turbine generating
sets and gearboxes.
The long-overdue Waste Management Plan and
Waste Prevention Programme were adopted in
January 2017. Both documents are in line with
the Commission circular economy package,
putting Croatia on a path to a more circular
economy. Subsequently, the Decision on
Implementation of the Action Plan and the
Ordinance on Municipal Waste were adopted in
May 2017. The adoption of these documents
constitutes fulfilment of the ex-ante conditionality
on waste, which opens up a total of EUR 475
million from the ESI Funds to be used for, inter
alia, separate waste collection and recycling
infrastructure projects.
(40) The RTB indicator for product "i" is defined as follows:
RTBi =Xi−Mi
Xi+Mi where Xi is the value of product's "i" exports
and Mi imports.
Research and development
Croatia's investment in R&D over the past
decade remained stable, with limited public
funding and slow progress in implementing ESI
Funds. Croatia's R&D intensity was 0.84 % of
GDP in 2015-2016. Business expenditure
contributed with 0.37 % of GDP in 2016, ranking
Croatia 24th in the EU. Meanwhile, public R&D
intensity increased to 0.46 % of GDP in 2016 after
years of stagnation. However, a growth at this rate
is not sufficient for Croatia to reach its national
Europe 2020 R&D intensity target of 1.4 % of
GDP. Such a large distance to the target reveals a
low focus on science and innovation in the policy
strategy of the country.
The efficiency of the Croatian R&I system lags
behind that of other EU Member States. As
illustrated in Box 4.1.1, Croatia's efficiency of
spending in R&I is in line with that of peers.
However, compared to the EU average, the
country's performance in quality scientific outputs
is very low (41). This is largely due to scarce public
investment in R&D but also to a fragmented
landscape of higher education institutions, a lack
of incentives for researchers' careers and a
significant neglect of the relevance of
internationalising Croatia's science and innovation
arena. ESI Funds funding is not matched by
adequate efforts from the national budget. Public
funding for research institutions is generally
distributed evenly, without much regard for the
assessment of performance. This puts a de facto
cap on increases in research quality.
Fragmentation on all levels hinders the
cooperation between research institutions and
the business sector. Major universities have
highly fragmented governance structures, which
reduces efficiency and cooperation. Researchers
lack incentives to produce high quality science, as
publications in journals, irrespective of their
quality, yield the same value for career promotion.
Integration of international researchers is difficult
due to rigid administrative rules. Cooperation with
businesses is not incentivised by the academic
system, which discourages commercialisation of
scientific research. Researcher mobility between
(41) Scientific publications within the top 10 % most cited
scientific publications worldwide as % of total scientific
publications of the country stood at 4.1 in 2014 (EU
average is 11.1).

4.4. Competitiveness and investment*
44
the private and public sectors is difficult and the
cross-sector cooperation is under-developed (42),
although the introduction of ESIF-based schemes
is improving the situation. Although innovative
sectors still represent a relatively small share of the
employed population (43), there are pockets of
excellence in niche sectors such as biotech and
ICT where companies cooperate much more
closely with research institutions. The policy
responsibility in support of science and innovation
appears fragmented (44) and the policy strategy is
scattered across a number of policy actions with
low critical mass, with no systematic evaluation of
impact of R&I policies in place.
Some targeted efforts to reform the national
science and innovation system are in the
making. The smart specialisation strategy (S3)
was adopted in 2016 and is being revised with a
focus on the country's innovation strengths.
Implementation is picking up pace with the
announcement of a limited set of calls to support
innovation, including one to establish Centres of
Competence to support the implementation.
Around EUR 665 million of ERDF funds have
been allocated (45).
Corruption
Corruption remains a prominent problem. The
2017 Special Eurobarometer on corruption
(European Commission, 2017e) shows that
tolerance to corruption in Croatia is increasing,
with only 45 % of the respondents finding
corruption unacceptable (EU average 70 %). At the
same time, corruption is seen as much as a
problem as in the previous 2013 survey. The share
of people who think that corruption has increased
or is at the same level as before is at 91 % (EU
average 79 %) and those who report having been
involved or having knowledge of bribery cases
have increased to 28 % (in comparison to 24 % in
(42) The share of public-private co-publications in total number
of publications dropped by 11% since 2007 and public
expenditure on R&D financed by businesses as % of GDP
is 0.034 vs. an EU average of 0.052.
(43) Croatia scores 22nd among EU Member States.
(44) Three ministries share the R&I policy portfolio: Ministry
of Education and Science, Ministry of Economy,
Entrepreneurship and Crafts and Ministry of Regional
development and European Funds. (45) ESF contributes additional EUR 24 million for social
innovation, aimed mainly at investing into human
resources in order to ensure sustainability and productivity
of the RDI system.
2013, EU average 12 %). At the same time, 95 %
of the respondents having experienced or
witnessed cases of corruption say that they did not
report it, either because it would be pointless,
difficult to prove, or for fear of retaliation.
The implementation record of anti-corruption
measures is mixed. While Croatia has improved
certain aspects of its anti-corruption policies and
structures since joining the EU, several key
elements still leave room for improvement. These
include effective verification mechanisms for
conflicts of interest and asset disclosure of public
officials; protection of whistle-blowers; specific
safeguards for the healthcare sector and effective
risk control in public procurement, especially by
contracting authorities with weaker control
mechanisms; code of conduct for members of
Parliament; inadequate technical and personnel
resources of the Commission for the Prevention of
Conflicts of Interest and not sufficiently proactive
approach in its preventive role. Delays in the
implementation of the Anti-Corruption Action
Plan (2015–2016) were acknowledged by the
national authorities in the Anti-Corruption Action
Plan 2017–2018 which carries over a number of
actions from the first (46). The Worldwide
Governance Indicators (World Bank, 2017b) show
a declining trend in Croatia’s ranking on the
control of corruption indicator while in the Global
Competitiveness Index corruption moves from the
5th to the 4th biggest obstacle for business (World
Economic Forum, 2017). Survey data (European
Commission 2017d) show a similar trend, with
58% of business representatives considering
corruption as a very serious or quite serious
problem, up by 7 percentage points compared to
2015, with the EU average at 37 %.
Public awareness of whistle-blowing reporting
channels and access to public information is
low. In a 2017 business survey, respondents from
Croatia were in penultimate place in terms of
awareness of existing reporting channels for
whistle-blowers (EY, 2017). Furthermore, 60 % of
respondents (European Commission 2017e)
declare not to know how to report corruption.
Amendments to the Law on the right to access to
information entered into force in August 2015,
increasing transparency and helping decrease
(46) Only 57 % of the first action plan was implemented on
time.
4.4. Competitiveness and investment*
45
corruption opportunities at the central level. At
regional level, research shows an increase in
budget transparency of local entities (Ott et al.,
2017). Despite this positive trend, the study
underscores that there are still many local units
that remain non-transparent. A new ordinance
concerning the obligation to publish procurement
plans and contract registers in a standardised
format on the e-procurement platform entered into
force on 1 January 2018.
Public procurement in the construction sector is
vulnerable to corruption. Survey data on
corruption (European Commission 2017d)
indicates an increasing share of respondents who
think that corruption in public procurement is very
or fairly widespread (from 62 % in 2015 to 73 %).
Unclear selection criteria are among the practices
most widely reported (from 48 % in 2015 to
68 %). A recent study on public procurement in the
construction sector shows that despite the sound
legal framework and existing control mechanisms,
the integrity of procurement in the sector is at risk
due to a large share of in-house contracting by
state-owned entities which are subject to weaker
control. While there is limited use of restrictive
procedures, competition for public contracts is
surprisingly weak for a sector under considerable
economic pressure. Around half of the total
contract value is won by companies partially or
fully owned by the state (Podumljak and Dávid-
Barrett, 2015).

4.4. Competitiveness and investment*
46
Box 4.4.2: Investment challenges and reforms in Croatia
Macroeconomic perspective
After taking a hard hit during the economic crisis, investment started slowly rebounding in 2015, recording a
solid annual growth of 5.3 % in 2016. The sharp decline in investment spending during the recession was
seen in both public and private sector, mainly driven by weak domestic demand, particularly in households,
debt overhang, particularly in corporations, and tightened financing conditions. A stronger pick-up was
anticipated in 2017, however, the ongoing operational and financial restructuring of the food-processing and
retail giant Agrokor seems to have impacted investment decisions, especially in the manufacturing sector.
Investment is expected to intensify in 2018 and 2019, driven by strong and increasing domestic demand,
abating deleveraging needs, improving financing conditions and expected pick-up in the implementation of
European Structural and Investment Funds.
Assessment of barriers to investment and ongoing reforms
As the macroeconomic and financing conditions continue to improve, a number of barriers stand in the way
of creating a business environment more conducive to investment, as confirmed by the European
Commission assessment (1). Some measures have been adopted, particularly in the area of business
environment, but most of the continually identified barriers to investment have yet to be fully addressed.
Main barriers to investment and priority actions underway
(1) The business environment remains burdened with parafiscal charges, frequent changes in regulation and
its interference in market mechanisms in some sectors. The inefficiencies of the judicial system weigh on
investors' perceived legal certainty. Weaknesses in the public administration hamper service delivery to
businesses, not least of which is the still cumbersome and lengthy business registration process. (2)
Companies are heavily reliant on traditional bank financing as capital markets remain underdeveloped and
alternative avenues of financing, such as risk and venture capital, remain largely underutilised (see Section
4.2). (3) The limited high speed broadband coverage, especially in rural areas, and the very low take-up of
ultrafast broadband limit the potential for investment in digital economy.
(1) See ‘Challenges to Member States’ Investment Environments’, SWD (2015) 400 final
Regulatory/ administrative burden CSR Taxation
Public administration CSR Access to finance
Public procurement /PPPs Cooperation btw academia, research and business
Judicial system CSR Financing of R&D&I
Insolvency framework CSR Business services / Regulated professions CSR
Competition and regulatory framework Retail
EPL & framework for labour contracts Construction
Wages & wage setting CSR Digital Economy / Telecom
Education CSR Energy
Legend: Transport
No barrier to investment identified
CSR Investment barriers that are also subject to a CSR Some progress
No progress Substantial progress
Limited progress Fully addressed
Public
administration/
Business
environment
Financial
Sector /
Taxation
R&D&I
Sector
specific
regulation
Labour
market/
Education

47
Public administration
The territorial fragmentation of the public
administration weighs on efficiency of public
service provision. Croatia is generally regarded as
a relatively centralised country. However, the
constitutional and legislative amendments of 1992
and 2001 led to a very high increase in the number
of towns and municipalities. Despite being granted
competencies and responsibilities in providing
public services, many small local units lack the
adequate financial, administrative and personnel
resources to carry out decentralised functions
(European Commission, country report, 2016b and
2017f). The current territorial organisation also
creates numerous overlaps between central and
local government. This is particularly evident in
numerous branch offices of ministries and other
central government bodies present at the county
and local level. The high fragmentation of the
public administration hinders the implementation
of public policies, increases costs and inefficiency
in the use of resources.
Key indicators for the public administration
show a performance below the EU average. The
Croatian public sector performance and
government effectiveness ranked well below the
EU average in 2015 (European Commission 2015
and 2016e, World Economic Forum). Weak
administrative capacities largely hinder the
implementation of strategic documents and the
implementation of relevant reform measures.
Evidence-based policy making is ranked at the EU
average level, with large differences between the
central and local government levels. Public
consultations and regulatory impact assessments
are improving at the central level, while at the
local level they are practically non-existent,
placing Croatia overall well below the EU average.
The adopted regulatory impact assessment law
(mandating ministries to analyse economic,
environmental, societal, legal and administrative
aspects of new regulations) is a step forward.
Croatia however ranks unfavourably in the level of
professionalism, impartiality and corruption of the
civil service (EUPACK-Project, European
Commission, 2018c). The indicator on public
administration transparency is improving, mainly
thanks to the implementation of the Right to
Access Information Act and participation in the
Open Government Partnership initiative since
2011.
Amendments to the law on financing local
government units were adopted in December
2017. The draft legislation aims at simplifying the
complex system of transfers and financing, as well
as increasing transparency. It also introduces a new
system of fiscal equalisation establishing a more
efficient model of revenue sharing and reducing
disparities in fiscal capacity across local units.
According to the Ministry of Finance and the
Institute for Public Finance, the changes are likely
to have a broadly neutral impact, both on the
central state budget and on the budgets of most
local government units. However, the
shortcomings in the functional distribution of
competences across all government levels, and in
administrative capacity in the smallest local units
have yet to be addressed.
Other major reforms of the public
administration have not considerably advanced.
With the Strategy of Public Administration
Development 2015-2020, the authorities plan to
address the main weaknesses of the system,
including territorial fragmentation, political
influence in the recruitment process, poor design
of working positions, lack of in-service training,
subjective appraisals and inconsistencies in the
salary system. The strategy, however remains
largely unimplemented. The authorities have
completed the analysis needed for the planned
reduction of the 1200 branch and regional offices
of the central administration operating at local
level. The rationalisation plan is expected to start
only in June 2018. Previous plans to rationalise the
cumbersome system of state agencies have been
suspended due to weak political support. The
authorities are now planning to establish a new
legal framework for state agencies, with a higher
degree of homogeneity across the system and a
defined set of criteria with which the existing
agencies should comply.
The development of eGovernment services is
progressing, mainly thanks to an improved
access to Open Data. The platform eCitizen,
launched in 2014, offered 43 different eServices in
2017 and continues to develop and integrate new
features. The recently adopted Strategy for e-
Croatia 2020 and its Action Plan, as well as the
eGovernment and government digitisation plan
(May 2017) are aimed at supporting positive
developments in this policy area, including
interoperable government systems and services to
4.5. PUBLIC GOVERNANCE*
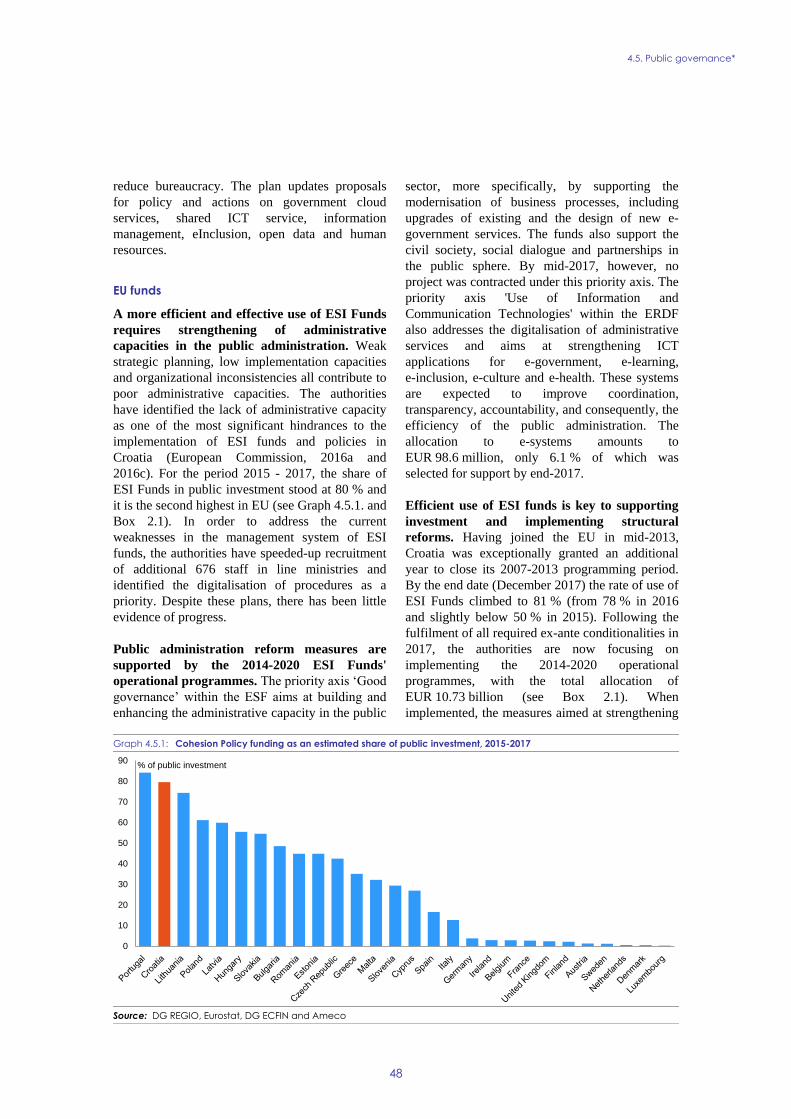
4.5. Public governance*
48
reduce bureaucracy. The plan updates proposals
for policy and actions on government cloud
services, shared ICT service, information
management, eInclusion, open data and human
resources.
EU funds
A more efficient and effective use of ESI Funds
requires strengthening of administrative
capacities in the public administration. Weak
strategic planning, low implementation capacities
and organizational inconsistencies all contribute to
poor administrative capacities. The authorities
have identified the lack of administrative capacity
as one of the most significant hindrances to the
implementation of ESI funds and policies in
Croatia (European Commission, 2016a and
2016c). For the period 2015 - 2017, the share of
ESI Funds in public investment stood at 80 % and
it is the second highest in EU (see Graph 4.5.1. and
Box 2.1). In order to address the current
weaknesses in the management system of ESI
funds, the authorities have speeded-up recruitment
of additional 676 staff in line ministries and
identified the digitalisation of procedures as a
priority. Despite these plans, there has been little
evidence of progress.
Public administration reform measures are
supported by the 2014-2020 ESI Funds'
operational programmes. The priority axis ‘Good
governance’ within the ESF aims at building and
enhancing the administrative capacity in the public
sector, more specifically, by supporting the
modernisation of business processes, including
upgrades of existing and the design of new e-
government services. The funds also support the
civil society, social dialogue and partnerships in
the public sphere. By mid-2017, however, no
project was contracted under this priority axis. The
priority axis 'Use of Information and
Communication Technologies' within the ERDF
also addresses the digitalisation of administrative
services and aims at strengthening ICT
applications for e-government, e-learning,
e-inclusion, e-culture and e-health. These systems
are expected to improve coordination,
transparency, accountability, and consequently, the
efficiency of the public administration. The
allocation to e-systems amounts to
EUR 98.6 million, only 6.1 % of which was
selected for support by end-2017.
Efficient use of ESI funds is key to supporting
investment and implementing structural
reforms. Having joined the EU in mid-2013,
Croatia was exceptionally granted an additional
year to close its 2007-2013 programming period.
By the end date (December 2017) the rate of use of
ESI Funds climbed to 81 % (from 78 % in 2016
and slightly below 50 % in 2015). Following the
fulfilment of all required ex-ante conditionalities in
2017, the authorities are now focusing on
implementing the 2014-2020 operational
programmes, with the total allocation of
EUR 10.73 billion (see Box 2.1). When
implemented, the measures aimed at strengthening
Graph 4.5.1: Cohesion Policy funding as an estimated share of public investment, 2015-2017
Source: DG REGIO, Eurostat, DG ECFIN and Ameco
0
10
20
30
40
50
60
70
80
90% of public investment

4.5. Public governance*
49
administrative capacity are expected to alleviate
the current issues in implementation and the use of
ESI funds.
State-owned enterprises
SOEs continue to play an important role in
Croatia's economy due to their size and
presence in numerous sectors. According to the
analysis in last year's Country Report (European
Commission, 2017f), SOEs in Croatia are marred
by weak productivity. The gap in productivity
between SOE's and their privately-owned peers is
the widest among all CEE countries. In addition to
reducing the average productivity in their
respective sectors nominally, their prominent
presence hampers the allocative efficiency of the
market, as productive resources are diverted from
the more efficient companies. The importance of
reducing state ownership in companies of no
strategic or special interest for the state through
privatisation, and improving corporate governance
in those that remain in state ownership, has been
well recognised in National Reform Programmes
over the recent years. However, the commitments
taken to that effect have been followed through
only partially.
State-owned assets are now directly managed at
ministerial level. The new Ministry of State
Assets has assumed direct authority over the
enterprises of strategic and special interest, while
the remaining SOEs and state-owned assets are
managed through the Centre for Restructuring and
Sale of State Assets (CERP). In 2017, some
progress has been made on some of the
commitments outlined in the latest National
Reform Programme. In particular, efforts have
intensified in the area of disposal of state-owned
assets and enterprises. The Ministry has further
reduced the list of companies of strategic and
special interest by nine entities, paving the way for
privatisation efforts to intensify in 2018. The new
corporate governance code was adopted in
December 2017. However, other key documents
planned for adoption in 2017, including the new
Act on Management and Disposal of State Assets
are significantly delayed.
The government has made steps towards a
more effective and transparent privatisation
process. The implementation of the annual State
Assets Management Plan for 2017 led to progress
in the sale of state-owned dwellings and minority
shares in non-strategic and not-of-special-interest
enterprises. By September, total revenues from
management and disposal of state assets reached
90 % of the planned revenue set out in the 2017
NRP. Privatisation was initiated for two major
SOEs, both of which bear critical economic and
social importance for the local community, and
fresh private capital is widely seen as crucial for
their survival. However, a more decisive effort in
following through on the privatisation activities
planned in the NRP is yet to be seen.
Justice system
Despite a further reduction in backlogs, court
proceedings remain long and there is room for
improvement of the quality and independence
of justice. The decrease in backlogs has been
largely achieved due to reduced caseload as courts
resolved fewer cases. According to the 2018 EU
Justice Scoreboard (European Commission,
2018a), length of court proceedings and backlogs
in Croatia are among the most significant in the
EU. In 2017, backlogs in first instance courts in
civil, commercial, and enforcement cases
decreased by 6 % (compared to 2016) and courts
prioritized oldest cases. Proceedings in first
instance courts remained slow with civil and
commercial cases taking on average 884 and 730
days, respectively. However, at second instance,
backlogs decreased both in civil cases before
County courts (by 13 %) and significantly in
commercial cases before the High Commercial
Court (by 23 %), with length of proceedings
increasing in civil cases (to 298 days), but further
decreasing in commercial cases (to 789 days). A
partial reform of the business processes has shown
some results at the High Commercial Court, but
has not been extended to other courts.
Criminal justice is experiencing issues of
efficiency and quality, particularly regarding
resources which are lacking. The backlogs
increased at all criminal court instances and
proceedings remained lengthy (638 days in
Municipal courts, and 962 days for first instance
cases in County courts). The criminal justice
system appears to be reacting regarding cases of
corruption among judges. The State Attorney's
Office appears to be experiencing a resource issue,
as according to the current framework criteria
more than 20% State Attorney positions or equal to

4.5. Public governance*
50
nearly 500 staff positions remain vacant, which
could be a source of concern considering that the
prosecution is currently occupied with large and
complex economic and financial crime cases.
Financial resources for experts, including on
economic and financial crimes are not adequately
budgeted for as 70 % of the State Attorney's Office
budget is spent on disputes representing the state in
international disputes mainly in arbitration
procedures. The upgraded ICT in the State
Attorney's Office allows for electronic exchange of
court documents at some courts and the
implementation of qualified electronic signatures
is on-going.
Quality of justice could be further improved,
through electronic communication with courts
and a reform of the judicial map. Most court
documents are delivered in physical form and
electronic communication is being tested and
gradually implemented between courts and police
(in misdemeanour cases) and lawyers (particularly
in commercial cases). However, more complete
communication with other parties (e.g. public
notaries, State Attorneys, tax administration,
insolvency administrators, FINA) requires further
preparation. Commercial judges gained access to
the land registry and the registry of blocked
accounts, but access to other registers (e.g. for
vehicles, boats) is still lacking. A new reform of
the judicial map is envisaged to merge most
Misdemeanour courts (where the caseload has
been decreasing) with Municipal courts, which
could even-out the workload of judges and
improve efficiency. Court directors, under the
authority of the Court Presidents, who would be
responsible for management of courts, are being
considered.
Perceived judicial independence decreased
further and the involvement of the National
Security Agency in the appointment of first
time judges raises further judicial independence
concerns. The law envisaging the involvement of
the National Security Agency in background
checks of first-time appointed judges remains
under constitutional review and the necessary
amendments to remove this power have been
announced and will have to be closely followed.
The Council for the judiciary, which plays a key
role in guaranteeing judicial independence,
remains weak in its administrative capacity.
The inflow of corporate pre-insolvency and
insolvency cases is decreasing while the number
of personal insolvency cases remains low.
Driven by economic growth, the influx of pre-
insolvency and insolvency cases regarding
companies significantly decreased, which helped
the courts reduce backlogs. A draft report
analysing the effects of the new personal
insolvency framework shows an increasing (but
still insignificant) number of personal insolvencies,
mostly concerning persons with no assets, and a
decreasing number of insolvency administrators
ready to work on such cases, which appears to be a
financial incentives issue. The average duration of
proceedings increased both in pre-insolvency (to
416 days) and insolvency cases (to 334 days).
Preliminary data submitted by the Ministry of
Justice suggests that initiated insolvencies mainly
involved micro companies without employees or
assets, mostly in construction and trade.
Healthcare system
Health outcomes in Croatia have improved in
recent years. With life expectancy of 74.4 and
80.5 years at birth in 2015 for men and women
respectively, Croatia still scores below the EU
average (77.9 and 83.3), but exceeds most of the
peer countries. The relatively low life expectancy
owes greatly to high mortality caused by
cardiovascular diseases (almost twice the EU
average) and certain cancers, but also to external
causes of death, with 73 deaths per 100 000
inhabitants compared to EU average of 46 (OECD
and European Observatory on Health Systems and
Policies, 2017). Perinatal mortality, generally
taken as a proxy of the effectiveness of a
healthcare system, is below the EU average.
However, infant mortality, which is influenced
also by external factors, is still one of the highest.
This suggests a relatively effective healthcare
system and a need for better preventive measures
outside it. For the positive trends in health
outcomes to hold, the system will need to address
the increasing pressures from rising costs and the
particularly adverse demographic trends,
particularly if the principles of solidarity in
funding and universality in service provision are to
be preserved.
Healthcare-related inequalities give a mixed
picture. Differences in life expectancy between
groups with different educational levels in Croatia
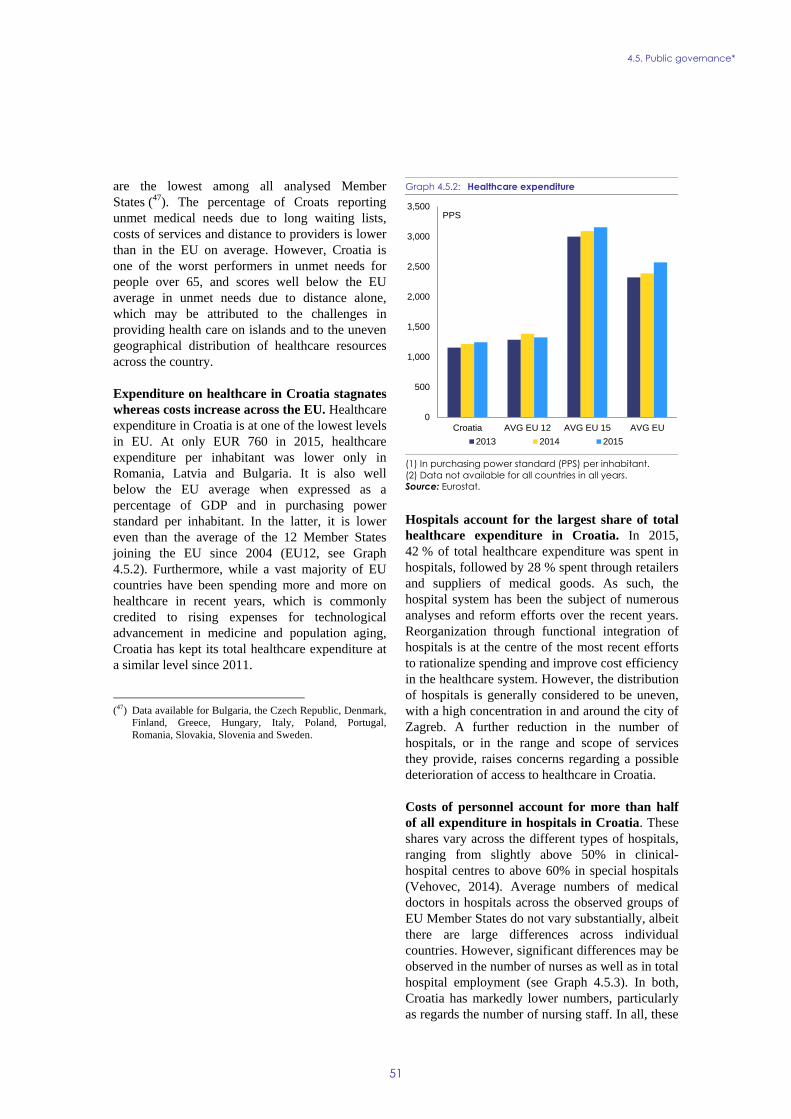
4.5. Public governance*
51
are the lowest among all analysed Member
States (47). The percentage of Croats reporting
unmet medical needs due to long waiting lists,
costs of services and distance to providers is lower
than in the EU on average. However, Croatia is
one of the worst performers in unmet needs for
people over 65, and scores well below the EU
average in unmet needs due to distance alone,
which may be attributed to the challenges in
providing health care on islands and to the uneven
geographical distribution of healthcare resources
across the country.
Expenditure on healthcare in Croatia stagnates
whereas costs increase across the EU. Healthcare
expenditure in Croatia is at one of the lowest levels
in EU. At only EUR 760 in 2015, healthcare
expenditure per inhabitant was lower only in
Romania, Latvia and Bulgaria. It is also well
below the EU average when expressed as a
percentage of GDP and in purchasing power
standard per inhabitant. In the latter, it is lower
even than the average of the 12 Member States
joining the EU since 2004 (EU12, see Graph
4.5.2). Furthermore, while a vast majority of EU
countries have been spending more and more on
healthcare in recent years, which is commonly
credited to rising expenses for technological
advancement in medicine and population aging,
Croatia has kept its total healthcare expenditure at
a similar level since 2011.
(47) Data available for Bulgaria, the Czech Republic, Denmark,
Finland, Greece, Hungary, Italy, Poland, Portugal,
Romania, Slovakia, Slovenia and Sweden.
Graph 4.5.2: Healthcare expenditure
(1) In purchasing power standard (PPS) per inhabitant.
(2) Data not available for all countries in all years.
Source: Eurostat.
Hospitals account for the largest share of total
healthcare expenditure in Croatia. In 2015,
42 % of total healthcare expenditure was spent in
hospitals, followed by 28 % spent through retailers
and suppliers of medical goods. As such, the
hospital system has been the subject of numerous
analyses and reform efforts over the recent years.
Reorganization through functional integration of
hospitals is at the centre of the most recent efforts
to rationalize spending and improve cost efficiency
in the healthcare system. However, the distribution
of hospitals is generally considered to be uneven,
with a high concentration in and around the city of
Zagreb. A further reduction in the number of
hospitals, or in the range and scope of services
they provide, raises concerns regarding a possible
deterioration of access to healthcare in Croatia.
Costs of personnel account for more than half
of all expenditure in hospitals in Croatia. These
shares vary across the different types of hospitals,
ranging from slightly above 50% in clinical-
hospital centres to above 60% in special hospitals
(Vehovec, 2014). Average numbers of medical
doctors in hospitals across the observed groups of
EU Member States do not vary substantially, albeit
there are large differences across individual
countries. However, significant differences may be
observed in the number of nurses as well as in total
hospital employment (see Graph 4.5.3). In both,
Croatia has markedly lower numbers, particularly
as regards the number of nursing staff. In all, these
0
500
1,000
1,500
2,000
2,500
3,000
3,500
Croatia AVG EU 12 AVG EU 15 AVG EU
PPS
2013 2014 2015

4.5. Public governance*
52
physical indicators seem to provide insufficient
grounds for rationalising hospital expenses by
reducing medical personnel
Graph 4.5.3: Staff in hospitals, 2015
Data not available for all countries.
Source: Eurostat.
Croatia is among the countries with a relatively
high number of hospital beds. The total number
of beds in hospitals was reduced by 7 % from 2011
to 2015, when it amounted to 556 per 100 000
inhabitants, higher than the EU average.
Particularly high numbers of beds are available in
rehabilitative and long-term care hospital facilities,
well above the averages observed (see table 4.5.1).
Conversely, the number of beds available for care
for chronic impairments and reduced independence
outside of hospitals is far lower. These numbers
suggest a substantial scope for reorganizing the
system by relieving hospitals from part of the
costly long-term care.
Table 4.5.1: Hospital beds by type, per 100 000 inhabitants,
2015
Far right column represents beds outside of hospitals.
Source: Eurostat.
Hospital expenses are under the increasing
pressures from rising number of patients and
lengthy treatments. With an average of 9.4 days
per discharged patient, for all diseases, Croatia
ranks second only to Hungary (9.5). This, coupled
with above-average bed occupancy rate (48),
generates high costs for hospitals. For discharges
related to pregnancy, child birth and puerperium,
the average number of days spent in hospitals
exceeds that in any other EU Member State.
Furthermore, in the period from 2011 to 2015, the
number of in-patient discharges remained constant,
while day cases increased by a third. The hospitals
managing to handle such a sizeable increase in
turnover without substantially increasing the
number of patients admitted overnight is by all
means a positive development. However, the fast-
rising number of day cases in hospitals possibly
points to a healthcare system that does not fully
utilise its primary care.
The healthcare system remains underfinanced
and indebted. The regular sources of financing are
insufficient to cover all the expenses, which causes
outstanding debt (arrears) to accumulate in the
system. These are eventually settled by one-off
transfers from the state budget, the latest of which
amounted to 3 % and 9 % of the state insurance
fund's revenues in 2013 and 2014, respectively.
The overall debt in mid-2017 stood at more than
EUR 1.1 billion, half of which was outstanding
debt. One of the reasons behind this is
underpayment of health insurance premiums for
the economically inactive population and of
contributions collected from the special excises on
tobacco. Hospital budgets, in particular, are
strained by underfinancing, with the inadequately
set spending limits still in force. The amount of
arrears and overall debt levels currently generated
in hospitals threaten the sustainability of the
healthcare system.
The government has taken some measures
aimed at rationalizing spending and increasing
revenues. The number of paying clients in
supplementary insurance was increased by 15 000
during 2017. The long-planned functional
integration of hospitals was initiated in July 2017
as six pairs of hospitals signed their integration
agreements. The National Plan for Development of
Hospitals 2017-2020, along with the measures
regulating non-medical activities in hospitals, is
still pending.
(48) Eurostat, curative bed occupancy data in 2015, Croatia at
76.3 %, EU average at 72 %
0
200
400
600
800
1.000
1.200
1.400
1.600
Croatia EU12 EU15 EU
per 100,000
inhabitants
Doctors Nurses Total employees
Beds
Total
Curative
care
Rehabilitative
care
Long-term
care
Nursing and
residential
Croatia 556.3 358.1 101.2 97.0 225.3
EU12 584.7 444.8 64.0 72.4 536.5
EU15 436.9 366.9 53.1 42.0 874.4
EU 514.5 402.5 60.4 57.9 698.7

4.5. Public governance*
53
Box 4.5.1: Policy Highlight: Developing a Comprehensive Curricular Reform
In order to modernise and improve its education system, in 2014 Croatia adopted the National Strategy for
Education, Science and Technology (Strategy). The Strategy's headline activity in primary and secondary
education is a comprehensive curricular reform. Due to successive elections and changes in political
leadership, the reform was delayed between 2016 and 2017. Work has since restarted and a pilot
implementation across 70 schools is planned from autumn 2018. The curricular reform has pioneered a
number of best practices in policy development.
The curricular reform benefitted from a strong policy foundation. Embedding the reform into the
Strategy for Education, Science and Technology ensured clear goals and coherence with other wider policy
objectives. Furthermore, the planning of the curricula reform was comprehensive from the start. It included
different aspects ranging from the development of a dedicated methodology ahead of the drafting of specific
curricula, to the adaptation of textbooks and the training of teachers. Finally, the funding for the reform was
appropriately devised and secured from both the national budget and the European Structural and Investment
Funds.
The reform used state of the art approaches in policy development. The new curricula are founded on
the approach set out in the European Qualifications Framework (EQF), which defines the European
guidelines for educational programmes. EQF-based curricula use the so-called 'learning outcomes' approach
to describe what pupils are expected to attain when they leave a class. The reform incorporates also the
development of skills for the citizens of the future, such as learning to learn, entrepreneurship, the use of
ICT, personal and social development and citizenship education. Finally, the draft curricula benefitted from
an international peer review, partly supported by the European Commission's Structural Reform Support
Service. Once finalised, the curricula will be first implemented through a pilot scheme, allowing the
authorities to adjust the content where needed before the full rollout.
The reform was developed following principles of inclusion and transparency. The draft reform
documents were developed by over 430 teachers seconded from the education system. They prepared more
than 50 curricula proposals which were discussed by over 60 000 school heads, teachers, experts,
institutional representatives and relevant NGOs over more than 700 events. Subsequently, a general public
consultation was launched. Altogether, the expert and the public consultations jointly attracted over 3 700
observations by more than 900 institutions and individual experts. The expert groups are expected to redraft
the curricula on the basis of these inputs by early 2018, when the final drafts will be submitted to the last
public consultation. The transparency and inclusiveness of the process have ensured a wide base of support
for the reform, including from the teacher unions, parents and the non-governmental sector.
Based on the experience of other EU Member States, the implementation of the curricular reform is likely to
have a positive impact on the quality of the Croatian education system. The reform is, however, at an early
stage and a number of important steps still need to be taken, among which the need to ensure full
implementation of the reform and its coherence with the other actions in the Strategy. Equally important will
be adjusting the full rollout on the basis of the feedback received from the pilot phase, and providing the
appropriate support to teachers and schools. While the reform is yet to be implemented, the design,
development and the consultation process that Croatia conducted so far could inform the reform efforts of
other EU Member States in this policy area.
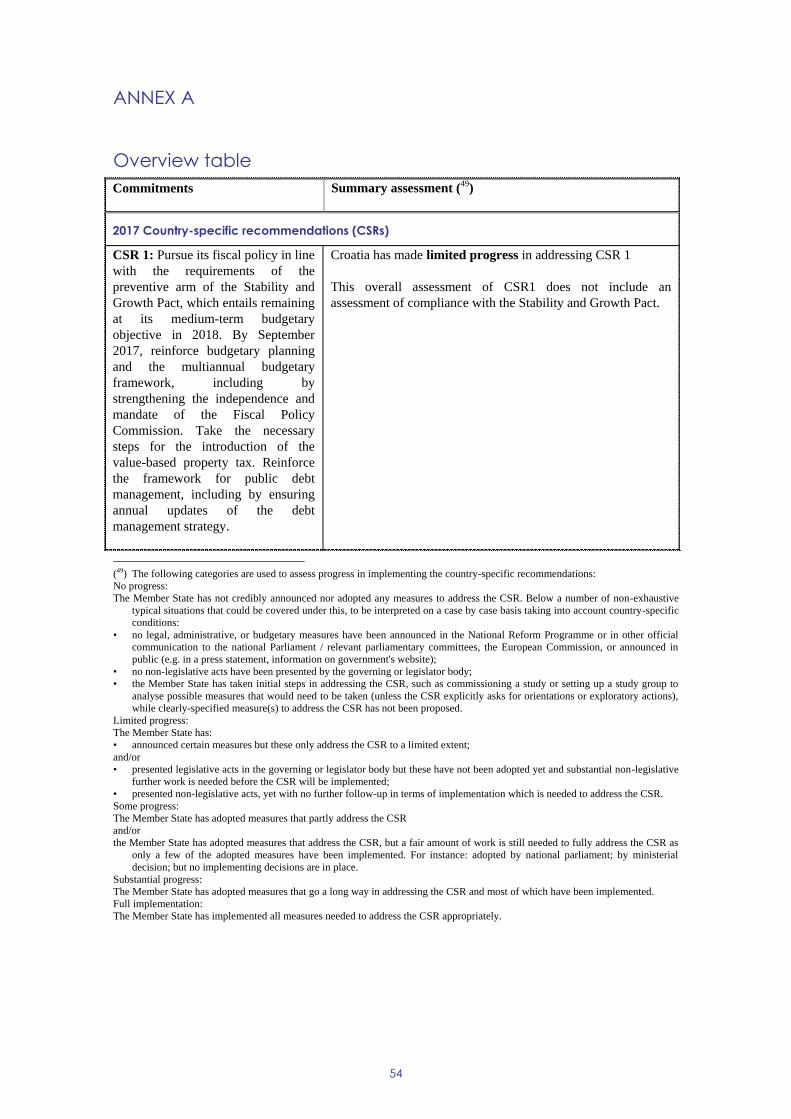
54
Commitments Summary assessment (49
)
2017 Country-specific recommendations (CSRs)
CSR 1: Pursue its fiscal policy in line
with the requirements of the
preventive arm of the Stability and
Growth Pact, which entails remaining
at its medium-term budgetary
objective in 2018. By September
2017, reinforce budgetary planning
and the multiannual budgetary
framework, including by
strengthening the independence and
mandate of the Fiscal Policy
Commission. Take the necessary
steps for the introduction of the
value-based property tax. Reinforce
the framework for public debt
management, including by ensuring
annual updates of the debt
management strategy.
Croatia has made limited progress in addressing CSR 1
This overall assessment of CSR1 does not include an
assessment of compliance with the Stability and Growth Pact.
(49) The following categories are used to assess progress in implementing the country-specific recommendations:
No progress:
The Member State has not credibly announced nor adopted any measures to address the CSR. Below a number of non-exhaustive
typical situations that could be covered under this, to be interpreted on a case by case basis taking into account country-specific
conditions:
• no legal, administrative, or budgetary measures have been announced in the National Reform Programme or in other official
communication to the national Parliament / relevant parliamentary committees, the European Commission, or announced in
public (e.g. in a press statement, information on government's website);
• no non-legislative acts have been presented by the governing or legislator body;
• the Member State has taken initial steps in addressing the CSR, such as commissioning a study or setting up a study group to
analyse possible measures that would need to be taken (unless the CSR explicitly asks for orientations or exploratory actions),
while clearly-specified measure(s) to address the CSR has not been proposed.
Limited progress:
The Member State has:
• announced certain measures but these only address the CSR to a limited extent;
and/or
• presented legislative acts in the governing or legislator body but these have not been adopted yet and substantial non-legislative
further work is needed before the CSR will be implemented;
• presented non-legislative acts, yet with no further follow-up in terms of implementation which is needed to address the CSR.
Some progress:
The Member State has adopted measures that partly address the CSR
and/or
the Member State has adopted measures that address the CSR, but a fair amount of work is still needed to fully address the CSR as
only a few of the adopted measures have been implemented. For instance: adopted by national parliament; by ministerial
decision; but no implementing decisions are in place.
Substantial progress:
The Member State has adopted measures that go a long way in addressing the CSR and most of which have been implemented.
Full implementation:
The Member State has implemented all measures needed to address the CSR appropriately.
ANNEX A
Overview table

A. Overview Table
55
Pursue its fiscal policy in line
with the requirements of the
preventive arm of the Stability
and Growth Pact, which entails
remaining at its medium-term
budgetary objective in 2018.
The compliance assessment with the Stability and Growth
Pact will be included in spring when final data for 2017 will
be available.
By September 2017, reinforce
budgetary planning and the
multiannual budgetary
framework, including by
strengthening the independence
and mandate of the Fiscal Policy
Commission.
No Progress in reinforcing the budgetary framework. The
new Fiscal Responsibility and Budget Acts, aimed at
addressing many of the outstanding issues, have still not
been adopted.
Take the necessary steps for the
introduction of the value-based
property tax.
No Progress in introducing the property tax. The already
legislated introduction of the property tax, scheduled for
January 2018 (as part of the tax reform adopted in 2016),
was postponed without a timeframe for adoption.
Reinforce the framework for
public debt management,
including by ensuring annual
updates of the debt management
strategy.
Some Progress in reinforcing the framework for public
debt management. A sizable share of central government
debt relating to SOEs (previously in the form of loans) was
refinanced by a bond issuance and the public debt
management body was promoted to the status of a
Directorate within the Ministry of Finance. Both
developments should improve control over debt
management.
CSR 2: Discourage early retirement,
accelerate the transition to the higher
statutory retirement age and align
pension provisions for specific
categories with the rules of the
general scheme. Improve
coordination and transparency of
social benefits.
Croatia has made Limited Progress in addressing CSR 2
Discourage early retirement,
accelerate the transition to the
higher statutory retirement age
and align pension provisions for
specific categories with the rules
of the general scheme.
No Progress in reforming the pension system. Reform
measures planned for December 2017 are being further
postponed to mid-2018. These include the streamlining of
the 100+ arduous or hazardous professions benefitting from
more generous pension provisions, measures aimed at
reducing access to early retirement, the increase of the
statutory retirement age and the acceleration in the
equalisation of retirement age for women and men.

A. Overview Table
56
Improve coordination and
transparency of social benefits.
Limited Progress in improving the social benefits system.
The ambitious and long-planned establishment of the one-
stop-shop as a central point for the administration and
provision of social benefits and services has been
abandoned. Similarly, the previously announced
harmonisation of eligibility criteria for social benefits has
been suspended. The focus has shifted to harmonizing
definitions and classifications of social protection benefits
and improving beneficiaries' records as well as data
exchange between the central and local government level.
CSR 3: Improve adult education, in
particular for older workers, the low-
skilled and the long-term
unemployed. Accelerate the reform
of the education system.
Croatia has made Limited Progress in addressing CSR 3
Improve adult education, in
particular for older workers, the
low-skilled and the long-term
unemployed.
Limited Progress in improving adult education. Coverage
of Active Labour Market Policies (ALMPs) remains very
low. In February 2017 the Croatian Employment Service
(CES) adopted a new package of ALMP with focus on
education. Concerns however remain with regard to the
capacity of the CES to adapt its offer of
employment/education measures to the needs of its
beneficiaries. The authorities' efforts to increase
participation in adult learning do not seem to be well
coordinated with the provision of ALMPs by the CES
(including reskilling and upskilling measures). The
adoption of the new Adult Education Act and the Law on
Vocational Education and Training has been further
postponed.
Accelerate the reform of the
education system.
Limited Progress in reforming the education system. The
implementation of the reform previously suffered from
numerous delays. Some activities were relaunched in 2017,
and a pilot project to implement the curricular reform is due
to start in September 2018. The necessary legislation
amendments, including on the General Education Act, have
not yet been discussed in Parliament. The adoption of a new
bylaw on non-formal and informal learning is still pending.
CSR 4: Reduce the fragmentation
and improve the functional
distribution of competencies in public
administration, while enhancing the
efficiency and reducing territorial
disparities in the delivery of public
services. In consultation with social
partners, harmonise the wage-setting
frameworks across the public
administration and public services.
Croatia has made No Progress in addressing CSR 4

A. Overview Table
57
Reduce the fragmentation and
improve the functional
distribution of competencies in
public administration, while
enhancing the efficiency and
reducing territorial disparities in
the delivery of public services.
No Progress in the public administration reform. The
planned reduction of the branch-offices of the central
administration (e.g. ministries) operating at local level has
not yet started. Previous plans to rationalise the
cumbersome state agencies system have been suspended.
The authorities plan to establish first a new legal framework
for states agencies. The government proposed amendments
to the law on the financing of local government units, aims
at simplifying the complex system of transfers and
financing. The fragmentation and functional distribution of
competencies of sub-national units have not been
addressed.
In consultation with social
partners, harmonise the wage-
setting frameworks across the
public administration and public
services.
No Progress in harmonising the wage-setting frameworks
across the public administration and public services. The
new legislation on public sector wages has been postponed
several times. The aim of the law is to achieve greater
harmonisation of wages across the public administration
through the introduction of common wage grids and job
complexity coefficients, based on more consistent job
descriptions and competences frameworks.
CSR 5: Speed up the divestment of
state-owned enterprises and other
state assets, and improve corporate
governance in the state-owned
enterprise sector. Significantly reduce
the burden on businesses stemming
from costs of regulation and from
administrative burdens. Remove
regulatory restrictions hampering
access to and the practice of
regulated professions and
professional and business services.
Improve the quality and efficiency of
the justice system, in particular by
reducing the length of civil and
commercial cases.
Croatia has made Limited Progress in addressing CSR 5
Speed up the divestment of state-
owned enterprises and other state
assets, and improve corporate
governance in the state-owned
enterprise sector.
Limited Progress in SOEs divestment and improving
corporate governance. The new Ministry has advanced
efforts in sales of minority shares in state-owned companies
and further reduced the list of companies of strategic and
special interest. However, there are considerable delays in
the legislation aimed at improving the management of state
assets and corporate governance in SOEs.
Significantly reduce the burden
on businesses stemming from
costs of regulation and from
administrative burdens.
Limited Progress in reducing the burden on business. The
measuring and subsequent reduction of administrative
burden has continued and two parafiscal charges have been
reduced.
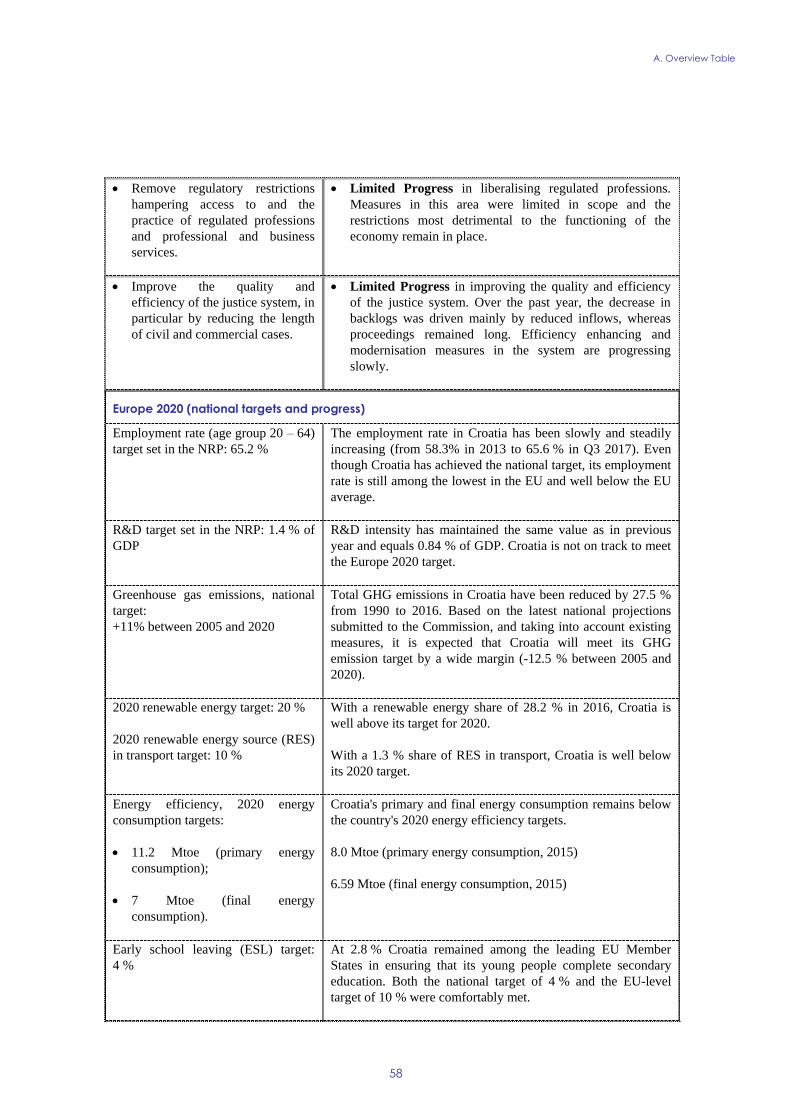
A. Overview Table
58
Remove regulatory restrictions
hampering access to and the
practice of regulated professions
and professional and business
services.
Limited Progress in liberalising regulated professions.
Measures in this area were limited in scope and the
restrictions most detrimental to the functioning of the
economy remain in place.
Improve the quality and
efficiency of the justice system, in
particular by reducing the length
of civil and commercial cases.
Limited Progress in improving the quality and efficiency
of the justice system. Over the past year, the decrease in
backlogs was driven mainly by reduced inflows, whereas
proceedings remained long. Efficiency enhancing and
modernisation measures in the system are progressing
slowly.
Europe 2020 (national targets and progress)
Employment rate (age group 20 – 64)
target set in the NRP: 65.2 %
The employment rate in Croatia has been slowly and steadily
increasing (from 58.3% in 2013 to 65.6 % in Q3 2017). Even
though Croatia has achieved the national target, its employment
rate is still among the lowest in the EU and well below the EU
average.
R&D target set in the NRP: 1.4 % of
GDP
R&D intensity has maintained the same value as in previous
year and equals 0.84 % of GDP. Croatia is not on track to meet
the Europe 2020 target.
Greenhouse gas emissions, national
target:
+11% between 2005 and 2020
Total GHG emissions in Croatia have been reduced by 27.5 %
from 1990 to 2016. Based on the latest national projections
submitted to the Commission, and taking into account existing
measures, it is expected that Croatia will meet its GHG
emission target by a wide margin (-12.5 % between 2005 and
2020).
2020 renewable energy target: 20 %
2020 renewable energy source (RES)
in transport target: 10 %
With a renewable energy share of 28.2 % in 2016, Croatia is
well above its target for 2020.
With a 1.3 % share of RES in transport, Croatia is well below
its 2020 target.
Energy efficiency, 2020 energy
consumption targets:
11.2 Mtoe (primary energy
consumption);
7 Mtoe (final energy
consumption).
Croatia's primary and final energy consumption remains below
the country's 2020 energy efficiency targets.
8.0 Mtoe (primary energy consumption, 2015)
6.59 Mtoe (final energy consumption, 2015)
Early school leaving (ESL) target:
4 %
At 2.8 % Croatia remained among the leading EU Member
States in ensuring that its young people complete secondary
education. Both the national target of 4 % and the EU-level
target of 10 % were comfortably met.

A. Overview Table
59
Tertiary education target: 35 % Croatia's tertiary education attainment rate has been slowly
declining since 2014 and stood at 29.5 % in 2016. The
enrolment rates of the corresponding student cohort, together
with the overall drop-out rates, make it unlikely that Croatia
will meet its national target by 2020.
Target for reducing the number of
people at risk of poverty or social
exclusion, expressed as an absolute
number of people: by 150 000.
The number of people at risk of poverty or social exclusion fell
from 1.384 million in 2011 to 1.159 million in 2016. Therefore,
the national target has already been met.

60
ANNEX B
Macroeconomic Imbalance Procedure scoreboard
Table B.1: The MIP scoreboard for Croatia (AMR 2018)
Flags: e: Estimated.
1) This table provides data as published under the Alert Mechanism Report 2018, which reports data as of 24 Oct 2017. Please
note that figures reported in this table may therefore differ from more recent data elsewhere in this document.2) NULC d:
employment data use national concept instead of domestic concept. 3) Figures highlighted are those falling outside the
threshold established in the European Commission's Alert Mechanism Report.
Source: European Commission 2017, Statistical Annex to the Alert Mechanism Report 2018, SWD(2017) 661.
Thresholds 2011 2012 2013 2014 2015 2016
Current account balance, % of GDP 3 year average -4%/6% -2.4 -0.7 0.0 0.9 2.5 2.9
Net international investment position % of GDP -35% -91.5 -90.6 -88.5 -85.4 -76.5 -70.1
Real effective exchange rate - 42 trading
partners, HICP deflator3 year % change
±5% (EA)
±11% (Non-EA)-4.7 -8.4 -3.9 -0.9 0.2 0.1
Export market share - % of world exports 5 year % change -6% -16.0 -23.8 -23.0 -19.9 -5.8 8.1
Nominal unit labour cost index
(2010=100)3 year % change
9% (EA)
12% (Non-EA)6.3d -1.6d -3.9d -6.4d -6.1d -5.9d
House price index (2015=100), deflated 1 year % change 6% -2.1 -4.6 -5.8 -1.1 -2.4 2.1
Private sector credit flow, consolidated % of GDP 14% -2.3 -3.0 -0.6 0.1 -1.4 -0.1e
Private sector debt, consolidated % of GDP 133% 122.8 120.0 117.9 118.1 113.2 106.1e
General government gross debt % of GDP 60% 65.0 70.6 81.7 85.8 85.4 82.9
Unemployment rate 3 year average 10% 11.6 13.8 15.6 16.8 16.9 15.6
Total financial sector liabilities, non-
consolidated1 year % change 16.5% 2.6 1.0 3.2 0.2 2.1 2.5
Activity rate - % of total population aged
15-643 year change in pp -0.2 pp -1.7 -1.7 -1.4 2.0 3.0 1.9
Long-term unemployment rate - % of
active population aged 15-743 year change in pp 0.5 pp 3.1 5.1 4.4 1.7 0.0 -4.4
Youth unemployment rate - % of active
population aged 15-243 year change in pp 2 pp 13.0 16.8 17.6 8.3 0.1 -18.1
Ex
tern
al
imb
ala
nc
es
an
d c
om
pe
titi
ve
ne
ss
Inte
rna
l im
ba
lan
ce
sE
mp
loy
me
nt
ind
ica
tors
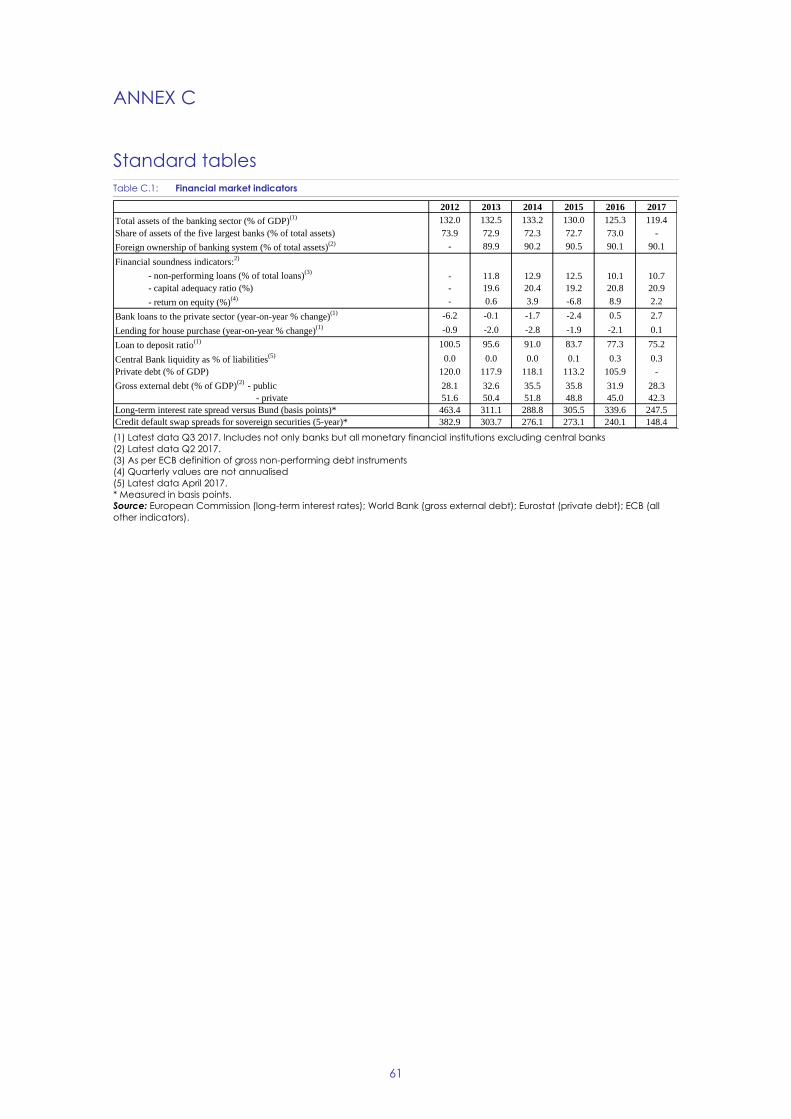
61
Table C.1: Financial market indicators
(1) Latest data Q3 2017. Includes not only banks but all monetary financial institutions excluding central banks
(2) Latest data Q2 2017.
(3) As per ECB definition of gross non-performing debt instruments
(4) Quarterly values are not annualised
(5) Latest data April 2017.
* Measured in basis points.
Source: European Commission (long-term interest rates); World Bank (gross external debt); Eurostat (private debt); ECB (all
other indicators).
2012 2013 2014 2015 2016 2017
Total assets of the banking sector (% of GDP)(1) 132.0 132.5 133.2 130.0 125.3 119.4
Share of assets of the five largest banks (% of total assets) 73.9 72.9 72.3 72.7 73.0 -
Foreign ownership of banking system (% of total assets)(2) - 89.9 90.2 90.5 90.1 90.1
Financial soundness indicators:2)
- non-performing loans (% of total loans)(3)
- 11.8 12.9 12.5 10.1 10.7
- capital adequacy ratio (%) - 19.6 20.4 19.2 20.8 20.9
- return on equity (%)(4) - 0.6 3.9 -6.8 8.9 2.2
Bank loans to the private sector (year-on-year % change)(1) -6.2 -0.1 -1.7 -2.4 0.5 2.7
Lending for house purchase (year-on-year % change)(1) -0.9 -2.0 -2.8 -1.9 -2.1 0.1
Loan to deposit ratio(1) 100.5 95.6 91.0 83.7 77.3 75.2
Central Bank liquidity as % of liabilities(5) 0.0 0.0 0.0 0.1 0.3 0.3
Private debt (% of GDP) 120.0 117.9 118.1 113.2 105.9 -
Gross external debt (% of GDP)(2)
- public 28.1 32.6 35.5 35.8 31.9 28.3
- private 51.6 50.4 51.8 48.8 45.0 42.3
Long-term interest rate spread versus Bund (basis points)* 463.4 311.1 288.8 305.5 339.6 247.5
Credit default swap spreads for sovereign securities (5-year)* 382.9 303.7 276.1 273.1 240.1 148.4
ANNEX C
Standard tables
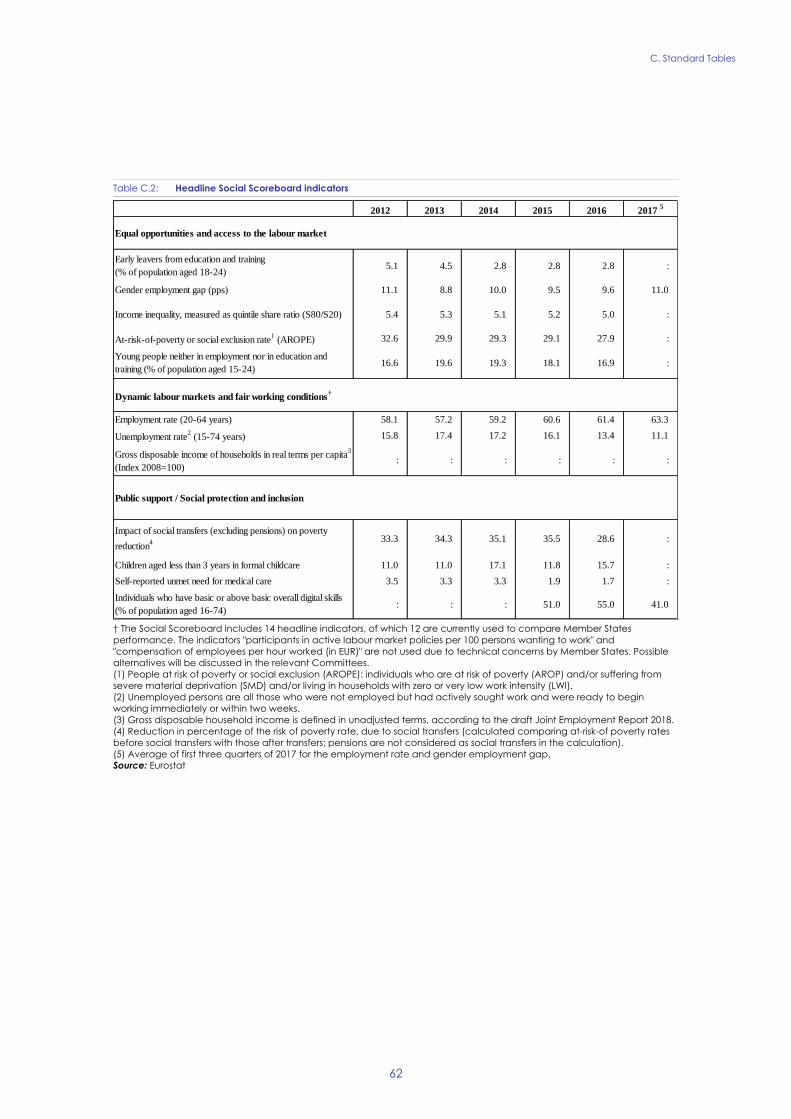
C. Standard Tables
62
Table C.2: Headline Social Scoreboard indicators
† The Social Scoreboard includes 14 headline indicators, of which 12 are currently used to compare Member States
performance. The indicators "participants in active labour market policies per 100 persons wanting to work" and
"compensation of employees per hour worked (in EUR)" are not used due to technical concerns by Member States. Possible
alternatives will be discussed in the relevant Committees.
(1) People at risk of poverty or social exclusion (AROPE): individuals who are at risk of poverty (AROP) and/or suffering from
severe material deprivation (SMD) and/or living in households with zero or very low work intensity (LWI).
(2) Unemployed persons are all those who were not employed but had actively sought work and were ready to begin
working immediately or within two weeks.
(3) Gross disposable household income is defined in unadjusted terms, according to the draft Joint Employment Report 2018.
(4) Reduction in percentage of the risk of poverty rate, due to social transfers (calculated comparing at-risk-of poverty rates
before social transfers with those after transfers; pensions are not considered as social transfers in the calculation).
(5) Average of first three quarters of 2017 for the employment rate and gender employment gap.
Source: Eurostat
2012 2013 2014 2015 2016 2017 5
Equal opportunities and access to the labour market
Early leavers from education and training
(% of population aged 18-24)5.1 4.5 2.8 2.8 2.8 :
Gender employment gap (pps) 11.1 8.8 10.0 9.5 9.6 11.0
Income inequality, measured as quintile share ratio (S80/S20) 5.4 5.3 5.1 5.2 5.0 :
At-risk-of-poverty or social exclusion rate1 (AROPE) 32.6 29.9 29.3 29.1 27.9 :
Young people neither in employment nor in education and
training (% of population aged 15-24)16.6 19.6 19.3 18.1 16.9 :
Dynamic labour markets and fair working conditions†
Employment rate (20-64 years) 58.1 57.2 59.2 60.6 61.4 63.3
Unemployment rate2 (15-74 years) 15.8 17.4 17.2 16.1 13.4 11.1
Gross disposable income of households in real terms per capita3
(Index 2008=100) : : : : : :
Public support / Social protection and inclusion
Impact of social transfers (excluding pensions) on poverty
reduction4 33.3 34.3 35.1 35.5 28.6 :
Children aged less than 3 years in formal childcare 11.0 11.0 17.1 11.8 15.7 :
Self-reported unmet need for medical care 3.5 3.3 3.3 1.9 1.7 :
Individuals who have basic or above basic overall digital skills
(% of population aged 16-74): : : 51.0 55.0 41.0

C. Standard Tables
63
Table C.3: Labour market and education indicators
* Non-scoreboard indicator
(1) Long-term unemployed are people who have been unemployed for at least 12 months.
(2) Difference between the average gross hourly earnings of male paid employees and of female paid employees as a
percentage of average gross hourly earnings of male paid employees. It is defined as "unadjusted", as it does not correct for
the distribution of individual characteristics (and thus gives an overall picture of gender inequalities in terms of pay). All
employees working in firms with ten or more employees, without restrictions for age and hours worked, are included.
(3) PISA (OECD) results for low achievement in mathematics for 15 year-olds.
(4) Impact of socio-economic and cultural status on PISA (OECD) scores. Values for 2012 and 2015 refer respectively to
mathematics and science.
(5) Average of first three quarters of 2017, unless for the youth unemployment rate (annual figure).
Sources: Eurostat, OECD
Labour market indicators 2012 2013 2014 2015 2016 2017 5
Activity rate (15-64) 63.9 63.7 66.1 66.9 65.6 :
Employment in current job by duration
From 0 to 11 months 8.5 8.9 11.6 11.5 14.1 :
From 12 to 23 months 7.4 7.1 6.0 7.5 8.8 :
From 24 to 59 months 14.6 14.0 14.1 12.9 13.6 :
60 months or over 69.5 70.0 68.3 68.0 62.4 :
Employment growth*
(% change from previous year) -3.6 -2.6 2.7 1.2 0.3 1.7
Employment rate of women
(% of female population aged 20-64) 52.6 52.8 54.2 55.9 56.6 57.8
Employment rate of men
(% of male population aged 20-64)63.7 61.6 64.2 65.4 66.2 68.8
Employment rate of older workers*
(% of population aged 55-64)37.5 37.8 36.2 39.2 38.1 39.8
Part-time employment*
(% of total employment, aged 15-64)5.6 5.4 5.3 6.0 5.6 4.8
Fixed-term employment*
(% of employees with a fixed term contract, aged 15-64)13.3 14.5 16.9 20.2 22.2 20.9
Transition rate from temporary to permanent employment
(3-year average)41.5 35.5 : 30.8 : :
Long-term unemployment rate1 (% of labour force) 10.2 11.0 10.1 10.2 6.6 5.0
Youth unemployment rate
(% active population aged 15-24)42.2 49.9 44.9 42.3 31.8 26.4
Gender gap in part-time employment 2.3 1.8 2.5 2.5 2.7 2.0
Gender pay gap2 (in undadjusted form) 2.9 9.0 10.4 : : :
Education and training indicators 2012 2013 2014 2015 2016 2017
Adult participation in learning
(% of people aged 25-64 participating in education and training)3.3 3.1 2.8 3.1 3.0 :
Underachievement in education3 29.9 : : 32.0 : :
Tertiary educational attainment (% of population aged 30-34 having
successfully completed tertiary education)23.1 25.6 32.1 30.8 29.3 :
Variation in performance explained by students' socio-economic
status4 12.0 : : 12.1 : :

C. Standard Tables
64
Table C.4: Social inclusion and health indicators
* Non-scoreboard indicator
(1) At-risk-of-poverty rate (AROP): proportion of people with an equivalised disposable income below 60 % of the national
equivalised median income.
(2) Proportion of people who experience at least four of the following forms of deprivation: not being able to afford to i) pay
their rent or utility bills, ii) keep their home adequately warm, iii) face unexpected expenses, iv) eat meat, fish or a protein
equivalent every second day, v) enjoy a week of holiday away from home once a year, vi) have a car, vii) have a washing
machine, viii) have a colour TV, or ix) have a telephone.
(3) Percentage of total population living in overcrowded dwellings and exhibiting housing deprivation.
(4) People living in households with very low work intensity: proportion of people aged 0-59 living in households where the
adults (excluding dependent children) worked less than 20 % of their total work-time potential in the previous 12 months.
(5) Ratio of the median individual gross pensions of people aged 65-74 relative to the median individual gross earnings of
people aged 50-59.
(6) Fixed broadband take up (33%), mobile broadband take up (22%), speed (33%) and affordability (11%), from the Digital
Scoreboard..
Source: Eurostat, OECD
2012 2013 2014 2015 2016 2017
Expenditure on social protection benefits* (% of GDP)
Sickness/healthcare 7.0 7.5 7.0 6.9 : :
Disability 2.7 2.7 2.6 2.5 : :
Old age and survivors 8.7 9.0 9.2 9.0 : :
Family/children 1.6 1.6 1.5 1.5 : :
Unemployment 0.5 0.5 0.5 0.5 : :
Housing 0.0 0.0 0.0 0.0 : :
Social exclusion n.e.c. 0.2 0.2 0.2 0.2 : :
Total 20.7 21.4 21.0 20.7 : :
of which: means-tested benefits 1.0 1.1 1.0 1.0 : :
General government expenditure by function (% of GDP, COFOG)
Social protection 15.5 15.4 15.9 15.3 14.7 :
Health 7.2 6.5 6.6 6.4 6.5 :
Education 4.9 5.1 4.8 4.8 4.8 :
Out-of-pocket expenditure on healthcare (% of total health expenditure) : 12.1 15.0 15.2 : :
Children at risk of poverty or social exclusion (% of people
aged 0-17)*34.8 29.3 29.0 28.2 26.6 :
At-risk-of-poverty rate1 (% of total population) 20.4 19.5 19.4 20.0 19.5 :
In-work at-risk-of-poverty rate (% of persons employed) 6.0 6.2 5.7 5.9 5.6 :
Severe material deprivation rate2 (% of total population) 15.9 14.7 13.9 13.7 12.5 :
Severe housing deprivation rate3, by tenure status
Owner, with mortgage or loan 11.6 5.8 2.3 6.1 5.4 :
Tenant, rent at market price 17.6 7.1 16.0 15.0 7.6 :
Proportion of people living in low work intensity households4
(% of people aged 0-59)16.8 14.8 14.7 14.4 13.0 :
Poverty thresholds, expressed in national currency at constant prices* 20922 19330 19585 20544 21568 :
Healthy life years (at the age of 65)
Females 7.9 5.9 5.8 4.5 : :
Males 7.7 5.5 6.0 4.7 : :
Aggregate replacement ratio for pensions5 (at the age of 65) 0.4 0.4 0.4 0.4 0.4 :
Connectivity dimension of the Digital Economy and Society Inedex
(DESI)6
: : 29.9 35.4 42.0 45.0
GINI coefficient before taxes and transfers* 50.6 50.8 50.1 51.0 49.6 :
GINI coefficient after taxes and transfers* 30.9 30.9 30.2 30.6 29.7 :

C. Standard Tables
65
Table C.5: Product market performance and policy indicators
(1) The methodologies, including the assumptions, for this indicator are shown in detail here:
http://www.doingbusiness.org/methodology.
(2) Average of the answer to question Q7B_a. "[Bank loan]: If you applied and tried to negotiate for this type of financing
over the past six months, what was the outcome?". Answers were codified as follows: zero if received everything, one if
received most of it, two if only received a limited part of it, three if refused or rejected and treated as missing values if the
application is still pending or don't know.
(3) Percentage population aged 15-64 having completed tertiary education.
(4) Percentage population aged 20-24 having attained at least upper secondary education.
(5) Index: 0 = not regulated; 6 = most regulated. The methodologies of the OECD product market regulation indicators are
shown in detail here: http://www.oecd.org/competition/reform/indicatorsofproductmarketregulationhomepage.htm
(6) Aggregate OECD indicators of regulation in energy, transport and communications (ETCR).
Source: European Commission; World Bank — Doing Business (for enforcing contracts and time to start a business); OECD (for
the product market regulation indicators); SAFE (for outcome of SMEs' applications for bank loans).
Performance Indicators 2010 2011 2012 2013 2014 2015 2016
Labour productivity (real, per person employed, year-on-year %
change)
Labour productivity in Industry 1.27 -1.40 -1.40 3.47 1.03 8.16 2.59
Labour productivity in Construction 3.08 2.10 -3.22 -3.96 -0.21 -0.66 -2.53
Labour productivity in Market Services 0.67 6.37 -0.51 3.85 -2.50 3.48 1.91
Unit labour costs (ULC) (whole economy, year-on-year % change)
ULC in Industry 0.39 -0.38 5.93 1.49 -2.40 -1.38 -2.43
ULC in Construction 3.97 1.12 7.78 -2.46 -3.07 3.96 0.34
ULC in Market Services -1.87 -0.53 2.05 -1.94 1.24 -2.50 -0.56
Business Environment 2010 2011 2012 2013 2014 2015 2016
Time needed to enforce contracts(1)
(days) 561.0 561.0 572.0 572.0 572.0 572.0 572.0
Time needed to start a business(1)
(days) 15.5 15.0 15.0 15.0 15.0 12.0 7.0
Outcome of applications by SMEs for bank loans(2) na 0.17 na 0.19 0.88 0.31 0.60
Research and innovation 2010 2011 2012 2013 2014 2015 2016
R&D intensity 0.74 0.75 0.75 0.81 0.78 0.84 0.84
General government expenditure on education as % of GDP 5.10 4.90 4.90 5.10 4.70 4.70 na
Persons with tertiary education and/or employed in science and
technology as % of total employment31 30 32 36 37 38 38
Population having completed tertiary education(3) 16 15 16 17 19 20 20
Young people with upper secondary level education(4) 94 95 94 94 96 96 96
Trade balance of high technology products as % of GDP -1.48 -1.50 -1.27 -1.48 -1.52 -1.72 na
Product and service markets and competition 2003 2008 2013
OECD product market regulation (PMR)(5)
, overall na na 2.08
OECD PMR5, retail na na 1.42
OECD PMR5, professional services na na 3.70
OECD PMR5, network industries(6) na na 2.75

C. Standard Tables
66
Table C.6: Green growth
All macro intensity indicators are expressed as a ratio of a physical quantity to GDP (in 2010 prices)
Energy intensity: gross inland energy consumption (in kgoe) divided by GDP (in EUR)
Carbon intensity: greenhouse gas emissions (in kg CO2 equivalents) divided by GDP (in EUR)
Resource intensity: domestic material consumption (in kg) divided by GDP (in EUR)
Waste intensity: waste (in kg) divided by GDP (in EUR)
Energy balance of trade: the balance of energy exports and imports, expressed as % of GDP
Weighting of energy in HICP: the proportion of 'energy' items in the consumption basket used for the construction of the HICP
Difference between energy price change and inflation: energy component of HICP, and total HICP inflation (annual %
change)
Real unit energy cost: real energy costs as % of total value added for the economy
Industry energy intensity: final energy consumption of industry (in kgoe) divided by gross value added of industry (in 2010 EUR)
Real unit energy costs for manufacturing industry excluding refining : real costs as % of value added for manufacturing
sectors
Share of energy-intensive industries in the economy: share of gross value added of the energy-intensive industries in GDP
Electricity and gas prices for medium-sized industrial users: consumption band 500–20 00MWh and 10 000–100 000 GJ; figures
excl. VAT.
Recycling rate of municipal waste: ratio of recycled and composted municipal waste to total municipal waste
Public R&D for energy or for the environment: government spending on R&D for these categories as % of GDP
Proportion of GHG emissions covered by EU emissions trading system (ETS) (excluding aviation): based on GHG emissions
(excl land use, land use change and forestry) as reported by Member States to the European Environment Agency.
Transport energy intensity: final energy consumption of transport activity (kgoe) divided by transport industry gross value
added (in 2010 EUR)
Transport carbon intensity: GHG emissions in transport activity divided by gross value added of the transport sector
Energy import dependency: net energy imports divided by gross inland energy consumption incl. consumption of
international bunker fuels
Aggregated supplier concentration index: covers oil, gas and coal. Smaller values indicate larger diversification and hence
lower risk.
Diversification of the energy mix: Herfindahl index covering natural gas, total petrol products, nuclear heat, renewable
energies and solid fuels
* European Commission and European Environment Agency
Source: European Commission and European Environment Agency (Share of GHG emissions covered by ETS); European
Commission (Environmental taxes over labour taxes and GDP); Eurostat (all other indicators)
Green growth performance 2011 2012 2013 2014 2015 2016
Macroeconomic
Energy intensity kgoe / € 0.21 0.20 0.20 0.19 0.19 0.19
Carbon intensity kg / € 0.60 0.57 0.55 0.53 0.53 -
Resource intensity (reciprocal of resource productivity) kg / € 0.98 0.92 0.97 0.88 0.92 0.92
Waste intensity kg / € - 0.08 - 0.09 - -
Energy balance of trade % GDP -5.4 -5.6 -5.1 -4.0 -3.4 -2.7
Weighting of energy in HICP % 13.19 14.47 15.74 16.49 14.87 10.78
Difference between energy price change and inflation % 0.3 11.4 2.6 -0.2 -2.7 -4.4
Real unit of energy cost% of value
added18.9 20.3 19.8 20.0 - -
Ratio of environmental taxes to labour taxes ratio 0.23 0.22 0.24 0.26 0.28 -
Environmental taxes % GDP 2.7 2.6 2.9 3.2 3.4 3.5
Sectoral
Industry energy intensity kgoe / € 0.17 0.15 0.16 0.15 0.14 -
Real unit energy cost for manufacturing industry excl.
refining
% of value
added13.3 13.0 13.0 13.3 - -
Share of energy-intensive industries in the economy % GDP - - - - - -
Electricity prices for medium-sized industrial users € / kWh 0.09 0.09 0.09 0.09 0.09 0.09
Gas prices for medium-sized industrial users € / kWh 0.04 0.04 0.04 0.04 0.04 0.03
Public R&D for energy % GDP 0.00 0.00 0.00 0.00 0.00 0.00
Public R&D for environmental protection % GDP 0.00 0.00 0.00 0.00 0.00 0.00
Municipal waste recycling rate % 8.3 14.7 14.9 16.5 18.0 21.0
Share of GHG emissions covered by ETS* % 38.6 37.5 37.0 36.7 37.2 36.6
Transport energy intensity kgoe / € 1.16 1.20 1.25 1.23 1.23 -
Transport carbon intensity kg / € 3.30 3.36 3.51 3.43 3.48 -
Security of energy supply
Energy import dependency % 49.4 49.0 47.1 43.8 48.3 47.8
Aggregated supplier concentration index HHI 26.2 19.8 28.2 19.5 14.7 -
Diversification of energy mix HHI 0.27 0.27 0.28 0.28 0.27 0.27

67
Bejaković, P. and al. (IPSOS) (2016), External evaluation of active labour market policy measures 2010-
2013. Summary evaluation report, Croatian Employment Service, Zagreb
(www.hzz.hr/UserDocsImages/Sumarno%20evaluacijsko%20izvje%C5%A1%C4%87e_ENG_Vanjska%
20evaluacija%20mjera%20aktivne%20politike%20tr%C5%BEi%C5%A1ta%20rada%202010%20-
2013.pdf).
Berti, K. et al. (2012), 'An early-detection index of fiscal stress for EU countries', European Economy
Economic Paper, No 475, European Commission (DG Economic and Financial Affairs (DG ECFIN)),
Brussels (http://ec.europa.eu/economy_finance/publications/economic_paper/2012/pdf/ecp475_en.pdf).
Brčić Kuljiš, M. and M. Koludrović (2016), Stanje i perspektive obrazovanja odraslih u Republici
Hrvatskoj. Zbornik radova znanstveno-stručnog kolokvija, Filozofski Fakultet u Splitu, Split
(https://ec.europa.eu/epale/sites/epale/files/zbornik_radova_znanstveno-strucnog_kolokvija_-
_stanje_i_perspektive_obrazovanja_odraslih_u_republici_hrvatskoj_2016.pdf).
Center for Peace Studies (2016), Geometar nejednakosti, IPA 2011 Project
(http://nejednakost.cms.hr/obrazovanje/).
Croatian National Bank (2017), Financial Stability Report, No 18, Croatian National Bank, Zagreb
(www.hnb.hr/documents/20182/1972383/e-fs-18-2017.pdf/c738405d-b8b7-4e6f-9819-2e0f72e39715).
Dobrotić, I. and Matković, T. (2017), Pokazatelji obuhvaćenosti i ulaganja u redovne programe ranog i
predškolskog odgoja i obrazovanja u Hrvatskoj u kontekstu postizanja ciljeva iz Barcelone i pedagoškog
standarda, unpublished.
Ecorys Netherlands and Mazars (2017), Study about administrative formalities of important procedures
and administrative burdens for businesses, study for the European Commission (DG for Internal Market,
Industry, Entrepreneurship and SMEs (DG GROWTH)), European Commission, Luxembourg
(https://ec.europa.eu/growth/content/study-about-administrative-formalities-important-procedures-and-
administrative-burdens-0_en).
European Centre for the Development of Vocational Training (CEDEFOP) and European Commission
(DG for Employment, Social Affairs and Inclusion (DG EMPL)) (2017), Skills anticipation in Croatia,
Skills Panorama (http://skillspanorama.cedefop.europa.eu/en/analytical_highligths/skills-anticipation-
croatia).
European Commission (2015), Attitudes of Europeans towards Tourism, Flash Eurobarometer, No 370,
European Union, Brussels (https://data.europa.eu/euodp/data/dataset/S1072_370).
European Commission (2016a), Annual Implementation Report on the Operational Programme
Competitiveness and Cohesion 2014-2020, European Commission, Brussels.
European Commission (DG for Economic and Financial Affairs (DG ECFIN)) (2016b), Country report
Croatia 2016. Including an in-depth review on the prevention and correction of macroeconomic
imbalances, European Economy Institutional Papers, European Commission, Brussels
(https://ec.europa.eu/info/sites/info/files/2017-european-semester-country-report-croatia-en.pdf).
European Commission (2016c), Progress Report on the implementation of Partnership Agreement,
European Commission, Brussels.
European Commission (2016d), Report on Public Finances in EMU, European Economy Institutional
Papers, No 45, Publications Office of the European Union, Luxembourg
(https://ec.europa.eu/info/sites/info/files/ip045_en_0.pdf).
REFERENCES

References
68
European Commission (2016e), Public opinion in the European Union, Standard Eurobarometer, No 85,
European Union, Brussels (http://data.europa.eu/euodp/en/data/dataset/S2130_85_2_STD85_ENG).
European Commission (DG for Employment, Social Affairs and Inclusion (DG EMPL)) (2017a), 2018
European Semester: Draft Joint Employment Report, European Commission, Brussels
(https://ec.europa.eu/info/publications/2018-european-semester-draft-joint-employment-report_en).
European Commission (2017b), Alert Mechanism Report 2018, European Commission, Brussels
(https://ec.europa.eu/info/sites/info/files/economy-finance/com-2017-771-en.pdf).
European Commission (2017c), Benchmarks for the assessment of private debt, Note for the Economic
Policy Committee.
European Commission (2017d), Businesses’ attitudes towards corruption in the EU, Flash Business
Eurobarometer, No 457, European Union, Brussels
(https://data.europa.eu/euodp/data/dataset/S2177_457_ENG).
European Commission (2017e), Corruption. Report, Special Eurobarometer, No 470, European Union,
Brussels (https://data.europa.eu/euodp/data/dataset/S2176_88_2_470_ENG).
European Commission (DG for Economic and Financial Affairs (DG ECFIN)) (2017f), Country report
Croatia 2017. Including an in-depth review on the prevention and correction of macroeconomic
imbalances, European Economy Institutional Papers, European Commission, Brussels
(https://ec.europa.eu/info/sites/info/files/2017-european-semester-country-report-croatia-en.pdf).
European Commission (2017g), Digital economy and society index 2017 – Croatia, European
Commission, Brussels (https://ec.europa.eu/digital-single-market/en/news/digital-economy-and-society-
index-desi-2017).
European Commission (2017h), Education and Training Monitor 2017 — Country Analysis, Croatia,
Publications Office of the European Union, Luxembourg
(http://ec.europa.eu/education/sites/education/files/monitor2017_en.pdf).
European Commission (2017i), Empirical current account benchmarks: modelling the impact of
demographic variables, LIME Working Group, 24 April 2017.
European Commission (DG for Employement, Social Affairs and Inclusion (DG EMPL)) (2017j), Labour
Market and Wage Developments in Europe. Annual Review 2017, Publications Office of the European
Union, Luxembourg (https://publications.europa.eu/en/publication-detail/-/publication/2df2eaca-b3b0-
11e7-837e-01aa75ed71a1/language-en).
European Commission (DG Taxation and Customs Union (DG TAXUD)) (2017k), Taxation Trends in
the European Union. Data for the EU Member States, Iceland and Norway. 2018 edition, European
Union, Luxembourg
(https://ec.europa.eu/taxation_customs/sites/taxation/files/taxation_trends_report_2017.pdf).
European Commission (2018a), Digital Scoreboard.
European Commission (DG Taxation and Customs Union (DG TAXUD)) (2018b), Taxation trends in the
european union. Data for the EU member states, Iceland and Norway. 2018 edition, Publications Office
of the European Union, Luxembourg, forthcoming.

References
69
European Commission (2018c), European Public Administration Country Knowledge (EUPACK)
(https://www.hertie-school.org/en/eupack/).
European Investment Bank (EIB) (2017), 'EIB Group reaffirms commitment to financing in the Western
Balkans', EIF press release, Luxembourg
(www.eif.org/what_we_do/equity/news/2017/wbedif_cosme_western_balkans.htm).
EY (2017), EMEIA fraud survey 2017 (https://fraudsurveys.ey.com/).
GAN Integrity (2017), Croatia corruption report, GAN (www.business-anti-corruption.com/country-
profiles/croatia).
National Statistics Office (2017), Gross domestic product for republic of Croatia. Nuts 2013 – 2nd level
and counties, 2014, (https://www.dzs.hr/Hrv_Eng/publication/2017/12-01-03_01_2017.htm).
OECD and European Observatory on Health Systems and Policies (2017), Croatia: country health profile
2017, State of Health in the EU, OECD Publishing / European Observatory on Health Systems and
Policies, Paris / Brussels (http://dx.doi.org/10.1787/9789264283312-en).
Ott, K. and al. (Institute of Public Finance) (2017), Budget transparency in Croatian counties, cities and
municipalities, Institute of Public Finance, Zagreb (www.ijf.hr/upload/files/file/ENG/newsletter/112.pdf).
Podumljak, M. and E. Dávid-Barrett (2015), The public procurement of construction works: the case of
Croatia, Anticorrp Project, Partnership for Social Development, Zagreb
(https://www.vkontrole.lt/tf/files/files/The%20Public%20Procurement%20of%20Construction%20Work-
The%20Case%20of%20Croatia.pdf).
Simoes, A. J. G. and C. A. Hidalgo (2011), 'The Economic Complexity Observatory: An Analytical Tool
for Understanding the Dynamics of Economic Development', Scalable Integration of Analytics and
Visualization, Papers from the 2011 AAAI Workshop, Association for the Advancement of Artificial
Intelligence (AAI), Palo Alto
(https://pdfs.semanticscholar.org/7733/68ce1faa36d9ac833b3c3412d136033b91c1.pdf).
South East European Centre for Entrepreneurial Learning (SEECEL) (2017), Strengthening the capacities
of the chambers and partners to help SMEs to engage in apprenticeship. Analysis of the current status of
the apprenticeship scheme in Croatia, Project Cap4App, Croatian Chamber of Economy, Zagreb
(www.hgk.hr/documents/seecel-reportfinalreviewed58e5fad85b0fe.pdf).
Vehovec, M. (ed.) (2014), O zdravstvu iz ekonomske perspective, Ekonomski institut, Zagreb
(www.eizg.hr/hr-HR/O-zdravstvu-iz-ekonomske-perspektive-1417.aspx).
World Bank (2017a), Doing business 2018. Reforming to create jobs, World Bank Group flagship report,
International Bank for Reconstruction and Development / The World Bank, Washington DC
(www.doingbusiness.org/~/media/WBG/DoingBusiness/Documents/Annual-Reports/English/DB2018-
Full-Report.pdf).
World Bank (2017b), Worldwide Governance Indicators
(http://info.worldbank.org/governance/wgi/index.aspx#home).
World Economic Forum (2017), Global competitiveness index 2017–2018, Croatia: Executive opinion
survey.