2018 fsoc annual report (revised june 2019) · ii. 2018 fsoc // annual report. statutory...
TRANSCRIPT

2018ANNUAL REPORT
FINANCIA L STABIL IT Y OVERSIGHT COUNCIL


i
Financial Stability Oversight Council
The Financial Stability Oversight Council (Council) was established by the Dodd-Frank Wall Street Reform and Consumer Protection Act (Dodd-Frank Act) and is charged with three primary purposes:
1. To identify risks to the financial stability of the United States that could arise from the material financial distress or failure, or ongoing activities, of large, interconnected bank holding companies or nonbank financial companies, or that could arise outside the financial services marketplace.
2. To promote market discipline, by eliminating expectations on the part of shareholders, creditors, and counterparties of such companies that the U.S. government will shield them from losses in the event of failure.
3. To respond to emerging threats to the stability of the U.S. financial system.
Pursuant to the Dodd-Frank Act, the Council consists of ten voting members and five nonvoting members and brings together the expertise of federal financial regulators, state regulators, and an insurance expert appointed by the President.
The voting members are:
• the Secretary of the Treasury, who serves as the Chairperson of the Council;• the Chairman of the Board of Governors of the Federal Reserve System;• the Comptroller of the Currency; • the Director of the Bureau of Consumer Financial Protection;• the Chairman of the Securities and Exchange Commission;• the Chairperson of the Federal Deposit Insurance Corporation;• the Chairperson of the Commodity Futures Trading Commission;• the Director of the Federal Housing Finance Agency;• the Chairman of the National Credit Union Administration; and• an independent member having insurance expertise who is appointed by the President
and confirmed by the Senate for a six-year term.
The nonvoting members, who serve in an advisory capacity, are:
• the Director of the Office of Financial Research;• the Director of the Federal Insurance Office;• a state insurance commissioner designated by the state insurance commissioners;• a state banking supervisor designated by the state banking supervisors; and• a state securities commissioner (or officer performing like functions) designated by the
state securities commissioners.
The state insurance commissioner, state banking supervisor, and state securities commissioner serve two-year terms.
F inanc ia l S tab i l i t y Ove rs ight Counc i l

2 0 1 8 F S O C / / Annual Reportii
Statutory Requirements for the Annual ReportSection 112(a)(2)(N) of the Dodd-Frank Act requires that the annual report address the following:
i. the activities of the Council;ii. significant financial market and regulatory developments, including
insurance and accounting regulations and standards, along with anassessment of those developments on the stability of the financialsystem;
iii. potential emerging threats to the financial stability of theUnited States;
iv. all determinations made under Section 113 or Title VIII, and thebasis for such determinations;
v. all recommendations made under Section 119 and the result of suchrecommendations; and
vi. recommendations—I. to enhance the integrity, efficiency, competitiveness, and stability
of United States financial markets;II. to promote market discipline; andIII. to maintain investor confidence.
Approval of the Annual ReportThis annual report was approved unanimously by the voting members of the Council on December 19, 2018.
Abbreviations for Council Member Agencies and Member Agency Offices• Department of the Treasury (Treasury)• Board of Governors of the Federal Reserve System (Federal Reserve)• Office of the Comptroller of the Currency (OCC)• Bureau of Consumer Financial Protection (BCFP)• Securities and Exchange Commission (SEC)• Federal Deposit Insurance Corporation (FDIC)• Commodity Futures Trading Commission (CFTC)• Federal Housing Finance Agency (FHFA)• National Credit Union Administration (NCUA)• Office of Financial Research (OFR)• Federal Insurance Office (FIO)

iiiContents
Contents
1 Member Statement ...................................................... 1
2 Executive Summary ..................................................... 3
3 Annual Report Recommendations ............................... 73.1 Cybersecurity .....................................................................................7
3.2 Central Counterparties ........................................................................8
3.3 Reference Rates .................................................................................8
3.4 Capital, Liquidity, and Resolution .........................................................9
3.5 Wholesale Funding Markets ................................................................9
3.6 Financial Innovation .........................................................................10
3.7 Data Quality, Collection, and Sharing .................................................10
3.8 Managing Vulnerabilities amid Prolonged Credit Expansion ..............................................................................11
3.9 Housing Finance Reform ...................................................................11
3.10 Changes in Financial Market Structure .............................................12
3.11 Asset Management Products and Activities .......................................12
3.12 Regulatory Efficiency and Effectiveness ...........................................13
4 Financial Developments ............................................. 154.1 U.S. Treasuries .................................................................................15
4.2 Sovereign Debt Markets ....................................................................17
4.3 Corporate Credit ..............................................................................25
4.4 Household Credit ..............................................................................28
4.5 Real Estate Markets .........................................................................30
4.6 Foreign Exchange .............................................................................39
4.7 Equities ...........................................................................................41
4.8 Commodities ....................................................................................42
4.9 Wholesale Funding Markets ............................................................. 43
4.10 Derivatives Markets ..........................................................................47
Box A: A New Way to Measure Risk in the Interest Rate Swaps Market ..........50

2 0 1 8 F S O C / / Annual Reportiv
4.11 Bank Holding Companies and Depository Institutions .........................57
4.12 Nonbank Financial Companies ..........................................................72
4.13 Investment Funds .............................................................................78
4.14 New Financial Products and Services ...............................................87
Box B: The Council’s Digital Assets Working Group ......................................89
5 Regulatory Developments and Council Activities ..... 935.1 Safety and Soundness ......................................................................93
5.2 Financial Infrastructure, Markets, and Oversight ...............................98
5.3 Mortgages, Consumer Protection, and Community Reinvestment Act ............................................................................101
5.4 Data Scope, Quality, and Accessibility .............................................102
5.5 Council Activities ............................................................................103
6 Potential Emerging Threats and Vulnerabilities ..... 1076.1 Cybersecurity: Vulnerabilities to Attacks on Financial Services .........107
6.2 Ongoing Structural Vulnerabilities ....................................................107
Box C: The Transition to Alternative Reference Rates .........................................109
6.3 Managing Vulnerabilities amid Prolonged Credit Expansion .............. 112
6.4 Changes in Financial Market Structure and Implications for Financial Stability ...................................................................... 112
Box D: U.S. Equity Volatility Event on February 5, 2018 .....................................114
6.5 Asset Management Products and Activities ..................................... 115
6.6 Global Economic and Financial Developments ................................. 115
Box E: Risks Associated with United Kingdom Exit from the European Union .............................................................................. 117
Abbreviations .................................................................119
Glossary ........................................................................ 127
List of Charts ............................................................... 137
This publication was revised on June 20, 2019, to add text in Section 6.4 that was originally omitted due to a production error.

1Member S tatement
The Honorable Paul D. Ryan Speaker of the House United States House of Representatives
The Honorable Nancy Pelosi Democratic Leader United States House of Representatives
The Honorable Michael R. Pence President of the Senate United States Senate
The Honorable Mitch McConnell Majority Leader United States Senate
The Honorable Charles E. Schumer Democratic Leader United States Senate
In accordance with Section 112(b)(2) of the Dodd-Frank Wall Street Reform and Consumer Protection Act, for the reasons outlined in the annual report, I believe that additional actions, as described below, should be taken to ensure financial stability and to mitigate systemic risk that would negatively affect the economy: the issues and recommendations set forth in the Council’s annual report should be fully addressed; the Council should continue to build its systems and processes for monitoring and responding to emerging threats to the stability of the United States financial system, including those described in the Council’s annual report; the Council and its member agencies should continue to implement the laws they administer, including those established by, and amended by, the Dodd-Frank Act, through efficient and effective measures; and the Council and its member agencies should exercise their respective authorities for oversight of financial firms and markets so that the private sector employs sound financial risk-management practices to mitigate potential risks to the financial stability of the United States.
1 Member Statement
Steven T. Mnuchin Secretary of the Treasury Chairperson, Financial Stability Oversight Council
Joseph Otting Comptroller of the Currency Office of the Comptroller of the Currency
Jay Clayton Chairman Securities and Exchange Commission
J. Christopher GiancarloChairmanCommodity Futures Trading Commission
J. Mark McWattersChairmanNational Credit Union Administration
Jerome H. Powell Chairman Board of Governors of the Federal Reserve System
Kathleen Kraninger Director Bureau of Consumer Financial Protection
Jelena McWilliams Chairman Federal Deposit Insurance Corporation
Melvin L. Watt Director Federal Housing Finance Agency
Thomas E. Workman. Independent Member Having Insurance Expertise Financial Stability Oversight Council


3E xecut i ve Summar y
Since the publication of the Council’s last annual report in December 2017, the U.S. economy continued its long expansion, unemployment declined to long-term lows, and financial conditions remained broadly stable, notwithstanding short bouts of volatility. U.S. interest rates increased further from the extraordinarily low levels of the post-crisis period, as the Federal Reserve continued to tighten monetary policy. Key U.S. asset prices appreciated further, in part reflecting the economy’s strength, with valuations notably elevated in U.S. equities, corporate debt, and some residential and commercial real estate (CRE) markets.
Overall, risks to U.S. financial stability remain moderate, though they have evolved since the last annual report, as described in Section 6. At the same time, financial stability risks outside the U.S. appear to have increased; most notably, the potential for a disorderly United Kingdom (UK) exit from the European Union (EU) in March 2019 could have serious implications for the functioning of some global financial markets and firms. Maintaining a resilient financial system is important in large part because the economic well-being of Americans depends on the financial system’s ability to provide capital to businesses and individuals, to provide vehicles for savings, and to intermediate financial transactions even in the face of adverse events. As a result of post-crisis regulatory reforms, the U.S. financial system is clearly stronger and much better positioned to withstand a shock or an economic downturn than it was before the financial crisis. The Council is encouraged by the strong economic growth in the past two years; nonetheless, the Council remains vigilant regarding potential emerging threats to financial stability.
Since the Council’s last annual report, actions by financial regulatory agencies have included the application of supervisory and company-run stress tests; supervisory review and feedback on large banking organizations’ resolution plans; implementation of additional reforms of the
derivatives markets and amendments to disclosure requirements for mutual funds and exchange-traded funds (ETFs); enhanced safeguards related to operational risks for technological systems and cybersecurity; and improvements in data scope, quality, and accessibility. Notably, the Economic Growth, Regulatory Relief, and Consumer Protection Act (EGRRCPA) was signed into law in May 2018. Consistent with EGRRCPA, regulators have taken steps to further tailor existing regulations.
In October 2018, the Council rescinded its previous determination that material financial distress at Prudential Financial, Inc. (Prudential) could pose a threat to U.S. financial stability and that Prudential shall be subject to supervision by the Federal Reserve and enhanced prudential standards. The Council’s decision was based on extensive analysis that indicated there is not a significant risk that the company could pose a threat to financial stability.
Over the past year, Council member agencies have also taken steps designed to make financial services regulations more efficient and effective. Five agencies proposed changes to modify requirements under the Volcker Rule, without diminishing the safety and soundness of banking entities. The Federal Reserve removed enhanced prudential standards and other requirements for bank holding companies (BHCs) with less than $100 billion in assets; additionally, it proposed to create a single, integrated capital requirement by combining the quantitative assessment of the Comprehensive Capital Analysis and Review (CCAR) program with the buffer requirements in the Federal Reserve’s regulatory capital rule. The SEC proposed a rule to create a consistent, transparent, and efficient regulatory framework for ETFs. The OCC issued an advance notice of proposed rulemaking (ANPR) seeking public comment on ways to transform or modernize the regulations that implement the Community Reinvestment Act (CRA). Council member agencies should, where possible and without reducing the resilience of the financial
2 Executive Summary
2 0 1 8 F S O C / / Annual Report4
system, continue to address regulatory overlap and duplication, modernize outdated regulations, and, where authority exists, tailor regulations based on the size and complexity of financial institutions. The EGRRCPA, signed into law in May 2018, should provide more tools for Council member agencies to achieve these objectives.
Separately, the Council notes the potential for an increasing federal government debt burden to negatively impact long-term financial stability. Government budgets were strained by the cyclical response of revenues and expenditures after the financial crisis as well as the fiscal actions taken to ease the recession and aid the recovery. U.S. federal government debt held by the public stood at 76 percent of gross domestic product (GDP) as of September 2018. The Congressional Budget Office (CBO) projects that the debt burden could increase in an accelerating manner in the coming decades. Achieving long-term sustainability of the national budget is important to maintain global market confidence in U.S. Treasury securities and the financial stability of the United States.
The Council also remains focused on promoting market discipline to reduce the risk of future financial crises. While financial institutions may be more resilient to market disruptions due in part to increased capital and liquidity requirements since the financial crisis, market discipline reduces the likelihood of future market disruptions resulting from unwarranted risk-taking. The Council will work with regulators to analyze ways to promote market discipline and reduce any lingering perceptions that some institutions are too big to fail.
CybersecurityAs the financial system increases its reliance on information technology, the risk increases that a cybersecurity event in the industry will have severe negative consequences, potentially entailing systemic implications for the financial sector and the U.S. economy. The Council recommends that member agencies ensure a robust and consistent standard of cybersecurity monitoring and examinations of financial markets, institutions, and infrastructures. At the same time, the unique and complex threats posed by cyber risks require the
public and private sectors to cooperate to identify, understand, and protect against these risks. The Council supports the use and development of these partnerships, including efforts to increase harmonization of cybersecurity examinations across regulatory authorities.
Central CounterpartiesDue to the critical role central counterparties (CCPs) play in financial markets, effective regulation and risk management of CCPs is essential to financial stability. Consistent with the requirements adopted by the financial regulators, CCPs have made considerable progress in improving risk management practices and providing greater transparency in their functioning. Member agencies should continue to evaluate whether existing rules and standards for CCPs and their clearing members are sufficiently robust to mitigate potential threats to financial stability. Agencies should also continue working with international standard-setting bodies to identify and address areas of common concern as additional derivatives clearing requirements are implemented in other jurisdictions. Supervisory agencies should continue to conduct evaluations of the performance of CCPs under stress scenarios. Agencies should also continue to monitor and assess interconnections among CCPs, their clearing members, and other financial institutions; assess appropriate quantitative data disclosure standards; and promote further recovery planning and development of resolution plans for systemically important CCPs.
Reference RatesThe weaknesses of the London Interbank Offered Rate (LIBOR) may undermine market integrity and the uncertainty surrounding its sustainability could threaten U.S. financial institutions and the U.S. financial system more broadly. The Council commends the progress of the Alternative Reference Rates Committee (ARRC) in identifying the Secured Overnight Financing Rate (SOFR) as an appropriate alternative reference rate and in its subsequent steps to facilitate a transition to SOFR. The Council encourages the ARRC to complete its work to achieve a smooth transition away from LIBOR. The Council also encourages market participants to consider potential uses of SOFR in

5E xecut i ve Summar y
new transactions. Where participants choose to continue to reference LIBOR, they are encouraged to make the LIBOR-linked contracts more robust in the event that the publication of LIBOR were to cease, in accordance with guidance provided by the ARRC. The Council recommends that member agencies work closely with market participants to identify and mitigate risks from potential dislocations during the transition process.
Capital, Liquidity, and ResolutionIn the years since the financial crisis, financial institutions have made significant progress in improving their resiliency by decreasing their leverage and improving their ability to respond to draws on their liquidity. Large BHCs engaged in the resolution planning process have also made important changes to their structure and operations in order to improve resolvability. The banking and financial regulatory agencies have adopted rules intended to further increase the robustness of these institutions and enhance financial stability. Agencies should ensure that the largest financial institutions maintain sufficient capital and liquidity to reduce their vulnerability to economic and financial shocks. Regulators should also continue to monitor and assess the impact of rules on financial institutions and markets, including on market liquidity and incentives to centrally clear derivatives.
Wholesale Funding Markets Since the financial crisis, considerable progress has been made in the reduction of counterparty risk exposures in repurchase agreement (repo) markets; nonetheless, the potential for post-default fire sales of collateral in these markets remains a vulnerability. The Council recommends that financial regulators continue to closely monitor these important markets, including an assessment of the increased concentration risk in the tri-party repo market. Understanding of the bilateral repo market can also be improved considerably and could be aided by the proposed data collection on centrally cleared repo transactions by the OFR. Separately, the Council recommends that the SEC continue to monitor the impact of its 2016 reforms of money market mutual funds (MMFs), and that regulators assess the potential risks that might be posed by other types of cash management vehicles.
Financial InnovationNew financial products and practices can offer substantial benefits to consumers and businesses, including by meeting emerging needs or reducing costs. These new products and practices may also create new risks and vulnerabilities. Agencies should continue to monitor and analyze the effects of new financial products and services on consumers, regulated entities, and financial markets, and evaluate their potential effects on financial stability. These efforts should take into account the fact that existing monitoring and data collection systems may not identify new products or practices, requiring additional information gathering and sharing by agencies, as appropriate.
Data Quality, Collection, and SharingThe financial crisis revealed gaps in the data needed for effective oversight of the financial system and internal firm risk management and reporting capabilities. Since the financial crisis, important steps have been taken, including developing and implementing new identifiers of financial data. Significant gaps remain, however, as some market participants continue to use legacy processes that rely on data that are not aligned to definitions from relevant consensus-based standards and inhibit data sharing. Regulators and market participants should continue to work together to improve the coverage, quality, and accessibility of financial data, as well as data sharing among relevant agencies.
Managing Vulnerabilities amid Prolonged Credit ExpansionU.S. credit growth and asset prices reflect, in part, strong economic conditions amid the long economic expansion. Certain metrics indicate that nonfinancial corporate debt and leverage are elevated. In addition, there are some indications that valuations may be elevated in key U.S. financial markets, including equities, corporate debt, and some commercial and residential real estate. Downturns in these markets can occur with little warning and in response to a range of factors. Elevated leverage and asset valuations can make such downturns more severe. The Council recommends that agencies continue to monitor levels of nonfinancial business leverage, trends in asset valuations, and potential implications for the

2 0 1 8 F S O C / / Annual Report6
entities they regulate in order to assess and reinforce their ability to manage severe, simultaneous losses in those markets. Assuring that the relevant investors and intermediaries can manage such losses, rather than amplify or transmit them, will reduce the risk to financial stability such a scenario could pose.
Housing Finance ReformFannie Mae and Freddie Mac (the Enterprises) are now into their eleventh year of conservatorship. While regulators and supervisors have taken great strides to work within the constraints of conservatorship to promote greater investment of private capital and improve operational efficiency with lower costs, the Council reaffirms its view that housing finance reform is urgently needed to address the present conservatorships of the Enterprises, codify existing reforms, and implement a more durable and vibrant housing financial system that enhances financial stability.
Changes in Financial Market StructureChanges in market structure—such as the increased use of automated trading systems, the ability to quote and execute transactions at higher speeds, the increased diversity in the types of liquidity providers in such markets, and the expansion in trading venues—have the potential to make financial markets more efficient and transparent. Such changes and complexities also have the potential to create unanticipated risks that can interrupt normal financial market functioning or, in a severe case, amplify threats to financial stability. It is therefore important that financial regulators and market participants continue to evaluate any changes that might have adverse effects on markets, assess the complex linkages among markets and other factors that could cause stress to propagate across markets, and consider potential ways to mitigate these risks. The Council encourages member agencies to continue to evaluate the use of coordinated tools such as trading halts across interdependent markets, while being mindful of the tradeoffs such tools might entail.
Asset Management Products and ActivitiesEnsuring that adequate information is available to evaluate risks in the asset management industry remains a Council focus. The Council notes that the SEC issued and amended rules for registered investment companies designed to promote effective liquidity risk management and provide for enhanced data reporting; the SEC is also considering re-proposing a rule regarding the use of derivatives by these companies. The Council recommends that the SEC monitor the implementation of these rules and evaluate the extent to which they address potential risks in the asset management industry. For private funds, the Council recommends that relevant agencies continue to review their data collections and assess whether they are sufficient to allow the Council to monitor whether and how private funds may pose risks to financial stability.

7Annua l Repor t Recommendat ions
3 Annual Report Recommendations
3.1 Cybersecurity
The financial system’s increasing reliance on information technology, particularly across a broader array of interconnected platforms, increases the risk that a cybersecurity event could have severe negative consequences for the provision of financial services. As discussed in Section 6.1, there are several channels through which a cybersecurity event could threaten the stability of the broader financial system.
Sustained senior-level attention on cybersecurity risks and their potential systemic implications is necessary. The Council recommends that member agencies ensure a robust and consistent standard of cybersecurity monitoring and examination of financial markets, institutions, and infrastructures. The Council also encourages continued partnership across government agencies and private firms to enhance financial sector capabilities to mitigate vulnerabilities and maintain a strong cybersecurity posture. The Council supports the work of such partnerships, including the Financial and Banking Information Infrastructure Committee (FBIIC), the Financial Services Sector Coordinating Council (FSSCC), and the Financial Services Information Sharing and Analysis Center (FS-ISAC).
The financial sector’s ability to rapidly respond to and recover from cybersecurity incidents is critical to reducing the potential threat to financial stability. The Council therefore recommends that the FBIIC continue to promote processes to strengthen response and recovery efforts, including efforts to address the systemic implications of significant cybersecurity incidents. It is important that this work include an emphasis on attaining a level of cybersecurity preparedness and operational resiliency in the sector that reduces the likelihood of a systemic disruption of business activity or significant exfiltration of data. Furthermore, the Council encourages FBIIC agencies to jointly catalog and analyze regulatory tools, expertise, and
authorities to respond to cybersecurity incidents, and address any identified gaps. The Council also recommends that the FBIIC continue to work closely with the Department of Homeland Security (DHS), law enforcement, and industry partners to carry out regular cybersecurity exercises—recognizing the interdependencies with other sectors, such as telecommunications and energy—and the Council encourages continued involvement in such efforts.
Sharing timely and actionable cybersecurity information among private sector firms and the government is critical. Relevant agencies, through DHS, should carefully consider how to share information appropriately and, where possible, continue efforts to declassify (or downgrade classification) of information to the extent practicable, consistent with national security needs. Separately, the Council recommends that agencies continue to support efforts to implement the Automated Indicator Sharing (AIS) program developed by the DHS and other efforts to encourage automated information sharing on cybersecurity.
The Council recommends that agencies work to harmonize cybersecurity supervision and regulation, where appropriate. The Council supports the efforts of the FBIIC Harmonization Working Group, which considers how cybersecurity examinations can be further coordinated across regulators and how to establish a common cybersecurity lexicon.
The Council encourages the relevant agencies to continue to work with international partners in appropriate forums, such as the work of the Financial Stability Board (FSB) to promote a common international lexicon on cybersecurity.
Maintaining confidence in the security practices of third-party service providers has become increasingly important, particularly because different financial institutions are often serviced by the same providers. The Council supports efforts to ensure agencies have the authorities

2 0 1 8 F S O C / / Annual Report8
necessary to supervise and enhance third-party service provider information security. Some Council member agencies that supervise financial institutions have examination, regulatory and, in some cases, enforcement powers over certain third-party service providers. The Council recommends that Congress pass legislation that ensures that the federal banking agencies, FHFA, and NCUA have adequate examination and enforcement powers to oversee third-party service providers. The Council also recommends that the federal banking regulators continue to work together to coordinate third-party service provider oversight and work with the Conference of State Bank Supervisors (CSBS) to identify additional ways to support information sharing between state and federal regulators.
3.2 Central Counterparties
CCPs can improve financial stability by enhancing market functioning, reducing counterparty risk, and increasing transparency. CCPs must be highly robust and resilient to deliver these benefits. Consistent with the requirements adopted by the financial regulators, CCPs have made considerable progress in improving risk management practices and providing greater transparency in the functioning of these institutions, including CCPs that have been designated as systemically important financial market utilities (FMUs) by the Council. As discussed in Section 6.2.1, due to the critical role CCPs play in financial markets, effective regulation and risk management of CCPs is essential to financial stability, and should continue to evolve accordingly.
The Council recommends that the CFTC, Federal Reserve, and SEC coordinate in the supervision of all CCPs that are designated by the Council as systemically important FMUs. Relevant agencies should continue to evaluate whether existing rules and standards for CCPs and their clearing members are sufficiently robust to mitigate potential threats to financial stability, in consultation with each other and the Council. Member agencies should also continue working with global counterparts and international standard-setting bodies to identify and address areas of common concern.
The Council also encourages agencies to monitor and assess interconnections among CCPs, their clearing members, and other financial institutions. They should consider the potential effects of distress of one or more of these entities on other stakeholders in the clearing system and on financial stability, with an eye towards identifying measures that would enhance the resiliency of the financial system.
Finally, the Council encourages regulators’ continued focus on CCP recovery and resolution planning for systemically important CCPs.
3.3 Reference Rates
As discussed in Section 6.2.2, the weaknesses of LIBOR and the uncertainty surrounding its sustainability may undermine market integrity and could threaten individual financial institutions and the U.S. financial system more broadly.
To address the need for a robust, sustainable alternative reference rate, a group of U.S. agencies in 2014 convened the ARRC. The ARRC was reconstituted in 2018 to include a broader set of market participants and regulatory agencies. The Council commends the progress of the ARRC to date, including identification of the SOFR as an appropriate alternative reference rate; daily publication of SOFR as of April 2018; launching of SOFR futures in May 2018; clearing of SOFR overnight indexed swap (OIS) and basis swaps beginning in July 2018; and the publication of guiding principles and public consultations for contract fallback language.
The Council encourages the ARRC to complete its work developing a credible implementation plan to achieve a smooth transition to SOFR, including settling on recommended fallback language across contract types, creating a proposal for a fair and transparent spread adjustment methodology, and developing robust market structures for hedging SOFR-linked products (see Box C). The Council also encourages market participants to consider potential uses of SOFR in new transactions and, where they choose to continue to reference LIBOR, to make existing LIBOR-linked contracts more robust in the event that the publication of LIBOR were to cease,

9Annua l Repor t Recommendat ions
in accordance with guidance provided by the ARRC. These steps will minimize potential disruptions that might arise during the transition to a new reference rate, encourage market participants to follow the proposed terms of the transition, and discourage market participants from divesting contracts tied to LIBOR in a disorderly manner.
The Council recommends that member agencies work closely with market participants to identify and mitigate risks from potential dislocations during the transition process.
3.4 Capital, Liquidity, and Resolution
As discussed in Section 4, since the financial crisis many financial institutions have become more resilient to potential disruptions. They have done so, in part, by raising more capital; taking steps to ensure that they have sufficient liquid assets to withstand greater demands for funding withdrawals; improving loan portfolio quality for residential real estate; implementing better risk-management practices; and developing plans for their orderly resolution. Financial regulatory agencies have developed and implemented rules intended to further increase the robustness of these institutions and enhance financial stability (see Section 5). The Council recommends that financial regulators ensure that the largest financial institutions maintain sufficient capital and liquidity to reduce their vulnerability to economic and financial shocks, as discussed in Section 6.2.3. The Council further recommends that the appropriate regulatory agencies continue to review resolution plans submitted by large financial institutions, provide guidance to such institutions, and ensure there is an effective mechanism for resolving large, complex institutions. The Council also recommends that regulators continue to monitor and assess the impact of rules on financial institutions and financial markets, including, for example, on market liquidity and incentives to centrally clear derivatives, and ensure that BHCs are appropriately monitored based on their size, risk, concentration of activities, and offerings of new products and activities.
3.5 Wholesale Funding Markets
Repo MarketsIn recent years, progress has been made in the reduction of counterparty risk exposures in repo markets. However, given the key role these markets play in facilitating the flow of cash and securities in the U.S. financial system, the Council recommends that financial regulators continue to closely monitor these markets. Because the possibility of fire sales of collateral by creditors of a defaulted broker-dealer remains a vulnerability, the Council also recommends assessing the degree to which recent reforms have mitigated this risk.
Key to mitigating vulnerabilities in the repo market is bolstering policymakers’ and market participants’ understanding of how these markets function, how participants interact, and how risks are changing. Though visibility into the tri-party repo market has improved since the financial crisis, understanding of the bilateral market can be improved considerably. Following the Council’s recommendation in this area in its 2016 annual report, in July 2018 the OFR proposed a rule to establish a permanent collection of data on centrally cleared repo transactions (see Section 5.4.1). This rule, if finalized, will allow monitoring of potential risks to financial stability in an important segment of the repo market, and will also support the calculation of reference rates replacing LIBOR.
In addition, the Council recommends that relevant authorities continue to monitor repo markets for any signs of changes in liquidity conditions and assess the impact of such developments on financial stability.
The Council also recommends assessing the potential risks from the increased concentration in the tri-party repo market, where a single private financial institution is now effectively responsible for all settlement (see Section 6.2.4).

2 0 1 8 F S O C / / Annual Report10
Money Market Mutual Funds and Other Cash Management VehiclesIn October 2016, the SEC implemented reforms of MMFs that were intended to reduce the likelihood of runs on these cash management vehicles. The Council recommends that the SEC continue to monitor the impact of the reforms in light of the approximately $1 trillion shift from prime MMFs to government MMFs since the adoption of the reforms.
In addition, the Council recommends that relevant agencies assess the potential financial stability risks that might be posed by other types of cash management vehicles, such as short-term investment funds, local government investment pools, and private liquidity funds that offer stable net asset values (NAV). Regulators should consider whether regulatory gaps exist for such vehicles, and evaluate the extent to which additional data would be helpful in monitoring and addressing such gaps. Finally, in light of the regulatory and market developments described above, some institutions may choose to implement new strategies that could produce new risks and vulnerabilities. The Council recommends that financial regulators monitor such activities for any financial stability risk implications.
3.6 Financial Innovation
Financial innovation can benefit firms, households, and financial institutions in a number of ways, including potentially reducing the cost of financial services, increasing the convenience of payments, and potentially increasing the availability of credit. As discussed in Sections 4.14 and 6.2.5, financial innovation has been especially important in the post-crisis period, particularly in the realm of technology-enabled products and services.
Financial innovations can also create new risks. Accordingly, the Council encourages financial regulators to continue to be vigilant in identifying new products and services, in order to evaluate how they are used and can be misused; monitor how they affect consumers, regulated entities, and financial markets; and coordinate regulatory approaches, as appropriate. Relevant authorities should also evaluate the potential effects of new financial products and services on financial stability,
including operational risk. Because financial innovations are new, they may not be identified by agencies’ existing monitoring and data collection systems. To ensure comprehensive visibility into innovations across the financial system, regulators should share relevant information on financial innovations with the Council and appropriate agencies. The Council also encourages regulators to consider appropriate approaches to regulation to reduce regulatory fragmentation while supporting the benefits of innovation.
3.7 Data Quality, Collection, and Sharing
As discussed in Section 6.2.6, the absence of broadly shared standards on financial transaction entity data can lead to unnecessary costs and inefficiencies, such as duplicate reporting, and may impede the ability to aggregate data for risk-management and reporting purposes.
The Council recommends that regulators and market participants continue to partner to improve the scope, quality, and accessibility of financial data, as well as data sharing between relevant agencies. These partnership efforts include developing and implementing new identifiers such as the Unique Transaction Identifier (UTI) and Unique Product Identifier (UPI); developing and linking data inventories; and implementing industry standards, protocols, and security for secure data sharing.
Further, the Council encourages market participants to use current initiatives, forums, and public-private partnerships to identify existing critical infrastructure protection and cyber threat intelligence data-sharing protocols and standards that could be synchronized across the industry. Regarding information collections, member agencies should continue to ensure that existing and proposed collections do not lead to unnecessary regulatory reporting burdens.
Broader adoption of the Legal Entity Identifier (LEI) by financial market participants continues to be a Council priority. The LEI enables unique and transparent identification of legal entities participating in financial transactions. To facilitate the broad adoption of the LEI, the Council

11Annua l Repor t Recommendat ions
recommends that, where appropriate, member agencies move to adopt the use of the LEI in regulatory reporting and other data collections.
The Council recommends that member agencies update their regulatory mortgage data collections to include LEI and Universal Loan Identifier (ULI) fields, which will make it possible to track loan records through a loan’s life cycle. The Council also recommends that member agencies support adoption and use of standards in mortgage data, including consistent terms, definitions, and data quality controls, which will make transfers of loans or servicing rights less disruptive to borrowers and investors. The Council encourages federal and state regulators conducting oversight over nonbank mortgage activities to coordinate closely to enhance data integrity, quality, and consistency, and to identify and address gaps in data collected on these activities.
The Council recommends that member agencies continue to work to harmonize domestic and global derivatives data for aggregation and reporting, and ensure that appropriate authorities have access to trade repository data needed to fulfill their mandates (see Section 5.4.2).
The Council supports efforts by pension regulators and accounting standards boards to improve the quality, timeliness, and depth of disclosures of pension financial statements. The Council also supports the use of market valuation for pension data as described in the guidance issued by the Governmental Accounting Standards Board.
3.8 Managing Vulnerabilities amid Prolonged Credit Expansion
According to certain metrics, nonfinancial corporate debt and leverage have reached elevated levels (see Section 4.3). In addition, there are some indications that valuations may be elevated in key U.S. financial markets, including equities, some commercial and residential real estate, and corporate debt (see Sections 4.3, 4.5, and 4.7).
Downturns in these markets can occur with little warning and in response to a range of factors. As discussed in Section 6.3, the impact of corrections
in these markets on financial stability will depend on the severity of the losses, spillovers across markets, and the ability of investors and intermediaries to manage the fallout. It is important that the relevant investors and intermediaries assess and reinforce their ability to manage a scenario of severe losses across these markets, in order to reduce the risks of such a scenario.
The Council recommends that agencies continue to monitor levels of nonfinancial business leverage, trends in asset valuations, and potential implications for the entities they regulate in order to assess and reinforce their ability to manage severe, simultaneous losses in those markets. Assuring that the relevant investors and intermediaries can manage such losses, rather than amplify or transmit them, will reduce the threat to financial stability posed by such a scenario.
3.9 Housing Finance Reform
The domestic housing market has continued to improve over the past several years as sales of new and existing homes have increased, prices have risen, the share of mortgages with negative home equity has declined, and mortgage loan performance has improved. As discussed in Section 4.5.2, the federal government continues to back the majority of new mortgages, either directly through the Federal Housing Administration (FHA), U.S. Department of Veterans Affairs (VA), and U.S. Department of Agriculture (USDA), or indirectly through the Enterprises. Since 2013, the Enterprises have engaged in a credit risk transfer program to transfer mortgage credit risk to private market participants. The Enterprises have transferred a portion of the credit risk on over $2 trillion in unpaid principal balance (UPB). The Council recommends that regulators and market participants continue to take steps to encourage private capital to play a larger role in the housing finance system.
FHFA and the Enterprises, through their joint venture Common Securitization Solutions (CSS), have also continued the development of a new housing finance infrastructure, including migration of securitization activities by the Enterprises to the Common

2 0 1 8 F S O C / / Annual Report12
Securitization Platform (CSP) operated by CSS and progress toward a single agency mortgage-backed security (MBS), the Uniform Mortgage-Backed Security (UMBS). The Council recommends that efforts to advance both the CSP and UMBS continue.
As discussed in Section 5.3.1, in 2018, FHFA issued a proposed rule on capital requirements for the Enterprises. Under the proposal, the Enterprises would be subject to new risk-based capital requirements and a revised minimum leverage capital requirement. Any final rule would be suspended while the Enterprises remain in conservatorship. The Council recommends that FHFA continue to develop these capital requirements, which may help inform the development of capital standards for future secondary market housing finance entities upon completion of housing finance reform.
The Enterprises are now into their eleventh year of conservatorship. The Council reaffirms its view that housing finance reform is urgently needed to address the conservatorships, codify existing reforms, and implement a durable and vibrant housing finance system.
3.10 Changes in Financial Market Structure
Changes in the way that financial markets work—such as the increased use of automated trading systems, the increased speed of executing financial transactions, and a wider variety of trading venues and liquidity providers—can make financial markets more efficient and transparent. However, financial regulators and market participants should assess the extent to which these developments could negatively impact market functioning and contribute to financial instability (see Box D). It is therefore important that financial regulators continue to monitor and evaluate any changes that might have adverse effects on markets, including on trading liquidity. Financial regulators and market participants should continue to assess the complex linkages among markets, factors that could cause “flash events” to propagate across markets, and potential ways to mitigate risks. As markets are global in nature, there should be active
collaboration with regulators across jurisdictions to ensure coordination of efforts.
Recent changes to the market for Treasury securities, discussed in Section 6.4, raise questions as to whether clearance and settlement practices have adequately evolved to address potential risks associated with the changes. Agencies should actively encourage risk management practices that keep pace with developments in this market. A key component of these efforts is to identify the gaps in our understanding of market structure and, if necessary, to fill these gaps through the collection of data and subsequent analysis. Such efforts are underway. The reporting of secondary transactions in Treasury securities through the Trade Reporting and Compliance Engine (TRACE) has the potential to promote greater understanding of, and transparency in, the Treasury securities market. The Council supports this development and recommends that agencies assess other areas in which improved data-gathering might be fruitful.
The Council encourages member agencies to continue to evaluate the use of coordinated tools such as trading halts across interdependent markets, particularly in periods of overall market stress, operational failure, or other incidents that might pose threats to financial stability, while being mindful of the tradeoffs such tools might entail.
Finally, Council member agencies should work collaboratively to monitor and analyze developments in market liquidity.
3.11 Asset Management Products and Activities
Ensuring that adequate information is available to evaluate risks in the asset management industry remains a Council focus. As discussed in Section 5.2.2 and Section 6.5, the SEC has issued and amended rules for registered investment companies designed to promote effective liquidity risk management and provide for enhanced data reporting, and is also considering re-proposing a rule regarding the use of derivatives by registered investment companies. The Council recommends that the SEC monitor the implementation of these

13Annua l Repor t Recommendat ions
rules and evaluate the extent to which they address potential risks in the asset management industry.
The Council also supports efforts to improve metrics and analytical tools used to evaluate asset management risks, as well as continued collaboration among regulators and industry on reporting standards. The Council recommends that relevant agencies continue to review their data collections and assess whether they are sufficient to allow the Council to monitor whether and how private funds—pooled investment vehicles such as hedge funds and private equity funds that are exempt from the definition of “investment company” under the Investment Company Act of 1940—may pose risks to financial stability.
3.12 Regulatory Efficiency and Effectiveness
While the regulatory environment has contributed to improvements in financial stability and the resiliency of financial institutions since the financial crisis, new regulations have also raised concerns about increased compliance costs and regulatory burdens for financial institutions, especially for smaller institutions.
Over the last year, Council member agencies have taken steps to make financial services regulations more efficient and effective. Some examples include proposed changes by the Federal Reserve, FDIC, OCC, SEC, and CFTC to eliminate or modify requirements under the Volcker Rule, without diminishing the safety and soundness of banking entities (see Section 5.1.4); proposed amendments by the CFTC to rules related to swap execution facilities (SEFs) and the trade execution requirement to promote more SEF trading and pre-trade price transparency (see Section 5.2.1); an SEC proposal to create a consistent, transparent, and efficient regulatory framework for ETFs to facilitate greater competition and innovation (see Section 5.2.2); and an ANPR by the OCC seeking public comment on ways to transform or modernize the regulations that implement the CRA, to better align CRA activity with the needs of the communities that banks serve, while also seeking to ensure that such activity is conducted in a manner consistent with a bank’s safety and soundness (see Section 5.3.2).
The Council recommends that federal and state financial regulators continue to work together to evaluate regulatory overlap and duplication, modernize outdated regulations, and, where authority exists, tailor regulations based on the size and complexity of financial institutions.


15Financ ia l Deve lopments
Percent As Of: 31-Oct-20184.1.2 U.S. Treasury Yields and Yield Curve
Source: U.S. Department of the Treasury
-50
0
50
100
150
200
250
300
350
0
1
2
3
4
5
6
7
2005 2007 2009 2011 2013 2015 2017
Basis Points
10-Year (left-axis)
2-Year (left-axis)
10-Year – 2-Year Spread (right-axis)
0
25
50
75
100
125
0
25
50
75
100
125
1940 1950 1960 1970 1980 1990 2000 2010 2020
Source: CBO, Haver Analytics
As Of: 2017Percent of GDP4.1.1 Federal Debt Held by the Public
Note: Data for fiscal years. Years after 2017 are projected.
Percent of GDP
CBO Baseline Projection
4.1.1 Federal Debt Held by the Public
4.1.2 U.S. Treasury Yields and Yield Curve
4.1 U.S. Treasuries
Publicly held U.S. sovereign debt outstanding grew to $15.8 trillion as of October 2018. The ratio of that debt to U.S. GDP was 76 percent, little changed from September 2017. The public debt-to-GDP ratio has been relatively stable since 2014, but the CBO projects the ratio to grow sharply in the next decade (Chart 4.1.1). The average maturity of outstanding marketable debt decreased from 70 months in September 2017 to 69 months as of September 2018. During the same period, foreign holdings of U.S. sovereign debt decreased by 1 percent to $6.2 trillion. China and Japan continue to be the largest foreign holders of U.S. sovereign debt at $1.2 trillion and $1.0 trillion, respectively.
Ten-year Treasury yields have traded near 3 percent since rising in early 2018. Market participants considered expansionary fiscal policy and higher inflation and growth to be important factors driving the long-term yield increase. Yields on 2-year Treasury notes have risen significantly in 2018, continuing a trend from 2017. Federal Reserve policy is considered a key driver of the increase in short-term interest rates. Since December 2015, the Federal Open Market Committee (FOMC) raised its target range for the federal funds rate by 25 basis points eight times through October 2018. The Treasury yield curve has continued to flatten in 2018 as short-term rates have risen faster than longer-term rates. The difference between 2- and 10-year yields dropped from 86 basis points in September 2017 to 28 basis points in October 2018 (Chart 4.1.2).
4 Financial Developments

16 2 0 1 8 F S O C / / Annual Report
0
50
100
150
200
250
300
0
50
100
150
200
250
300
2005 2007 2009 2011 2013 2015 2017
Merrill Lynch Option Volatility Estimate
(MOVE) Index
1994-PresentMOVE Average
4.1.4 Fixed Income Implied VolatilityBasis Points Basis Points
Source: Bloomberg, L.P.
As Of: 31-Oct-2018
Note: Implied volatility is calculated using a yield curve-weighted index of the normalized implied volatility on 1-month Treasury options.
4.1.4 Fixed Income Implied Volatility
From September 2017 to October 2018, the yield on 10-year Treasury Inflation-Protected Securities (TIPS) has risen 61 basis points to 1.10 percent (Chart 4.1.3). Break-even inflation compensation, the difference between nominal and TIPS yields, rose in early 2018 and remained steady before rising in October above one percent. Implied fixed income volatility, as measured by prices of options on U.S. Treasuries, was below its long-term average in 2017 and 2018 despite a short spike in early 2018 (Chart 4.1.4).
The three major credit ratings for U.S. sovereign debt were unchanged since the Council’s last annual report.
Percent As Of: 31-Oct-20184.1.3 10-Year Treasury Yields
Source: U.S. Department of the Treasury
-2
-1
0
1
2
3
4
5
-2
-1
0
1
2
3
4
5
2009 2010 2011 2012 2013 2014 2015 2016 2017 2018
Percent
Treasury Notes
Treasury Inflation-Protected Securities
4.1.3 10-Year Treasury Yields

17Financ ia l Deve lopments
4.2 Sovereign Debt Markets
4.2.1 Developed EconomiesEconomic growth in most advanced economies decelerated in 2018, following strong growth in 2017. That said, 2018 growth rates varied meaningfully, as the U.S annualized growth averaged 3.3 percent for the first three quarters of 2018, while euro area, UK, and Japanese annualized growth respectively averaged 1.3 percent, 1.5 percent, and 0.2 percent (Chart 4.2.1).
Euro AreaEuro area real GDP growth decelerated to 0.8 percent in the third quarter of 2018, after reaching a multi-year high of 3.2 percent in the fourth quarter of 2016. (Chart 4.2.2). Economic growth in Spain continued to outpace the broader euro area, while Italian growth continued to lag it.
On aggregate, euro area sovereign debt yields remained fairly stable in 2017, and the European Central Bank (ECB) left its deposit facility rate unchanged at -0.40 percent (Chart 4.2.3). However, spreads between Italian and German sovereign bonds widened in 2018 amid concerns regarding Italy’s fiscal outlook. (Chart 4.2.4). In May, the Italian 2-year bond spread experienced its largest one day spike in over 20 years, and in October, the 10-year spread rose to its highest level since 2014.
-2
0
2
4
6
-2
0
2
4
6
2016Q1
2016Q2
2016Q3
2016Q4
2017Q1
2017Q2
2017Q3
2017Q4
2018Q1
2018Q2
2018Q3
4.2.1 Advanced Economies Real GDP GrowthPercent PercentAs Of: 2018 Q3
Source: Eurostat, CAO, BEA, Haver Analytics
Note: Data represents seasonally adjusted quarter-over-quarter annualized real GDP growth rates.
United KingdomJapan
Euro Area
United States
4.2.1 Advanced Economies Real GDP Growth
4.2.2 Euro Area GDP Growth
-6
-4
-2
0
2
4
6
-6
-4
-2
0
2
4
6
2002 2005 2008 2011 2014 2017 2020 2023
Percent PercentAs Of: 2017
SpainFranceEuro AreaItalyGermany
Source: IMF, Haver AnalyticsNote: Year-over-year percent change. Data after 2017 are projected.
4.2.2 Euro Area Real GDP Growth
-8
0
8
16
24
32
40
-4
0
4
8
12
16
20
2010 2011 2012 2013 2014 2015 2016 2017 2018
Source: Bloomberg, L.P.
As Of: 31-Oct-2018Percent4.2.3 European 10-Year Yields
Percent
Greece (right axis)Portugal (left axis)Spain (left axis)Italy (left axis)United Kingdom (left axis)Germany (left axis)
4.2.3 European 10-Year Yields

18 2 0 1 8 F S O C / / Annual Report
In August 2018, Greece received its final disbursement from the European Stability Mechanism (ESM), marking the conclusion of eight years of international financial stabilization programs. Over the past several years, Greece has made significant progress implementing fiscal reforms, and has reported primary surpluses in excess of its 3.5 percent target (Chart 4.2.5). However, Greece’s long-term fiscal sustainability remains uncertain, given high levels of public debt, persistently low productivity growth, and working age population emigration.
United KingdomUK economic growth continued to decelerate from its recent peak in 2014, with year-over-year GDP growth averaging 1.3 percent in the three quarters of 2018 (Chart 4.2.6). The slowdown in economic growth can be primarily attributed to deceleration in household consumption and capital formation since the 2016 referendum to exit the EU.
Despite the slowdown in economic growth, employment growth has remained steady, and the UK unemployment rate has fallen to historic lows. Inflation tracked above the Bank of England’s (BoE’s) 2 percent target in 2017 and 2018 as the impact of the sterling’s depreciation pushed up import costs; however, inflation expectations remain anchored. Against this backdrop, the BoE has raised its base policy rate twice over the past year to 0.75 percent, while longer-term Gilt yields remained below two percent, resulting in some flattening of the UK yield curve (Chart 4.2.7).
-12
-8
-4
0
4
8
-12
-8
-4
0
4
8
2006 2008 2010 2012 2014 2016 2018 2020 2022
4.2.5 Greece Fiscal ProjectionsPercent PercentAs Of: 2017
Source: IMF, HaverAnalytics
Note: Projections from IMF WEO. Years after 2017 are projected.
Eurozone – Primary Balance % GDPGreece - GDP Growth
Greece – Primary Balance % GDP
Eurozone - GDP Growth
4.2.5 Greece Fiscal Projections
-5.0
-2.5
0.0
2.5
5.0
-5.0
-2.5
0.0
2.5
5.0
2014 2015 2016 2017 2018
General GovernmentGross Capital Formation
Household & Non-profitsTotalNet Trade Balance
4.2.6 Contributions to UK GDP GrowthPercent Percent
Source: UK Office of National Statistics, Haver Analytics
As Of: 2018 Q3
Note: Data represents year-over-year real GDP growth rates. Components may not sum to total due to statistical discrepancies.
4.2.6 Contributions to UK GDP Growth
Percent As Of: 31-Oct-20184.2.4 Italian Sovereign Bond Spreads
Source: Haver Analytics
0
1
2
3
4
0
1
2
3
4
Jan-16 Jun-16 Nov-16 Apr-17 Sep-17 Feb-18 Jul-18
Percent
10-Year BTP-Bund Spread2-Year BTP-Bund Spread
Note: Spreads between Italian and German sovereign bonds.
4.2.4 Italian Sovereign Bond Spreads

19Financ ia l Deve lopments
JapanJapanese real GDP growth declined in 2018, with Japan posting negative sequential growth in the first and third quarters of 2018. That said, year-over-year GDP growth remained slightly positive at 0.3 percent as of the third quarter of 2018. Inflation turned positive in 2017 and 2018, with core Consumer Price Index (CPI) inflation rising to 1.0 percent as of October 2018 (Chart 4.2.8).
Japanese 10-year government bond yields hovered just above zero throughout 2017 and 2018, in line with the Bank of Japan’s (BoJ) stated target of a zero yield on the 10-year bond (Chart 4.2.9). In July 2018, the BoJ announced new forward guidance and increased flexibility to its asset purchase program while maintaining its target yield for the 10-year bond.
4.2.7 UK Yield Curve
-3
-2
-1
0
1
2
3
-3
-2
-1
0
1
2
3
1998 2001 2004 2007 2010 2013 2016
4.2.8 Japanese Consumer Price InflationPercent Percent
Source: Bank of Japan, Haver Analytics
As Of: Oct-2018
Note: Data represents year-over-year percent change. CPI excludes fresh food and is adjusted for the consumption tax increase that took effect in April 2014.
4.2.8 Japanese Consumer Price Inflation
-50
-25
0
25
50
75
100
125
150
-50
-25
0
25
50
75
100
125
150
2010 2011 2012 2013 2014 2015 2016 2017 2018
4.2.9 Japan 10-Year Government Bond YieldBasis Points Basis Points
Source: Bloomberg, L.P.
As Of: 31-Oct-2018
4.2.9 Japan 10-Year Government Bond Yield
Percent As Of: 31-Oct-20184.2.7 UK Yield Curve
Source: Haver Analytics
0.0
0.5
1.0
1.5
2.0
0.0
0.5
1.0
1.5
2.0
0 5 10 15 20 25 30Years
Percent
Oct-2017Oct-2018

20 2 0 1 8 F S O C / / Annual Report
4.2.2 Emerging Market EconomiesEconomic growth in emerging markets picked up slightly in 2017 and early 2018, following mixed growth in preceding years. Developing Asian economies continue to outpace other emerging economies, and the region continues to report an annual growth rate above six percent. On aggregate, Latin American economies returned to growth in the latter half of 2017 and early 2018; however, growth in Latin America remains tepid amid weak consumer and business confidence and political uncertainty in some countries.
In 2017 and the first half of 2018, emerging market economies (EMEs) were net recipients of foreign investor capital, with quarterly net inflows averaging over $250 billion (Chart 4.2.10). Gross bond issuance was at a record pace in 2017 and during the first four months of 2018, averaging $67 billion and $82 billion per month, respectively (Chart 4.2.11). Issuance declined thereafter, against the backdrop of tightening dollar liquidity and increased financial market stress in emerging markets.
Sovereign bond spreads in most emerging mar-kets narrowed or remained flat in 2017, before widening slightly in 2018 (Chart 4.2.12). Brazil-ian, Argentine, and Turkish sovereign bonds were among the worst performers in 2018, with credit default swap (CDS) spreads respectively peaking at 310, 574, and 835 basis points on September 4, 2018.
-300
-100
100
300
500
-300
-100
100
300
500
2006 2008 2010 2012 2014 2016 2018
Net Flows
Portfolio InflowsBank Inflows
Foreign Direct Investment
4.2.10 Gross Foreign Investor Capital Inflows to EMEsBillions of US$ Billions of US$
Source: IMF, Haver Analytics
As Of: 2018 Q2
4.2.10 Gross Foreign Investor Capital Inflows to EMEs
0
150
300
450
600
750
900
0
150
300
450
600
750
900
2004 2006 2008 2010 2012 2014 2016 2018
4.2.11 Emerging Market Gross Global Bond IssuanceBillions of US$ Billions of US$
Source: Dealogic
As Of: 30-Sep-2018
Note: Bonds have maturities greater than one year and have been internationally marketed or placed. “Public” includes issuance by municipal and state-owned enterprises.
PrivatePublic
Sovereign
YTD
4.2.11 Emerging Market Gross Global Bond Issuance

21Financ ia l Deve lopments
4.2.12 Emerging Market Sovereign CDS Spreads
Source: Bloomberg, L.P.
0
300
600
900
0
300
600
900
Jan:15 Jul:15 Jan:16 Jul:16 Jan:17 Jul:17 Jan:18 Jul:18
Index IndexAs Of: 31-Oct-2018
Argentina TurkeyBrazil Markit CDX EM Index
Note: 5-year USD spreads.
4.2.12 Emerging Market Sovereign CDS SpreadsBrazil Brazilian CDS spreads widened in May 2018, primarily due to concerns around the nationwide truck driver strike, and again in late summer in the lead-up to the October 2018 presidential election. That said, Brazilian spreads remain significantly below levels reached during 2015 and 2016, and the Brazilian economy has undergone macroeconomic adjustments, including narrowing its current account deficit and reducing its reliance on external financing (Chart 4.2.13, 4.2.14). While Brazil’s fiscal deficit has declined, the amount of public debt outstanding has remained elevated and, absent deeper structural reforms, gross public debt is expected to approach 100 percent of GDP in the coming years.
ArgentinaBeginning in April 2018, Argentina’s economy came under significant financial pressure, and in June 2018, the Argentine government entered into a three-year, $50 billion stand-by agreement with the International Monetary Fund (IMF). While the Argentine government has enacted a series of domestic reforms, the economy has become increasingly reliant on external financing since it regained access to international debt markets in 2016. Between the fourth quarter of 2015 and the second quarter of 2018, Argentina’s external debt-to-GDP ratio increased from 24 percent to 39 percent and its current account deficit increased from 1.6 percent to 5.6 percent of GDP. Additionally, inflation remains persistently high, with core CPI inflation ranging 23 to 41 percent since 2013 (Chart 4.2.15). Financial conditions deteriorated further in late summer, with the peso falling over 25 percent in August 2018. Argentine policymakers have since taken emergency steps to stabilize its currency, including raising its official interest rate to 60 percent, announcing plans to reduce its fiscal deficit, and requesting early cash disbursements tied to its June stand-by agreement with the IMF. After an agreement was reached on September 26, Argentina’s IMF program now totals $57 billion.
0
15
30
45
60
0
15
30
45
60
2010 2011 2012 2013 2014 2015 2016 2017 2018
TurkeyArgentinaBrazil
4.2.14 Emerging Market External DebtPercent Percent
Source: World Bank, BCB, CBRT, INDECM, Haver Analytics
As Of: 2018 Q2
Note: Data represents four quarter rolling average external debt as a % of GDP
-10
-8
-6
-4
-2
0
2
-10
-8
-6
-4
-2
0
2
2010 2011 2012 2013 2014 2015 2016 2017 2018
TurkeyArgentinaBrazil
4.2.13 Emerging Market Current Account DeficitsPercent Percent
Source: BCB, CBRT, INDECM, Haver Analytics
As Of: 2018 Q2
Note: Data represents four quarter rolling average current account as a % of GDP
4.2.14 Emerging Market External Debt
4.2.13 Emerging Market Current Account Deficits

22 2 0 1 8 F S O C / / Annual Report
Turkey Turkey’s macroeconomic imbalances have grown in recent years, making it particularly vulnerable to a balance of payment crises. Since the July 2013 Taper Tantrum, Turkey’s large current account deficit has persisted, inflation has been steadily increasing, and external debt now exceeds 50 percent of GDP. Against this backdrop, Turkish financial market conditions deteriorated rapidly, and by early September 2018, the Turkish lira was down over 40 percent on the year and Turkish Credit Default Swap (CDS) spreads rose over 400 basis points from December 2017 levels. While Turkish financial market conditions improved somewhat in October 2018, CDS spreads remained elevated and core inflation jumped to 24 percent due to exchange-rate pass-through.
China Chinese economic growth continued to decelerate in 2018, with year-over-year real GDP growth slowing to 6.5 percent in the third quarter of 2018, compared to 6.9 percent in 2017 (Chart 4.2.16). The deceleration has primarily been driven by slower credit growth and weaker external demand. Manufacturing sector growth, which stabilized around 6.3 percent in 2016 and the first half of 2017, fell to 5.3 percent in the third quarter of 2018. In contrast, services sector growth has remained relatively stable, and was reported at 7.9 percent in the third quarter of 2018 (Chart 4.2.17).
0
4
8
12
16
0
4
8
12
16
2000 2003 2006 2009 2012 2015 2018
4.2.16 Chinese Real GDP GrowthPercent Percent
Source: China National Bureau of Statistics, Haver Analytics
As Of: 2018 Q3
Note: Year-over-year percent change.
0
10
20
30
40
50
0
5
10
15
20
25
2010 2011 2012 2013 2014 2015 2016 2017 2018
Turkey (Right)Argentina (Right)Brazil (Left)
4.2.15 Emerging Market Core CPIPercent Percent
Source: IBGE, DGEC, TRSTAT, INDECM, Haver Analytics
As Of: Oct-2018
Note: Data represents year-over-year change in core CPI. Argentina represents Buenos Aires CPI Ex seasonal and regulated goods.
4.2.16 Chinese Real GDP Growth
4.2.15 Emerging Market Core CPI
Percent As Of: 2018 Q34.2.17 Chinese Manufacturing and Services Growth
Source: China National Bureau of Statistics, Haver Analytics
0
5
10
15
20
0
5
10
15
20
2000 2003 2006 2009 2012 2015
Percent
Manufacturing
Services
Note: Year-over-year percent change.
4.2.17 Chinese Manufacturing and Services Growth

23Financ ia l Deve lopments
The rate of Chinese credit growth slowed in 2017 and the first half of 2018, as the People’s Bank of China (PBOC) introduced macroprudential policies to reduce growth in nonbank lending (Chart 4.2.18). The stock of nonfinancial private credit, which rose from approximately 150 percent of GDP in 2011 to over 210 percent of GDP in 2016, has stabilized and stood at 213 percent of GDP as of the first quarter of 2018. More specifically, nonbank lending, which grew rapidly over this same period, has stabilized at 55 percent of GDP as of the first quarter of 2018 (Chart 4.2.19). However, in the second half of 2018, Chinese policymakers began to relax deleveraging policies amid slowing growth and gathering external headwinds.
4.2.3 U.S. Municipal MarketsTotal state and local government tax revenues in the first half of 2018 were six percent higher than one year earlier; for 2017, tax revenues were 3 percent higher than the prior year (Chart 4.2.20). Municipal bond ratings improved marginally through the first half of 2018, with upgrades exceeding downgrades by nine percent. In general, pricing of municipal bonds remained stable.
Long-term municipal credit challenges remain, led by unfunded healthcare expenses, public pension obligations, and the cost of repairs to declining infrastructure. Benefit liabilities and rising mandatory expenditures raise the risk of long-term fiscal imbalances for many state and local governments. Non-discretionary expenditures have risen from 25 percent to nearly 40 percent of state and local budgets over the last 30 years.
The fiscal crisis of Puerto Rico is distinctive in a sector with few defaults historically. The Puerto Rico Oversight, Management, and Economic Stability Act (PROMESA), enacted in June 2016, provided for the establishment of the financial oversight and management board and a resolution process for the Commonwealth’s $73 billion in debt. Puerto Rico’s fiscal plan requires fiscal measures and structural reforms
0
40
80
120
160
200
240
0
40
80
120
160
200
240
2008 2009 2010 2011 2012 2013 2014 2015 2016 2017 2018
4.2.19 Credit to the Chinese Nonfinancial Private Sector Percent of GDP Percent of GDPAs Of: 2018 Q1
Source: China National Bureau of Statistics, BIS, Haver Analytics Note: Rolling 4-quarter sum of GDP.
Nonbank LendingBank Lending
4.2.19 Credit to the Chinese Nonfinancial Private Sector
Percent As Of: Sep-20184.2.18 Chinese Credit Growth
Source: The People’s Bank of China, Haver Analytics
0
10
20
30
40
50
0
10
20
30
40
50
2010 2011 2012 2013 2014 2015 2016 2017 2018
Total Social Financing
Percent
Note: Year-over-year monthly change. Total credit is defined as the sum of total social financing (TSF) and local government bond issuance. TSF refers to the total volume of financing provided by the financial system to the real economy.
+ Local Gov’t Bond Issuance
4.2.18 Chinese Credit Growth
-6
-3
0
3
6
9
12
-6
-3
0
3
6
9
12
1998 2001 2004 2007 2010 2013 2016
4.2.20 Change in State and Local Government Tax RevenuesPercent Percent
Source: Census Bureau
Note: Data represents year-over-year change. Revenue measures includes revenues from property, individual income, corporate income, and sales taxes.
As Of: 2018 Q2
4.2.20 Changes in State and Local Government Tax Revenues

2 0 1 8 F S O C / / Annual Report24
that are expected to contribute to an annual surplus of $2.9 billion before debt service payments by 2023, according to the October 2018 fiscal plan. However, the Commonwealth is projecting a return to deficit starting in 2034. Federal disaster-related funds are having an ameliorative effect, but Hurricane Maria highlighted the weaknesses of the island’s electric, water, and transport infrastructure. As the process of fiscal and financial restructuring continues, Puerto Rico’s issues have not significantly affected market conditions for other state and local governments.
Investor flows to municipal bond funds remained modestly positive for most of 2018, following some volatility in December 2017 and January 2018 after federal tax reform (Chart 4.2.21). Credit spreads for tax-exempt general obligation bonds narrowed slightly in 2017 and fluctuated within a tight range through October 2018 (Chart 4.2.22). In 2018, the municipal bond yield curve reflects slightly greater compensation for duration than in the Treasury securities market. Legislation enacted in May 2018 required the federal banking agencies to classify certain municipal bonds as high-quality liquid assets (HQLA), consistent with the treatment of corporate debt securities and publicly traded common equity shares. Following that legislation, federal banking agencies issued an interim final rule that would allow municipal bonds that are investment grade, liquid, and readily marketable to qualify as level 2B HQLA in satisfying the minimum requirements under the liquidity coverage ratio (LCR) rule.
From January to October 2018, municipal debt issuance was down by 14 percent from issuance over the same period in 2017. In a change from the last three years, issuances of new capital outpaced refundings through October 2018, a dynamic driven by changes to the tax code eliminating the tax exemption for advance refundings of tax-exempt bonds (Chart 4.2.23).
-20
-15
-10
-5
0
5
10
15
-20
-15
-10
-5
0
5
10
15
2007 2009 2011 2013 2015 2017
Source: ICI, Haver Analytics
As Of: Sep-2018Billions of US$ Billions of US$4.2.21 Long-Term Mutual Fund Flows: Municipal Bonds4.2.21 Long-Term Mutual Fund Flows: Municipal Bonds
4.2.22 Municipal Bond Spreads
Source: Municipal Market Analytics, Bloomberg, L.P.
0
50
100
150
200
250
0
50
100
150
200
250
2005 2007 2009 2011 2013 2015 2017
Percent PercentAs Of: 26-Oct-2018
Note: Spreads between municipal and Treasury securities of comparable maturities.
30-Year AAA GO10-Year AAA GO5-Year AAA GO
4.2.22 Municipal Bond Spreads
Billions of US$
0
100
200
300
400
500
600
0
100
200
300
400
500
600
2006 2008 2010 2012 2014 2016 2018YTD
New CapitalRefunding
4.2.23 Municipal Bond IssuanceBillions of US$
Source: Thomson Reuters, SIFMA
As Of: Oct-2018
Note: Excludes maturities of 13 months or less.
4.2.23 Municipal Bond Issuance

25Financ ia l Deve lopments
4.3 Corporate Credit
Corporate BorrowingAmid an extended credit expansion, nonfinancial corporate leverage is elevated according to certain measures. Corporate debt continued to grow faster than GDP in the past year, and the ratio of corporate debt-to-GDP is at an all-time high based on available data since 1951 (Chart 4.3.1). Key measures of firm-level leverage are also elevated. The median ratio of debt-to-assets remains close to a multi-decade high. Despite very strong U.S. corporate earnings, the median debt-to-earnings ratio for U.S. nonfinancial businesses is also at the high end of its long-term range (Chart 4.3.2). Firms continue to service these debt burdens with delinquency rates at low levels. The long economic expansion, continued access to financing, strong interest coverage (Chart 4.3.3) and a strong aggregate ratio of liquid assets to total assets (Chart 4.3.4) have all supported the performance of corporate debt.
One factor contributing to the strong pace of corporate borrowing has been attractive corporate financing terms. While interest rates have increased following recent actions by the Federal Reserve to raise the target range for the federal funds rate, long-term U.S. interest rates remain at the lower end of their historical range. Meanwhile strong investor appetite for higher-yielding products continues to manifest itself within the business sector, where spreads for corporate bonds are below historical medians and at the low end of their post-crisis range.
The continued growth in corporate debt during 2017-18 in part reflected an increased reliance on syndicated loans, including leveraged loans, much of which are ultimately held by nonbank investors. In contrast, growth in loans to corporates that are held on banks’ balance sheets was more modest, decelerating significantly in 2017 before stabilizing in 2018.
25
30
35
40
45
50
25
30
35
40
45
50
1980 1985 1990 1995 2000 2005 2010 2015Source: Federal Reserve, Haver Analytics
As Of: 2018 Q2Percent4.3.1 Nonfinancial Corporate Debt
Note: Gray bars signify NBER recessions.
Percent
4.3.1 Nonfinancial Corporate Debt as a Percent of GDP
1.5
1.9
2.3
2.7
3.1
3.5
0.15
0.18
0.21
0.24
0.27
0.30
1990 1995 2000 2005 2010 2015
As Of: 2018 Q2Ratio Ratio
Gross Debt / Assets(left axis)
Gross Debt / EBITDA (right axis)
Note: Four-quarter moving average of the median ratio. Includes rated and unrated nonfinancial businesses. Source: Compustat, OFR
4.3.2 U.S Nonfinancial Business Leverage4.3.2 U.S. Nonfinancial Business Leverage
0
1
2
3
4
5
6
0
1
2
3
4
5
6
1990 1995 2000 2005 2010 2015
4.3.3 U.S. Nonfinancial Business Interest Coverage RatiosAs Of: 2018 Q2Ratio Ratio
EBITDA/Interest Expense
EBIT/Interest Expense
Note: Four-quarter moving average of median ratio. Includes rated and unrated nonfinancial businesses. Source: Compustat, OFR
4.3.3 U.S. Nonfinancial Business Interest Coverage Ratios

26 2 0 1 8 F S O C / / Annual Report
Corporate Credit Markets Across key product types, corporate credit spreads remained at the low end of their post-crisis range through September 2018 (Chart 4.3.5). Investment grade bond spreads increased somewhat in 2018, after declining in 2016-17, but they remained low. Spreads on speculative grade bonds were range-bound in 2017-18. Meanwhile spreads on leveraged loans fell in 2017 and remained relatively low in 2018.
Total corporate debt growth remained elevated in 2018, driven largely by loan growth, including syndicated loans, rather than bond growth. Total nonfinancial corporate debt growth was 6.5 percent year-over-year as of the second quarter of 2018, roughly the same as one year earlier. Corporate bond growth was 3.2 percent, down from 4.5 percent. Other corporate debt growth—including bank loans, loans held by non-banks, and commercial paper (CP)—was much higher at 14 percent.
4.3.5 U.S. Cash Corporate Credit Spreads
4.3.4 Nonfinancial Corporate Liquid Assets
0
200
400
600
800
1000
0
100
200
300
400
2010 2011 2012 2013 2014 2015 2016 2017 2018
4.3.5 U.S. Cash Corporate Credit Spreads
Source: Bank of America Merrill Lynch, Federal Reserve, S&P LCD
As Of: 28-Sep-2018
Leveraged Loans (right axis)High-Yield (right axis)Investment Grade (left axis)
Basis Points Basis Points
Note: Secondary market spreads. Investment grade and high-yield data represent option-adjusted spreads. Dotted lines represent 1997-present median.
0
1
2
3
4
5
6
7
0
1
2
3
4
5
6
7
1980 1985 1990 1995 2000 2005 2010 2015
4.3.4 Nonfinancial Corporations Liquid Assets Percent of Total Assets Percent of Total Assets
Source: Federal Reserve, Haver Analytics
Note: Liquid assets includes foreign deposits, checkable deposits and currency, time and savings deposits, money market fund shares, security repurchase agreements, debt securities, and mutual fund shares.
As Of: 2018 Q2

27Financ ia l Deve lopments
4.3.6 Gross Issuance of Corporate Bonds
Trillions of US$
0.0
0.4
0.8
1.2
1.6
2.0
0.0
0.4
0.8
1.2
1.6
2.0
2006 2008 2010 2012 2014 2016 2018YTD
Investment GradeHigh-Yield
4.3.6 Gross Issuance of Corporate BondsTrillions of US$
Source: Thomson Reuters, SIFMA
As Of: Sep-2018
Note: Includes all non-convertible corporate debt, MTNs, and Yankee bonds, but excludes all issues with maturities of 1 year or less and CDs.
4.3.8 Leveraged Loan Primary Market by Investor Type
Source: S&P LCD
0
10
20
30
40
50
60
70
80
0
10
20
30
40
50
60
70
80
2005 2007 2009 2011 2013 2015 2017
Percent Percent
Hedge Funds
As Of: 2018 Q3
CLOs
Insurance CompaniesFinance & Security Companies
Loan Mutual FundsBanks
0
20
40
60
80
100
120
140
0
20
40
60
80
100
120
140
2002 2004 2006 2008 2010 2012 2014 2016 2018
4.3.7 CLO IssuanceBillions of US$ Billions of US$
Source: S&P LCD
As Of: Sep-2018
YTD
4.3.8 Leveraged Loan Primary Market by Investor Type
4.3.7 CLO Issuance
There are various indications of weak underwriting standards in the syndicated loan market, particularly in the higher risk leveraged loan market. Notably, highly leveraged deals—as measured by total debt exceeding six times earnings before interest, taxes, depreciation, and amortization (EBITDA)—have surpassed pre-crisis highs. The share of covenant-lite deals—those which offer weaker creditor protections—exceeded 60 percent of new leveraged loan issuance from January to October 2018, according to data from S&P LCD; that is significantly higher than the pre-crisis peak of less than 30 percent. Market participants have cited a desire to protect against rising interest rates as contributing to investor demand for these loans, most of which feature floating interest rates. Similar forces appear to be increasing demand for securitized products, such as collateralized loan obligations (CLOs), in the corporate debt market. CLO issuance in 2018 is expected to exceed the very heavy issuance seen in 2017 (Chart 4.3.7). CLOs remain the largest investors in leveraged loans (Chart 4.3.8). Investors also continue to allocate capital to floating rate loan mutual funds, the second largest investors in institutional leveraged loans, as floating rate instruments remain attractive in a period of rising interest rates.

28 2 0 1 8 F S O C / / Annual Report
0
25
50
75
100
125
150
0
25
50
75
100
125
150
1992 1996 2000 2004 2008 2012 2016
Source: BEA, Federal Reserve, Haver Analytics
As Of: 2018 Q2Percent
4.4.1 Household Debt as a Percent of Disposable Personal Income
Note: Other Household Credit includes debts of both households and nonprofits.
Percent
Other Household CreditConsumer CreditMortgages
4.4.1 Household Debt as a Percent of Disposable Personal Income 4.4 Household Credit
Following a sharp decline between 2008 and 2011, household debt has grown since 2012, driven largely by non-mortgage consumer credit. As of June 2018, household debt growth was 3.4 percent year-over-year, in line with 2017 growth. The ratio of household debt-to-disposable-personal-income continued to decline moderately through June 2018, and is well below the peak levels recorded in the last decade (Chart 4.4.1). Aggregate household net worth continued to increase, with the increase in household net worth being primarily concentrated in upper-income households and driven by rising stock and real estate prices.
Most components of consumer credit experienced a deceleration from 2017 to 2018, but the outstanding stock of debt remains historically elevated (Chart 4.4.2). Student loan debt, which has increased more than five-fold since 2004, totaled $1.4 trillion as of September 2018. Student loan balances grew 6.3 percent from September 2017 to September 2018. By contrast, the number of student loans originated declined 7.4 percent from June 2017 to June 2018, continuing a trend that began in 2012. Auto loan growth decelerated in 2018, partially attributed to tighter lending standards after years of rapid growth; auto loans totaled $1.3 trillion in September 2018. Credit card balances have continued to increase for all risk groups, though aggregate balances of borrowers with non-prime scores are well below pre-crisis levels.
0
300
600
900
1200
1500
0
300
600
900
1200
1500
2003 2006 2009 2012 2015 2018
Source: FRBNY Consumer Credit Panel/Equifax, Haver Analytics
As Of: 2018 Q3Billions of US$4.4.2 Components of Consumer Credit
Note: Gray bar signifies NBER recession.
Billions of US$
Credit Card Debt
Auto Loans
Student Loans
Other HouseholdDebt
4.4.2 Components of Consumer Credit

29Financ ia l Deve lopments
9
10
11
12
13
14
9
10
11
12
13
14
1980 1986 1992 1998 2004 2010 2016
Source: Federal Reserve,Haver Analytics
As Of: 2018 Q2Percent4.4.3 Household Debt Service Ratio
Note: Ratio of debt-service payments to disposable personal income. Seasonally
Percent
4.4.3 Household Debt Service RatioRising incomes and years of very low interest rates helped keep the household debt service ratio—the ratio of debt service payments to disposable personal income—near a 30-year low, little changed in 2017 and the first half of 2018 (Chart 4.4.3). In line with the growth in the respective components of household debt, the service ratio for consumer credit was stable last year after rising for several years, while the service ratio for mortgages has edged down further. Similarly, the household financial obligation ratio, which includes rent and auto-lease payments, was relatively low by historical standards. The debt service ratio and household financial obligation ratio national trends do not necessarily reflect local conditions, such as areas with notably higher housing costs.
The share of owners’ equity in household real estate has increased by over 20 percentage points since 2009 and has returned to the range prevailing before the financial crisis (Chart 4.4.4). Credit scores at mortgage origination remained above historical averages. Borrowers with high or medium credit scores generally have access to mortgages backed by the Enterprises. Borrowers with low credit scores continue to face tight (albeit easing) credit conditions.
30
40
50
60
70
30
40
50
60
70
1990 1994 1998 2002 2006 2010 2014 2018
1990-Present Average
4.4.4 Owners’ Equity as Share of Household Real EstatePercent Percent
Source: Federal Reserve, Haver Analytics
As Of: 2018 Q2
4.4.4 Owners’ Equity as Share of Household Real Estate

30 2 0 1 8 F S O C / / Annual Report
4.5 Real Estate Markets
4.5.1 Residential Housing MarketsU.S. home prices rose in 2018 for a seventh straight year. The strong pace of appreciation reflects tight inventories of homes for sale, strong macroeconomic conditions, and a high level of consumer optimism. As of September 2018, FHFA’s seasonally adjusted purchase-only home price index for the U.S. grew by 6.0 percent from one year earlier, in line with average price growth over the prior six years. Every Census division posted positive home price appreciation (Chart 4.5.1).
Home affordability continued to decline over the past year, as price growth continued to exceed income growth and mortgage rates increased. Since the summer of 2011, the post-recession low point for U.S. home prices, home price appreciation has exceeded income growth by a wide margin.
Strong home price appreciation partly reflects the limited supply of homes available for sale. During the latter part of 2017 and first half of 2018, the supply of homes for sale was about 3 to 4 months at current sales rates, well below the 6-month mark typically associated with a well-balanced housing market. The annualized pace of existing home sales—existing home sales account for roughly 90 percent of all U.S. home sales—declined from 5.4 million in September 2017 to 5.2 million in September 2018. Starting in the spring of 2018, existing home sales began to trend down, reflecting the limited supply of homes for sale in many areas along with the more recent drop in affordability.
The pace of new home sales slowed by 6.3 percent between September 2017 and September 2018. The annualized pace of new home sales for single-family properties ranged from about 600,000 to 700,000. The average pace during that period was approximately 636,000—higher than in recent years, but still quite low considering the strength of the economy and demographic trends.
Index As Of: Sep-20184.5.1 House Prices by Census Region
Source: FHFA, Haver Analytics
50
100
150
200
250
300
350
400
50
100
150
200
250
300
350
400
1991 1995 1999 2003 2007 2011 2015
Index
MountainPacificWest South CentralSouth AtlanticWest North CentralTotal U.S.New EnglandEast South CentralMiddle AtlanticEast North Central
Note: Purchase-only price index. Jan-1991 = 100.
4.5.1 House Prices by Census Region

31Financ ia l Deve lopments
The latter part of 2017 and early 2018 saw no significant pickup in the pace of new home construction. As in prior years, labor and land shortages contributed to the low pace. The seasonally adjusted annual rate of new home starts increased by 1.3 percent to 1.27 million between September 2017 and September 2018, which is below the norms of the decades before the crisis. This relatively sluggish pace was particularly notable given the vast increases in home prices, which typically spur new home construction. Meanwhile, new construction is increasingly concentrated in the higher-price end of the market.
The U.S. homeownership rate peaked at 69.2 percent in 2004 and then fell to a low of 62.9 percent in 2016. It has increased since then. By September 2018 it rose to 64.4 percent, roughly in line with the average observed between 1965 and 1995.
Mortgage Originations, Servicing, and Loan PerformanceThe interest rate for 30-year fixed-rate mortgage loans has increased notably over the past year. According to Freddie Mac’s Primary Mortgage Market Survey, the average new 30-year mortgage rate reached 4.83 percent in October 2018, from 3.9 percent one year earlier. The rate increase broadly reflects the rise in long-term U.S. interest rates.
As mortgage rates rose in the latter half of 2017 and early 2018, the pace of mortgage origination slowed (Chart 4.5.2). The decline in total mortgage origination was primarily a result of decreases in refinancing activity, as higher rates made refinancing a less attractive option. However, mortgage originations for purchases have risen, but not as significantly. Purchase origination volume totaled an estimated $346 billion in the third quarter of 2018, up 3.4 percent from the volume originated in the third quarter of 2017.
In the post-crisis period there has been a substantial migration in mortgage lending and servicing from banks to nonbanks; that trend
0
2
4
6
8
10
12
0
200
400
600
800
1000
1200
1992 1996 2000 2004 2008 2012 2016
30-Year Mortgage Rate (right axis)
4.5.2 Mortgage Originations and RatesBillions of US$ Percent
Source: Mortgage Bankers Association, Freddie Mac Primary Mortgage Market Survey
As Of: 2018 Q3
Refinance (left axis)Purchase (left axis)
Note: Originations represent all 1-4 family homes. Originations calculated as 4-quarter moving averages. Mortgage rates calculated as quarterly averages.
4.5.2 Mortgage Originations and Rates

32 2 0 1 8 F S O C / / Annual Report
0
10
20
30
40
50
60
0
250
500
750
1000
1250
1500
1750
2009 2010 2011 2012 2013 2014 2015 2016 2017 2018
4.5.3 Mortgage Origination MarketBillions of US$ Percent
Source: Inside Mortgage Finance
As Of: 2018 Q3
Bank (left axis)Nonbank (left axis)
Nonbank Share of Total (right axis)
Note: 2018 data through third quarter. Data covers top 25 originators in each year.
YTD
4.5.3 Mortgage Origination Market
0
1
2
3
4
5
6
0
1
2
3
4
5
6
2000 2003 2006 2009 2012 2015 2018Source: Mortgage Bankers Association, Haver Analytics
As Of: 2018 Q3Percent4.5.5 Mortgage Delinquency and Foreclosure
Note: Percent of all mortgages.
Percent
MortgageForeclosure
Inventory Mortgage Payments90+ Days Past Due
0
10
20
30
40
50
60
0
2
4
6
8
10
2009 2010 2011 2012 2013 2014 2015 2016 2017 2018
4.5.4 Mortgage Servicing MarketTrillions of US$ Percent
Source: Inside Mortgage Finance
As Of: 2018 Q3
Bank (left axis)Nonbank (left axis) Nonbank Share of Total
(right axis)
Note: Data is as of fourth quarter each year except 2018 is as of third quarter. Data covers top 25 servicers in each quarter.
continued in 2018. Nonbanks accounted for 42 percent of the volume of mortgages originated by the top 25 originators in 2018, down from 43 percent in 2017 but up from 8.5 percent in 2009 (Chart 4.5.3). Nonbanks also accounted for 41 percent of mortgage servicing rights (MSR) held by the top 25 servicers in 2018, up from 40 percent in 2017 and 4.8 percent in 2009 (Chart 4.5.4). Moreover, four of the top ten mortgage originators are now nonbanks, compared to just two in 2009, and five of the top ten servicers are nonbanks, compared to one in 2009. Nonbanks have become especially important in the servicing of government-backed mortgages, servicing 61 percent of Ginnie Mae mortgages, 40 percent of Fannie Mae mortgages, and 36 percent of Freddie Mac mortgages, compared to 34 percent, 26 percent, and 21 percent, respectively, at the end of 2014. The growth of nonbank servicers, coupled with the more limited capital and liquidity resiliency typically associated with such firms, highlights the importance of risk-management procedures among these firms. The Enterprises, Ginnie Mae, and the BCFP have issued requirements for nonbank servicers that may mitigate some of these risks.
Buoyed by the continued increases in home prices, and low unemployment rates, along with other factors, loan performance continued to be strong in late 2017 and 2018. Hurricanes Irma, Harvey, and Maria caused a temporary increase in mortgage delinquencies in the latter part of 2017, which in turn affected national estimates. Mortgages more than 90-days past due rose to 1.7 percent in fourth quarter of 2017, but returned to 1.1 percent by the third quarter of 2018 (Chart 4.5.5).
4.5.5 Mortgage Delinquency and Foreclosure
4.5.4 Mortgage Servicing Market

33Financ ia l Deve lopments
0
5
10
15
20
25
30
0
150
300
450
600
750
900
2010 2011 2012 2013 2014 2015 2016 2017 2018
Value of Negative Equity in Residential Mortgages
(left axis)
Percent of Residential Mortgages with Negative Equity
(right axis)
4.5.6 Mortgages with Negative EquityBillions of US$ Percent
Source: CoreLogic
As Of: 2018 Q2
4.5.6 Mortgages with Negative EquityNegative housing equity declined as home prices continued their robust climb in 2017 and 2018 (Chart 4.5.6). The share of U.S. residential borrowers with negative equity decreased from 5.4 percent in the second quarter 2017 to approximately 4.3 percent in the second quarter of 2018. However, the share of borrowers who are “underwater” continued to vary significantly across metropolitan areas and states. The latest available estimates suggest that Louisiana, Illinois, Connecticut, Florida, and New Jersey have the highest shares of underwater borrowers.
One key measure of mortgage borrower credit quality—Fair Isaac Corporation (FICO) scores—remained relatively strong in 2017 and the first part of 2018 (Chart 4.5.7). Since the end of the crisis period, the set of borrowers receiving mortgage credit continue to exhibit much higher credit scores on average than was observed at any point since 2000. Since 2012, average FICO scores for new mortgage borrowers have remained about the same, although FICOs improved slightly between 2016 and 2017. The highest FICO score category—above 760, has grown from approximately 20 percent of dollars lent in 2000, to 30 percent in 2008, to nearly 40 percent of the market in 2017.
Bank mortgage lending standards appeared stable in the last year, while there were continued signs of easing in secondary mortgage markets, which may reflect easing by nonbank lenders. Federal Reserve surveys of bank mortgage lending standards in 2017 and 2018 were broadly similar to 2016. When asked to characterize quarterly changes in mortgages lending standards, the vast majority of bank loan officers regularly reported that they were “basically unchanged.” It is also noted that banks continue to maintain their share of the market for jumbo mortgages, those with amounts above the conventional conforming limit.
0
20
40
60
80
100
0
20
40
60
80
100
2000 2002 2004 2006 2008 2010 2012 2014 2016
4.5.7 Purchase Origination Volume by Credit ScorePercent of Originations Percent of Originations
Source: McDash, FHFA calculations
As Of: 2017
Note: Includes first lien purchases only.
<600
600-659
660-699
700-719
720-759
>760
4.5.7 Purchase Origination Volume by Credit Score
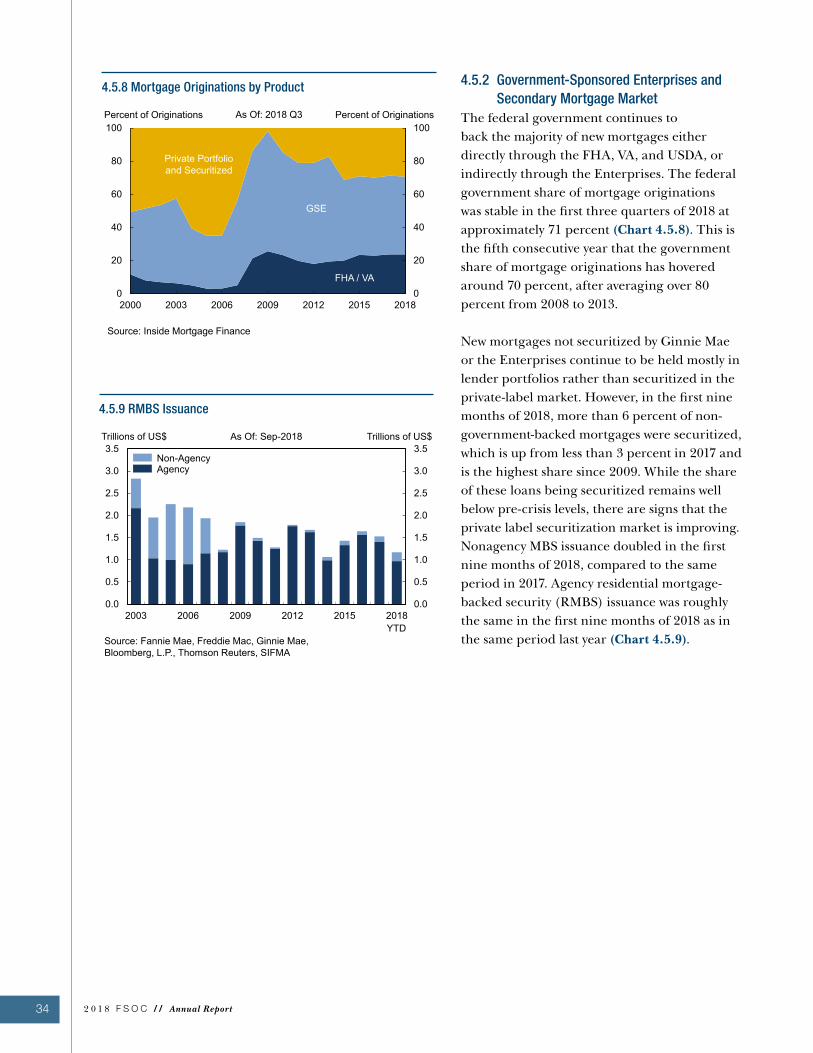
34 2 0 1 8 F S O C / / Annual Report
0.0
0.5
1.0
1.5
2.0
2.5
3.0
3.5
0.0
0.5
1.0
1.5
2.0
2.5
3.0
3.5
2003 2006 2009 2012 2015 2018
4.5.9 RMBS IssuanceTrillions of US$ Trillions of US$
Source: Fannie Mae, Freddie Mac, Ginnie Mae, Bloomberg, L.P., Thomson Reuters, SIFMA
As Of: Sep-2018
Non-AgencyAgency
YTD
0
20
40
60
80
100
0
20
40
60
80
100
2000 2003 2006 2009 2012 2015 2018
4.5.8 Mortgage Originations by ProductPercent of Originations Percent of Originations
Source: Inside Mortgage Finance
As Of: 2018 Q3
FHA / VA
GSE
Private Portfolio and Securitized
4.5.9 RMBS Issuance
4.5.8 Mortgage Originations by Product 4.5.2 Government-Sponsored Enterprises and Secondary Mortgage Market
The federal government continues to back the majority of new mortgages either directly through the FHA, VA, and USDA, or indirectly through the Enterprises. The federal government share of mortgage originations was stable in the first three quarters of 2018 at approximately 71 percent (Chart 4.5.8). This is the fifth consecutive year that the government share of mortgage originations has hovered around 70 percent, after averaging over 80 percent from 2008 to 2013.
New mortgages not securitized by Ginnie Mae or the Enterprises continue to be held mostly in lender portfolios rather than securitized in the private-label market. However, in the first nine months of 2018, more than 6 percent of non-government-backed mortgages were securitized, which is up from less than 3 percent in 2017 and is the highest share since 2009. While the share of these loans being securitized remains well below pre-crisis levels, there are signs that the private label securitization market is improving. Nonagency MBS issuance doubled in the first nine months of 2018, compared to the same period in 2017. Agency residential mortgage-backed security (RMBS) issuance was roughly the same in the first nine months of 2018 as in the same period last year (Chart 4.5.9).

35Financ ia l Deve lopments
Fannie Mae and Freddie MacFannie Mae issued the first-ever SOFR securities in July 2018. The offering was issued in three tranches of 6-, 12-, and 18-month maturities and was met with strong investor demand.
Fannie Mae also continues to lay off risk to private capital in the mortgage market and reduce taxpayer risk through its credit risk transfer transactions. This is done primarily through its issuance of its Connecticut Avenue Securities (CAS) and its Credit Insurance Risk Transfer (CIRT) transactions. In the first half of 2018, Fannie Mae transferred a portion of the credit risk on single-family mortgages with UPB of $150 billion. Since inception of its risk transfer programs, Fannie Mae has transferred a portion of the credit risk on single-family mortgages with UPB of over $1.0 trillion.
Freddie Mac transferred a portion of the credit risk on $192 billion in UPB of single-family mortgage loans in the first half of 2018, primarily through its issuance of Structured Agency Credit Risk (STACR) securities and through its Agency Credit Insurance Structure (ACIS) transactions. Since it began undertaking credit risk transfers, as of the second quarter of 2018, Freddie Mac has executed transactions covering $1.0 trillion in UPB.
A wide array of institutional investors have purchased mortgage credit risk from the Enterprises, with over 170 investors participating in the CAS and STACR programs. More than 80 percent of the credit risk transferred through these programs has been purchased by asset managers and hedge funds, but the list of investors also includes a mix of banks, insurance companies, real estate investment trusts (REITs), and sovereign wealth funds.

36 2 0 1 8 F S O C / / Annual Report
Federal Home Loan BanksThe Federal Home Loan Banks (FHLBs) continued to be an important source of liquidity for the mortgage market. They reported aggregate net income of $3.4 billion in 2017 near an all-time high, but marginally lower than in 2016 because of lower securities settlements, as continued increases in advances drove asset growth. Advances are a credit product FHLBs extend to their members to help them meet short- and long-term liquidity needs; they carry a yield slightly higher than a FHLB debt obligation of similar maturity. FHLB advances have now reached their highest quarter-end level in the post-crisis period, though outstanding advances remain below the levels experienced during the height of the financial crisis. The growth of advances in 2017 was concentrated primarily in maturities of less than one year, which accounted for 56 percent of outstanding advances at year-end 2017, compared to 41 percent at year-end 2016.
Outstanding FHLB debt has grown to support increases in advances and liquidity holdings. The increased debt has been supported by increased demand from money funds following the 2016 implementation of money fund reform. Total short-term FHLB debt—debt maturing in one year or less—has been stable over the past three years at about 76 percent of debt outstanding. The short-term share of FHLB assets is lower, but above 50 percent of total assets. The composition of debt outstanding has shifted over the past two years as the FHLBs have reduced their use of discount notes, which have a maturity of one year or less, from a 55 percent share of debt outstanding at year-end 2015 to a 38 percent share at year-end 2017.

37Financ ia l Deve lopments
0
1
2
3
4
5
3
4
5
6
7
8
9
2001 2004 2007 2010 2013 2016
4.5.11 Multifamily Capitalization Rates and SpreadsPercent Percent
Source: Real Capital Analytics
Multifamily Cap Rate (left
axis)Multifamily Cap Rate Spread (right axis)
As Of: Sep-2018
Note: Dotted lines represent 2001-present average.
4.5.11 Multifamily Capitalization Rates and Spreads
0
25
50
75
100
125
150
175
200
0
25
50
75
100
125
150
175
200
2000 2002 2004 2006 2008 2010 2012 2014 2016
RetailOffice CBD
4.5.10 Commercial Property Price IndicesIndex Index
Source: Real Capital Analytics
National
Note: Jul-2007 = 100.
Apartment
As Of: Sep-2018
4.5.10 Commercial Property Price Indices 4.5.3 Commercial Real EstateCRE prices continued to grow strongly in 2018, with a national aggregate price index growing 7.2 percent year-over-year as of September (Chart 4.5.10). Price growth in apartment buildings outpaced that of other CRE sectors. The increase in apartment property prices contrasts with the slowdown seen in prices for office properties located in central business districts and for retail properties.
CRE capitalization rates—the ratio of a property’s expected annual net operating income to its price—remain very low by historical standards, though the aggregate rate has modestly increased in 2018 as shown for multifamily properties (apartment buildings) (Chart 4.5.11). One measure of risk premium in CRE—the spread between CRE capitalization rates and the 10-year Treasury yield—narrowed notably, driven by higher Treasury yields. That measure of CRE risk premium is now below its historical average, though it remains notably higher than the lows reached prior to the financial crisis, when Treasury yields were higher.
The volume of CRE property sales fell 4.2 percent year-over-year in 2017, then recovered to 2016 levels by June 2018. However, there appears to be divergence among property types. Warehouses and industrial properties related to e-commerce activities have experienced a significant increase in volume, whereas transactions involving office properties have, generally, substantially declined from prior years.

38 2 0 1 8 F S O C / / Annual Report
As of the second quarter of 2018, outstanding CRE loans totaled $4.2 trillion, increasing 6.3 percent from one year earlier. CRE loans are worth approximately 20 percent of GDP, somewhat below the peak level of 23 percent in 2008. Notably, lending through multifamily residential mortgages continued to be dominated by the Enterprises, whose collective share increased to over 47 percent of total outstanding multifamily mortgages. Banks and life insurance companies continued to expand CRE loan portfolios, albeit at a slower rate than observed in 2016. CRE loans outstanding at U.S. banks and life insurers reached $2.1 trillion and $486 billion, respectively, in March 2018; those figures are 5 percent and 8 percent higher than one year earlier.
CRE delinquency rates generally remained stable in 2018. One area that showed notable improvement was the delinquency rate of the CRE loans held in commercial mortgage-backed securities (CMBS), as problem loans originated at the peak of the previous credit cycle in 2006-2007 were resolved.
Overall CMBS issuance was flat in 2018, based on data through September 2018. Non-agency CMBS issuance decreased 5 percent as of September 2018, compared to the same period in 2017. That follows very strong 19 percent growth in 2017. Agency CMBS issuance rose 6.6 percent year-over-year as of September 2018; that follows record issuance of $148 billion in 2017 as the Enterprises continued to expand their securitization programs. Agency CMBS issuance comprised about 61 percent of total CMBS issuance from 2017 to September 2018 (Chart 4.5.12).
0
50
100
150
200
250
0
50
100
150
200
250
2001 2004 2007 2010 2013 2016
4.5.12 CMBS IssuanceBillions of US$ Billions of US$
Source: Inside Mortgage Finance
As Of: 2018 Q3
AgencyNon-Agency
4.5.12 CMBS Issuance

39Financ ia l Deve lopments
4.6 Foreign Exchange
After depreciating steadily for most of 2017, the U.S. dollar has been gradually strengthening since early 2018, rising by 5.8 percent on a nominal trade-weighted basis from January to October 2018. The U.S dollar is now 13 percent stronger than its average level over the last 20 years, measured on a trade-weighted basis (Chart 4.6.1). The dollar has been supported by gradual interest rate increases from the Federal Reserve, continued strong growth in the United States, and concerns about the growth outlook in some other large economies.
The euro has weakened relative to the U.S. dollar in 2018, after appreciating strongly in 2017, as the ECB has signaled that policy rates will remain at current low levels (Chart 4.6.2). Broader concerns about the global growth outlook—an important factor for the export-oriented euro area economies—may have also weighed on the common currency.
80
90
100
110
120
80
90
100
110
120
1998 2001 2004 2007 2010 2013 2016
Source: Federal Reserve, Haver Analytics
As Of: Oct-2018Index4.6.1 Nominal U.S. Dollar Trade-Weighted Index
Note: Jan-1998 = 100. Nominal U.S. Dollar Trade-Weighted Index is a weighted average of the foreign exchange value of the U.S. dollar against the currencies of a broad group of major U.S. trading partners.
Index
50
75
100
125
150
50
75
100
125
150
2010 2011 2012 2013 2014 2015 2016 2017 2018
4.6.2 U.S. Dollar Exchange RatesIndex IndexAs Of: Oct-2018
Dollar-RMBDollar-EuroEM Dollar IndexMajor Dollar Index
Source: Federal Reserve, Haver Analytics
Note: Jan 2010 = 100. EM dollar index is a weighted average of the FX values of the dollar against a subset of currencies in the broad index that do not circulate widely outside the country of issue.
4.6.2 U.S. Dollar Exchange Rates
4.6.1 Nominal U.S. Dollar Trade-Weighted Index

40 2 0 1 8 F S O C / / Annual Report
The Chinese renminbi (RMB) is near its weakest level against the U.S. dollar in the last decade. The RMB had strengthened gradually over 2017 and into early 2018, both against the dollar and on a broader trade-weighted basis. This trend reversed in the second quarter, however, and over the summer the RMB went through its most notable weakening episode since mid-2015. As of October, the RMB had weakened in 2018 by about 6 percent against the dollar and 2.6 percent against a trade-weighted basket of currencies. Depreciation pressures have appeared to stem from concerns that the Chinese economy could slow, as well as uncertainty about the authorities’ exchange rate objectives. Since the summer, authorities have reportedly used several tools to stem depreciation pressures, including implementing administrative measures and increasing control over daily central parity exchange rate levels through reintroduction of a countercyclical adjustment factor.
Financial strains in some emerging markets have produced large swings in some foreign exchange (FX) markets. As of October 2018, the Argentine peso was 51 percent weaker against the dollar than one year earlier. The Turkish lira was 32 percent weaker against dollar than one year earlier. Financial market turbulence partially spilled over into other emerging markets and weighed more broadly on currencies (Chart 4.6.3).
-60
-50
-40
-30
-20
-10
0
10
-60
-50
-40
-30
-20
-10
0
10
4.6.3 Change in U.S. Dollar Exchange RatesPercent Percent
Source: Wall Street Journal, Haver Analytics
As Of: 31-Oct-2018
Year-over-Year ChangeChange Since Mid-May 2018
4.6.3 Change in U.S. Dollar Exchange Rates

41Financ ia l Deve lopments
4.7 Equities
U.S. equity prices were 1.4 percent higher in October 2018 than at the close of 2017. Equity prices across most other developed and emerging markets were generally weaker than six months and one year earlier (Chart 4.7.1). Emerging markets saw the greatest pressure in 2018 due to trade concerns, a modest growth slowdown in China, a strengthening of the U.S. dollar, and local financial stresses in some markets.
U.S. equity markets rose sharply in January 2018 before a sell-off in early February with the S&P 500 experiencing its first ten percent decline since 2016. The sudden February 5 sell-off was largely attributed to non-fundamental factors (see Box D). Market participants noted the speed and extent of the January rally in U.S. equity prices had further stretched already elevated equity market valuations, potentially leaving the market vulnerable to a correction. U.S. equity markets recovered in the second and third quarters of 2018, and reached all-time highs in September 2018. However, equity markets sold off again in October as investors reassessed high valuations against weaker earnings guidance, expectations for slowing growth momentum in the United States, and increased geopolitical risks.
The technology sector outperformed broader U.S. equity markets in 2017 and the first half of 2018, supported by strong earnings growth and investor preference for “growth” stocks. However, U.S. technology stocks depreciated in the latter half of 2018, with particularly sharp declines in October. The financial and industrial sectors outperformed the broad U.S. equity market in 2017, but have lagged modestly in 2018.
6 Month Returns1 Year
Returns5 Year Annualized
ReturnsMajor EconomiesU.S. (S&P) 2.4% 5.3% 9.1%Euro (Euro Stoxx) (9.6%) (11.2%) 2.7%Japan (Nikkei) (2.4%) (0.4%) 8.9%U.K. (FTSE) (5.1%) (4.9%) 1.2%Selected EuropeGermany (DAX) (9.2%) (13.5%) 4.8%France (CAC) (7.7%) (7.4%) 3.4%Italy (FTSE MIB) (20.6%) (16.4%) (0.3%)Spain (IBEX) (10.9%) (15.5%) (2.1%)Emerging MarketsMSCI Emerging Market Index (17.9%) (14.6%) (1.6%)Brazil (Bovespa) 1.5% 17.6% 10.0%Russia (MICEX) 2.0% 14.0% 9.3%India (Sensex) (2.0%) 3.7% 10.2%China (Shanghai SE) (15.6%) (23.3%) 4.0%Hong Kong (Hang Seng) (18.9%) (11.6%) 1.5%South Korea (KOSPI) (19.3%) (19.6%) (0.0%)
4.7.1 Returns in Selected Equities Indices
Source: Capital IQ
As Of: 31-Oct-2018
4.7.1 Returns in Selected Equities Indices

42 2 0 1 8 F S O C / / Annual Report
Even after price depreciations in October and November 2018, U.S. equity valuations remain elevated according to various metrics, particularly the cyclically-adjusted price-to-earnings (CAPE) ratio, which accounts for the long-term earnings of S&P 500 firms (Chart 4.7.2). Although U.S. equity market volatility remained below the historical average for most of 2018, there were meaningful spikes in February and October (Chart 4.7.3).
4.8 Commodities
Commodity prices rose strongly, on net, in the second half of 2017 and the first half of 2018, with the overall index rising 31 percent over this period. Commodity prices were more varied in the third quarter of 2018 (Chart 4.8.1).
Crude oil prices rose to multi-year highs in 2018, before falling sharply in October. In June 2018, the Organization of Petroleum Exporting Countries (OPEC) agreed to increase total production to compensate for the decline in Venezuelan oil production and the anticipated decline in Iranian exports related to the re-imposition of U.S. sanctions. U.S. production has increased steadily over the past two years, and the average spread between West Texas Intermediate (WTI) and Brent crude oil increased from $1.50 in October 2016 to nearly $10 in October 2018. WTI peaked at $77 per barrel in early October 2018, before falling sharply amid concerns regarding a slowdown in global economic growth, diminishing expectations of Iranian supply decline, and rising levels of non-OPEC supply.
Industrial metals rose sharply in 2017, before retracing roughly half of that gain in 2018, with the S&P GSCI Industrial Metals Index falling 17 percent in 2018 through October. In particular, copper prices fell over 20 percent in the summer of 2018 amid weakening emerging market demand and rising concerns over trade tensions. Meanwhile, the S&P GSCI Agriculture Index was range-bound in 2017 and 2018.
Index As Of: 31-Oct-20184.8.1 Commodities
0
25
50
75
100
125
150
175
200
0
25
50
75
100
125
150
175
200
2008 2010 2012 2014 2016 2018
Index
Industrial Metals (S&P GSCI Industrial Metals Spot Index)Agriculture (S&P GSCI Agricultural Spot Index)Natural GasCrude Oil (WTI)
Source: Energy Information Administration, S&P, Haver Analytics Note: 02-Jan-2008 = 100.
4.8.1 Commodities
Metric Current Historical Percentile
CAPE Ratio 30.6 96%
Buffett Indicator 146% 96%
Price-to-Book 3.3% 80%
Price-to-Earnings 18.9 71%
Forward Price-to-Earnings 16.2 62%
4.7.2 U.S. Stock Valuations
Source: Bloomberg L.P., Wilshire Associates, HaverAnalytics, OFR
Note: Percentiles are based on historical data since, respectively, 1881, 1970, 1990, 1954, and 1990. CAPE, price-to-book, and price-to-earnings ratios are based on the S&P 500 aggregate index. Buffett Indicator is based on the Wilshire 5000.
As Of: 30-Nov-2018
4.7.2 U.S. Stock Valuations
0
20
40
60
80
100
0
20
40
60
80
100
2007 2009 2011 2013 2015 2017
4.7.3 S&P 500 VolatilityIndex Index
Source: Bloomberg, L.P.
As Of: 31-Oct-2018
20-Year Average
VIX
4.7.3 S&P 500 Volatility

43Financ ia l Deve lopments
4.9 Wholesale Funding Markets
4.9.1 Unsecured Borrowing
Commercial PaperTotal Commercial Paper (CP) outstanding has grown modestly in 2018 through September, after increasing 9.2 percent in 2017 (Chart 4.9.1). It had reached a multi-decade low of about $900 billion in late- 2016 and totaled about $1 trillion as of September 2018.
Domestic financial CP outstanding increased to about $236 billion at the end of September 2018, up 19 percent from one year earlier; over 40 percent of CP in this segment of the market is issued by U.S. subsidiaries of foreign banks. Foreign financial CP outstanding increased to $307 billion at the end of September 2018, up 13 percent from one year earlier. Asset-backed CP outstanding has been steady at around $240 billion since the beginning of 2017.
The decline in assets under management (AUM) of prime MMFs leading up to the implementation of MMF reforms in October 2016 diminished MMF demand for CP, driving the reduction in CP outstanding in 2016. Since early 2017, a partial rebound in prime MMFs’ holdings of CP has accounted for most of the increase in CP outstanding.
Interest rates on CP increased in 2016-17 in response to Federal Reserve rate hikes; however, in early 2018, rates on longer-tenor CP rose by more than the increases in federal funds rates, as did many other U.S. money market instruments with maturities greater than 30 days (Chart 4.9.2). Market participants broadly attributed this development to higher issuance of short-term Treasury debt in early 2018, which increased interest rates on Treasury bills and other short-term U.S. dollar debt such as CP. Other factors may have contributed to this development, including corporate foreign earnings repatriation. The spread between money market and federal funds rates has since narrowed.
0.0
0.5
1.0
1.5
2.0
2.5
0.0
0.5
1.0
1.5
2.0
2.5
2001 2004 2007 2010 2013 2016
4.9.1 Commercial Paper OutstandingTrillions of US$ Trillions of US$As Of: Sep-2018
Domestic FinancialDomestic NonfinancialForeign Financial
Asset-Backed
OtherForeign Nonfinancial
Source: Federal ReserveNote: Domestic includes CP issued in the U.S. by entities with foreign parents.
4.9.1 Commercial Paper Outstanding
0.0
0.5
1.0
1.5
2.0
2.5
0.0
0.5
1.0
1.5
2.0
2.5
Jan:15 Jul:15 Jan:16 Jul:16 Jan:17 Jul:17 Jan:18 Jul:18
4.9.2 Commercial Paper Interest RatesPercent PercentAs Of: 28-Sep-2018
90-Day AA-Rated ABCP90-Day AA-Rated Financial90-Day AA-Rated NonfinancialOvernight AA-Rated ABCPOvernight AA-Rated FinancialOvernight AA-Rated Nonfinancial
Source: Federal Reserve Bank of St. Louis
4.9.2 Commercial Paper Interest Rates

44 2 0 1 8 F S O C / / Annual Report
Large Time DepositsLarge time deposits at commercial banks, which include wholesale certificates of deposit, increased to $1.7 trillion, or 11 percent of total commercial bank liabilities, in September 2018 from the recent low of $1.5 trillion around the implementation of MMF reforms in October 2016. The current total is still 22 percent below its 2008 peak of $2.1 trillion.
4.9.2 Secured Borrowing
Repo MarketsActivity in the U.S. repo market has been stable over the past year, with steady volumes and rates broadly moving in line with other money market rates. The market consists of two segments: tri-party repo, in which settlement occurs within the custodial accounts of a clearing bank, and bilateral repo, which typically refers to all activity not settled within the tri-party system. Both segments are served, in part, by CCPs. Tri-party repo includes the General Collateral Finance (GCF) Repo Service, a service operated by the Fixed Income Clearing Corporation (FICC) that provides blind-brokered trades, while bilateral repo includes the FICC Delivery-versus-Payment (DVP) Repo Service. Clearing and settlement in the tri-party market has undergone a recent structural change as Bank of New York Mellon is now effectively the sole tri-party repo clearing bank for government securities.
Total repo market borrowing by primary dealers ranged between $2.0 and $2.3 trillion for the 12 months ending September 2018, as in prior years (Chart 4.9.3). The distribution of financing between overnight and term remained relatively unchanged during the year, with about two-thirds of financing occurring overnight. As in the past, among term repo, slightly more volume was funded at maturities one month or longer than at terms shorter than one month, except for a brief period in early 2018.
0
1
2
3
4
5
0
1
2
3
4
5
2000 2003 2006 2009 2012 2015 2018
4.9.3 Primary Dealer Repo AgreementsTrillions of US$ Trillions of US$As Of: 26-Sep-2018
Source: FRBNY
Overnight/ContinuingTerm
4.9.3 Primary Dealer Repo Agreements

45Financ ia l Deve lopments
The proportion of collateral in tri-party repo transactions that is high-quality rose slightly from September 2017 to September 2018 (Chart 4.9.4). Fedwire-eligible collateral, which includes Treasury and agency securities as well as agency MBS and collateralized mortgage obligations accounted for 85 percent of the total collateral financed. Median haircuts required on collateral used in tri-party repo transactions were flat from September 2017 to September 2018 across most collateral classes.
In April 2018, the Federal Reserve Bank of New York (FRBNY), in cooperation with the OFR, began publishing benchmark rates based on overnight repo transactions collateralized by Treasury securities. SOFR is the broadest measure of the cost of short-term funding secured by high-quality collateral.
Securities LendingThe value of securities on loan globally increased to a multi-year high of $2.6 trillion in the first half of 2018, declining somewhat in the third quarter (Chart 4.9.5). The growth can be attributed, in part, to increased valuations of equity and credit markets and higher borrowing to hedge some of the market gains. The estimated U.S. share of the global activity also increased, reaching approximately 55 percent.
Government bonds and equities are estimated to comprise 88 percent of the securities on loan globally. As of September 2018, equities represented around 43 percent while government securities accounted for approximately 45 percent.
0
1
2
3
4
5
0
1
2
3
4
5
2008 2010 2012 2014 2016 2018
4.9.5 Value of Securities on LoanTrillions of US$ Trillions of US$
Source: Markit Group Limited
Global Market (including U.S.)
U.S. Market
As Of: 28-Sep-2018
Note: Data is based on a survey of agent-based lenders.
4.9.5 Value of Securities on Loan
0.0
0.5
1.0
1.5
2.0
2.5
3.0
0.0
0.5
1.0
1.5
2.0
2.5
3.0
2011 2012 2013 2014 2015 2016 2017 2018
4.9.4 Collateral in the Tri-Party Repo MarketTrillions of US$ Trillions of US$
Source: FRBNY, Haver Analytics
As Of: Sep-2018
Note: Other includes CDOs, international securities, money markets, municipal debt, and whole loans.
U.S. Treasury StripsAgency MBSAgency Debentures and Strips
U.S. Treasuries excluding StripsCorporatesABSPrivate Label CMOs
Equities
OtherAgency CMOs
4.9.4 Collateral of the Tri-Party Repo Market

46 2 0 1 8 F S O C / / Annual Report
Collateral management practices have changed in recent years. Use of cash collateral declined significantly post-crisis, but increased slightly in the second quarter of 2018, reaching 54 percent of the global securities lending activity. This trend can be attributed to higher money market rates available to cash collateral managers thanks to the rising interest rate environment. Some cash reinvestment managers have extended the duration of their portfolio in recent years: the median weighted average maturity (WAM) is near the top of its post-crisis range. Meanwhile, the mean WAM has been relatively stable in 2017 and 2018, after trending down in prior years (Chart 4.9.6).
The share of cash reinvestment portfolios allocated to repos backed by non-government collateral has grown in recent years to slightly over 27 percent as of June 2018. The share of government repos declined to under 13 percent (Chart 4.9.7). Corporate debt securities, mostly floating rate, are the second largest item in cash reinvestment portfolios at 16 percent.
0
20
40
60
80
100
0
20
40
60
80
100
2012 2014 2016 2018
4.9.7 U.S. Securities Lending Cash ReinvestmentPercent of Total Percent of Total
Source: The Risk Management Association; OFR.
As Of: 2018 Q2
Note: Nongovernment repos have collateral of whole loans, equity, and corporate debt. Data is based on a survey of agent-based lenders.
Nongovernment Repo
Corporate Securities
Other Funds
Government Repo
Money Market Funds
Other InstrumentsCommercial Paper
Bank Deposits
0
50
100
150
200
250
0.0
0.4
0.8
1.2
1.6
2.0
2000 2003 2006 2009 2012 2015 2018
4.9.6 U.S. Securities Lending Cash ReinvestmentTrillions of US$ Days
Source: The Risk Management Association
Mean WAM (right axis)
Median WAM (right axis)
As Of: 2018 Q2
Note: Data is based on a survey of agent-based lenders.
Total Cash Reinvestment (left axis)
4.9.7 U.S. Securities Lending Cash Reinvestment
4.9.6 U.S. Securities Lending Cash Reinvestment

47Financ ia l Deve lopments
4.10 Derivatives Markets
4.10.1 FuturesPrices in a number of futures market segments paralleled movements in their underlying assets for 2017 and 2018. Equity futures generally rose steadily through 2017 and 2018, albeit with sudden declines in February and October 2018. The U.S. Dollar Index futures fell in 2017, but rose in the second quarter of 2018. Commodity futures were relatively flat in the first three quarters of 2017, then increased sharply as discussed in Section 4.8 (Chart 4.10.1). Implied volatility in Treasury and oil markets remained relatively stable in 2017 and the first ten months of 2018, while implied equity market volatility reached record lows in 2017 before spiking in February and October 2018 (Chart 4.10.2).
Trading volumes and open interest generally increased across major futures exchanges in 2017, continuing a trend from prior years (Charts 4.10.3, 4.10.4). The number of products offered on commodity futures exchanges remained relatively flat on most exchanges, with a small decline on some exchanges (Chart 4.10.5).
4.10.1 Normalized Futures Prices
Source: Bloomberg, L.P.
0.2
0.4
0.6
0.8
1.0
1.2
1.4
1.6
1.8
0.2
0.4
0.6
0.8
1.0
1.2
1.4
1.6
1.8
Jan:14 Jan:15 Jan:16 Jan:17 Jan:18
Index IndexAs Of: 31-Oct-2018
U.S. DollarE-mini S&P 50010-Year Treasury FuturesS&P Commodity Index
Note: 2-Jan-2014 = 1.0.
4.10.1 Normalized Futures Prices
4.10.2 Market Volatility Indices
Source: Bloomberg, L.P.
0
10
20
30
40
50
60
70
80
0
3
6
9
12
15
Jan:14 Jan:15 Jan:16 Jan:17 Jan:18
Index IndexAs Of: 31-Oct-2018
Treasury VIX (left axis)VIX (right axis)Crude Oil VIX (right axis)
4.10.2 Market Volatility Indices
4.10.3 Normalized Futures Exchange Volume
Source: CFTC
0.8
1.0
1.2
1.4
1.6
1.8
2.0
0.8
1.0
1.2
1.4
1.6
1.8
2.0
2010 2011 2012 2013 2014 2015 2016 2017
Index IndexAs Of: 2017
New York Mercantile ExchangeICE Futures U.S.Commodity Exchange Inc.Chicago Mercantile ExchangeChicago Board of Trade
4.10.3 Normalized Futures Exchange Volume

48 2 0 1 8 F S O C / / Annual Report
4.10.2 OptionsCurrently, there are fifteen registered national securities exchanges that list and trade standardized equity options. About half of these exchanges (or options facilities of existing exchanges) were established in the last decade. Transactions in securities-based standardized options are all centrally cleared by a single clearing agency—the Options Clearing Corporation, which required approximately $64 billion in total initial margin against those transactions as of June 2018. The Options Clearing Corporation is also the issuer and guarantor of each standardized options contract. Total exchange-traded equity options volume has been relatively steady for much of the past ten years. As of June 2018, there were over 4,000 equity securities underlying exchange-traded equity options.
With respect to over-the-counter (OTC) equity options, Bank for International Settlements (BIS) data shows that the global notional amount outstanding of OTC equity options was approximately $3.8 trillion as of June 2018, continuing a steady decline from 2008 (Chart 4.10.6). While the notional amount of outstanding OTC equity options is large in absolute magnitude, OTC equity options accounted for less than 1 percent of the global OTC derivatives market on a notional basis, or 3.7 percent on a market value basis (Chart 4.10.7). BIS data also shows that the global market value of OTC equity options transactions was $380 billion as of June 2018, significantly below record levels reported in the fourth quarter of 2008 (Chart 4.10.8).
0
1
2
3
4
5
6
7
8
9
0
1
2
3
4
5
6
7
8
9
1998 2001 2004 2007 2010 2013 2016
4.10.6 OTC Equity Options: Global Notional OutstandingTrillions of US$ Trillions of US$
Source: BIS, Haver Analytics
As Of: 2018 Q2
Other Financial InstitutionsNon-Financial Customers
Reporting Dealers
4.10.6 OTC Equity Options: Global Notional Outstanding
4.10.4 Normalized Futures Exchange Open Interest
Source: CFTC
0.6
0.8
1.0
1.2
1.4
1.6
1.8
2.0
2.2
2.4
0.6
0.8
1.0
1.2
1.4
1.6
1.8
2.0
2.2
2.4
2010 2011 2012 2013 2014 2015 2016 2017
Index IndexAs Of: 2017
New York Mercantile ExchangeICE Futures U.S.Commodity Exchange Inc.Chicago Mercantile ExchangeChicago Board of Trade
4.10.4 Normalized Futures Exchange Open Interest
4.10.5 Normalized Futures Exchange Number of Products
Source: CFTC
0.6
0.8
1.0
1.2
1.4
1.6
1.8
2.0
2.2
2.4
0.6
0.8
1.0
1.2
1.4
1.6
1.8
2.0
2.2
2.4
2010 2011 2012 2013 2014 2015 2016 2017
Index IndexAs Of: 2017
New York Mercantile ExchangeICE Futures U.S.Commodity Exchange Inc.Chicago Mercantile ExchangeChicago Board of Trade
4.10.5 Normalized Futures Exchange Number of Products

49Financ ia l Deve lopments
Within the U.S. banking sector, OTC equity option exposures are concentrated in a small number of major institutions. The six largest BHCs by total assets had written approximately 96 percent of the $1.3 trillion total OTC equity option notional outstanding written by all BHCs as of September 2017. Similarly, by that point the six largest BHCs also held purchased options representing approximately 94 percent of the approximately $901 billion in total OTC equity option notional outstanding held by all BHCs.
4.10.3 OTC DerivativesIn the United States, the notional amount of OTC interest rate derivatives has been steadily increasing over the past year, with the notional amount increasing 12 percent year-over-year as of September 2018, to $278 trillion (Chart 4.10.9). In particular, uncleared swaps rose 14 percent year-over-year to $63 trillion. Notional amount is just one way of measuring the size of the interest rate swaps market, and may exaggerate the amount of risk transfer in this market (see Box A).
The notional amount of credit index derivatives ticked up slightly in 2017 before falling to $4.4 trillion by September 2018. While the notional amount of credit index derivatives outstanding has remained fairly stable over the past two years, the share of cleared products has increased meaningfully, from 37 percent in August 2016 to 48 percent in September 2018.
As Of: 2018 Q24.10.7 OTC Equity Option Share of All OTC Derivatives
Source: BIS, Haver Analytics
0.0
3.0
6.0
9.0
12.0
15.0
0.0
0.5
1.0
1.5
2.0
2.5
1998 2001 2004 2007 2010 2013 2016
Gross Market Value (Right Axis)Notional Outstanding (Left Axis)
Percent Percent
4.10.7 OTC Equity Option Share of All OTC Derivatives
0
200
400
600
800
1000
1200
0
200
400
600
800
1000
1200
1998 2001 2004 2007 2010 2013 2016
4.10.8 OTC Equity Options: Global Market ValueBillions of US$ Billions of US$
Source: BIS, Haver Analytics
As Of: 2018 Q2
Other Financial InstitutionsNon-Financial Customers
Reporting Dealers
4.10.8 OTC Equity Options: Global Market Value
0
100
200
300
400
0
2
4
6
8
10
Jan:14 Jul:14 Jan:15 Jul:15 Jan:16 Jul:16 Jan:17 Jul:17 Jan:18 Jul:18
4.10.9 Derivatives Notional Amount OutstandingTrillions of US$ Trillions of US$
Source: CFTC
Interest Rate Derivatives(right axis)
Credit Index Derivatives(left axis)
As Of: 28-Sep-2018
4.10.9 Derivatives Notional Amount Outstanding
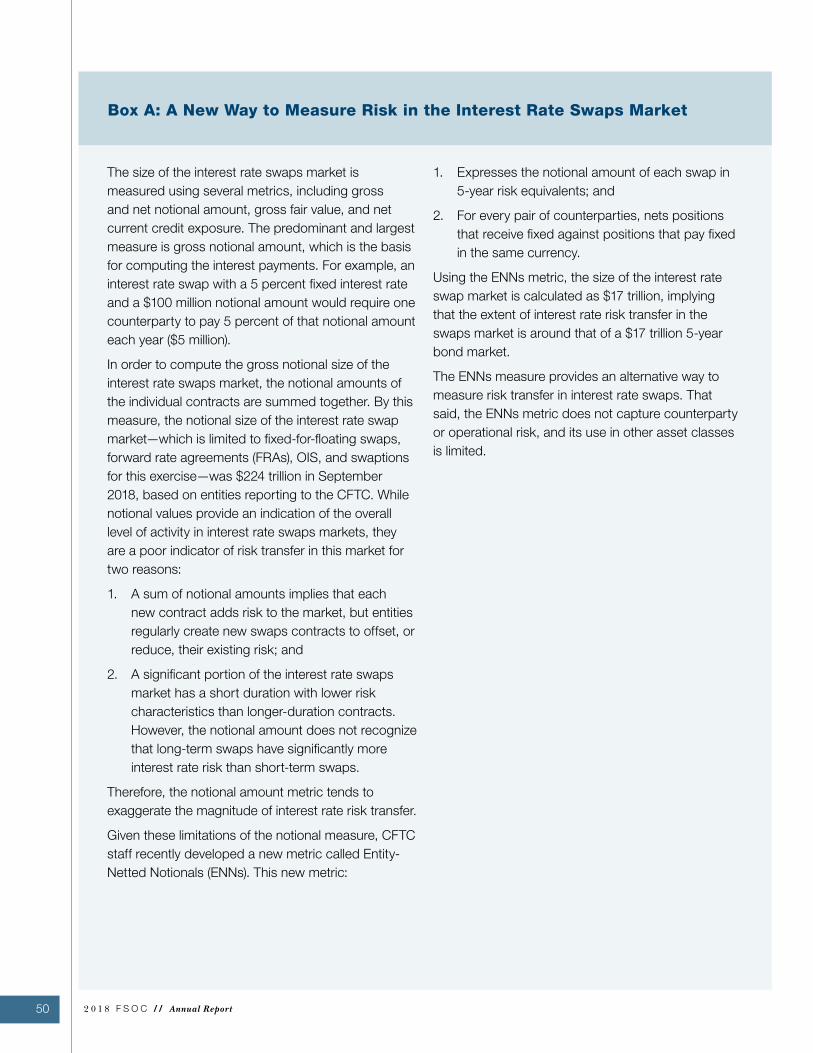
50 2 0 1 8 F S O C / / Annual Report
Box A: A New Way to Measure Risk in the Interest Rate Swaps Market
The size of the interest rate swaps market is measured using several metrics, including gross and net notional amount, gross fair value, and net current credit exposure. The predominant and largest measure is gross notional amount, which is the basis for computing the interest payments. For example, an interest rate swap with a 5 percent fixed interest rate and a $100 million notional amount would require one counterparty to pay 5 percent of that notional amount each year ($5 million).
In order to compute the gross notional size of the interest rate swaps market, the notional amounts of the individual contracts are summed together. By this measure, the notional size of the interest rate swap market—which is limited to fixed-for-floating swaps, forward rate agreements (FRAs), OIS, and swaptions for this exercise—was $224 trillion in September 2018, based on entities reporting to the CFTC. While notional values provide an indication of the overall level of activity in interest rate swaps markets, they are a poor indicator of risk transfer in this market for two reasons:
1. A sum of notional amounts implies that each new contract adds risk to the market, but entities regularly create new swaps contracts to offset, or reduce, their existing risk; and
2. A significant portion of the interest rate swaps market has a short duration with lower risk characteristics than longer-duration contracts. However, the notional amount does not recognize that long-term swaps have significantly more interest rate risk than short-term swaps.
Therefore, the notional amount metric tends to exaggerate the magnitude of interest rate risk transfer.
Given these limitations of the notional measure, CFTC staff recently developed a new metric called Entity-Netted Notionals (ENNs). This new metric:
1. Expresses the notional amount of each swap in 5-year risk equivalents; and
2. For every pair of counterparties, nets positions that receive fixed against positions that pay fixed in the same currency.
Using the ENNs metric, the size of the interest rate swap market is calculated as $17 trillion, implying that the extent of interest rate risk transfer in the swaps market is around that of a $17 trillion 5-year bond market.
The ENNs measure provides an alternative way to measure risk transfer in interest rate swaps. That said, the ENNs metric does not capture counterparty or operational risk, and its use in other asset classes is limited.

51Financ ia l Deve lopments
The weekly trading volumes of interest rate derivatives generally increased in 2017 and 2018, albeit with significant inter-period variation. In March 2018, 12-week average volumes hit an all-time high of $8.3 trillion, a 47 percent increase over 12-week average trading volumes from December 2017; while trading volumes declined over the summer of 2018, volumes increased in September 2018, with the 12-week average volumes rising to $6.7 trillion. Over the same period, trading volumes in U.S. credit derivatives varied significantly; 12 week average trading volumes fluctuated between $500 and $800 billion in 2017 before falling to a three-year low of $320 billion in September 2018 (Chart 4.10.10).
The notional amount of global OTC interest rate derivatives rose to $481 trillion as of June 2018, an increase of $46 trillion from one year earlier (Chart 4.10.11). While the current level of OTC interest rate derivatives remains below 2014 levels, notional levels over time cannot be directly compared due to compression activity. Compression is a risk-management tool used by market participants to close OTC derivatives contracts with offsetting or nearly offsetting risk, in effect reducing the number of transactions and gross notional amount outstanding in market participants’ OTC derivatives portfolios. Compression activity has grown rapidly in recent years, supported by the growth of central clearing and CCP compression service offerings. The increased compression activity led to a $352 trillion reduction in interest rate derivatives notional amount outstanding in 2017 and the first half of 2018, and an $875 trillion reduction since 2013 (Chart 4.10.12). Adjusted for compression, however, the total notional amount of cleared OTC interest rate derivatives has increased by 14 percent since December 2016 (Chart 4.10.13).
0
1
2
3
4
5
6
7
8
9
0.0
0.2
0.4
0.6
0.8
1.0
Mar:14Sep:14Mar:15Sep:15Mar:16Sep:16Mar:17Sep:17Mar:18Sep:18
4.10.10 Derivatives Notional VolumeTrillions of US$ Trillions of US$
Source: CFTC
Interest Rate Derivatives(right axis)
As Of: 28-Sep-2018
Note: 12-week moving averages.
Credit Index(left axis)
4.10.10 Derivatives Notional Volume
Trillions of US$
0
100
200
300
400
500
600
700
0
100
200
300
400
500
600
700
2003 2005 2007 2009 2011 2013 2015 2017
4.10.11 Interest Rate Derivatives: Global Notional OutstandingTrillions of US$
Source: BIS, Haver Analytics
As Of: 2018 Q2
4.10.11 Interest Rate Derivatives: Global Notional Outstanding
Trillions of US$
0
50
100
150
200
250
0
50
100
150
200
250
2003 2005 2007 2009 2011 2013 2015 2017
CCPNon-CCP
4.10.12 Interest Rate Derivative Compression VolumeTrillions of US$
Source: TriOptima
As Of: Jun-2018
Note: Gross notional is represented as single-counted for notional compressed outside of a CCP and double-counted for notional compressed inside of a CCP.
4.10.12 Interest Rate Derivative Compression Volume

52 2 0 1 8 F S O C / / Annual Report
In contrast, the global amount of notional credit derivatives continues to decline, and as of June 2018, the notional amount of single name CDS fell a further 19 percent year-over-year, to $4.1 trillion (Chart 4.10.14). The notional amount of credit index derivatives ticked up slightly to $4.0 trillion as of June 2018, but remains well below the 2011 peak of $10.5 trillion.
Impact of Margin Rule for Non-Cleared SwapsIn September 2016, regulators began implementing margin requirements for uncleared swaps. These new requirements, which will be fully phased in by September 2020, were intended to promote central clearing and reduce counterparty risk by establishing initial and variation margin requirements for covered swap entities that enter into non-centrally cleared transactions. Regulators in other jurisdictions also began implementing their own respective rules, with Canada and Japan beginning implementation in the third quarter of 2016, and the EU, Singapore, Hong Kong, Switzerland, and Australia beginning implementation in the first quarter of 2017.
As part of the August 2018 FSB consultative document on incentives to centrally clear OTC derivatives, the FSB surveyed the largest 21 OTC derivative dealers on the relative costs of trading centrally cleared and uncleared derivatives. The results indicate that initial margin is generally lower for centrally cleared derivatives, suggesting that the implementation of initial margin requirements for uncleared derivatives incentivizes central clearing. The final version of the FSB report was published in November 2018. Additionally, anecdotal evidence from a recent International Swaps and Derivatives Association (ISDA) survey shows that the implementation of these rules has led to an increase in the amount of initial margin posted for uncleared derivative transactions.
0
10
20
30
40
50
0
400
800
1200
1600
2000
2400
Jul:15 Jan:16 Jul:16 Jan:17 Jul:17 Jan:18 Jul:18
4.10.15 Interest Rate Derivatives Inflation Swap ClearingBillions of US$ Billions of US$
Cleared Volume
(right axis)
Cleared Notional Outstanding
(left axis)
As Of: 28-Sep-2018
Uncleared Swap Margin Rule
Implementation Date
Source: ClarusFT CCPViewNote: 12-week moving averages for volume data.
4.10.15 Interest Rate Derivatives Inflation Swap Clearing
Trillions of US$4.10.13 Global Cleared OTC Interest Rate Derivatives
Trillions of US$
Source: ClarusFT CCPView, TriOptima, LCH.SwapClear
As Of: Jun-2018
Note: Maturity weighted cumulative compression volume is calculated as the sum of the current and previous year’s compression volume, estimating with two year average maturity for the compressed trades. 2018 data is year-to-date.
0
100
200
300
400
500
600
0
200
400
600
800
1000
2008 2010 2012 2014 2016 2018
Cleared NotionalMaturity Weighted Cum. Compression Volume
4.10.13 Global Cleared OTC Interest Rate Derivatives
Trillions of US$
0
10
20
30
40
0
10
20
30
40
Dec:04 Dec:06 Dec:08 Dec:10 Dec:12 Dec:14 Dec:16 Jun:18
4.10.14 Global Credit Derivatives by ProductTrillions of US$
Source: BIS
As Of: 2018 Q2
Note: Gross notional outstanding; prior to 2010, index CDS were reported as multi-name CDS.
Multi-NameIndex
Single Name
4.10.14 Global Credit Derivatives by Product

53Financ ia l Deve lopments
Additionally, the implementation of these rules has pushed certain swaps towards central clearing. Within one month of the September 2016 implementation date, the notional outstanding for globally cleared inflation swaps increased by approximately 28 percent, and the notional outstanding for cleared FX non-deliverable forwards increased by approximately 65 percent. Over the same period, the cleared volumes in both products had nearly tripled, and by August 2018, approximately 80 percent of U.S. inflation swaps were being cleared (Charts 4.10.15, 4.10.16). That said, the implementation of the uncleared margin rule has not led to increased clearing in all products, and more complex products such as swaptions continue to be transacted bilaterally.
4.10.4 Central Counterparty ClearingMeasured by gross notional outstanding overall, cleared OTC derivatives constituted approximately 76 and 53 percent of outstanding OTC interest rate and OTC credit derivatives globally, respectively, and less than 3 percent each for both OTC FX and OTC equity derivatives globally in June 2018 (Chart 4.10.17). Globally, approximately $367 trillion in notional of OTC interest rate derivatives and $4.5 trillion in notional of OTC credit derivatives were cleared by June 2018.
Both the volume of total compression activity and the share of compression activity occurring within CCPs continue to increase. In the United States, 81 percent of new interest rate derivative transaction volumes were centrally cleared as of the third quarter of 2018. Within the market for CDS on indices, 81 percent of weekly notional volumes were centrally cleared during the third quarter of 2018 (Chart 4.10.18). Clearing volumes remain concentrated with LCH.Clearnet Ltd. (LCH Ltd.) and CME Group Inc. (CME) for interest rate swaps and with ICE Clear Credit (ICC), ICE Clear Europe (ICEU), and LCH SA for CDS.
0
50
100
150
200
0
300
600
900
1200
Jul:15 Jan:16 Jul:16 Jan:17 Jul:17 Jan:18 Jul:18
4.10.16 FX Non-Deliverable-Forward ClearingBillions of US$ Billions of US$
Cleared Volume
(right axis)
Cleared Notional Outstanding
(left axis)
As Of: 28-Sep-2018
Uncleared Swap Margin Rule
Implementation Date
Source: ClarusFT CCPViewNote: 12-week moving averages for volume data.
4.10.16 FX Non-Deliverable-Forward Clearing
0
100
200
300
400
500
0.0
0.2
0.4
0.6
0.8
1.0
Interest Rate FX Credit Equity
Not Cleared (left axis)Cleared (left axis)
4.10.17 Global OTC Central Clearing Market ShareShare Trillions of US$
Source: BIS
As Of: 2018 Q2
Total Notional Outstanding (right axis)
4.10.17 Global OTC Central Clearing Market Share
Percent As Of: 2018 Q34.10.18 U.S. Central Clearing Market Share
Source: CFTC
0
20
40
60
80
100
0
20
40
60
80
100
Dec:13 Sep:14 Jun:15 Mar:16 Dec:16 Sep:17 Jun:18
Percent
Cleared Interest Rate Derivatives
Note: Percentage of new transaction dollar volume.
Cleared CDS Index Swaps
4.10.18 U.S. Central Clearing Market Share

54 2 0 1 8 F S O C / / Annual Report
Relevant authorities continue to work with CCPs and their members to assess and implement changes to operational and liquidity policies and procedures to mitigate concerns about funding liquidity among clearing members during periods of high market volatility.
In July 2017, the CFTC started posting a monthly cleared margin report. The report aggregates initial margin summary information for CME, ICC, ICE Clear U.S. (ICUS), ICEU, LCH Ltd., and LCH SA. As of October 31, 2018, total futures customer initial margin was $122 billion, with $70 billion at the top five firms; total swaps (interest rate and CDS) customer initial margin was $107 billion, with $67 billion at the top five firms.
4.10.5 Futures Commission MerchantsFutures Commission Merchants (FCMs) registered with the CFTC are the CCP members that provide customers the ability to clear futures, listed options on futures, and swaps transactions. The increased use of central clearing for certain derivative products has increased the importance of FCMs as market intermediaries serving as the conduit for customers to participate in the derivatives market and access clearing services.
Under the U.S. agency model of clearing, FCMs collect initial and variation margin from customers as part of their intermediary services, and deposit the required amounts with the CCP. Additionally, FCMs guarantee their clients’ financial performance to the CCP. This guarantee may expose the FCMs to a potential loss in a situation where a client defaults without having deposited a sufficient initial margin with the FCM guaranteeing its account. FCMs also may have contingent financial obligations under a CCP’s mutualized loss allocation mechanisms.
0
50
100
150
200
250
300
350
0
50
100
150
200
250
300
350
2002 2004 2006 2008 2010 2012 2014 2016 2018
4.10.19 Margin Funds Held at CFTC Registered FCMsBillions of US$ Billions of US$
Source: FIA
Part 30Swaps
Futures
As Of: Sep-2018
4.10.19 Margin Funds Held at CFTC Registered FCMs

55Financ ia l Deve lopments
With respect to more established cleared businesses, like clearing of futures and options on futures, the level of customer margin funds held by FCMs has remained fairly flat since the financial crisis (Chart 4.10.19). For the cleared swaps business, where customer clearing and associated data collection have been more recently introduced, the level of customer margin funds held by FCMs has increased from about $44 billion at year-end 2014 to $93 billion as of September 2018.
For futures and options on futures, the number of FCMs registered with the CFTC as holding customer funds has fallen from just over 100 in 2002 to 54 (of which 27 are bank-affiliated FCMs) as of June 2018 (Chart 4.10.20). For the cleared swaps business, the number of FCMs reporting holding segregated client funds decreased from 23 at year-end 2014 to 17 (of which 15 are bank-affiliated FCMs) as of June 30, 2018. While the number of registered FCMs has fallen considerably, the concentration of the clearing business has remained fairly stable over time. Between 2002 and 2017, the top five clearing members at futures exchanges held 40 to 60 percent of client margin, and since 2014, the top five swap clearing members have held between 70 and 80 percent of client margin (Chart 4.10.21 and Chart 4.10.22).
A portion of the decline in the number of FCMs reflects a long-term trend of business consolidation due to technology and other market structure related changes. In addition, some bank-affiliated FCMs have stated that Basel-based bank capital requirements, including the supplementary leverage ratio (SLR), have impacted their decisions regarding providing client clearing services (see Section 5.2.1). As the structure of OTC derivatives’ markets and clearing continues to evolve, regulators continue to monitor FCM industry trends and the possible implications for financial stability, particularly in stressed market conditions.
Count As Of: Sep-20184.10.20 CFTC Registered FCMs Holding Client Funds
Source: FIA
0
25
50
75
100
125
150
0
25
50
75
100
125
150
2002 2004 2006 2008 2010 2012 2014 2016 2018
Count
SwapsPart 30Futures
4.10.20 CFTC Registered FCMs Holding Client Funds
4.10.22 FCM Concentration: Customer Swap Balances
Source: CFTC financial data for FCMs
0
25
50
75
100
0
25
50
75
100
2014Q1 2014Q4 2015Q3 2016Q2 2017Q1 2017Q4
Percent PercentAs Of: 2018 Q2
Top 10 Top 5 Top 3
Note: Represents the amount of funds an FCM is required to segregate for customers who trade cleared swaps.
4.10.21 FCM Concentration: Customer 4d(a)(2) Balances
Source: CFTC financial data for FCMs
0
25
50
75
100
0
25
50
75
100
2002 2004 2006 2008 2010 2012 2014 2016
Percent PercentAs Of: 2017
Top 10 Top 5 Top 3
Note: Represents total amount of funds that an FCM is required to segregate on behalf of customers who are trading futures and options on futures at US exchanges.
4.10.22 FCM Concentration: Customer Swap Balances
4.10.21 FCM Concentration: Customer 4d(a)(2) Balances

56 2 0 1 8 F S O C / / Annual Report
4.10.6 Regulated Platform TradingSince 2014, the CFTC has granted full registration to 25 SEFs. Further, certain interest rate swaps and CDS indices have been “made available to trade,” and therefore required to be executed on a SEF or designated contract market (DCM). Combined with mandatory central clearing, these regulated trading platforms have increased pre-trade price transparency, reduced operational risk due to electronic execution, and improved end-to-end processing.
Trading volumes on SEFs continued to increase in 2017 and 2018, with average daily notional volume for interest rate swaps and CDS indices up 25 percent and 38 percent, respectively, during the first nine months of 2018 as compared to the same period in 2017 (Chart 4.10.23). The share of interest rate swap trading that occurred on SEFs versus off SEFs increased from 50 percent to 52 percent during that time period, while the share of CDS index trading that occurred on SEFs versus off SEFs increased from 74 percent to 77 percent (Chart 4.10.24).
Although SEF trading has increased over time, on November 5, 2018, the CFTC proposed amendments to its rules that are intended to strengthen the existing swaps trading framework by promoting more SEF trading and pre-trade price transparency. For example, no new “made available to trade” determinations have been implemented since 2014, and SEFs are limited in the execution methods they may offer for these swaps (order book and request for quote system). The CFTC’s proposal addresses these and other issues (see Section 5.2.1).
Percent As Of: 28-Sep-20184.10.24 U.S. On-SEF Trading Share
Source: CFTC
0
20
40
60
80
100
0
20
40
60
80
100
Jan:14Jul:14 Jan:15Jul:15 Jan:16Jul:16 Jan:17Jul:17 Jan:18Jul:18
Percent
CDS IndicesInterest Rate Derivatives
Note: Share of notional volume. 20-day moving averages.
4.10.24 U.S. On-SEF Trading Share
Billions of US$ As Of: 28-Sep-20184.10.23 U.S. On-SEF Trading Volume
Source: CFTC
0
200
400
600
800
0
20
40
60
80
Jan:14 Jul:14 Jan:15 Jul:15 Jan:16 Jul:16 Jan:17 Jul:17 Jan:18 Jul:18
Billions of US$
CDS IndicesInterest Rate Derivatives
Note: Share of notional volume. 20-day moving averages.
4.10.23 U.S. On-SEF Trading Volume

57Financ ia l Deve lopments
4.11 Bank Holding Companies and Depository Institutions
4.11.1 Bank Holding Companies and Dodd-Frank Act Stress Tests
BHCs—inclusive of financial holding companies—are companies with at least one commercial bank subsidiary. Subsidiaries of BHCs may also include nonbanks such as broker-dealers, investment advisers, or insurance companies. The CCAR) BHCs are BHCs with $100 billion or more in total consolidated assets and U.S. intermediate holding companies (IHCs) of foreign banking organizations (FBOs). Among them, there are eight domestic global systemically important banks (G-SIBs): JP Morgan Chase, Citigroup, Morgan Stanley, Bank of America, Goldman Sachs, Wells Fargo, Bank of New York Mellon, and State Street. As of the second quarter of 2018, BHCs in the United States held about $19 trillion in assets. G-SIBs account for 59 percent of this total. CCAR BHCs other than G-SIBs account for 24 percent. Other BHCs account for the remaining 17 percent (Chart 4.11.1).
Capital Adequacy Capital levels at BHCs have risen significantly since the 2008 financial crisis. At CCAR BHCs, the ratio of common equity tier 1 (CET1) capital to risk-weighted assets (RWAs) has more than doubled since the crisis. For smaller BHCs, capital ratios increased by about 50 percent over the same period as smaller BHCs’ capital ratios did not fall as much during the financial crisis (Chart 4.11.2). High levels of equity capital provide a buffer to absorb losses that may result from operational and legal risks, or from losses on loans, securities, or trading portfolios. Although the requirements under Basel III continue to phase-in over the next few years, most of the largest G-SIBs headquartered in the United States already meet the new standards for the minimum risk-weighted capital ratios, the SLRs, capital conservation buffers, and surcharges related to their systemic importance.
0
2
4
6
8
10
12
0
2
4
6
8
10
12
G-SIBs Non-G-SIB CCAR Other
4.11.1 Total Assets by BHC TypeTrillions of US$ Trillions of US$
Source: FR Y-9C
As Of: 2018 Q2
4.11.1 Total Assets by BHC Type
4
6
8
10
12
14
4
6
8
10
12
14
2001 2003 2005 2007 2009 2011 2013 2015 2017
4.11.2 Common Equity Tier 1 RatiosPercent PercentAs Of: 2018 Q2
Source: FR Y-9C
G-SIBsNon-G-SIB CCAROther
Note: Prior to 2014:Q1, the numerator of the common equity tier 1 ratio is tier 1 common capital. Beginning in 2014:Q1 for advanced approaches BHCs and in 2015:Q1 for all other BHCs, the numerator is common equity tier 1 capital.
4.11.2 Common Equity Tier 1 Ratios
0
10
20
30
40
50
60
0
10
20
30
40
50
60
2001 2003 2005 2007 2009 2011 2013 2015 2017
4.11.3 Selected Sources of Funding at CCAR BHCsPercent of Total Assets Percent of Total AssetsAs Of: 2018 Q2
Long-Term FundingDeposits Excluding Foreign Deposits and Large Time Deposits
Source: FR Y-9C
Note: Long-term funding includes other borrowed money, subordinated notes, and large time deposits with maturities >1 year. Short-term funding includes such liabilities with maturities <1 year plus trading liabilities, repos, CP, and foreign deposits.
Short-Term Funding
4.11.3 Selected Sources of Funding at CCAR BHCs

58 2 0 1 8 F S O C / / Annual Report
FBOs with sizeable operations in the United States consolidate all non-branch assets under a single BHC called an IHC. The 12 IHCs operating in the U.S. have an average CET1 capital ratio of 16.1 percent, with a range from 11.8 percent to 22.4 percent, as of the second quarter of 2018.
Funding SourcesDuring the 2008 financial crisis, BHCs experienced disruptions in their access to short-term wholesale funding. Since then the ratio of such funding to total assets has declined significantly and now stands at about half of its 2007 levels. At the same time, BHCs experienced large inflows of core deposits. BHCs also maintained a steady share of long-term debt in recent years, at about ten percent of total assets (Chart 4.11.3).
Rates on interest-bearing deposits slowly increased following the three Federal Reserve rate hikes in 2017 and three more in 2018 through October. The Federal Reserve has increased its interest rate target by 200 basis points since 2015, but the cumulative increase in deposit rates has been less than 40 basis points during that time. Deposit rates increased more at smaller BHCs than at G-SIBs (Chart 4.11.4).
The LIBOR-OIS spread, an indicator of the cost of unsecured short-term wholesale funding, rose markedly in the fourth quarter of 2017 and the first quarter of 2018, then declined to more normal levels (Chart 4.11.5). The temporary increase observed in the first quarter was attributed to a greater supply of Treasury bills and, to some extent, the repatriation of offshore earnings following the enacted tax reform.
-0.05
0.05
0.15
0.25
0.35
0.45
-0.05
0.05
0.15
0.25
0.35
0.45
Nov:15 May:16 Nov:16 May:17 Nov:17 May:18
4.11.4 Cumulative Changes in Deposit RatesPercent PercentAs Of: 26-Oct-2018
Source: SNL Financial Note: Based on average quoted rates for Jumbo CD - $100K; up to 1 year maturity.
G-SIBsNon-G-SIB CCAROther
0
10
20
30
40
50
60
70
0
10
20
30
40
50
60
70
2013 2014 2015 2016 2017 2018
4.11.5 LIBOR-OIS SpreadBasis Points Basis PointsAs Of: 31-Oct-2018
Source: Bloomberg, L.P.Note: SEC money market fund reform came into effect on October 14, 2016
4.11.4 Cumulative Changes in Deposit Rates
4.11.5 LIBOR-OIS Spread
0
2
4
6
8
10
12
14
16
0.0
0.5
1.0
1.5
2.0
2010 2011 2012 2013 2014 2015 2016 2017 2018
4.11.6 Return on Equity and Return on AssetsPercent PercentAs Of: 2018 Q2
ROE (right axis)ROA (left axis)
Source: FR Y-9C
Note: Dashed lines represent 2003 – 2007 averages. Return on equity is equal to net income divided by average equity. Return on assets is equal to net income divided by average assets.
4.11.6 Return on Equity and Return on Assets

59Financ ia l Deve lopments
ProfitabilityBHC profitability fell temporarily in the fourth quarter of 2017 due to one-time charges associated with the tax legislation, but then reached post-crisis highs in the second quarter of 2018, partly boosted by lower taxes. Return on assets (ROA) attained its pre-crisis average of 1.1 percent, and return on equity (ROE) was around 10.4 percent (Chart 4.11.6).
Net interest margins (NIMs) remained near historical lows for G-SIBs, while improving toward pre-crisis levels for non-G-SIB CCAR and other BHCs (Chart 4.11.7). Although interest income has been rising, those gains were almost entirely offset by increasing interest expenses. Over the past few years, G-SIBs have offset smaller NIMs by reducing noninterest expenses at a greater rate than other BHCs.
Asset QualityOverall loan delinquency rates have continued to decline modestly for G-SIBs and other BHCs, while leveling off for CCAR BHCs that are not G-SIBs (Chart 4.11.8). In addition, loan loss reserves appeared sufficient based on standard measures of reserve adequacy. The ratios of loan reserves to delinquent loans and net charge-offs are near their pre-crisis values (Chart 4.11.9).
2.0
2.5
3.0
3.5
4.0
2.0
2.5
3.0
3.5
4.0
2010 2012 2014 2016 2018
4.11.7 Net Interest MarginsPercent PercentAs Of: 2018 Q2
Source: FR Y-9C
G-SIBsNon-G-SIB CCAROther
Note: Net interest margin is equal to net interest income divided by the quarterly average of interest-earning assets.
0
2
4
6
8
10
0
2
4
6
8
10
2001 2003 2005 2007 2009 2011 2013 2015 2017
4.11.8 Delinquency RatesPercent PercentAs Of: 2018 Q2
Source: FR Y-9C
Note: Includes all loans in foreign and domestic offices. Delinquent loans are loans 30 days or more past due or in nonaccrual status.
G-SIBsNon-G-SIB CCAROther
4.11.7 Net Interest Margins
4.11.8 Delinquency Rates
0
200
400
600
800
1,000
0
20
40
60
80
100
2001 2003 2005 2007 2009 2011 2013 2015 2017
4.11.9 Loan-Loss ReservesPercent PercentAs Of: 2018 Q2
Reserves / Net-Charge-Offs (right axis)Reserves / Delinquent Loans (left axis)
Source: FR Y-9C
4.11.9 Loan-Loss Reserves

60 2 0 1 8 F S O C / / Annual Report
Delinquencies on consumer loans continued their upward trend. In particular, delinquencies for credit card and auto loans have increased since mid-2016 (Charts 4.11.10, 4.11.11). Delinquencies at G-SIB subsidiary banks are at lower levels and have risen less than delinquencies at other banks. Delinquency rates on auto loans held by non-G-SIB CCAR banks have continued their ascent since the third quarter of 2016.
0.0
0.5
1.0
1.5
2.0
2.5
3.0
3.5
0.0
0.5
1.0
1.5
2.0
2.5
3.0
3.5
2011 2012 2013 2014 2015 2016 2017 2018
4.11.11 Auto Loan Delinquency RatesPercent PercentAs Of: 2018 Q2
Source: Call Report
Note: Delinquencies are determined using nonaccrual loans and loans that are past due 30 days or more.
G-SIBsNon-G-SIB CCAROther
0
2
4
6
8
10
0
2
4
6
8
10
2001 2003 2005 2007 2009 2011 2013 2015 2017
4.11.10 Credit Card Delinquency RatesPercent PercentAs Of: 2018 Q2
Source: Call Report
Note: Delinquencies are determined using nonaccrual loans and loans that are past due 30 days or more.
G-SIBsNon-G-SIB CCAROther
4.11.11 Auto Loan Delinquency Rates
4.11.10 Credit Card Delinquency Rates
0
1
2
3
4
5
6
0
1
2
3
4
5
6
2010 2011 2012 2013 2014 2015 2016 2017 2018
4.11.12 Loans to Nondepository Financial Institutions Percent of Total Loans Percent of Total LoansAs Of: 2018 Q2
Non-CCARCCAR
Source: FR Y-9C
4.11.12 Loans to Nondepository Financial Institutions

61Financ ia l Deve lopments
Since 2010, the CCAR BHCs have increased their lending to nondepository financial institutions, while this type of lending has been more muted at other institutions over the past few years (Chart 4.11.12).
Liquidity ManagementAll G-SIBs have LCRs above the 100 percent requirement (Chart 4.11.13). Holdings of HQLA at BHCs subject to the LCR requirement have remained relatively flat since the rule went into effect on January 1, 2015 (Chart 4.11.14). While the accumulation of HQLA leveled off in the past three years, the composition of HQLA shifted from reserve balances into higher yielding agency MBS (Chart 4.11.15). All net acquisitions of agency MBS by advanced approaches banking organizations since 2012 have been booked in the held-to-maturity (HTM) portfolio, and most HTM securities acquired since 2012 could qualify as HQLA (Chart 4.11.16). More generally, advanced approaches banking organizations have increased their proportion of investment securities categorized as HTM over the past several years; this allows them to avoid lower investment securities valuations in regulatory capital calculations (Chart 4.11.17).
4
8
12
16
20
24
4
8
12
16
20
24
2010 2011 2012 2013 2014 2015 2016 2017 2018
4.11.14 High-Quality Liquid Assets by BHC TypePercent of Assets Percent of Assets
Source: FR Y-9C, FR 2900
As Of: 2018 Q2
Standard LCR BHCs
Note: HQLA is estimated by adding excess reserves to an estimate of securities that qualify for HQLA. Securities are estimated from the FR Y-9C. Haircuts and level 2 asset limitations are incorporated into the estimate.
Modified LCR BHCsOther
0
50
100
150
200
0
50
100
150
200
JPM C MS BAC GS WFC BK STT
4.11.13 Liquidity Coverage RatioPercent PercentAs Of: 2018 Q2
Source: LCR Disclosures from banks’ websites
Note: The solid line represents the regulatory minimum.
2017 Q42017 Q3
2018 Q12018 Q2
4.11.14 High-Quality Liquid Assets by BHC Type
4.11.13 Liquidity Coverage Ratio
0
2
4
6
8
10
0
2
4
6
8
10
2010 2011 2012 2013 2014 2015 2016 2017 2018
4.11.15 Selected Liquid Assets at All BHCs Percent of Assets Percent of Assets
Source: FR Y-9C, FR 2900
As Of: 2018 Q2
Ginnie Mae MBS
Treasury Securities Fannie Mae and Freddie Mac MBS
Reserve Balances
4.11.15 Selected Liquid Assets at All BHCs

62 2 0 1 8 F S O C / / Annual Report
Duration gap—a measure of maturity mismatch at banks estimated by the approximate duration of assets less that of liabilities—remained relatively stable for G-SIBs and non-G-SIBs alike over the past two years (Chart 4.11.18).
Market Perception of Value and RiskStock prices for U.S. G-SIBs appreciated significantly in 2017 (20 percent), but reversed most of those gains in 2018 through October (-13 percent). On the one hand, markets expected higher bank earnings and higher capital distributions, including the effects of the recently enacted tax reform and the reforms of supervisory and regulatory requirements by federal bank regulatory agencies. On the other hand, uncertainty arose due to trade concerns and other factors. Political uncertainties, among other factors, contributed to a marked decline in stock prices of European banks in 2018 (Chart 4.11.19).
-600
-400
-200
0
200
400
600
-600
-400
-200
0
200
400
600
Available-for-Sale Held-to-Maturity
Billions of US$ Billions of US$
Source: FR Y-9C
As Of: 2018 Q2
U.S. Treasuries & AgenciesAgency MBSOther MBS & ABS
Municipals
Other
Note: At advanced approaches banking organizations. Advanced approaches framework generally applies to banks with at least $250 billion in total consolidated assets or at least $10 billion in total on-balance sheet foreign exposure. Cumulative change from 2012 Q4 – 2018 Q2.
4.11.16 Cumulative Change in Securities4.11.16 Cumulative Change in Securities
0
5
10
15
20
25
30
35
40
0
5
10
15
20
25
30
35
40
2001 2003 2005 2007 2009 2011 2013 2015 2017
4.11.17 Held-to-Maturity Securities Percent of Investment Securities
Percent of Investment SecuritiesAs Of: 2018 Q2
Non-advanced approaches banking organizationsAdvanced approaches banking organizations
Source: FR Y-9CNote: Investment securities are held-to-maturity securities plus available-for-sale securities
4.11.17 Held-to-Maturity Securities
4.11.18 Duration Gap
Source: Call Report
0.0
0.5
1.0
1.5
2.0
2.5
3.0
0.0
0.5
1.0
1.5
2.0
2.5
3.0
2001 2003 2005 2007 2009 2011 2013 2015 2017
Years Years
G-SIBs Weighted Average
As Of: 2018 Q2
All Bank Median
Note: Duration gap is the approximate weighted-average time of cash inflows less the approximate weighted-average time of cash outflows.
4.11.18 Duration Gap

63Financ ia l Deve lopments
Price-to-book ratios for six of the U.S. G-SIBs trended higher in 2017 and slightly decreased in 2018 (Chart 4.11.20). Wells Fargo experienced a 23 percent drop from its peak during the first quarter of 2018, following legal and supervisory actions related to its sales practices and other legal and supervisory issues. Through October 2018, most of the largest banks had price-to-book ratios above 100 percent, though these ratios remained compressed relative to pre-crisis levels.
Index As Of: 31-Oct-20184.11.19 Stock Prices
Source: Bloomberg, L.P.
50
100
150
200
250
300
350
50
100
150
200
250
300
350
2012 2013 2014 2015 2016 2017 2018
Index
S&P 500EU Bank Stock IndexU.S. Other BHCsU.S. G-SIB BHCs
Note: January 3, 2012 = 100. EU Bank Stock Index created from stock price information for the following banks: BCS, BNP, CS, ACA, DB, SAN, UBS. All indexes are created by equally weighting banks.
4.11.19 Stock Prices
Ratio As Of: 31-Oct-20184.11.20 Price-to-Book
Source: Bloomberg, L.P.
0.0
0.5
1.0
1.5
2.0
2.5
3.0
3.5
0.0
0.5
1.0
1.5
2.0
2.5
3.0
3.5
2008 2010 2012 2014 2016 2018
Ratio
Wells Fargo Morgan StanleyJPMorgan ChaseGoldman SachsCitigroupBank of America
4.11.20 Price-to-Book

64 2 0 1 8 F S O C / / Annual Report
CDS spreads, which measure the cost of insuring against credit default risk, stayed at very low levels in 2017 for six of the U.S. G-SIBs and select foreign banks. Such premiums moved up slightly in 2018 in response to episodes of equity market volatility but remained low by historical standards (Charts 4.11.21, 4.11.22).
Dodd-Frank Act Stress Tests and Comprehensive Capital Analysis and Review In June 2017 and June 2018, the Federal Reserve released the results of that year’s annual Dodd-Frank Act stress testing (DFAST) and CCAR. In 2017 34 BHCs with total consolidated assets of $50 billion or more participated in the annual stress tests and capital planning review; in 2018, 35 BHCs participated. EGRRCPA exempts firms below $100 billion in total assets from enhanced prudential standards, including supervisory stress test requirements. Any BHC with total consolidated assets of $250 billion or more is subject to periodic company-run stress-testing requirements. The Act further provides the Federal Reserve with discretion to require a BHC with between $100 and $250 billion in total consolidated assets to conduct periodic company-run stress tests.
DFAST, a forward-looking exercise conducted by the Federal Reserve, evaluates whether the participating BHCs have sufficient capital to absorb losses over a nine-quarter period resulting from stressful economic and financial market conditions in hypothetical supervisory scenarios designed by the Federal Reserve in consultation with the FDIC and the OCC. These scenarios are also used for company-run stress tests by national banks, state nonmember banks, and federal savings associations with total consolidated assets of $100 billion or more
Basis Points As Of: 31-Oct-20184.11.21 U.S. Banks 5-Year CDS Spreads
Source: Bloomberg, L.P.
0
100
200
300
400
500
600
0
100
200
300
400
500
600
2010 2011 2012 2013 2014 2015 2016 2017 2018
Basis Points
Wells Fargo Morgan StanleyJPMorgan ChaseGoldman SachsCitigroupBank of America
4.11.21 U.S. Banks 5-Year CDS Spreads
Basis Points As Of: 31-Oct-20184.11.22 Foreign Banks 5-Year CDS Spreads
Source: Bloomberg, L.P.
0
100
200
300
400
500
600
0
100
200
300
400
500
600
2010 2011 2012 2013 2014 2015 2016 2017 2018
Basis Points
UBSSantanderDeutsche BankCredit SuisseCredit AgricoleBNP ParibasBarclays
4.11.22 Foreign Banks 5-Year CDS Spreads

65Financ ia l Deve lopments
for 2018. As part of DFAST, the banks must report their company-run stress test results to the Federal Reserve, their primary regulator, and the public. The severely adverse scenario used in DFAST 2017 reflected conditions of a severe downturn in the U.S. economy with a larger decline in CRE prices and a more severe recession in the euro area and UK. Compared to DFAST 2017, the severely adverse scenario in DFAST 2018 featured more severe macroeconomic conditions and a deeper correction in asset prices. Moreover, the one-time impact of the tax reform reduced the starting capital ratios for a large number of firms in 2018. Over the nine-quarter horizon of the severely adverse scenario in DFAST 2017, the aggregate projected CET1 ratio for the 34 BHCs fell from 12.5 percent to a minimum level of 9.2 percent. In DFAST 2018, the aggregate projected CET1 ratio for the 35 BHCs fell from 12.3 percent to a minimum level of 7.9 percent, which was still well above the minimum requirement of 4.5 percent (Charts 4.11.23).
Through CCAR, the Federal Reserve evaluates the capital adequacy and the capital planning processes of the BHCs, including the quality of the BHCs’ risk-management frameworks and the proposed capital actions such as dividend payments and stock repurchases. The Federal Reserve considers both qualitative and quantitative factors in analyzing a firm’s capital plan. In 2017, the Federal Reserve issued a conditional non-objection to one BHC, requiring it to address weaknesses in its capital planning process (Chart 4.11.24). In 2018, the Federal Reserve issued a conditional non-objection to three BHCs. The capital ratios of Goldman Sachs and Morgan Stanley, under the capital plans they originally submitted and with the one-time capital reduction from the tax law changes, fell below required levels. The conditional non-objections require them to limit their capital distributions to the levels of prior years, allowing them to build capital over the next year. State Street is required to remediate, within six months, certain weaknesses in its management and analysis of counterparty exposures under stress. The
0
2
4
6
8
10
12
14
0
2
4
6
8
10
12
14Pre-StressPost-Stress Minimum
4.11.23 Initial and Stressed Capital RatiosPercent Percent
Source: Federal Reserve
As Of: Jun-2018
Note: DFAST 2013-2015 bars depict Tier 1 Common Capital Ratio. DFAST 2016-2018 bars depict Common Equity Tier 1 Ratio.
DFAST 2013
2014 2015 2016 2017 2018
4.11.23 Initial and Stressed Capital Ratios
4.11.24 Federal Reserve's Actions in CCAR 2017
Source: Federal Reserve
Non-Objection to Capital PlanAlly Financial Comerica MUFG AmericasAmerican Express Deutsche Bank Northern TrustBancWest Discover Financial PNC FinancialBank of America Fifth Third Bancorp Regions FinancialBank of New York Mellon Goldman Sachs Santander Holdings USABB&T HSBC North America State StreetBBVA Compass Huntington Bancshares SunTrustBMO Financial JPMorgan Chase TD Group U.S.CIT Group KeyCorp U.S. BancorpCitigroup M&T Bank Wells FargoCitizens Financial Morgan Stanley Zions
Conditional Non-Objection to Capital PlanCapital One Financial
4.11.24 Federal Reserve’s Actions in CCAR 2017
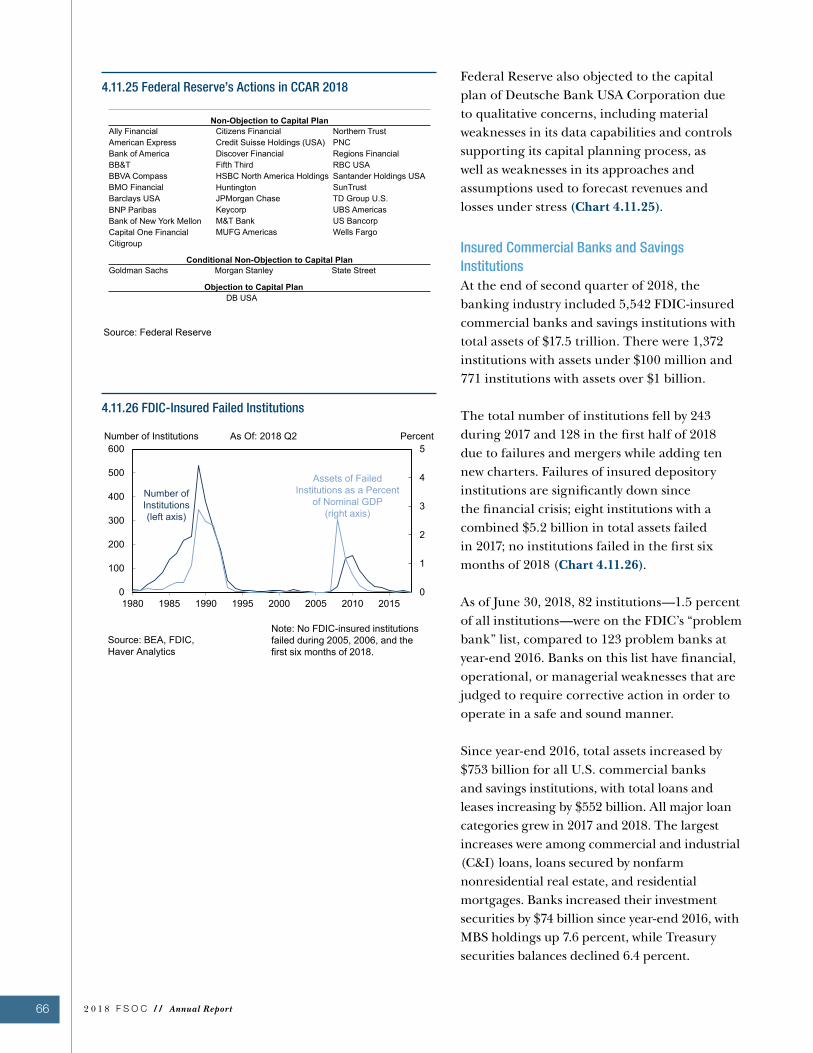
66 2 0 1 8 F S O C / / Annual Report
Federal Reserve also objected to the capital plan of Deutsche Bank USA Corporation due to qualitative concerns, including material weaknesses in its data capabilities and controls supporting its capital planning process, as well as weaknesses in its approaches and assumptions used to forecast revenues and losses under stress (Chart 4.11.25).
Insured Commercial Banks and Savings InstitutionsAt the end of second quarter of 2018, the banking industry included 5,542 FDIC-insured commercial banks and savings institutions with total assets of $17.5 trillion. There were 1,372 institutions with assets under $100 million and 771 institutions with assets over $1 billion.
The total number of institutions fell by 243 during 2017 and 128 in the first half of 2018 due to failures and mergers while adding ten new charters. Failures of insured depository institutions are significantly down since the financial crisis; eight institutions with a combined $5.2 billion in total assets failed in 2017; no institutions failed in the first six months of 2018 (Chart 4.11.26).
As of June 30, 2018, 82 institutions—1.5 percent of all institutions—were on the FDIC’s “problem bank” list, compared to 123 problem banks at year-end 2016. Banks on this list have financial, operational, or managerial weaknesses that are judged to require corrective action in order to operate in a safe and sound manner.
Since year-end 2016, total assets increased by $753 billion for all U.S. commercial banks and savings institutions, with total loans and leases increasing by $552 billion. All major loan categories grew in 2017 and 2018. The largest increases were among commercial and industrial (C&I) loans, loans secured by nonfarm nonresidential real estate, and residential mortgages. Banks increased their investment securities by $74 billion since year-end 2016, with MBS holdings up 7.6 percent, while Treasury securities balances declined 6.4 percent.
4.11.25 Federal Reserve's Actions in CCAR 2018
Source: Federal Reserve
Non-Objection to Capital PlanAlly Financial Citizens Financial Northern TrustAmerican Express Credit Suisse Holdings (USA) PNC Bank of America Discover Financial Regions FinancialBB&T Fifth Third RBC USABBVA Compass HSBC North America Holdings Santander Holdings USABMO Financial Huntington SunTrustBarclays USA JPMorgan Chase TD Group U.S.BNP Paribas Keycorp UBS AmericasBank of New York Mellon M&T Bank US BancorpCapital One Financial MUFG Americas Wells FargoCitigroup
Conditional Non-Objection to Capital PlanGoldman Sachs Morgan Stanley State Street
Objection to Capital PlanDB USA
4.11.25 Federal Reserve’s Actions in CCAR 2018
0
1
2
3
4
5
0
100
200
300
400
500
600
1980 1985 1990 1995 2000 2005 2010 2015
Source: BEA, FDIC, Haver Analytics
As Of: 2018 Q2Number of Institutions4.11.26 FDIC-Insured Failed Institutions
Note: No FDIC-insured institutions failed during 2005, 2006, and the first six months of 2018.
Percent
Number of Institutions (left axis)
Assets of Failed Institutions as a Percent
of Nominal GDP (right axis)
4.11.26 FDIC-Insured Failed Institutions

67Financ ia l Deve lopments
Annualized pre-tax income for all U.S. commercial banks and savings institutions totaled $296 billion for the first six months of 2018, driven by a rise in net interest income and noninterest income (Chart 4.11.27). Net interest income rose by 8.6 percent for the first six months of 2018 over the first six months of 2017 due to expanding net interest margins and 2.9 percent growth in interest-earning assets. Almost three-quarters of commercial banks and savings institutions reported higher earnings in the second quarter of 2018. A lower effective tax rate also contributed to the increase in industry net income. Credit quality continues to improve as the noncurrent ratio declined to 1.06 percent of total loans. Loan loss provisions increased 0.3 percent from first half of 2017, primarily as risks within credit card portfolios increased modestly.
4.11.2 U.S. Branches and Agencies of Foreign Banks
U.S. branches and agencies of FBOs generally function as wholesale operations of the parent bank and therefore their balance sheet structure and funding patterns differ from most U.S. domestic banking organizations.
As of June 30, 2018, assets of U.S. branches and agencies of foreign banks totaled $2.5 trillion, roughly 15 percent of total U.S. banking assets (Chart 4.11.28). Aggregated assets of U.S. branches and agencies of foreign banks increased 3.5 percent since June 30, 2017. Reserve balances for U.S. branches and agencies of foreign banks total 29 percent of total assets as of June 30, 2018, and increased 3.4 percent from the previous year. After the onset of the financial crisis, balances held at the Federal Reserve significantly increased, as foreign banks availed themselves of interest paid on Federal Reserve balances via their U.S. branch and agency operations.
-1000
-750
-500
-250
0
250
500
750
1000
-1000
-750
-500
-250
0
250
500
750
1000
2010 2012 2014 2016 2018
Noninterest IncomeNet Interest Income
Noninterest ExpenseProvisions
4.11.27 Commercial Bank and Thrift Pre-Tax IncomeBillions of US$ Billions of US$
Source: FDICNote: Includes all FDIC-insured commercial banks and thrifts. Values are annualized.
As Of: 2018 Q2
Total Pre-Tax Income
Realized Gains/Losses on Investments
4.11.27 Commercial Bank and Thrift Pre-Tax Income
0.0
0.5
1.0
1.5
2.0
2.5
3.0
3.5
4.0
0.0
0.5
1.0
1.5
2.0
2.5
3.0
3.5
4.0
2004 2006 2008 2010 2012 2014 2016 2018
4.11.28 U.S. Branches and Agencies of Foreign Banks: AssetsTrillions of US$ Trillions of US$
Source: Federal Reserve, Haver Analytics
As Of: 2018 Q2
Reserve BalancesNet Due from Related Institutions
Securities Purchased with Repos & Fed Funds Sold
Cash and Balances Due from Depository Institutions (Excluding Reserve Balances)
Other AssetsNon-C&I LoansC&I Loans
Note: Other assets includes government securities, asset-backed securities, and other trading assets.
4.11.28 U.S. Branches and Agencies of Foreign Banks: Assets

68 2 0 1 8 F S O C / / Annual Report
Securities purchased under agreement to resell at U.S. branches and agencies of foreign banks increased 37 percent from June 30, 2017 to June 30, 2018. Securities purchased under agreement to resell represented 12 percent of U.S. branches and agencies of foreign banks total assets as of June 30, 2018, when compared to 8.7 percent of total assets as of June 30, 2017. The recent growth is primarily related to a shift of securities purchased under agreement to resell to the U.S. branches and agencies of foreign banks from related IHCs and BHCs to improve regulatory capital ratios at those entities.
U.S. branches and agencies of foreign banks loan balances totaled approximately 30 percent of total assets at June 30, 2018 overall. Loan growth has slowed in recent years, with loan balances increasing only 0.9 percent year-over-year. C&I lending, which has historically been a significant portion of overall lending by U.S. branches and agencies of foreign banks has slowed, with C&I loan levels largely unchanged between June 30, 2017 and June 30, 2018. Within C&I lending, operations of the larger and complex U.S. branches and agencies of foreign banks led to the decline in growth rates. C&I lending was also impacted by increasing competition from nonbank credit providers and shifts from C&I lending to CRE.
Since most U.S. branches and agencies of foreign banks are generally not permitted to take retail deposits, corporate and certificates of deposits are the primary source of funding totaling 43 percent of total liabilities as of June 30, 2018 (Chart 4.11.29). In recent years, U.S. foreign branches and agencies have shifted from historically higher levels of bank-to-bank lending via federal funds purchased to securities sold under agreement to repurchase. U.S. branches and agencies of foreign banks also repositioned funding from money market to secured financing, utilizing short-term government and agency securities and other short-term funding sources after the implementation of MMF reforms in 2016. Federal funds purchased totaled 1.3 percent of total liabilities for U.S. branches and agencies of
0.0
0.5
1.0
1.5
2.0
2.5
3.0
3.5
4.0
0.0
0.5
1.0
1.5
2.0
2.5
3.0
3.5
4.0
2004 2006 2008 2010 2012 2014 2016 2018
4.11.29 U.S. Branches and Agencies of Foreign Banks: LiabilitiesTrillions of US$ Trillions of US$
Source: Federal Reserve, Haver Analytics
As Of: 2018 Q2
Deposits & Credit BalancesSecurities Sold with Repos & Fed Funds PurchasedOther Liabilities
Net Due to Related Depository Institutions
Note: Other liabilities includes transaction accounts, non-transaction accounts, and other borrowed money.
4.11.29 U.S. Branches and Agencies of Foreign Banks: Liabilities

69Financ ia l Deve lopments
foreign banks as of June 30, 2018, and declined 32 percent year-over year. Securities sold under agreement to repurchase for U.S. foreign branches was 19 percent of total liabilities as of June 30, 2018, and increased 0.6 percent year-over-year. U.S. branches and agencies of foreign banks also increased their securities purchased and sold activities in recent years as a result of organization changes, where foreign parents transferred activities from the broker-dealer to their U.S. branches and agencies to avoid certain regulatory requirements.
4.11.3 Credit UnionsCredit unions are member-owned, not-for-profit, depository institutions. As of the second quarter of 2018, there were 5,480 federally insured credit unions with aggregate assets of more than $1.4 trillion. Almost three-quarters of credit unions (3,904) had assets under $100 million, with nearly 30 percent having less than $10 million in assets. There were 1,274 credit unions with assets between $100 million and $1 billion, and 302 credit unions with assets over $1 billion.
Consolidation continued during the first half of 2018, particularly at smaller institutions. The number of credit unions with less than $50 million in assets fell to 3,195 in the second quarter of 2018, bringing the cumulative decline over the past five years to 28 percent. At the same time, however, industry assets grew 6 percent on an annualized basis over the five years ending in the second quarter of 2018. Membership in federally insured credit unions grew 20 percent over the past five years, exceeding 115 million members as of the second quarter of 2018.
Financial performance at credit unions generally improved during the first half of 2018, at least partly reflecting the strength of the economy and solid growth in loan demand. Net income at consumer credit unions increased to nearly $13 billion on an annualized basis as of the second quarter of 2018, an increase of 25 percent from the second quarter of 2017 (Chart 4.11.30). The amount of outstanding

70 2 0 1 8 F S O C / / Annual Report
loans at credit unions increased by 9.8 percent over the year ending in the second quarter of 2018, a moderate decline from the 10.9 percent pace registered during the same period a year earlier. Credit union real estate loans, roughly half of all credit union lending, grew 9.6 percent during the year ending in the second quarter of 2018. Auto loans, just over one-third of the credit union loan portfolio, grew 10.6 percent.
The credit union system experienced ROA of 90 basis points at an annual rate through the first half of 2018, up from 77 basis points in 2017. Interest and noninterest income rose, and the NIM among all credit unions edged up to 3.07 percent of average assets from 2.93 percent one year earlier. The NIM among all credit unions has narrowed by roughly 20 basis points from the post-crisis high in 2010.
While credit union system performance has been relatively strong overall, smaller credit unions have not performed as well as larger credit unions by a number of standard measures. These smaller institutions account for the bulk of institutions but a dwindling share of assets and members. For example, credit unions with less than $100 million in assets account for 71 percent of the number of institutions, but only 7 percent of assets, while credit unions with more than $1 billion in assets account for 65 percent of system-wide assets and 58 percent of credit union members. ROA at the smaller institutions was 47 basis points on an annualized basis through the second quarter of 2018; ROA at credit unions with more than $1 billion in assets was 103 basis points. At the same time the loan delinquency rate for smaller credit unions was 94 basis points in the second quarter of 2018, compared with 63 basis points at the $1 billion plus institutions.
Credit unions continue to contend with interest rate risk, as the economy transitions to a higher interest rate environment with a flatter yield curve. While interest-sensitive deposits as a share of total liabilities have fallen back to pre-crisis levels, the share of money market accounts and individual retirement account (IRA)
-75
-50
-25
0
25
50
75
-75
-50
-25
0
25
50
75
2006 2008 2010 2012 2014 2016 2018
Net Income
4.11.30 Credit Union IncomeBillions of US$ Billions of US$
Source: NCUA
As Of: 2018 Q2
Noninterest IncomeNet Interest Income
Note: Federally-insured credit unions. Values are annualized.
Noninterest ExpenseProvisions Realized Gains/Losses
on Investments
4.11.30 Credit Union Income

71Financ ia l Deve lopments
deposits remains elevated (Chart 4.11.31). A measure of long-term assets—comprised of fixed-rate first mortgages and investments with a term longer than three years—rose to 28.0 percent of total assets at the end of the second quarter of 2018, up from 27.6 percent a year earlier. The share is high relative to the pre-crisis period (Chart 4.11.32).
After exhausting other sources of earnings growth, some credit unions appear to be continuing to reach for yield by lengthening the term of their investments to boost near-term earnings, though it may leave them vulnerable if short-term interest rates rise more quickly than expected. As the economy has improved and credit union lending has accelerated, the investment share of the credit union asset portfolio has declined and the share of assets accounted for by loans has increased. Over the past five years, the share of investments with maturity greater than three years declined from 11.7 percent in the second quarter of 2013 to 7.3 percent in the second quarter of 2018 (Chart 4.11.33). Over the same period, the share of assets accounted for by loans rose 12 percentage points to 70 percent.
Finally, although credit unions’ close ties to specific geographies or business organizations offer certain advantages, localized economic distress can present these institutions with cer-tain unique challenges. For example, the drop in the price of oil between 2014 and 2016 led to a sharp decline in investment and increased layoffs in energy companies, creating strains on the credit unions exposed to the sector. Similar-ly, credit unions exposed to the taxicab industry have experienced stress following increased competition from ridesharing companies and a decline in demand for traditional taxi services. As of the second quarter of 2018, there were seven credit unions with significant member
0
10
20
30
40
50
0
10
20
30
40
50
2006 2008 2010 2012 2014 2016 2018
4.11.32 Credit Union Net Long-Term AssetsPercent of Total Assets Percent of Total Assets
Source: NCUA
As Of: 2018 Q2
Fixed Rate First MortgagesInvestments Longer Than 3 Years
4.11.32 Credit Union Net Long-Term Assets
0
5
10
15
20
25
30
35
0
5
10
15
20
25
30
35
2007 Q2 2013 Q2 2015 Q2 2018 Q2
4.11.33 Credit Union Investments by MaturityPercent of Total Assets Percent of Total Assets
Source: NCUA
As Of: 2018 Q2
1-3 Years3-5 Years
5-10 Years<1 Year
>10 Years
Note: Federally-insured credit unions. Investments <1 year exclude securities with maturities <3 months.
4.11.33 Credit Union Investments by Maturity
45
50
55
60
65
20
24
28
32
36
2005 2007 2009 2011 2013 2015 2017
4.11.31 Credit Union DepositsPercent Percent
Source: NCUA
As Of: 2018 Q2
Money Market and IRA Deposit Share
(left axis)
Interest-Sensitive Deposit Share
(right axis)
Note: Federally-insured credit unions. Interest-sensitive deposit share includes money market and IRA deposit share, share certificates, and certain other deposits.
4.11.31 Credit Union Deposits
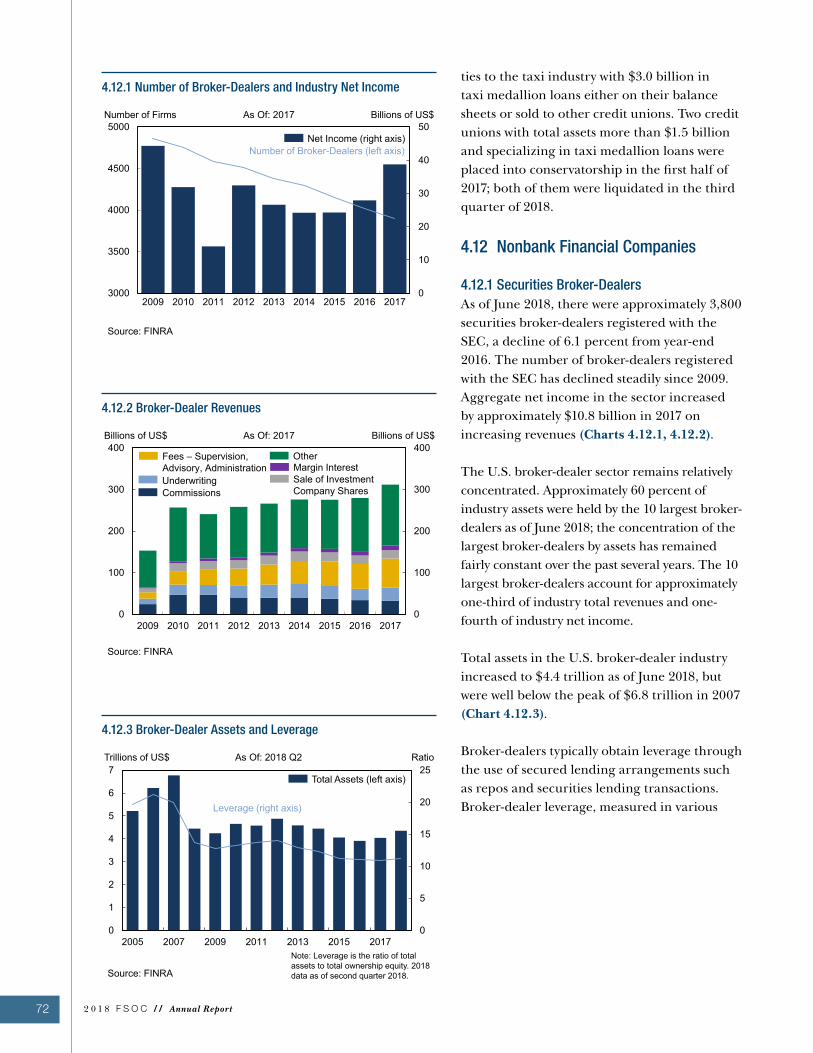
72 2 0 1 8 F S O C / / Annual Report
ties to the taxi industry with $3.0 billion in taxi medallion loans either on their balance sheets or sold to other credit unions. Two credit unions with total assets more than $1.5 billion and specializing in taxi medallion loans were placed into conservatorship in the first half of 2017; both of them were liquidated in the third quarter of 2018.
4.12 Nonbank Financial Companies
4.12.1 Securities Broker-DealersAs of June 2018, there were approximately 3,800 securities broker-dealers registered with the SEC, a decline of 6.1 percent from year-end 2016. The number of broker-dealers registered with the SEC has declined steadily since 2009. Aggregate net income in the sector increased by approximately $10.8 billion in 2017 on increasing revenues (Charts 4.12.1, 4.12.2).
The U.S. broker-dealer sector remains relatively concentrated. Approximately 60 percent of industry assets were held by the 10 largest broker-dealers as of June 2018; the concentration of the largest broker-dealers by assets has remained fairly constant over the past several years. The 10 largest broker-dealers account for approximately one-third of industry total revenues and one-fourth of industry net income.
Total assets in the U.S. broker-dealer industry increased to $4.4 trillion as of June 2018, but were well below the peak of $6.8 trillion in 2007 (Chart 4.12.3).
Broker-dealers typically obtain leverage through the use of secured lending arrangements such as repos and securities lending transactions. Broker-dealer leverage, measured in various
0
10
20
30
40
50
3000
3500
4000
4500
5000
2009 2010 2011 2012 2013 2014 2015 2016 2017
4.12.1 Number of Broker-Dealers and Industry Net Income Number of Firms Billions of US$As Of: 2017
Source: FINRA
Net Income (right axis)Number of Broker-Dealers (left axis)
0
100
200
300
400
0
100
200
300
400
2009 2010 2011 2012 2013 2014 2015 2016 2017
Sale of Investment Company Shares
Margin InterestOther
Underwriting
Fees – Supervision, Advisory, Administration
Commissions
4.12.2 Broker-Dealer RevenuesBillions of US$ Billions of US$
Source: FINRA
As Of: 2017
0
1
2
3
4
5
6
7
2005 2007 2009 2011 2013 2015 20170
5
10
15
20
25
4.12.3 Broker-Dealer Assets and LeverageTrillions of US$ Ratio
Source: FINRA
As Of: 2018 Q2
Note: Leverage is the ratio of total assets to total ownership equity. 2018 data as of second quarter 2018.
Total Assets (left axis)
Leverage (right axis)
4.12.1 Number of Broker-Dealers and Industry Net Income
4.12.2 Broker-Dealer Revenues
4.12.3 Broker-Dealer Assets and Leverage

73Financ ia l Deve lopments
ways, has declined markedly since 2007. For example, leverage measured as total assets over regulatory capital (defined as ownership equity qualified for net capital and allowable subordinated liabilities), increased slightly to 11.3 in aggregate as of June 2018, up from 10.9 as of year-end 2017, but it still remains well below the pre-crisis peak of 21.2 in 2006.
Most of the large U.S. broker-dealers are affiliated with U.S. BHCs or FBOs. Among this group of broker-dealers, aggregate assets for BHC-affiliated broker-dealers have increased steadily since 2015. Aggregate assets for broker-dealers affiliated with FBOs have continued to decrease significantly since 2010. BHC-affiliated broker-dealers had an aggregate leverage ratio of 13.0 as of June 2018, while FBO-affiliated broker-dealers had an aggregate leverage ratio of 9.7 (Chart 4.12.4).
Unlike the traditional banking sector model, which relies in large part on the use of customer deposits for funding, broker-dealers generally fund themselves through short-term secured financing arrangements. Since the crisis, broker-dealers have relied more heavily on short-term unsecured financing from their parent companies and affiliates. Broker-dealer financing activity through repo agreements represented 50 percent of total liabilities as of June 2018, up from 46 percent at year-end 2017, but down from 60 percent in 2009. A broker-dealer’s short-term liabilities are typically supported by a very liquid asset base such as Treasury securities, as well as agency debt and MBS. For the largest broker-dealers,
0
5
10
15
20
25
0
1
2
3
4
5
2010 2011 2012 2013 2014 2015 2016 2017 2018
4.12.4 Large Broker-Dealer Assets and Leverage by AffiliationTrillions of US$ Ratio
Source: FINRA
As Of: 2018 Q2
Note: Data covers BHC- and FBO-affiliated broker-dealers that are among the 25 largest broker-dealers by assets as of second quarter 2018.
BHC-Affiliated Assets (left axis)FBO-Affiliated Assets (left axis)
BHC-Affiliated Leverage (right axis)FBO-Affiliated Leverage (right axis)
4.12.4 Large Broker-Dealer Assets and Leverage by Affiliation

74 2 0 1 8 F S O C / / Annual Report
the WAM of repo for very liquid products was approximately three weeks as of June 2018. Less liquid assets such as high-yield debt are typically financed through term-secured financing arrangements, capital, or subordinated debt from the parent company. For the largest broker-dealers, the WAM of repo for less liquid assets was more than three months as of June 2018.
4.12.2 Insurance CompaniesThe net income of U.S. licensed life insurance companies grew by 6.9 percent in 2017. Net income has remained steady at around $40 billion for each of the past five years, and was $19 billion in the first half of 2018 (Chart 4.12.5). In the property and casualty (P&C) sector, net income fell for the fourth consecutive year in 2017, but appears stronger in the first half of 2018. Despite an increase in earned premiums and investment income, the sector has incurred large underwriting losses that have been due in part to catastrophic events.
Insurance companies have long cited the low interest rate environment as an impairment to their profitability. Although the federal funds rate target has increased by 175 basis points since December 2016 through October 2018, the yields on bonds, which comprise most of insurers’ general account invested assets, have not risen by the same amount. These developments are reflected in slightly higher yields on invested assets at P&C insurers and a leveling of yields at life insurers following years of declines (Chart 4.12.6).
In addition to changes in market interest rates, the yield on invested assets is also driven by the composition of those portfolios. Bonds remained the largest investment class in 2018, comprising 58 percent of P&C
2
3
4
5
6
2010 2011 2012 2013 2014 2015 2016 2017 20182
3
4
5
6
4.12.6 Net Yield on Invested AssetsPercent Percent
Source: SNL Financial, Bank of America Merrill Lynch, Haver Analytics
Life
P&C
Yield on A-Rated Corporate Debt
As Of: 2018 Q2
Note: Life includes accident and health.
4.12.6 Net Yield on Invested Assets
0
15
30
45
60
75
0
15
30
45
60
75
2010 2011 2012 2013 2014 2015 2016 2017 2018YTD
4.12.5 Insurance Industry Net IncomeBillions of US$ Billions of US$
Source: SNL Financial
As Of: 2018 Q2
LifeP&C
Note: Life includes accident and health.
4.12.5 Insurance Industry Net Income

75Financ ia l Deve lopments
insurers’ assets and 69 percent of those for life insurers. Nonetheless, insurers did change their investment mix somewhat in 2017 and the first half of 2018. Life insurers increased investments in bonds and real estate mortgage loans, while decreasing their direct investment in real estate. P&C insurers increased investments in mortgage loans, common equities, cash, and bonds.
The amount of capital supporting P&C insurers has continued to increase despite their declining net income (Chart 4.12.7). This has enabled their asset to capital ratio to remain steady over the past several years. Life insurers have also increased their capital, although at a more modest pace, and have similarly maintained steady asset to capital ratios.
4.12.3 Specialty FinanceAlthough outstanding consumer and business loans from commercial banks increased in 2017 and 2018, loans from specialty finance companies were generally flat over this period. Specialty finance companies are non-depository institutions that provide loans to consumers and businesses. Specialty finance companies held approximately $730 billion of consumer loans and leases and $388 billion of business loans and leases as of August 2018 (Charts 4.12.8, 4.12.9). Specialty finance companies’ ownership of real estate loans and leases declined in 2017 and 2018 to $123 billion and is about 80 percent below its pre-crisis peak.
0
250
500
750
1000
2010 2011 2012 2013 2014 2015 2016 2017 2018YTD
0
10
20
30
40
50
60
4.12.7 Insurance Industry Capital and SurplusBillions of US$ Percent of Total Assets
Life Capital and Surplus / Assets (right axis)P&C Capital and Surplus / Assets (right axis)Life Capital and Surplus (left axis)P&C Capital and Surplus (left axis)
As Of: 2018 Q2
Note: C&S/Assets is calculated as capital and surplus as a percent of net admitted assets less net admitted separate account assets. Life includes accident and health.Source: SNL Financial
4.12.7 Insurance Industry Capital and Surplus
0.0
0.5
1.0
1.5
2.0
2.5
0.0
0.5
1.0
1.5
2.0
2.5
2001 2004 2007 2010 2013 2016
Source: Federal Reserve, Haver Analytics
As Of: Sep-2018Trillions of US$4.12.8 Consumer Loans and Leases Outstanding
Note: Loans and leases owned and securitized. Series breaks in December 2010 and December 2014 due to change in data collection methodology. Gray bars signify NBER recessions.
Trillions of US$
Commercial Banks
Finance Companies
4.12.8 Consumer Loans and Leases Outstanding
0.0
0.5
1.0
1.5
2.0
2.5
0.0
0.5
1.0
1.5
2.0
2.5
2001 2004 2007 2010 2013 2016
Source: Federal Reserve, Haver Analytics
As Of: Sep-2018Trillions of US$4.12.9 Business Loans and Leases Outstanding
Trillions of US$
Commercial Banks
Finance Companies
Note: Loans and leases owned and securitized. Series break in December 2010 due to change in data collection methodology. Gray bars signify NBER recessions.
4.12.9 Business Loans and Leases Outstanding

76 2 0 1 8 F S O C / / Annual Report
While specialty finance companies trail commercial banks in overall consumer lending volume, these firms do maintain an outsized market share in certain types of activity. Amid surging auto loan growth, for example, specialty finance companies originated roughly 49 percent of total auto loans in the first half of 2018, slightly more than the 48 percent recorded during the first half of 2017. These firms, moreover, accounted for 72.6 percent and 73.3 percent of subprime auto loan originations, respectively, in those periods—well above the subprime lending market share of banks and credit unions. As opposed to banks, which generally have more stable sources of funding such as deposits, specialty finance companies rely to a higher degree on wholesale funding and the securitization market.
Total issuance of asset-backed securities (ABS) was 9.8 percent higher in the first three quarters of 2018 than during the same period in 2017. ABS issuance had grown 24 percent from 2016 to 2017 (Chart 4.12.10). Credit card ABS issuance declined sharply in the first three quarters of 2018, down 25 percent from the same period in 2017. Although new issue spreads are only modestly higher than historically low levels, rising rates have resulted in higher all-in funding costs for credit card ABS issuers and it appears that issuers have relied more on other funding sources, such as bank deposits. Meanwhile, student loan ABS issuance grew 44 percent in the first three quarters of 2018, having been flat in 2017. Auto ABS issuance continues to grow strongly: 2018 issuance through the third quarter is 10 percent higher than the same period in 2017, consistent with growth last year.
In 2018 through September, spreads widened for most ABS products, reversing some of the 2017 spread tightening that encouraged strong issuance in that year (Chart 4.12.11). Tighter spreads benefit ABS issuers by lowering their cost of financing through securitization.
0
50
100
150
200
250
300
350
0
50
100
150
200
250
300
350
2006 2008 2010 2012 2014 2016 2018YTD
4.12.10 ABS IssuanceBillions of US$ Billions of US$
Source: Thomson Reuters, SIFMA
As Of: Sep-2018
Credit CardAuto
Student LoansOther
Equipment
4.12.10 ABS Issuance

77Financ ia l Deve lopments
4.12.4 Agency REITsTotal assets of agency REITs increased from $251 billion to $287 billion over the second half of 2017, before falling to $269 billion as of the second quarter of 2018 (Chart 4.12.12). The increase in 2017 stopped a trend of steady declines from a peak of $418 billion in 2012. The market remains concentrated with approximately 64 percent of the share of total assets within two REITs. Leverage—as measured by the ratio of total assets to equity—has increased from 6.7 to 7.1 between June 2017 and June 2018. Leverage is below pre-crisis levels of 10 to 12. Leverage ratios among individual agency REITs continue to range widely, with a range of 2.3 to 10.3 in the second quarter of 2018.
Agency REITs use short-term financing, mainly repos, to fund the purchase of agency MBS. Most agency REITs also use derivatives to hedge at least a portion of the inherent duration mismatch between their assets and liabilities. However, prepayment risk and basis risk limit the efficacy of hedging with interest rate derivatives. Consequently, agency REITs’ investment strategy exposes them to interest rate risk resulting from changes in the yield curve and convexity risks, or the risk of MBS prices falling at an increasing rate when rates rise. Yields on MBS rose towards the end of 2017 into the first quarter of 2018, and were around the same level before rising in September and October of 2018. In October 2017, the Federal Reserve began to reduce the size of its balance sheet, which includes a runoff of agency MBS acquired during post-crisis asset purchases. By October 2018, the Federal Reserve’s holdings of agency MBS had decreased about $100 billion to $1.67 trillion. The spread between yields on MBS and financing costs has been decreasing as the yield curve has been flattening.
0
20
40
60
80
100
0
20
40
60
80
100
2010 2011 2012 2013 2014 2015 2016 2017 2018
4.12.11 Select ABS SpreadsBasis Points Basis Points
Source: J.P. Morgan
Subprime Auto Fixed BBB 3-YearPrime Auto Fixed AAA 3-YearCredit Card Fixed AAA 3-Year
As Of: 27-Sep-2018
Note: Spreads to swaps.
4.12.11 Selected ABS Spreads
As Of: 2018 Q2
0
100
200
300
400
500
0
3
6
9
12
15
18
2000 2003 2006 2009 2012 2015 2018
4.12.12 Agency REIT Assets and LeverageRatio Billions of US$
Source: Bloomberg, L.P.
Leverage(left axis)
Total Assets (right axis)
Note: Leverage is the ratio of total assets to equity. Not all agency REITs existed in all time periods in the figure.
4.12.12 Agency REIT Assets and Leverage

78 2 0 1 8 F S O C / / Annual Report
Share prices of agency REITs largely decreased since mid-2017 despite broad gains in domestic equity markets. The aggregate price-to-book (P/B) ratio for agency REITs continues to be around 1.0 (Chart 4.12.13). Prior to 2017, the sector had an aggregate P/B ratio below 1.0 for 16 consecutive quarters dating back to mid-2013.
4.13 Investment Funds
4.13.1 Money Market Mutual FundsThe AUM of U.S. MMFs increased 5.6 percent in 2017 and 1.2 percent from January to October 2018. MMF assets totaled $3.2 trillion in October 2018. Prime funds averaged 22 percent of total MMF assets as of October 2018, a slight increase from the 21 percent average during 2017. Government MMFs averaged 73.2 percent and 74.4 percent, respectively, during those periods (Chart 4.13.1).
MMF industry consolidation continued in 2017 but moderated in 2018. The number of MMFs declined from 413 in 2016 to 379 in 2017; the number increased to 381 in October 2018. The five largest MMF complexes managed 55 percent of all MMF assets in October 2018, up from 52 percent at the end of 2017. The ten largest advisers managed 77 percent of all MMF assets in October 2018, up slightly from 76 percent in 2017.
MMF yields increased in 2017 and 2018, along with U.S. short-term interest rates (discussed separately below). Yields offered by prime MMFs increased to 2.19 percent in October 2018 from 1.31 percent at the end of 2017. Yields for government MMFs were 2.23 percent in October 2018 from 1.33 percent in 2017. Yields for tax-exempt MMFs were 1.66 percent in October 2018 and 1.59 percent in 2017.
Prime MMFs’ daily liquidity—the share of assets convertible to cash within one business day—averaged 31 percent of assets through October 2018—somewhat lower than the average of 33 percent during 2017. This is significantly higher than the 10 percent
20
30
40
50
60
70
20
30
40
50
60
70
2011 2012 2013 2014 2015 2016 2017 2018
4.13.2 Liquid Asset Shares of Prime MMFsPercent of Total Assets Percent of Total Assets
Source: SEC
As Of: Oct-2018
Daily Liquidity
Weekly Liquidity
Note: Weighted by fund size.
4.13.2 Liquid Asset Shares of Prime MMFs
0
1
2
3
4
0
1
2
3
4
2011 2012 2013 2014 2015 2016 2017 2018
4.13.1 MMF Assets by Fund TypeTrillions of US$ Trillions of US$
Source: SEC
As Of: Oct-2018
PrimeGovernment and TreasuryTax-Exempt
4.13.1 MMF Assets by Fund Type
0.0
0.5
1.0
1.5
2.0
0.0
0.5
1.0
1.5
2.0
2000 2003 2006 2009 2012 2015 2018
4.12.13 Agency REIT Price-to-Book RatioRatio Ratio
Source: Bloomberg, L.P.
As Of: 2018 Q2
Note: Price-to-book ratio is weighted by market capitalization. Not all agency REITs existed in all time periods in the figure.
4.12.13 Agency REIT Price-to-Book Ratio

79Financ ia l Deve lopments
required by SEC rules. Weekly liquid assets (the share convertible to cash within five business days) averaged 50 percent in 2018 through October, little changed from 2017 and well above the 30 percent minimum required under SEC rules (Chart 4.13.2).
The WAM of a fund is a measure of the sensitivity of the market value of its portfolio holdings to interest rate changes. MMF managers tend to keep maturities short during periods of rising rates, to minimize potential negative impact on market values of portfolio securities, and to allow the short- maturity securities to be rolled into higher-yielding ones more quickly. Prime MMFs’ average WAM was 28.5 days through October 2018, down from an average of 29.1 days during 2017 and stood below the 60 days limit maximum permitted under SEC rules (Chart 4.13.3).
The Federal Reserve’s overnight reverse repurchase agreement (ON RRP) facility is a supplementary policy tool that the Federal Reserve uses to help keep the federal funds rate in the target range set by the FOMC. Eligible MMFs have loaned cash to the FRBNY through the facility since regular testing began in September 2013. Over the past several years, ON RRP investments have been an important part of MMF portfolio holdings, especially during periods when traditional repo counterparties did not offer attractive opportunities. More recently, MMFs averaged $29 billion in lending through the ON RRP facility through October 2018, down from an average of $226 billion during all of 2017.
0
10
20
30
40
50
60
0
10
20
30
40
50
60
2013 2014 2015 2016 2017 2018
4.13.3 Weighted Average Maturity by Fund TypeBasis Points Basis Points
Source: SEC
Tax-ExemptGovernment and TreasuryPrime
As Of: Oct-2018
4.13.3 Weighted Average Maturities by Fund Type

80 2 0 1 8 F S O C / / Annual Report
4.13.2 Mutual FundsThe AUM of the U.S. mutual fund industry increased 17 percent in 2017 and 4.1 percent in the first nine months of 2018; industry AUM totaled $16.6 trillion in September 2018. Mutual fund assets constituted approximately 71 percent of total U.S. investment company AUM (Chart 4.13.4). The vast majority of recent mutual fund growth is due to capital appreciation, rather than investor inflows.
-50
-25
0
25
50
-50
-25
0
25
50
2013 2014 2015 2016 2017 2018
Source: ICI, Haver Analytics
As Of: Sep-2018Billions of US$4.13.6 Monthly Equity Mutual Fund Flows
Billions of US$
4.13.6 Monthly Equity Mutual Fund Flows
0
5
10
15
20
25
0
5
10
15
20
25
1996 1999 2002 2005 2008 2011 2014 2017
4.13.4 Net Assets of the Investment Company IndustryTrillions of US$ Trillions of US$As Of: 2018 Q3
ETFsOther
Equity Mutual FundsBond/Hybrid Mutual FundsMMFs
Note: Other is composed of unit investment trusts and closed-end funds. 2018 YTD figures include 2017 UIT data, which is reported annually. Source: ICI, Haver Analytics
-75
-50
-25
0
25
50
-75
-50
-25
0
25
50
2013 2014 2015 2016 2017 2018
Source: ICI, Haver Analytics
As Of: Sep-2018Billions of US$4.13.5 Monthly Bond Mutual Fund Flows
Billions of US$
Tax-ExemptTaxable
4.13.4 Net Assets of the Investment Company Industry
4.13.5 Monthly Bond Mutual Fund Flows

81Financ ia l Deve lopments
Mutual funds experienced net cash outflows during most months of 2018, driven largely by equity fund outflows (Charts 4.13.5, 4.13.6). High yield bond funds’ 2017 outflows continued into early 2018, reflecting the anticipated negative effect of tax law changes on issuers of lower rated debt. Flows to bank loan funds were varied in 2017, yet inflows to bank loan funds were consistently strong in 2018 and totaled $17 billion through September 30, on the backdrop of increasing interest rates (Charts 4.13.7, 4.13.8). Alternative mutual funds—which include funds that implement long-short, market-neutral, and inverse strategies, and which at one time were a fast-growing category of mutual funds—incurred small net inflows in 2017 and notable net outflows through September 2018 (Chart 4.13.9).
-30
-20
-10
0
10
20
30
-30
-20
-10
0
10
20
30
2006 2008 2010 2012 2014 2016 2018
4.13.7 High-Yield Mutual Funds: Quarterly FlowsBillions of US$ Billions of US$
Source: Morningstar, Inc.
As Of: 2018 Q3
4.13.7 High-Yield Mutual Funds: Quarterly Flows
-20
-10
0
10
20
30
-20
-10
0
10
20
30
2006 2008 2010 2012 2014 2016 2018
4.13.8 Bank Loan Mutual Funds: Quarterly FlowsBillions of US$ Billions of US$
Source: Morningstar, Inc.
As Of: 2018 Q3
4.13.8 Bank Loan Mutual Funds: Quarterly Flows
-20
-10
0
10
20
-20
-10
0
10
20
2006 2008 2010 2012 2014 2016 2018
4.13.9 Alternative Mutual Funds: Quarterly FlowsBillions of US$ Billions of US$
Source: Morningstar, Inc.
As Of: 2018 Q3
4.13.9 Alternative Mutual Funds: Quarterly Flows

82 2 0 1 8 F S O C / / Annual Report
Investors have continued to gravitate away from actively managed equity funds and towards lower-cost, index-based equity funds. As of September, 2018, passively managed mutual funds and ETFs represented 47 percent of U.S. equity fund AUM, up from 26 percent in 2009. In the twelve months ending September 2018, inflows to passively managed equity funds totaled $306 billion, while their actively managed counterparts saw outflows of $143 billion (Chart 4.13.10). In fixed income mutual funds, both actively managed and index funds have continued to experience inflows.
4.13.3 Exchange-Traded ProductsExchange-traded products (ETPs) include 1940 Act registered ETFs, non-1940 Act registered ETPs (such as those that primarily hold commodities or physical metals), and exchange-traded notes (ETNs). In 2017 and 2018, U.S. ETPs continued to expand at a faster rate than many other SEC registered investment vehicles. AUM increased 35 percent in 2017 and an additional 8.7 percent over the first nine months of 2018, reaching $3.7 trillion by September (Chart 4.13.11). AUM growth has been primarily driven by inflows, which totaled $465 billion in 2017 and $214 billion in the first nine months of 2018.
In the first three quarters of 2018, domestic equity and taxable bond ETPs respectively accounted for 42 percent and 31 percent of total inflows. In 2017, international equity, domestic equity and taxable bond ETPs respectively accounted for 32 percent, 31 percent, and 26 percent of total ETP inflows.
The industry remains concentrated, as the three largest managers account for 81 percent of ETP assets and the top ten managers account for 95 percent. The number of available ETPs increased 7.5 percent in 2017 and an additional 5.1 percent over the first nine months of 2018, driven by products focused on alternative asset classes or strategies.
-1.5
-1
-0.5
0
0.5
1
1.5
-1.5
-1
-0.5
0
0.5
1
1.5
2009 2010 2011 2012 2013 2014 2015 2016 2017 2018
4.13.10 Cumulative Equity Fund FlowsTrillions of US$ Trillions of US$
Source: Morningstar, Inc.
As Of: Sep-2018
Note: Includes ETFs and mutual funds.
International Passively ManagedInternational Actively ManagedU.S. Passively ManagedU.S. Actively Managed
4.13.10 Cumulative Equity Fund Flows
-1.0
0.0
1.0
2.0
3.0
4.0
-1.0
0.0
1.0
2.0
3.0
4.0
2009 2010 2011 2012 2013 2014 2015 2016 2017 2018
4.13.11 U.S.-Listed ETP AUMTrillions of US$ Trillions of US$
Source: Morningstar, Inc.
As Of: Sep-2018
Cumulative Flows to ETFsCumulative Market AppreciationAUM
4.13.11 U.S.-Listed ETP AUM

83Financ ia l Deve lopments
ETFs, which constitute most ETP assets, accounted for approximately 16 percent of the U.S. investment company industry in September 2018, up from 15 percent in 2017, and 13 percent in 2016. Index-based ETFs across nearly all asset classes experienced strong rates of net asset growth over this time period. Additionally, so-called strategic- or smart-beta ETFs, which differ from traditional index-based funds by targeting certain risk and return characteristics such as volatility or income, grew rapidly in 2017 and 2018. Approximately 21 percent of ETF assets are in strategic beta products.
On February 5, 2018, volatility-linked inverse ETPs experienced turbulence following an unprecedented surge in the VIX (see Box D). Adjustments made to ETP portfolios on that day were an important share of the overall trades in some VIX futures contracts. As a result of this episode, two ETPs, managed by Credit Suisse and Nomura, were shut down.
4.13.4 Pension FundsAs of the second quarter of 2018, the combined AUM of U.S. private and public pensions was $23 trillion, 4.0 percent higher than one year earlier. Including estimated IRAs, retirement fund assets totaled $32 trillion (Chart 4.13.12). Changes to pension allocations can amplify asset price volatility. However, the broader impact of such changes and potential risks emanating from pension funds are difficult to assess given data limitations, including lack of uniform reporting, timeliness, and granularity of pension assets, liabilities, and return assumptions.
0
4
8
12
16
20
24
28
32
36
0
4
8
12
16
20
24
28
32
36
2007 2009 2011 2013 2015 2017
Source: Federal Reserve, Haver Analytics
As Of: 2018 Q1Trillions of US$4.13.12 Retirement Fund Assets by Plan Type
Trillions of US$
Private Defined Benefit Plans
Individual AccountsPrivate Defined Contribution Plans
State and LocalFederal
4.13.12 Retirement Fund Assets by Plan Type

84 2 0 1 8 F S O C / / Annual Report
Corporate Plans Corporate defined benefit funded status—the estimated share of fund liabilities covered by current assets—rose in 2017 (Chart 4.13.13). One estimate of the funded status of the 100 largest corporate defined benefit pension plans in the U.S. was 86 percent as of December 2017, an improvement from the previous year.
Multiemployer Plans The aggregated funded percentage of plans in the multiemployer sector is 81 percent according to an estimate from Milliman. While the Pension Benefit Guaranty Corporation (PBGC) projects the majority of multiemployer plans will remain solvent, a core group of plans appears unable to raise contributions sufficiently to avoid insolvency. According to the PBGC, over 1.3 million participants are covered in the 130 plans that have declared that they will likely face insolvency over the next 20 years.
The PBGC projects it will have insufficient funds to cover the projected future demands from multiemployer plans requiring financial assistance. It is more likely than not the PBGC multiemployer program will run out of money by 2025. If so, the PBGC will be unable to provide financial assistance to pay the full level of guaranteed benefits in insolvent multiemployer plans.
The Kline-Miller Pension Reform Act allows multiemployer plans projected to become insolvent in less than 20 years (15 years in some cases) to apply to Treasury for permission to reduce pension benefits. They may apply if reducing benefits would allow the plan to remain solvent over the long-term and continue to provide benefits at least 10 percent higher than the level of the PBGC guarantee, with further protections for the aged and disabled. As of October 31, 25 plans have filed 34 applications with Treasury. Eight applications have been approved, five applications have been denied, and twelve applications have been withdrawn. The remaining applications are in the process of being evaluated.
60
70
80
90
100
110
120
60
70
80
90
100
110
120
2002 2004 2006 2008 2010 2012 2014 2016
4.13.13 Public and Private Pension Funding Levels
Source: NASRA Public Fund Survey, Milliman2018 Corporate Pension Funding Study
Percent Percent
Public Defined Benefit Plans
Private Defined Benefit Plans
As Of: 2017
4.13.13 Public and Private Pension Funding Levels

85Financ ia l Deve lopments
Public Plans In 2017, the aggregate funded status of U.S. public pension plans was 72 percent, in line with the prior year. Also of note, public pension funds generally use a different set of accounting rules than private pension funds. These rules enable them to assume investment returns based on their own long-run expectations, which are significantly higher than average post-crisis returns, and thus could overstate funded status. A number of large public plans have continued to revise their long-term investment expectations downwards. The underfunding of certain public plans continues to exert fiscal pressure on their sponsoring municipalities including U.S. territories Puerto Rico and the U.S Virgin Islands, as well as certain municipalities such as Dallas and Chicago.
4.13.5 Alternative Funds Hedge Funds The gross asset value (GAV) of hedge funds offered in the U.S. totaled $7.3 trillion in 2017, a 14 percent increase from the prior year. The funds’ NAV totaled $3.9 trillion, an 11 percent increase. These figures cover the approximately 9,000 hedge funds and 1,700 hedge fund advisers that file SEC Form PF.
Various measures of leverage at the largest hedge funds, including measures of off-balance sheet exposures, show increasing leverage in the industry. GAV divided by NAV, one balance sheet leverage measure, showed aggregate hedge fund leverage of 1.87 for 2017, roughly the same as 2016. Gross notional exposure divided by NAV, a measure including notional derivatives, showed aggregate hedge fund leverage over 6 during 2017, somewhat higher than in 2016. Removing interest rate derivatives from gross notional exposure yields ratios of between 4 and 5 during 2017, also somewhat higher than in 2016. The largest hedge funds are notably more leveraged than the industry aggregate; the most highly leveraged funds also increased their ratios in 2017. Using gross notional exposures, the 98th percentile of large hedge fund adviser leverage ranged from 12 to

2 0 1 8 F S O C / / Annual Report86
14 in the second half of 2017, compared to 11 to 12 for the prior eighteen months. Excluding interest rate derivatives, the 98th percentile ranged 8 to 9 in 2017; it ranged from 7 to 8 in 2016. Top leverage ratios are higher at the fund level than the adviser-level ratios stated here.
The hedge fund industry remains concentrated. The top 6 percent of funds filing Form PF account for 67 percent of all filers’ GAV and 90 percent of all filers’ gross notional exposure. These figures were little changed from 2016 to 2017.
According to Hedge Fund Research (HFR) data, the hedge fund industry experienced modest net inflows of $10 billion in 2017 and small outflows in the first half of 2018. This follows large net outflows of $70 billion in 2016. The reduction in outflows can be attributed in part to improved fund performance in 2017 combined with a continued reduction in hedge fund fees.
Hedge fund returns continued to underperform the S&P 500. The HFR Global Hedge Fund index increased 1.3 percent from January 2018 to August 2018, far below the 7.4 percent increase for the S&P 500 stock index.
Private EquityThe GAV of private equity funds offered in the United States totaled $2.7 trillion in 2017, a 17 percent increase from the prior year. The funds’ NAV totaled $2.4 trillion, also a 17 percent increase. These figures cover approximately 11,500 private equity funds, for which approximately 1,100 private equity advisers filed information on Form PF. Data from Preqin, which cover less of the industry but offer a longer time series for comparison, show a similar growth rate in 2017 (Chart 4.13.14).
The private equity industry remains concentrated. Large private equity advisers filing Form PF—those with $2 billion or more in AUM—made up 26 percent of all private equity advisers filing Form PF in 2017, and managed 71 percent of gross assets.
0.0
0.4
0.8
1.2
1.6
0.0
0.4
0.8
1.2
1.6
2005 2007 2009 2011 2013 2015 2017
4.13.14 North American Private Equity AUMTrillions of US$ Trillions of US$
Source: Preqin
As Of: 2017
Dry PowderUnrealized Value
4.13.14 North American Private Equity AUM

87Financ ia l Deve lopments
For funds managed by large private equity advisers, pension funds remain the largest beneficial owners, accounting for 33 percent of net assets; other private funds account for 20 percent, foreign official sector investors account for 11 percent, and insurance companies account for 6 percent.
Acquisition-related activity backed by private equity continued to increase in 2017 and has surpassed 2017 levels year-to-date in 2018 for both leveraged buyouts and non-leveraged buyouts (Chart 4.13.15).
The private equity industry continues to attract investor inflows, in part because the sector is viewed as an attractive alternative to hedge funds. According to Preqin survey data, 95 percent of investors felt private equity investment met or exceeded their expectations in 2017, with over half planning to increase their allocation to private equity over the long-run. In 2017, private equity funds raised a record $450 billion in capital, with 79 percent of funds meeting or exceeding their target fundraising. Private equity underperformed the S&P 500 during the last one, five, and 10 years.
4.14 New Financial Products and Services
Financial innovation in products and business practices has continued over the past year. Recently, much attention has been devoted to financial innovation enabled by technology, or ‘fintech,’ which is changing the way some financial services are provided. This trend has been particularly apparent in areas such as digital assets, payments, and marketplace lending. Over the past year, a great deal of discussion has also been devoted to the entrance (and further potential evolution in the market) of well-established technology and e-commerce firms into financial services. Additionally, incumbent financial institutions are increasingly relying on third-party service providers for important technology and data-related services.
0
50
100
150
200
250
0
50
100
150
200
250
2011 2012 2013 2014 2015 2016 2017 2018
4.13.15 M&A Loan Volume for Private Equity-Backed IssuersBillions of US$ Billions of US$
Source: S&P LCD
As Of: 31-Oct-2018
LBONon-LBO
YTD
4.13.15 M&A Loan Volume for Private Equity-Backed Issuers

2 0 1 8 F S O C / / Annual Report88
4.14.1 Digital AssetsDigital assets, such as Bitcoin, have rapidly increased in value in recent years (Chart 4.14.1). Their dollar value has also been highly volatile. Some sources estimated that market capitalization of digital assets reached $800 billion in early 2018, then declined precipitously to $125 billion by August. Many digital assets are enabled by blockchains or other distributed ledger technologies. Such systems share data across a network, creating identical copies of their ledger that are then often stored at and synchronized across multiple locations. Distributed ledger technology may have applications that extend well beyond the simple transfer of value. In recent years, an increasing number of financial institutions have initiated proof of concept projects to evaluate the potential for the technology’s application in areas such as interbank and intrabank settlement, derivatives processing, repo clearing, and trade finance.
4.14.1 Market Capitalization of Blockchain-Based Digital Assets
Source: Coinmarketcap.com; OFR
0
50
100
150
200
250
300
350
0
50
100
150
200
250
300
350
Apr:13 Apr:14 Apr:15 Apr:16 Apr:17 Apr:18
Billion of US$ Billions of US$As Of: 30-Sep-2018
LitecoinRippleEtherumBitcoin
4.14.1 Market Capitalization of Blockchain-Based Digital Assets

89Financ ia l Deve lopments
The dollar value of digital assets grew extremely rapidly in recent years. The massive price increase and volatility of Bitcoin—from $5 in 2012 to nearly $20,000 in early 2018, and less than $7,000 in October 2018—drew particular attention to digital assets from market participants, regulatory authorities, and international organizations.
In late 2017, the Council formed a working group on digital assets to facilitate coordination among U.S. financial regulators regarding these markets. The working group is examining issues related to digital assets and distributed ledger technology, including financial institutions’ exposures to digital assets, potential cybersecurity and operational risks related to these assets, illicit activity undertaken with digital assets, and international coordination on these topics.
Digital assets pose new challenges to market integrity and regulatory frameworks designed to protect investors and the public. An offering of digital assets or of assets that use a distributed ledger or blockchain can be subject to the requirements of federal securities and other laws. In the United States, initial coin offerings (ICOs) involving digital assets such as coins or tokens may be securities offerings—based on specific facts about the offerings—and may therefore fall under the federal securities laws enforced by the SEC. Furthermore, participants in an ICO may be subject to anti-money laundering (AML) rules.
New technologies can present opportunities for fraudulent schemes, market manipulation, and other illicit activity—including old schemes under new names and using new terminology. The SEC and CFTC have cautioned investors to be mindful of traditional “red flags” when making any investment decision, including deals that sound too good to be true; promises of high returns with little or no risk; high-pressure sales tactics; celebrity promotions; working with unregistered or unlicensed sellers; and trading on unregistered platforms.
Payments made using digital assets pose serious money laundering and other illicit financing risks that
must be assessed and aggressively countered by U.S. and non-U.S. regulators. The growing use of digital assets—including the development of new assets designed to enhance anonymity—to facilitate illicit activity, including cybercrime, fraud, extortion, drug trafficking, money laundering, tax evasion, and other crimes, poses material risks.
Most of the risks posed by digital assets are not limited by national borders, so effective supervision and regulation of digital assets will require sustained bilateral and multilateral international engagement. In March 2018, G20 Finance Ministers and Central Bank Governors endorsed language in a communiqué that referenced crypto-assets—a subset of digital assets—for the first time. Treasury and the representatives of Council member agencies to various international standard-setting bodies are working to assess and adopt, where appropriate, measures to mitigate risks associated with digital assets in a way that is responsive to the priorities of U.S. regulatory, supervisory, and enforcement authorities.
Treasury and relevant U.S. regulators are considering rationalized regulatory responses that are appropriate for digital assets and the financial activities involving them, while aggressively targeting persons using such assets to conduct fraudulent or other illicit activities.
Digital assets do not presently appear to pose a threat to the stability of the financial system. As discussed above, the estimated market capitalization of digital assets is still relatively small at less than $200 billion; for context, that is less than 1 percent of the market capitalization of U.S. stocks. Digital assets currently have limited use in the real economy or financial transactions. Nonetheless, the value and uses of digital assets could grow rapidly, which would substantially increase their importance to the financial system. The Council will continue to monitor potential risks presented by the use of digital assets as these markets evolve.
Box B: The Council’s Digital Assets Working Group

2 0 1 8 F S O C / / Annual Report90
4.14.2 Peer-to-Peer Payments Many consumers have gradually changed the ways they make payments (Chart 4.14.2). In the past few years, several new ways of making payments have developed. Peer-to-peer transfers allow consumers to make payments to other consumers or firms online, usually through a mobile device app. The apps are generally linked to debit or credit card accounts or bank accounts, and the funding transfers therefore proceed through existing bank-maintained payment networks. Although some providers of such services are relatively new companies and experienced substantial growth in 2016 and 2017, banks and other existing financial service providers have also entered the market.
4.14.3 Marketplace Lending Marketplace lending is the provision of loans through online, electronic platforms. Initially, marketplace lending focused on retail investors providing funding to individual borrowers, and was called peer-to-peer lending. This model has evolved to one that uses significant capital from institutional investors to finance consumer and small business loans. Some of the largest marketplace lenders in the consumer finance area concentrate on providing debt consolidation loans and refinancing existing student loans. Although marketplace lending is growing, it continues to represent a small portion of overall lending.
0
20
40
60
80
100
0
20
40
60
80
100
1989 1993 1997 2001 2005 2009 2013 2017
4.14.2 U.S. Consumer Adoption of Payment InstrumentsPercent of Consumers Percent of ConsumersAs Of: 2017
Source: Federal Reserve Bank of Boston
Note: Survey of Consumer Finances data from 1989 to 2007. Survey of Consumer Payment Choice data from 2008 to 2017.
CashCheckOnline Banking Bill PaymentsChecking AccountCreditDebit
4.14.2 U.S. Consumer Adoption of Payment Instruments

91Financ ia l Deve lopments
4.14.4 Large Technology Firms in Financial Services
Over the past few years, large technology and e-commerce firms have entered, or explored entering, financial services markets. Often, these firms offer financial products or services to customers as part of their established business activity, such as providing loans to small businesses or individuals operating on their technology or e-commerce platforms. Some of these technology and e-commerce companies have features that could allow them to grow quickly as providers of financial services, including large customer networks, broad name recognition, and existing data on current and potential clients. Additionally, as non-financial entities, these technology firms may not be subject to the full set of regulations and oversight that apply to the financial institutions that provide the same or similar services.
4.14.5 Reliance of Financial Institutions on Third-Party Service Providers
Reliance by financial institutions on third parties to provide important operational functions has increased over the past several years. With the adoption of fintech innovations and the proliferation of large data sets, some financial institutions have outsourced portions of certain operational functions and data gathering requirements. Financial institutions are increasingly relying on third-party firms that aggregate and distribute market-wide data. They are also using outside cloud computing services to supplement existing technology infrastructures for data storage, redundancy, and computational capacity. These services have information and cost benefits, but relying on outside firms for critical data and services also creates risks.


93Regu lato r y Deve lopments and Counc i l Ac t i v i t i es
Since the Council’s 2017 annual report, actions by financial regulatory agencies have included supervisory and company-run stress tests; supervisory review and comment on large banking organizations’ resolution plans; implementation of additional reforms of the derivatives markets; amendments to disclosure requirements for mutual funds and ETFs; and measures intended to enhance consumer protection. Regulators have also taken steps to further tailor certain existing regulations, including capital requirements and the rules implementing the Volcker Rule. The Council continued to fulfill its mandate to monitor potential risks to U.S. financial stability and serve as a forum for discussion and coordination among the member agencies. Following is a discussion of the significant financial regulatory reforms implemented since the Council’s 2017 annual report.
5.1 Safety and Soundness
5.1.1 Enhanced Capital and Prudential Standards and Supervision
Pursuant to section 165 of the Dodd-Frank Act, as amended by EGRRCPA, the Federal Reserve applies enhanced prudential standards to certain BHCs and nonbank financial companies supervised by the Federal Reserve. These requirements generally apply to U.S. G-SIBs and any other BHCs with $250 billion or more in total consolidated assets, though they also apply to BHCs with $100 billion or more in total consolidated assets until November 2019. In addition, the Federal Reserve has the authority to apply any such standard to BHCs with $100 billion or more, but less than $250 billion, in total consolidated assets if it determines that application of the standard is appropriate to prevent or mitigate risks to U.S. financial stability or to promote safety and soundness.
On July 5, 2018, the Basel Committee on Banking Supervision (BCBS) issued a revised framework that replaces the BCBS’s 2013 framework used to identify G-SIBs and impose higher capital requirements on these entities. The revised framework implements
a number of changes to the framework that the BCBS proposed in March 2017. Among other changes, the 2018 revised framework introduces a new indicator for secondary capital markets activity in the substitutability category, modifies the definition of cross-jurisdictional indicators, expands the regulatory scope of consolidation to include insurance subsidiaries, and introduces a requirement that banks disclose the indicators used in their “final” G-SIB calculations, which in certain instances may require restatement. The revised assessment methodology will take effect in 2021.
On July 31, 2018, the OCC announced that it would begin considering applications for a special purpose national bank charter from financial technology (fintech) companies, provided they meet the requirements and standards for obtaining a charter. The OCC will consider applications from fintech companies to charter a special purpose national bank that would engage in one or more of the “core banking activities” of paying checks or lending money but would not take deposits and would not be insured by the FDIC. The OCC stated that a qualified fintech company that receives a special purpose national bank charter will be subject to the same high standards of safety and soundness and fairness that all federally chartered banks must meet, and will be supervised like similarly situated national banks, including with respect to capital, liquidity, and risk management.
State financial services regulators are working to implement approaches to achieve harmonization in the state system of licensing and regulating nondepository financial institutions. Through the CSBS, state regulators have launched a multi-pronged initiative, known as Vision 2020, to develop a unified multi-state regulatory system for nondepository financial institutions by 2020. The core components of Vision 2020 include redesigning Nationwide Multistate Licensing System (NMLS), developing a comprehensive State Examination System, establishing a fintech industry advisory
5 Regulatory Developments and Council Activities

2 0 1 8 F S O C / / Annual Report94
panel, and driving toward more efficient state-federal coordination in the supervision of bank third-party service providers.
On August 6, 2018, the Federal Reserve published a final rule, issued pursuant to section 165(e) of the Dodd-Frank Act, establishing single-counterparty credit limits (the SCCL) for BHCs and FBOs with $250 billion or more in total consolidated assets. The Federal Reserve issued proposed rules in 2011 for domestic BHCs and in 2012 for FBOs, and issued a re-proposal in 2016. Among other changes, the rule limits the “net credit exposures” of covered firms to a single counterparty to a specified percentage of the covered firm’s eligible capital base, and includes modifications from the 2016 re-proposal intended to streamline compliance with the SCCL.
On August 31, 2018, the OCC, Federal Reserve, and FDIC issued an interim final rule with request for comment, which amends the agencies’ LCR rule to treat liquid and readily marketable, investment grade (IG) municipal obligations as HQLA. The agencies published the interim final rule pursuant to section 403(b) of EGRRCPA. Section 403(a) of that Act amends section 18 of the Federal Deposit Insurance Act and requires the agencies, for purposes of their LCR rule and any other regulation that incorporates a definition of the term “high-quality liquid asset” or another substantially similar term, to treat a municipal obligation as HQLA if that obligation is “liquid and readily-marketable” and “investment grade,” as of the LCR calculation date.
On October 30, 2018, the Federal Reserve, OCC, and FDIC issued a proposal to implement the standardized approach for counterparty credit risk (SA-CCR), which would be used to determine the exposure amount of a derivative contract under the capital rule. SA-CCR is a non-models based approach that reflects current market conventions regarding the exchange of initial and variation margin as well as stress volatilities observed during the financial crisis. Advanced approaches banking organizations would be required to use SA-CCR instead of the existing Current Exposure Method (CEM); however, other banking organizations could choose to use either CEM or SA-CCR.
On October 31, 2018, the Federal Reserve invited public comment on a framework that would more closely align the prudential standards for large U.S. banking organizations with their risk profiles. The framework would establish four categories of prudential standards for banking organizations with $100 billion or more in total consolidated assets. The category of standards for a firm would be determined based on several risk-based factors, including asset size, cross-jurisdictional activity, reliance on short-term wholesale funding, nonbank assets, and off-balance sheet exposure. The proposals build on the Federal Reserve’s existing tailoring of its rules. The regulatory capital and liquidity aspects of the proposals were jointly developed with the FDIC and OCC.
5.1.2 Dodd-Frank Act Stress Tests and Comprehensive Capital Analysis and Review
Section 165(i) of the Dodd-Frank Act, as amended by EGRRCPA, and section 401(e) of EGRRCPA, currently requires two types of stress tests. First, the Federal Reserve must conduct supervisory stress tests of BHCs with $100 billion or more in total consolidated assets on an annual or periodic basis, depending on the size of the firm, and annual supervisory stress tests of nonbank financial companies designated by the Council for supervision by the Federal Reserve.
Second, section 165(i) of the Dodd-Frank Act, as amended, also requires periodic company-run stress testing by certain financial companies regulated by a primary federal financial regulatory agency; BHCs with $250 billion or more in total consolidated assets or that are U.S. G-SIBs; and nonbank financial companies designated by the Council. The statute also provides the Federal Reserve with discretion to require a BHC with between $100 and $250 billion in total consolidated assets to conduct periodic company-run stress tests.
In addition, through CCAR, the Federal Reserve evaluates the capital adequacy and the capital planning processes of large BHCs, including the quality of the BHCs’ risk-management frameworks and proposed capital actions such as dividend payments and stock repurchases. On April 10, 2018, the Federal Reserve proposed changes to its capital,

95Regu lator y Deve lopments and Counc i l Act i v i t i es
capital planning, and stress-testing frameworks. The proposal would create a single, integrated capital requirement by combining the quantitative assessment of the CCAR program with the buffer requirements in the Federal Reserve’s regulatory capital rule. Other proposed changes to CCAR, intended to better align it with a firm’s anticipated actions during stress, include eliminating the current assumption in CCAR that a firm will carry out all nine quarters of its planned capital actions (such as dividends, repurchases, and issuances) in the stress test, instead requiring firms to prefund only four quarters of planned common stock dividends; modifying a current assumption in CCAR that a firm’s balance sheet will grow under stress to an assumption that balance sheet size will remain constant under stress; and eliminating the 30 percent dividend payout ratio as a threshold for heightened scrutiny.
5.1.3 Resolution Planning and Orderly Liquidation Under the framework of the Dodd-Frank Act, resolution under the U.S. Bankruptcy Code is the statutory first option in the event of the failure of a financial company. Section 165(d) of the Dodd-Frank Act requires nonbank financial companies designated by the Council for supervision by the Federal Reserve and certain BHCs—including FBOs that have intermediate BHCs within U.S. territory—to report periodically to the Federal Reserve, the FDIC, and the Council plans for their rapid and orderly resolution under the U.S. Bankruptcy Code in the event of material financial distress or failure—also referred to as living wills. Under EGRRCPA, BHCs with less than $100 billion in total assets are exempted from enhanced prudential standards, including resolution plan requirements. Any BHC with total consolidated assets of at least $100 billion but less than $250 billion is subject to resolution plan requirements for 18 months after enactment of EGRRCPA (unless earlier exempted by the Federal Reserve), and the Federal Reserve may apply resolution plan requirements to any such BHC thereafter.
The Federal Reserve and the FDIC review each plan and may jointly determine that a plan is not credible or would not facilitate an orderly resolution of the company under the U.S. Bankruptcy Code. If the Board of Governors of the Federal Reserve
and the FDIC Board of Directors make such a joint determination, the agencies must notify the company of the deficiencies in its plan, and the company must resubmit its plan with revisions that address the deficiencies, including any proposed changes in business operations and corporate structure. The company must also explain why it believes that the revised plan is credible and would result in an orderly resolution under the U.S. Bankruptcy Code.
If a firm fails to adequately remediate its identified deficiencies, the Federal Reserve and the FDIC, acting jointly, may impose more stringent capital, leverage, or liquidity requirements, or restrictions on growth, activities, or operations of the firm, or its subsidiaries. If, following a two-year period beginning on the date of the imposition of such requirements, a firm still has failed to adequately remediate any deficiencies, the Federal Reserve and the FDIC, in consultation with the Council, may jointly require the firm to divest certain assets or operations to facilitate an orderly resolution of the firm in bankruptcy.
In December 2017, the Federal Reserve and FDIC jointly announced that their review of the resolution plans of the eight U.S. G-SIBs found no “deficiencies,” which are weaknesses severe enough to trigger a resubmission process that could result in more stringent requirements. The agencies also jointly determined that the plans of four of the G-SIBs (Bank of America, Goldman Sachs, Morgan Stanley, and Wells Fargo) had “shortcomings,” which are less-severe weaknesses that require additional work in their next plan. The agencies also communicated updated expectations for the next resolution plans for 19 FBOs and two domestic BHCs in January and March 2018, respectively. In July 2018, the agencies jointly announced that they were seeking public comment on revised resolution plan guidance for the eight U.S. G-SIBs. The proposed guidance would apply beginning with the July 1, 2019, resolution plan submissions of the firms.
In July 2018, ISDA published the ISDA 2018 U.S. Resolution Stay Protocol, which was published in response to regulations issued by the Federal Reserve, the FDIC, and the OCC in 2017 requiring certain qualified financial contracts (QFCs) of

2 0 1 8 F S O C / / Annual Report96
G-SIB entities to contain provisions providing for cross-border recognition of U.S. special resolution regimes and stay and transfer provisions relating to cross-defaults arising from the entry of an affiliate of the G-SIB entity into certain resolution proceedings.
5.1.4 Volcker RuleIn July 2018, the Federal Reserve, FDIC, OCC, SEC, and CFTC issued a Federal Register notice seeking comment on a number of amendments to the regulations implementing the Volcker Rule. The existing regulations were issued by the five agencies in December 2013 and generally prohibit banking entities from (1) engaging in proprietary trading in securities, derivatives, commodity futures, and options on these instruments for their own account and (2) owning, sponsoring, or having certain relationships with hedge funds, private equity funds, and other covered funds.
The proposed changes are intended to streamline the rule by eliminating or modifying requirements that are not necessary to effectively implement the statute, without diminishing the safety and soundness of banking entities. In particular, the proposal is intended to further tailor the rule’s compliance requirements based on the size of a firm’s trading assets and liabilities; revise the definition of “trading account” in the rule; clarify the scope of permissible market making, underwriting, and hedging activity; limit the impact of the rule on the foreign activity of foreign banks; and improve the effectiveness of the trading activity reporting requirements. In addition, the notice of proposed rulemaking stated that EGRRCPA amended the Volcker Rule by narrowing the definition of banking entity and by revising the statutory provisions related to the naming of covered funds. These amendments were effective upon enactment. The agencies plan to address these statutory amendments through a separate rulemaking process, and will not enforce the 2013 final rule in a manner inconsistent with EGRRCPA.
5.1.5 Insurance Macro Prudential Initiative The National Association of Insurance Commissioners (NAIC) continued work on its
Macro Prudential Initiative (MPI).The MPI seeks to improve the ability of state insurance regulators and the insurance industry to address macro-prudential risks. It focuses on four areas: liquidity, recovery and resolution, capital stress testing, and exposure concentrations. This past year, regulators, through the NAIC, implemented changes to life insurer reporting that will allow regulators to more quickly and easily identify potential liquidity risks. The NAIC continues to make progress on a liquidity stress testing framework for large life insurers meeting various activities thresholds.
U.S.-EU Covered AgreementOn September 22, 2017, the U.S.-EU Covered Agreement was signed by the Secretary of the Treasury and the U.S. Trade Representative on behalf of the United States and by the Estonian and EU Ambassadors to the United States. on behalf of the EU. A covered agreement is a written bilateral or multilateral agreement regarding prudential measures with respect to the business of insurance or reinsurance.
In conjunction with signing the agreement, the United States released a policy statement that provides additional clarity for the domestic insurance sector on certain terms of the agreement and addresses how the United States intends to implement the agreement. The policy statement states that the agreement “affirms the United States system of insurance regulation, including the role of state insurance regulators as the primary supervisors of the business of insurance” in the U.S., and recognizes the key implementation role that state insurance regulators will play in meeting U.S. obligations under the agreement.
In response to the Covered Agreement, the NAIC anticipates adopting changes to the Credit for Reinsurance Model Law and Credit for Reinsurance Model Regulation. These changes would provide states with a model law and regulation intended to align state law with the Covered Agreement and the U.S. Policy Statement. They would also provide a mechanism intended to offer similar treatment to insurers in other jurisdictions that comply with similar conditions.

97Regu lator y Deve lopments and Counc i l Act i v i t i es
The United States and the EU held the first meeting of the Joint Committee of the U.S.-EU Covered Agreement on March 6, 2018, in Brussels.
NAIC InitiativesThe NAIC continues to develop its group capital calculation, which is an analytical tool designed to give regulators information relating to the capital across an insurance group. Field testing of the group capital calculation is expected to begin by early 2019. Once the field testing is completed, the NAIC expects the results to be used by state regulators to further improve the construction of the calculation. State insurance regulators, through the NAIC, also continue to work on refining other NAIC standards on examination, accounting, actuarial matters, reporting, valuation, and risk-based capital.
The NAIC made enhancements to its cybersecurity examination standards (which are based upon the National Institute of Standards and Technology Cybersecurity Framework) in the NAIC Financial Condition Examiner’s Handbook.
The NAIC continues to work on a modified framework for reserve and capital requirements for variable annuities, which could reduce life insurers’ reliance on captive reinsurers. The changes are expected to be finalized by the summer of 2019, with an effective date of January 1, 2020, and a three-year phase-in period with early adoption permitted.
The NAIC adopted amendments to its Financial Analysis Handbook to finalize the guidance to be used by analysts beginning in March 2018 for conducting more risk-focused prospective solvency assessments in their monitoring of insurers. The NAIC adopted a proposal that finalizes the addition of a new Operational Risk Charge as a “capital add-on requirement” to risk-based capital. In addition, the NAIC adopted an Enterprise Risk Report (Form F) Implementation Guide to assist insurers and state regulators in maximizing the usefulness of the form with its inclusion of best practices for consideration in preparing and reviewing such filings.
Terrorism Risk InsuranceUnder the Terrorism Risk Insurance Program Reauthorization Act of 2015 (TRIPRA), Treasury has been required since 2016 annually to collect terrorism risk insurance information from insurers. This information forms the basis for various reports that Treasury issues under TRIPRA concerning the Terrorism Risk Insurance Program (TRIP). Beginning with the 2018 data call, Treasury and state insurance regulators through the NAIC coordinated and developed a consolidated TRIP data call (with similar information reported to Treasury and to state regulators) to reduce the burden on participating insurers.
In June 2018, Treasury published a Report on the Effectiveness of the TRIP. The report was based in large part on the information submitted by insurers during the 2017 and 2018 TRIP data calls and information submitted by interested parties. In the report, Treasury concluded that TRIP has been effective in making terrorism risk insurance available and affordable in the insurance marketplace and that the market for terrorism risk insurance appears to be relatively stable, with few observable differences in the relevant benchmarks.
International Association of Insurance SupervisorsFIO, the Federal Reserve, and state insurance regulators, along with the NAIC, are the U.S. members of the International Association of Insurance Supervisors (IAIS), the international standard-setting body for supervision of the insurance sector. On December 8, 2017, the IAIS released an interim consultation paper on an activities-based approach to addressing systemic risk. The paper set forth a four-step conceptual approach for the IAIS’s work on developing policy measures related to an activities-based approach. The steps involve identifying the activities that insurers engage in that could potentially threaten global financial stability, evaluating existing IAIS policy measures that may help mitigate the potential systemic risk, identifying risks associated with an activity that are not sufficiently mitigated by an existing policy measure, and developing policy measures or enhancing existing policy measures to address any residual systemic risk.

2 0 1 8 F S O C / / Annual Report98
The U.S. members of the IAIS have participated in IAIS committees and working groups involved in the development of global capital standards that would apply to internationally active insurance groups (IAIGs). This work includes annual iterations of field test exercises that involve the collection and analysis of data from volunteer IAIGs, including some of the largest U.S.-based insurance groups. In 2018, the IAIS continued to develop group capital standards in furtherance of its goal of a single Insurance Capital Standard (ICS). In July 2018, the IAIS released ICS Version 2.0 for public feedback ahead of the monitoring period, which begins in 2020. In 2018, the IAIS also assisted in the collection and analysis of data toward the development of the Aggregation Method, a methodology that leverages the group capital calculation work that is being conducted by U.S. state regulators and the Building Block approach being developed by the Federal Reserve.
In June 2018, the IAIS released the draft Common Framework for the Supervision of IAIGs (ComFrame) for public consultation. The IAIS’s Insurance Core Principles relate to all insurers within a jurisdiction, and ComFrame includes guidance and standards specific to IAIGs.
In 2018, the IAIS continued its work to enhance its systemic risk assessment framework by developing an activities-based approach to assessing potential systemically risky activities and consideration of policy measures to address such activities. In November 2018, the IAIS released the Holistic Framework for Systemic Risk in the Insurance Sector, a consultation paper that proposes to evolve the IAIS’ current approach to assessing and mitigating systemic risk. Among other things, the elements of the Holistic Framework include an enhanced set of policy measures, a global monitoring exercise, supervisory authority to intervene with corrective measures as appropriate, and a mechanism to promote consistent implementation across jurisdictions.
In light of the progress on the Holistic Framework, the FSB announced in November 2018 that it had decided not to engage in an identification of global
systemically important insurers (G-SIIs) in 2018. The FSB stated that once the Holistic Framework is finalized in November 2019, it will reassess the annual identification of G-SIIs in 2020.
5.2 Financial Infrastructure, Markets, and Oversight
5.2.1 Derivatives, SDRs, Regulated Trading Platforms and CCPs
In June 2018, the CFTC issued a final rule amending its regulations relating to access to swap data held by swap data repositories (SDRs). The final rule implements certain provisions of the Fixing America’s Surface Transportation Act of 2015 (the FAST Act), which amended Title VII of the Dodd-Frank Act, and makes associated changes to the CFTC’s regulations governing the grant of access to swap data by SDRs to certain foreign and domestic authorities. This rule provides procedures for such authorities to request access to SDR data consistent with their mandates.
On November 5, 2018, the CFTC proposed amendments to rules relating to SEFs and the trade execution requirement in the Commodity Exchange Act. The amendments are designed to improve the CFTC’s existing swaps regulatory framework and promote more SEF trading and pre-trade price transparency. Under the proposal, a swap subject to the CFTC’s mandatory clearing requirement would generally be required to be executed on a DCM or SEF upon being listed for trading by such a facility. The CFTC also proposed amendments to permit SEFs to offer more variable execution methods for the swaps listed for trading on their platforms. The proposal is intended to reduce regulatory burdens for SEFs and swap market participants.
Widely reported instances of CDS market participants entering into arrangements involving intentional, or “manufactured” credit events in the credit derivatives market raised concerns among traders and regulators regarding the potential impact on the integrity of the market. Staff of the CFTC issued a statement in April 2018 that manufactured credit events may constitute market manipulation and may severely damage the integrity of the CDS markets, including markets for CDS index products, and the financial industry’s

99Regu lator y Deve lopments and Counc i l Act i v i t i es
use of CDS valuations to assess the health of CDS reference entities.
Crisis Management Groups (CMGs) have been established to coordinate resolution planning for two U.S. CCPs that are considered systemically important in more than one jurisdiction, consistent with international standards. The FSB’s Key Attributes of Effective Resolution Regimes for Financial Institutions, and Appendix II-Annex 1 of that document on resolution of financial market infrastructures (FMIs) and FMI participants, provide that the home authority for FMIs that have been determined to be systemically important in more than one jurisdiction should establish a CMG to coordinate resolution planning. Processes for cooperation and sharing information, both during a crisis and for purposes of resolution planning, should be set forth in cooperation arrangements that are specific to the CMG for each FMI. Work remains in finalizing the cooperation arrangements.
As discussed in Section 4.10.5, the provision of client clearing services is concentrated in a relatively small number of bank-affiliated clearing firms. However, in August 2018 the FSB, BCBS, Committee on Payments and Market Infrastructures (CPMI), and International Organization of Securities Commissions (IOSCO) released a report (“Analysis of central clearing interdependencies”) that noted that the concentration of client clearing had decreased compared to a September 2016 analysis. Notwithstanding such fluctuations, this concentration, combined with the consolidation of FCMs, may create difficulties in porting customer positions and margin between FCMs after a default event, particularly in times of market stress. In the event of a default, the ability to port customer positions and margin is contingent on the existence of FCMs that are willing and able to expand their customer clearing business in a time of stress. FCMs need to have sufficient capital to fund this new business, including meeting bank capital requirements as well as incremental contributions to the CCP guarantee funds based on incremental risks cleared. FCMs must also comply with know-your-customer and AML regulations when accepting these new customer positions. If non-defaulting FCMs are unwilling or unable to accept these new
customers, it would be necessary to liquidate the positions of the customers of the defaulting FCM, which could have negative consequences on market participants generally and on the customers of the defaulting FCM specifically, as the liquidations may result in the loss of risk-management protection provided by the cleared derivatives.
In August 2018, the FSB, BCBS, CPMI, and the IOSCO also released a consultative document regarding the effects of financial regulatory reforms on incentives to centrally clear OTC derivatives; this document considers the potential impact of the leverage ratio on clearing incentives, including the possible interaction with client porting in the event of a default. Evidence collected in preparation for the consultative document indicates that some aspects of regulatory reform may not incentivize provision of client clearing services. The reasoning provided is that some regulations aimed at improving institutional resilience may, in some circumstances, be discouraging individual firms from providing client clearing services. The final report was released in November 2018. The BCBS released its own consultative document in October 2018 on potential changes to the leverage ratio’s treatment of client cleared derivatives.
5.2.2 Securities and Asset ManagementIn October 2016, the SEC adopted a rule to enhance liquidity risk management by mutual funds and ETFs, including strengthening the 15 percent limit on illiquid investments, and rule amendments to require enhanced disclosure regarding liquidity and redemption practices. Large entities were initially required to adopt and implement a liquidity risk-management program and to comply with monthly and annual reporting requirements on portfolio liquidity information by December 1, 2018; smaller entities had until June 1, 2019 to comply with these requirements. In February 2018, the SEC postponed the compliance date for open-end funds to classify their portfolio investments as part of Rule 22e-4, which mandates programs for assessing and managing liquidity risks. The postponement gives large funds until June 1, 2019, and small funds until December 1, 2019, to assign their portfolio investments to four buckets ranging from “highly liquid” to “illiquid.”

2 0 1 8 F S O C / / Annual Report100
In June 2018, the SEC amended certain of the liquidity-related disclosure requirements. The amendments replaced a requirement that funds publicly disclose the aggregate percentage of their assets that fall into specified liquidity classifications with a new requirement that funds briefly describe the operation and effectiveness of their liquidity risk-management programs in their shareholder reports. These amendments were designed to provide investors with accessible and useful information about the liquidity risk-management practices of the funds they hold.
In June 2018, the SEC proposed a rule that would replace the SEC’s current approach of issuing individual orders for exemptive relief for ETFs, in order to create a consistent, transparent, and efficient regulatory framework. The ETF market currently operates under more than 300 individually issued exemptive orders that have varied over time in wording and terms.
The SEC is also working on a number of initiatives to improve disclosure for Main Street investors by modernizing the design, delivery, and content of mandated disclosures. First, the SEC issued a request for public comment to gain insight on ways to improve and modernize fund disclosures. Second, the SEC adopted a new rule that creates an optional “notice and access” method for delivering fund shareholder reports. Under new Rule 30e-3, a fund may deliver its shareholder reports by posting them on a website that is free of charge and sending investors multiple notices in paper through the mail letting them know that the report is available either on the website or in paper.
The SEC also proposed a rule to modernize disclosures for variable annuity and variable life insurance products. The proposal would use a layered disclosure approach designed to provide investors with key information related to a contract’s terms, benefits, and risks in a concise and more reader-friendly presentation, with access to more detailed information available online and electronically or in paper format on request.
In July 2018, the SEC adopted new Form ATS-N and amendments to Regulation ATS and Exchange Act
Rule 3a1-1, with the goal of enhancing transparency and oversight of alternative trading systems (ATSs) that trade stocks listed on a national securities exchange. The amendments require certain ATSs to file public disclosure on Form ATS-N to enable market participants to assess potential conflicts of interest and inform market participants about the operation of the ATS, including order types, fees, and the ATS’s execution and priority procedures. The amendments also establish a process for the SEC to review Form ATS-N filings and declare such filings ineffective.
In November 2018, the SEC adopted amendments to facilitate enhanced transparency by broker-dealers to customers regarding the handling of their orders. Upon request of its customer, a broker-dealer must provide specific disclosures related to the routing and execution of the customer’s NMS stock orders submitted on a not-held basis for the prior six months, subject to de minimis exceptions. The Commission also made targeted enhancements to quarterly public disclosures on order routing.
5.2.3 Operational Risks for Technological Systems and Cybersecurity
In April 2018, the Federal Financial Institutions Examination Council (composed of the Federal Reserve, BCFP, FDIC, NCUA, OCC, and the State Liaison Committee) issued a joint statement for financial institutions regarding the role of cyber insurance in risk management of information technology systems. The statement noted that, while cyber insurance is not required by the agencies, cyber insurance may be a component of a broader risk-management strategy that includes identifying, measuring, managing, and monitoring cyber risk exposure. The joint statement further notes that insurance is not a substitute for maintaining sound cybersecurity controls.
5.2.4 Accounting StandardsIn August 2018, the Financial Accounting Standards Board (FASB) issued Accounting Standards Update 2018-12: Targeted Improvements to the Accounting for Long-Duration Contracts (FASB Topic ASC 944, Financial Services—Insurance.). The new guidance will significantly change the measurement and disclosures for many long-duration contracts

101Regu lator y Deve lopments and Counc i l Act i v i t i es
issued by insurers and reinsurers. The changes were intended to provide users of financial statements with more information about insurance liabilities, including the amount, timing and uncertainty of an insurer’s cash flows related to long-duration contracts, and alleviate differences in practice.
Insurers will have to review and update, if necessary, the assumptions they use to measure insurance liabilities at least annually, rather than retain the assumptions made at contract inception over the contract’s life, which can extend for several decades over multiple economic cycles. The guidance also changes how insurers recognize and measure deferred acquisition costs and requires embedded guarantees that meet the definition of market risk benefits to be measured at fair value. In addition, the guidance modifies the discounting of liabilities for future policy benefits, which will be based upon an upper-medium grade fixed income instrument yield and updated each reporting period. The implementation effort will require significant changes to systems, processes, and controls, and will likely require the accumulation of data that has not previously been captured and included in the actuarial models in the format and grouping needed for the measurement.
This change will be effective for public business entities for fiscal years beginning after December 15, 2020; other entities have an additional year to comply. Earlier application is permitted. Due to the required modified retrospective adoption, insurers will need to begin to capture and retain this additional data as early as January 2019.
Financial institutions continue to prepare for the implementation of ASU 2016-13, Financial Instruments-Credit Losses (Topic 326); Measurement of Credit Losses on Financial Instruments, commonly referred to as the current expected credit losses methodology (CECL). Under CECL, collection expectations are updated at each reporting period such that the net amount recognized on the balance sheet represents the amount expected to be collected. The standard also requires consideration of a broader range of supportable information to determine credit loss estimates. The scope includes financial assets, such
as loans, debt securities, reinsurance receivables, and commitments to extend credit. The guidance allows an institution to apply methods that reasonably reflect its expectations of the credit loss estimate. An institution is permitted to revert to historical loss information that is reflective of the contractual term (considering the effect of prepayments) for periods that are beyond the timeframe for which the entity is able to develop reasonable and supportable forecasts of loss. In other words, the allowance model considers events that have not occurred but can be expected in the future. An adjustment to allowance for credit losses will be required when an institution transitions from the current incurred loss methodology to CECL. The effective date for CECL is between 2020 and 2022, depending on the type of entity.
5.3 Mortgages, Consumer Protection, and Community Reinvestment Act
5.3.1 Mortgages and Housing FinanceIn June 2018, the FHFA issued a proposed regulation on capital requirements for the Enterprises. The proposed rule would implement a new framework for risk-based capital requirements and a revised minimum leverage capital requirement for the two entities. The proposed rule builds on the FHFA’s work to develop a Conservatorship Capital Framework that is being used to align the entities’ capital guidelines. The FHFA suspended regulatory capital requirements after placing the Enterprises into conservatorships in September 2008, and the capital requirements in the rule would also be suspended while the two entities remain in conservatorship.
In August 2018, FHFA issued guidance to FHLBs for maintaining sufficient amounts of liquidity to enable FHLBs to provide advances and fund letters of credit for members during a sustained capital markets disruption. FHFA contemporaneously issued a supervisory letter to FHLBs that identified the initial thresholds for the various measures of liquidity described in the guidance. FHFA noted that although the guidance sets expectations for how FHLBs may best measure and maintain sufficient liquidity, the FHLBs should also assess liquidity risk

2 0 1 8 F S O C / / Annual Report102
and use liquidity metrics commensurate with their funds’ management strategies.
5.3.2 Consumer Protection and Community Reinvestment Act
In August 2018, the OCC issued an ANPR to seek public comment on ways to transform or modernize the regulations that implement the CRA.
EGRRCPA includes provisions intended to provide protections for veterans, consumers and homeowners, as well as provisions related to credit reporting. EGRRCPA amends the Fair Credit Reporting Act to increase the length of time a consumer reporting agency must include an initial fraud alert in a consumer’s file. EGRRCPA generally requires a nationwide consumer reporting agency to provide a consumer with free credit freezes, and remove security freezes at a consumer’s request, and provides additional protections for security freezes for minors and incapacitated individuals. In addition, EGRRCPA adds limitations regarding the inclusion of a veteran’s medical debt in a consumer credit report, and establishes a dispute process and verification procedures for veterans with respect to the inclusion of such information.
In July 2017 and April 2018, the BCFP published amendments to the TILA-RESPA Integrated Disclosures (TRID) rule issued by the BCFP in 2013 and which was effective in October 2015. The TRID rule implemented a requirement in the Dodd-Frank Act directing the BCFP to consolidate multiple required closed-end mortgage loan disclosures into a Loan Estimate (provided after loan application) and a Closing Estimate (provided prior to closing). The disclosures are intended to provide borrowers with accurate and understandable information about their loan and closing costs. The 2017 amendment revised and clarified the TRID rule to address industry implementation questions, with a compliance date of October 1, 2018. The 2018 amendment, which was effective on June 1, 2018, modified when mortgage lenders may, with a valid justification, pass on increased closing costs to consumers and disclose them on a Closing Disclosure.
EGRRCPA also amended the Home Mortgage Disclosure Act (HMDA) to provide certain insured
banks and credit unions with a partial exemption from certain new and expanded HMDA data collection and reporting requirements. Specifically, banks and credit unions that originated fewer than 500 closed-end mortgages in each of the two preceding calendar years or fewer than 500 open-end lines of credit in each of the two preceding calendar years are exempted from many of HMDA’s expanded data collection and reporting requirements for that type of transaction, provided they achieve certain CRA compliance ratings. In August 2018, the BCFP issued an interpretive and procedural rule specifying the data points that do not need to be collected and reported if an institution qualifies for a partial exemption. The partial exemptions cover most new data points required by the BCFP’s rulemaking in 2015, which largely implemented the Dodd-Frank Act amendments to HMDA.
In July 2018, the BCFP and the federal banking agencies released statements reminding institutions of their compliance statements issued in December 2017. Based on these statements, for HMDA data collected in 2018 and reported in 2019, the BCFP and the federal banking agencies do not intend to require data resubmission unless data errors are material. Furthermore, they do not intend to assess penalties with respect to data errors. As explained in the statement, any supervisory examinations of 2018 HMDA data will be diagnostic to help institutions identify compliance weaknesses and will credit good-faith compliance efforts.
5.4 Data Scope, Quality, and Accessibility
5.4.1 Data Scope
Securities Financing Data Collection In July 2018, the OFR issued a proposed rule establishing a data collection covering centrally cleared transactions in the U.S. repo market. This proposed collection would require daily reporting by covered central counterparties. The data would be submitted directly to the FRBNY and would be used to enhance the ability of the Council and the OFR to identify and monitor risks to financial stability and to support the calculation of the SOFR and the Broad General Collateral Rate. In October

103Regu lator y Deve lopments and Counc i l Act i v i t i es
2018, the Council approved the sharing of the data to be collected under the rule with the FRBNY.
5.4.2 Data Quality Legal Entity Identifier The LEI is a globally recognized, unique, 20-character, alphanumeric code assigned to a legal entity that registers to receive it. Assigned LEIs are intended to enable the precise identification of counterparties, in order to increase transparency and enable risk oversight. As of November 27, 2018, more than 1.32 million LEIs had been issued by 32 operational issuers that were approved to issue LEIs. Approximately 36 percent of these were issued in the United States, and approximately 13 percent were issued to U.S.-based entities. The total number of LEIs issued represents a 34 percent increase from year-end 2017. The increase has been largely driven by the use of the LEI in derivatives reporting and new mandatory LEI reporting in Europe under the revised Markets in Financial Instruments Directive (MiFID II) and Regulation (MiFIR), which became effective in January 2018. In markets where the use of the LEI is not mandated, issuance has been uneven. Approximately 19 percent of the entities that have obtained LEIs are behind schedule with regard to the annual renewal and verification of their LEI reference data. While this proportion has shrunk over time, Council member agencies and other global financial regulators continue to monitor renewal rates and to participate in other joint efforts to increase the quality of LEI reference data.
Reporting of Derivatives DataDuring the past year, Council members including the CFTC, OFR, SEC, and Federal Reserve Board continued to lead and participate in derivatives data studies conducted by the FSB’s Working Group on UTI and UPI Governance (GUUG) and the CPMI-IOSCO Working Group for the Harmonisation of Key OTC Derivatives Data Elements (Harmonisation Group).
The GUUG’s objectives are to recommend the designation of one or more UPI Service Providers that will manage the issuance of UPIs and provide recommendations for the implementation and governance of a UPI system. In 2018, the GUUG
published its second consultation paper on potential governance arrangements for the UPI and a provider self-assessment questionnaire. The GUUG is targeting the middle of 2019 for the completion of the provider designation process and governance design.
A key development for the Harmonisation Group in 2018 was publication of technical guidance for critical data elements other than the UTI and UPI, and publication of a consultation paper on governance of those data elements. Other key developments for the GUUG included completion of the UTI governance framework and handover of the UTI to the International Organization for Standardization for standards development and implementation.
5.5 Council Activities
5.5.1 Risk Monitoring and Regulatory CoordinationThe Dodd-Frank Act charges the Council with responsibility to identify risks to U.S. financial stability, promote market discipline, and respond to emerging threats to the stability of the U.S. financial system. The Council also has a duty to facilitate information sharing and coordination among member agencies and other federal and state agencies regarding financial services policy and other developments. The Council regularly examines significant market developments and structural issues within the financial system. This risk monitoring process is facilitated by the Council’s Systemic Risk Committee (SRC), whose participants are primarily member agency staff in supervisory, monitoring, examination, and policy roles. The SRC serves as a forum for member agency staff to identify and analyze potential risks, which may extend beyond the jurisdiction of any one agency. The Council’s Regulation and Resolution Committee (RRC) also supports the Council in its duties to identify potential gaps in regulation that could pose risks to U.S. financial stability.
As discussed in Box B, in early 2018, the Council established a digital asset and distributed ledger technology working group. The working group brings together federal financial regulators whose jurisdictions are relevant to the oversight of digital assets and their underlying technologies. The

2 0 1 8 F S O C / / Annual Report104
group seeks to enable the agencies to collaborate regarding these issues, including to promote consistent regulatory approaches and to identify and address potential risks. The working group has also conducted outreach to state regulators and law-enforcement authorities.
5.5.2 Determinations Regarding Nonbank Financial Companies
One of the Council’s statutory authorities is to subject a nonbank financial company to supervision by the Federal Reserve and enhanced prudential standards if the company’s material financial distress—or the nature, scope, size, scale, concentration, interconnectedness, or mix of its activities—could pose a threat to U.S. financial stability. The Dodd-Frank Act sets forth the standard for the Council’s determinations regarding nonbank financial companies and requires the Council to take into account 10 specific considerations and any other risk-related factors that the Council deems appropriate when evaluating those companies.
Under section 113 of the Dodd-Frank Act, the Council is required at least annually to reevaluate each previous determination and rescind any determination if the company no longer meets the statutory standards. The Council’s rule and interpretive guidance and its supplemental procedures with respect to nonbank financial company determinations provide the public with additional information regarding the process for the Council’s determinations and annual reevaluations.
In October 2018, the Council rescinded its previous determination that material financial distress at Prudential could pose a threat to U.S. financial stability and that Prudential shall be subject to supervision by the Federal Reserve and enhanced prudential standards. The Council’s decision to rescind the determination was based on extensive analysis that indicated that there is not a significant risk that the company could pose a threat to financial stability.
As of the date of this report, no nonbank financial companies are subject to a final determination by the Council under section 113 of the Dodd-Frank Act. Since 2010, the Council has voted to advance a
total of four companies to Stage 3 of the Council’s process for evaluating nonbank financial companies and voted not to advance five nonbank financial companies to Stage 3. Since the Council’s last annual report, the Council has not advanced any nonbank financial companies to Stage 3 or made a proposed or final determination regarding any nonbank financial company.
5.5.3 Applications Under Section 117 of the Dodd-Frank Act
Section 117 of the Dodd-Frank Act applies to any entity (or its successor) that was a BHC with assets of at least $50 billion as of January 1, 2010, and participated in the Capital Purchase Program under the Troubled Asset Relief Program. Under section 117, if such an entity ceases to be a BHC, it is automatically treated as if the Council had designated it as a nonbank financial company for Federal Reserve supervision and enhanced prudential standards unless the Council grants an appeal of such treatment. In March 2018, the Council revised its hearing procedures to add hearings conducted under section 117 to the scope of the hearing procedures. In April 2018, the Council received the first application under section 117 from ZB, N.A., a subsidiary of Zions Bancorporation. In July and September 2018, the Council made a proposed and a final decision, respectively, to grant the company’s application.
5.5.4 Operations of the CouncilThe Dodd-Frank Act requires the Council to convene no less than quarterly. The Council held seven meetings in 2018, including at least one each quarter. The meetings bring Council members together to discuss and analyze market developments, potential threats to financial stability, and financial regulatory issues. Although the Council’s work frequently involves confidential supervisory and sensitive information, the Council is committed to conducting its business as openly and transparently as practicable. Consistent with the Council’s transparency policy, the Council opens its meetings to the public whenever possible. The Council held a public session at two of its meetings in 2018. Approximately every two weeks, the Council’s Deputies Committee, which is composed of senior representatives of Council members,

105Regu lator y Deve lopments and Counc i l Act i v i t i es
convenes to discuss the Council’s agenda and to coordinate and oversee the work of the Council’s five other committees. The other committees are the Data Committee; the Financial Market Utilities and Payment, Clearing, and Settlement Activities Committee; the Nonbank Financial Companies Designations Committee; the RRC; and the SRC. The Council adopted its ninth budget in 2018.
The Council also amended its bylaws in 2018 to provide that if a recused voting Council member who is the head of a federal agency delegates his or her voting authority to an officer of that agency who was appointed by the President with the advice and consent of the Senate, or who is the first assistant to the office of the recused Council member for purposes of the Federal Vacancies Reform Act of 1998, the delegate may participate in any Council action to the extent permitted by the Dodd-Frank Act.


107Potent ia l Emerg ing Threats and Vu lne rab i l i t i es
6 Potential Emerging Threats and Vulnerabilities
6.1 Cybersecurity: Vulnerabilities to Attacks on Financial Services
Financial institutions continue to invest in information technology. However, greater reliance on this technology, particularly across a broader array of interconnected platforms, increases the risk that a cybersecurity event could have severe negative consequences for financial institutions.
Cyber vulnerabilities in the financial system include vulnerabilities to malware attacks, ransomware attacks, data breaches, and other events. Such incidents have the potential to impact tens of millions of Americans and result in financial losses of billions of dollars.
A cybersecurity event could threaten the stability of the U.S. financial system through at least three channels:
• The event could disrupt a key financial service or utility. Given the interdependencies of platforms, such a disruption could have a negative cascading effect on the financial sector.
• The event could cause a loss of confidence among a broad set of customers or market participants, which could lead to broad asset sales or withdrawals that have destabilizing effects.
• The event could compromise the integrity of data that is critical to the stable functioning of financial firms and the financial system.
The potential for a destabilizing cybersecurity event is a key financial stability vulnerability.
6.2 Ongoing Structural Vulnerabilities
The Council has identified a number of structural vulnerabilities in the U.S. financial system: concentrations of activities and exposures in CCPs; continued use of reference rates that are not sufficiently derived from observable transactions
and that can be susceptible to manipulation; risk-taking incentives of large, complex, interconnected financial institutions; reliance on less-stable, short-term funding markets; vulnerabilities potentially created by financial innovation; and challenges to data quality, collection, and sharing. These vulnerabilities are described below.
6.2.1 Central CounterpartiesThe potential benefits of CCPs to financial stability include improved transparency, the promotion of enhanced risk management across the financial system, standardized margin methodologies applied to all clearing members, expanded multilateral netting, and strict procedures for the orderly management of counterparty credit losses. However, because CCPs clear a very large volume of transactions, and due to the extent to which they are interconnected with other large and interconnected financial institutions, it is critical that CCPs be robust and resilient.
The goal of robust and resilient CCPs can be accomplished in part through the continued implementation of CCP risk management standards and recovery and orderly wind-down plans. Further analysis of the risk that clearing members may pose to CCPs and that CCPs may pose to the financial network as a whole is appropriate. Regulators also continue to analyze a range of possible risks arising from or related to the potential failure of one or more clearing members, each of which may be a member of multiple CCPs and may provide essential services (such as liquidity provision, settlement, or custody services) to multiple CCPs. This includes analysis of the potential for such failures to transmit stress among financial institutions or markets. Such analysis of the potential to transmit risk across financial institutions and markets will help regulators to better understand interconnections among CCPs, clearing members, and other financial institutions to help ensure the effectiveness of reforms that mandate greater use of central clearing.

2 0 1 8 F S O C / / Annual Report108
Since the introduction of the Principles for Market Infrastructures (PFMI), a document setting forth 24 key international standards related to CCPs and other FMIs, CCPs have made significant progress in the development and implementation of more robust risk management practices. In particular, CCPs have enhanced governance frameworks, introduced more robust stress testing and margin models, and increased financial resources available to cover the default of a clearing member. Additionally, some authorities regularly monitor risk exposures at CCPs pursuant to their regulatory regime. Both the CFTC and SEC maintain active risk surveillance programs of CCPs’ risk management and receive daily or weekly reports of positions, risk measures, margins, collateral, and default resources.
Supervisory stress tests can also be an important contributor to risk management. Supervisory stress tests can, for example, help to shed light on the risks and vulnerabilities related to the potential failure of the largest clearing members at a CCP, including in many cases those with membership in multiple CCPs. Such a failure or failures could have an adverse impact across markets and institutions. The CFTC has taken productive first steps in this area, including conducting the first supervisory stress tests of derivatives CCPs in the United States and publishing reports on findings.
There have also been advances in the development of plans for CCP recovery and resolution. With respect to those CCPs designated as systemically important FMUs by the Council, the CFTC has reviewed and provided guidance on recovery plans of the CCPs it supervises, and the SEC recently approved recovery and orderly wind down plans for the CCPs it supervises. As discussed in Section 5.2.1, CMGs have been established for two U.S. CCPs that are considered systemically important in more than one jurisdiction, consistent with international standards.
Finally, ongoing developments in the swaps market may reduce complexity in that market and the financial system as a whole. Specifically, swaps trade compression, access to swaps data, increased clearing volumes for various products, enhanced operational and liquidity policies and procedures,
and publicly reported monthly cleared margin information (see Sections 4.10.4 and 5.2.1) should help reduce risk and increase transparency.
6.2.2 Reference RatesWhile a number of steps to strengthen LIBOR have been implemented, fundamental issues remain that raise questions regarding LIBOR’s sustainability as an interest rate benchmark. USD LIBOR is used in a large volume and broad range of financial products and contracts (see Box C). The uncertainty surrounding LIBOR’s sustainability may threaten individual financial institutions and the U.S. financial system more broadly. Specifically, without advance preparation, a sudden cessation of such a heavily used reference rate could cause considerable disruptions to, and uncertainties around, the large flows of LIBOR-related payments. It could also impair the functioning of a variety of markets, including business and consumer lending.
As discussed in Box C, to address the need for a robust, sustainable alternative reference rate, a group of U.S. agencies in 2014 convened the ARRC. The ARRC selected the SOFR as an alternative to LIBOR, which since April 2018 has been produced by the FRBNY in conjunction with the OFR. Soon thereafter, SOFR futures were launched, SOFR OIS and basis swaps were introduced, and the ARRC published guiding principles and public consultations on contract fallback language. This is important progress to reduce the risks associated with reliance on LIBOR.
The transition away from LIBOR will be challenging, and important risks remain. If participants do not make adequate preparations in time for LIBOR’s cessation, it could lead to a disorderly exit from contracts. Differences in contractual fallback language or other preparations across participants and contract types could introduce pricing mismatches or other problems. The Council recommends that member agencies work closely with market participants to identify and mitigate risks from potential dislocations during the transition process.

109Potent ia l Emerg ing Threats and Vu lne rab i l i t i es
Box C: The Transition to Alternative Reference Rates
LIBOR is the most widely used interest rate benchmark in the world. It is meant to reflect the cost at which large, globally active banks can borrow on an unsecured basis in wholesale markets, which include borrowing from other banks as well as using CP or uninsured certificates of deposit. It is a composite rate, produced by the ICE Benchmark Administration, based on rates submitted by a panel of banks. LIBOR is generally produced daily across five currencies and seven maturities. USD LIBOR has become the dominant USD reference rate. According to the second report of the ARRC, as of year-end 2016, LIBOR was used as a reference rate for more than $200 trillion in notional amount of financial contracts in the cash and derivatives markets.
While LIBOR is still widely used, its reliability is in doubt, and it may not be available after 2021. LIBOR is increasingly based on the expert judgment of panel banks, rather than actual transactions, due to the declining amount of unsecured, wholesale borrowings by banks since the financial crisis. The scarcity of underlying transactions makes LIBOR potentially unsustainable, as many banks have grown uncomfortable with providing submissions based on such expert judgment and may eventually choose to stop submitting altogether. Since 2016, two banks have stopped submitting USD LIBOR. The chief of the UK Financial Conduct Authority (FCA), which regulates LIBOR, said in 2017 that the FCA would not persuade or compel panel banks to make LIBOR submissions after 2021. As a consequence, it is unclear if LIBOR will exist after that time.
To address the need for an orderly transition to a robust alternative rate, the Federal Reserve and the FRBNY, in cooperation with Treasury, the CFTC, and the OFR, convened the ARRC. The ARRC brought together private market participants to identify a set of alternative reference rates that are more firmly based on transactions from a robust underlying market. The ARRC was reconstituted in 2018 to include a broader set of market participants and regulatory agencies. The ARRC now includes participants in the markets
for floating-rate notes, business loans, securitizations, mortgages, and consumer loans.
The ARRC selected SOFR as its recommended alternative to LIBOR. SOFR is a fully transactions-based rate that will have the widest coverage of any Treasury repo rate available. It has been published on a daily basis by the FRBNY since April 3, 2018. Because of its range of coverage, the ARRC considers SOFR to be a good representation of the general funding conditions in the overnight Treasury repo market. As such, it reflects an economic cost of lending and borrowing relevant to a wide array of market participants in these markets, including broker-dealers, MMFs, asset managers, insurance companies, securities lenders, and pension funds.
Following the commencement of the publication of SOFR in April 2018, SOFR futures were launched in May, at 1-month and 3-month tenors. In July, SOFR OIS and basis swaps began clearing. Meanwhile, the ARRC has also established principles for fallback language in certain contracts and released public consultations on such language, to facilitate an orderly transition from LIBOR.
SOFR is fundamentally different from LIBOR, and a transition to SOFR has challenges. SOFR is an overnight, secured, nearly risk-free rate, while LIBOR is an unsecured rate published at several tenors. Because LIBOR is unsecured and therefore includes an element of bank credit risk, it is likely to be higher than SOFR and prone to widen when there is severe credit market stress. In contrast, because SOFR is secured and nearly risk-free, it is expected to be lower than LIBOR on average and behave differently in periods of stress. Contracts linked to LIBOR are vast in number and value, and they have diverse parties, procedures for amendments, and fallback language to transition to an alternate reference rate. Adding economically appropriate fallback language to LIBOR-linked contracts is necessary, but it will be challenging to coordinate, and the contractual provisions may not be consistent across these diverse products.
2 0 1 8 F S O C / / Annual Report110
6.2.3 Large, Complex, Interconnected Financial Institutions
In part due to implementation of the Dodd-Frank Act and other financial regulatory reforms, large BHCs are significantly better capitalized today and hold significantly more HQLA than they did before the financial crisis (see Section 4.11.1). In addition, the largest BHCs that operate in the United States are subject to both company-run and supervisory stress testing, and periodically submit resolution plans to the Federal Reserve and FDIC (see Sections 5.1.2 and 5.1.3). Alongside these increases in resilience, market-based measures indicate low risk of distress or failure in the largest U.S. BHCs (see Section 4.11.1).
Nonetheless, the Council remains vigilant about the potential threats such institutions may pose to financial stability, given their importance to the U.S. financial system.
6.2.4 Short-Term Wholesale Funding Repo MarketsAlthough progress has been made in recent years in reducing counterparty risk exposure in repo markets, the risk of fire sales of collateral by creditors of a defaulted broker-dealer remains.
Concentration risk has increased in the tri-party repo market, as just one institution became effectively responsible for all clearing of that important market segment. This increases the financial stability risks that would be associated with distress at that institution. Even a temporary service disruption, such as an operational failure, could impair the market, as participants may not have a ready alternative platform to clear and settle these transactions.
A better understanding is needed of the interdependencies among firms and market participants, particularly in the bilateral repo market, where more information would help regulators and supervisors better assess potential risks and vulnerabilities. To this end, in 2018 the OFR proposed a permanent collection of data on centrally cleared repo transactions (see Section 5.4.1). The proposed collection would allow monitoring of an important segment of the centrally cleared repo
market, as well as enhancing the calculation of more robust reference rates to replace LIBOR.
MMFs and Other Cash Management VehiclesMMFs and other cash management vehicles that offer a stable NAV can be subject to runs, which could disrupt short-term funding markets more broadly and have other adverse effects on related markets and firms. The MMF reforms implemented by the SEC in October 2016 represent an important development in addressing this risk. However, while the adoption of a floating NAV likely reduced the risk of runs and related disruptions in short-term lending markets, the extent of that reduction is not clear.
Other types of cash management vehicles also invest in private assets and offer a stable NAV, but were not subject to the SEC reforms. This includes certain short-term investment funds, local government investment pools, and private liquidity funds. There has been no large migration of investments into these other vehicles since the SEC reforms, but it is possible that they will see greater inflows if short-term U.S. interest rates continue to increase, as expected by market participants. Even at their current size, runs on these vehicles in a stress scenario might amplify or transmit risks to the broader financial system.
In the current market and regulatory environment, some institutions may attempt to distinguish themselves by using new strategies that could increase credit, interest rate, or liquidity risks. More generally, regulations may have unintended consequences, and market participants and regulators should be alert to the emergence of new, unanticipated risks.
6.2.5 Financial InnovationInnovation is a regular feature of the financial services industry, and it has been particularly important in the post-crisis period.
Financial innovations in the last 10 years have offered considerable benefits to consumers and providers of financial services, including reducing the cost of certain financial services, increasing the convenience of payments, and potentially increasing the availability of credit. Innovation can also create

111Potent ia l Emerg ing Threats and Vu lne rab i l i t i es
new risks that are not visible or well understood, and it can undermine financial regulation if it fosters financial activities in areas that are not subject to appropriate regulation.
Significant developments in the use of digital assets and peer-to-peer payments have been enabled by advances in technology and digitization of the economy. As discussed in Section 4.14.1 and Box B, the market value and use of digital assets has grown rapidly in recent years, including through innovations such as ICOs. While digital assets do not presently appear to pose a risk to financial stability, they do pose other financial risks, including facilitating cybercrime, fraud, extortion, drug trafficking, money laundering, and tax evasion. This makes regulatory vigilance and coordination critically important. In late 2017, the Council formed a working group on digital assets to facilitate coordination among U.S. financial regulators regarding these markets.
Marketplace lending and peer-to-peer payments are two recent technology-enabled innovations of growing importance, as discussed in Sections 4.14.2 and 4.14.3. By offering an additional source of loans to households and small businesses—one that may incorporate new underwriting methods—marketplace lenders have the potential to increase the overall availability of credit. However, the limited history of marketplace lending makes it difficult to determine whether their risk assessment and risk management practices are adequate to manage a broad credit downturn. Some of these lenders rely on funding models and institutional relationships that have not been tested in a period of significant stress.
As discussed in Section 4.14.4, large technology companies providing financial services may increasingly seek to compete directly with incumbent financial service providers, and their market presence could grow significantly. As such firms may not be subject to many types of financial services regulation, this may leave a significant part of the financial system without appropriate standards and oversight.
The rapid adoption of fintech innovations in recent years may increase operational risks in financial firms’ use of third-party service providers. Market concentration among third-party service providers can create financial stability risks, because operational failures or faults at one key provider could disrupt the activities of multiple important financial institutions or financial markets.
6.2.6 Data Gaps and Challenges to Data Quality, Collection, and Sharing
The financial crisis exposed gaps and deficiencies in the quality of data required for effective regulatory oversight of the financial system. These data gaps included the structure and ownership of financial entities, the identification of OTC derivatives, and jurisdictional differences in regulatory reporting requirements. These types of inconsistencies also create challenges for data sharing and increase reporting burden.
The need to close data gaps is critical. To help achieve this goal, Council member agencies have been actively engaged with the FSB and CPMI-IOSCO to develop and implement the UTI, UPI, and other critical data elements for OTC derivatives. Staff of the OFR, CFTC, SEC, and Federal Reserve Board met regularly in 2018 with their international regulatory counterparts from the FSB to implement these identifiers for OTC derivatives, and are now developing a governance structure for oversight.
In their third status report released in September 2018, the FSB and IMF noted that considerable progress has been made by the FSB and CPMI-IOSCO on the G20’s Data Gaps Initiative to implement the agreed actions and reduce data gaps in the OTC derivatives market. This included delivering technical guidance on the UPI and on harmonization of critical OTC derivatives data elements other than UTI and UPI.

2 0 1 8 F S O C / / Annual Report112
6.3 Managing Vulnerabilities amid Prolonged Credit Expansion
After contracting sharply from 2008 to 2011, the level of total borrowing by the private nonfinancial sector has risen for seven years. The increase in borrowing has been particularly strong in the nonfinancial business sector, outpacing the rise in nominal GDP and pushing the ratio of nonfinancial corporate debt-to-GDP to a historical peak. As discussed in Section 4.3, key metrics also show that nonfinancial business leverage is at the upper end of historical ranges, increasing the risk of default. While strong interest coverage and liquidity positions have allowed businesses to service this debt with low delinquency rates, these factors may not prevent a wave of defaults in the event of a recession or a similarly large shock to business earnings. Any impact on financial stability will depend on the extent and severity of business defaults, whether there are spillovers to other markets, and the ability of investors and intermediaries to manage the fallout.
A sharp downturn in the corporate credit cycle could also be accompanied by broad-based declines in asset prices. Elevated valuations in U.S. equity, corporate bond, and certain residential and commercial real estate markets (see Sections 4.3, 4.5, and 4.7) could make them susceptible to larger price declines in the next major correction. Such market losses alone do not cause financial instability; rather, they can contribute to financial instability when they are amplified or transmitted by factors such as leverage, liquidity transformation, complexity, or interconnections. To the extent that these factors are enduring features of the financial system, there is the potential for asset price corrections in these markets to impact financial stability.
6.4 Changes in Financial Market Structure and Implications for Financial Stability
Market making and liquidity provision are now undertaken by a wide variety of market participants, including broker-dealers—historical providers of such services—as well as asset managers, proprietary trading firms, and hedge funds.
The increased use of electronic trading platforms has allowed for growth in both algorithmic and high-frequency trading practices, which have been adopted by many liquidity providers and liquidity takers. These developments have benefited market participants through lower transaction costs, increased market efficiency, and fewer manual errors. However, these developments may also create new risks and vulnerabilities in markets where electronic trading is prevalent.
In recent years, there has been increased regulatory focus on the risks from both the faster speed of trades as well as the complexity of trading algorithms, as these can lead to operational risks that may be hard to predict or manage. There has also been heightened concern about so-called “flash events,” in which various markets have experienced sharp price moves, often with swift reversals. While some of these events have occurred in smaller markets or during illiquid trading hours, others have affected some of the largest markets in the world. Studies of events such as the Joint Staff Report on the U.S. Treasury Market on October 15, 2014, have not identified any single cause, but instead point to a confluence of factors. The February 5, 2018, event, in which a decline in the S&P 500 was amplified by investment products linked to equity-market volatility, is discussed in Box D. When extreme, these events may also lead to disruptions in highly correlated markets. Such possible transmission across markets highlights the possibility that flash events could contribute to financial instability.
In the Treasury securities market, the emergence of automated trading across multiple venues and new types of market participants—known as principal trading firms (PTFs)—raise questions as to whether clearance and settlement practices in the secondary market have evolved to address potential risks associated with this changing market structure. One area of potential risk is less-robust and less-transparent risk-mitigation practices for bilaterally cleared trades, which constitute the majority of transactions in the secondary markets for Treasury securities. Interdealer brokers, market participants that generally conduct trading in the dealer-to-dealer segment of the Treasury securities

113Potent ia l Emerg ing Threats and Vu lne rab i l i t i es
market, also raise potential risks, as their role and associated risks are not well understood by all market participants.
These changes in market structure have been accompanied by a substantial shift towards automating the investment process. Asset managers, hedge funds, banks, and others are increasing their use of artificial intelligence, machine learning, and other advanced analytical tools to make investment decisions. These developments add complexity to the markets and can be a source of operational risk. For example, swift and automated trading algorithms spanning both traditional and non-traditional information sources could raise the risk of inaccurate information impacting price discovery.
Given the changes in market structure described above, liquidity provision during times of stress may differ now from historical norms in ways that are hard to anticipate. Where market-making was once the purview of broker-dealers, in an increasing number of products this role can be taken on by smaller institutions that make significant use of automated technology. With trading speeds increasing and practices becoming more automated, liquidity provision can also change quickly. This can create challenges for market participants that are not prepared for the level and speed of liquidity changes, and may result in mismatches between liquidity supply and demand. In many markets, investment strategies have evolved in response to these structural changes. Buy-side firms and high-frequency traders have increased real-time monitoring of liquidity conditions and developed algorithms designed to minimize price impact. These innovations attempt to match trading needs with the environment that arises with market automation.

114 2 0 1 8 F S O C / / Annual Report
On February 5, 2018, the CBOE Volatility Index—known as the VIX index, a measure of option-implied volatility for the S&P 500—rose by 20 points, representing the index’s largest ever one-day increase (Chart D.1). On this day, the S&P 500 declined by around 4 percent and 10-year Treasury yields moved lower by as much as 15 basis points. Attention has been focused on the magnitude of the spike in equity volatility. While a variety of causes were cited, an important amplifying factor was the activity of ETPs linked to the VIX (VIX ETPs). These investment vehicles became increasingly popular in the months before February (Chart D.2).
For most of January 2018, the equity market appreciated strongly—the S&P 500 gained 6.6 percent from January 2 to January 26. In the final days of January, the market began to decline. In the week before the February 5 events, the S&P 500 sold off 3.9 percent and the VIX increased by 6 points.
On the afternoon of February 5, equity volatility continued to rise, with a VIX spike occurring late in the trading session, apparently driven significantly by VIX ETP behavior. When the VIX futures index rises during a trading session, both inverse and leveraged long VIX ETP issuers must buy VIX futures in order to maintain their target exposure. This buying typically occurs as close as possible to the day’s close of futures markets. On the afternoon of February 5, VIX ETPs overwhelmed trading in VIX futures markets, accounting for an unusually large share of the open interest in the first two VIX futures contracts.
Some dealers that were intermediating the increased VIX futures transactions hedged their new positions by selling equity futures. This caused the VIX futures dynamics to spill over into the equity market, amplifying the sell-off.
The effect of the VIX ETPs on February 5 was partly due to their rapid growth in 2017 and early 2018, as short-VIX products profited from the declines in volatility. Notably, by early 2018 the net position across VIX ETPs was short VIX; that is, the buyer
would profit from a decrease in the VIX. Following the February 5 event, VIX ETPs fell sharply in size, and their net position became long VIX (Chart D.2).
The February 5 event illustrated how evolutions in investment products can create new sources of risk, including as a result of the feedback of stress between the markets for those investment products and the securities or derivatives markets. Although this event did not impair financial stability, it underscores the importance of regulators and market participants evaluating these events to enhance their understanding of the potential for such feedback dynamics to transmit or amplify stress.
Box D: U.S. Equity Volatility Event on February 5, 2018
0
1
2
3
4
5
0
1
2
3
4
5
Jan:17 Mar:17 Jun:17 Sep:17 Dec:17 Mar:18 Jun:18 Sep:18
VelocityShares Daily Inverse VIX Short Term ETN (XIV)VelocityShares Daily Inverse VIX Medium Term ETN (ZIV)ProShares Short VIX Short-Term Futures (SVXY)
D.2 Total Assets of Inverse VIX ETPsBillions US$ Billions US$
Source: Bloomberg, L.P.
As Of: 31-Oct-2018
D.2 Total Assets of Inverse VIX ETPs
2100
2250
2400
2550
2700
2850
3000
5
10
15
20
25
30
35
40
45
Jan:17 May:17 Sep:17 Jan:18 May:18 Sep:18
VIX Index (left axis)S&P 500 Index (right axis)
D.1 VIX and S&P 500 IndicesPoints Points
Source: Bloomberg, L.P.
As Of: 31-Oct-2018
D.1 VIX and S&P 500 Indices

115Potent ia l Emerg ing Threats and Vu lne rab i l i t i es
6.5 Asset Management Products and Activities
The U.S. asset management industry is a critical component of the financial system and economy. Its importance has grown in the post-crisis period, accounting for an increasingly large share of U.S. investments and financial market activity. Asset management industry growth has been driven by asset price appreciation, strong demand from U.S. households, the aging of the U.S. population, and the rise of defined contribution retirement plans.
Over the last several years, the SEC has assessed potential threats and vulnerabilities in the asset management industry in the areas of liquidity and redemption risk and in the use of leverage. In October 2016, the SEC adopted rules to enhance liquidity risk management by mutual funds and ETFs; the SEC also adopted rules allowing mutual funds to adopt swing pricing to pass on transaction costs to entering and exiting investors. As discussed in Section 5.2.2, in June 2018 the SEC adopted a final rule that requires open-end funds to disclose information about their liquidity risk-management programs in their reports to shareholders. In addition, the SEC amended Form N-PORT to enhance the portfolio liquidity information that the funds report to the SEC. That new information required of funds will improve the ability to monitor liquidity risk in this important part of the asset management industry. The SEC is also considering re-proposing a new rule designed to enhance the regulation of the use of derivatives by registered investment companies.
6.6 Global Economic and Financial Developments
Since the Council’s last annual report, economic and financial risks have persisted or intensified in the UK, the euro area, China, and other emerging markets. Such foreign risks could impact U.S. financial stability through direct financial exposures or effects on economic and financial confidence.
The risk of a no-deal UK exit from the EU in March 2019 has increased (see Box E). A no-deal Brexit could create risks that may have immediate and
significant spillover effects into the United States. Such risks include an interruption in financial contracts; undermined financial relationships and potential reversals of cross-border financial flows; interruptions to EU27 firms’ access to UK derivatives CCPs; disruptions in international trade and cross-border financial activities; and a deterioration in economic and financial confidence.
While the euro area economy continues to recover from the global financial and European sovereign debt crises, the euro area financial system faces longer-term structural vulnerabilities. Public debt burdens remain high in a number of euro area economies, leaving fiscal agencies and financial institutions vulnerable to sudden shifts in investor sentiment. This risk was highlighted by the recent stress in Italian bond markets, which was triggered by concerns regarding the trajectory of Italy’s debt burden (see Section 4.2.1). While euro area bank profitability and asset quality have broadly improved, some euro area financial institutions face continued questions about their viability amid prolonged underperformance. Additionally, certain euro area banks have meaningful exposures to emerging markets such as Turkey, and are thus vulnerable to direct spillovers from EMEs.
After a rapid increase in debt and leverage following the global financial crisis, Chinese authorities have taken steps to encourage financial deleveraging, leading to a slowdown in the rate of credit growth in recent years. However, in the second half of 2018 Chinese policymakers began loosening monetary instruments in light of weaker economic data. Meanwhile, concerns are increasing that trade tensions could impact Chinese growth and, in a severe case, the broader Chinese financial system. While China has sufficient fiscal space to moderate a slowdown in economic growth, a sharp slowdown or financial stress could have adverse consequences for closely connected EMEs and for Chinese financial institutions. Potential direct spillovers to the U.S. financial system appear to be manageable, but indirect effects on global economic and market confidence could materially impact U.S. economic growth.

2 0 1 8 F S O C / / Annual Report116
Risks in EMEs are increasing, and recent tightening in dollar liquidity has left economies with large current account balances vulnerable to sudden shifts in investor sentiment (see Section 4.2.2). Spillovers from stress in Argentine and Turkish markets to the U.S. financial system have been limited, as U.S. financial institutions do not have significant direct exposures to these economies. Additionally, spillovers to other emerging markets have been moderate, but they could intensify if conditions in Argentina or Turkey deteriorate.
The Council will continue to monitor and assess these developments and other potential emerging risks to financial stability.

117Potent ia l Emerg ing Threats and Vu lne rab i l i t i es
The UK voted in a 2016 referendum to leave the EU. The UK’s formal withdrawal from the EU—commonly known as “Brexit”—is scheduled for March 29, 2019. An orderly Brexit would require that UK and EU authorities ratify a withdrawal agreement before then. Negotiators for the UK and EU have concluded a draft withdrawal agreement, but that agreement is still subject to final approval by the UK and EU parliaments. If both sides approve in a timely manner, the UK exit would be subject to a transition period, during which the UK would retain full access to the EU single market and customs union while it negotiates the terms of its future relationship with the EU.
If a withdrawal agreement is not approved by March 29, the result could be a no-deal Brexit, which could be disorderly. As discussed in Section 6.6, a no-deal Brexit could create a number of risks to financial stability, including: an interruption in financial contracts; undermined financial relationships and potential reversals of cross-border financial flows; interruptions to remaining EU firms’ access to UK derivatives CCPs; disruptions in international trade and cross-border financial activities; and a deterioration in economic and financial confidence. A no-deal Brexit could have immediate and significant spillover effects into the United States, both through direct channels, such as exposures of financial markets and institutions, and potential indirect effects. The following are some of the issues associated with Brexit that could pose risks to financial stability.
Potential Effects on U.S. Financial InstitutionsMany U.S. financial institutions have significant exposures to the EU, suggesting that disruptions to EU markets in a no-deal Brexit could affect those institutions. U.S. G-SIBs with material UK exposures are implementing business continuity plans and executing on long-term changes to their operations assuming they may lose the ability to provide financial services from the UK to remaining EU and European Economic Area (EEA) customers. In the most severe scenario, liability holders could pull back from UK
financial institutions or foreign institutions with large exposures to the UK.
Potential Effects on Cross-Border Trade and Financial ServicesIn a no-deal Brexit scenario, the UK would likely lose its current access to the EU’s single market. Absent a transition period or other policy action, UK-domiciled financial services firms would no longer have passporting rights and would need to be separately authorized by applicable EU member states, raising contract continuity concerns for a substantial value and volume of financial contracts.
Potential Effects on Derivatives London is one of the key service centers for global derivatives markets. U.S. banks and financial institutions, which account for 40 to 60 percent of activity in global derivative markets, use London as a platform to service non-UK clients in the EU. A no-deal Brexit, in which UK firms immediately lose access to the EU market, could create significant risks to the cohesion and continuity of financial markets, particularly derivatives markets.
Without a transition period or other official action to a similar effect, UK-based firms will be unable to continue to service certain cross-border contracts that were entered into before Brexit, particularly those that contemplate the ongoing provision of financial services or other activities previously governed by EU rules. This problem is particularly acute in the area of centrally cleared derivatives, where EU authorization (in the form of recognition by European Securities Markets Authority, ESMA) of UK-located CCPs is required. The UK has given assurances for a temporary permissions regime for CCPs in the event that a timely agreement is not ratified. In November 2018, the European Commission (EC) announced it will consider a temporary, conditional equivalence decision to allow UK CCPs to continue to service EU firms and apply for recognition by ESMA. Notwithstanding these potential temporary
Box E: Risks Associated with United Kingdom Exit from the European Union

118 2 0 1 8 F S O C / / Annual Report
permissions, the long-term ability of EU firms to execute the requisite long-term changes to their operations and to access UK CCPs remains uncertain.
In the event that derivatives CCPs based in the UK lose authorization to provide clearing services to the EU, they may be forced to disassociate with non-UK EU (EU27) firms. Those EU27 firms could need to move their clearing activity away from the UK before a final Brexit date. In that regard, EU27 firms would need to find alternative products that in many cases are not available in EU27 countries, such as certain interest rate derivatives that are denominated in currencies available at UK CCPs, Brent crude oil, and various precious and industrial metals. The abrupt transfer of hundreds of thousands of swap positions across CCPs over a short period could be the source of significant risk. Such action could result in fire sales and significant write-downs by EU27 firms as they rush to dispose of open CCP positions.
With respect to non-centrally cleared derivatives, there could be constraints on UK and EU firms’ ability to perform certain life-cycle events or amend existing contracts in the time remaining before Brexit. Existing swap contracts may need to be amended as a result of Brexit, potentially subjecting them to several new swap regulations. ESMA has prepared draft regulatory technical standards that would provide a 12-month exemption from the EU clearing obligation and certain EU bilateral margin requirements, in order to facilitate the novation of non-centrally cleared derivatives contracts between UK and EU parties in the event of a no-deal Brexit.
Potential Effects on Insurance ContractsInsurers and reinsurers in the UK are taking steps to maximize their ability to meet contractual obligations and undertake new business in the EU under any UK withdrawal scenario. These measures include establishing new entities in EU member states to conduct business within the EEA after Brexit. Officials from Treasury and the Office of the U.S. Trade Representative are discussing with UK counterparts a bilateral “covered agreement” with the goal of
maintaining market continuity for both sides regarding the obligations and benefits arising under the Bilateral Agreement Between the United States of America and the European Union On Prudential Measures Regarding Insurance and Reinsurance, signed by the United States and EU in September 2017.
Equivalence Considerations Once the UK is no longer subject to EU law—either after a disorderly Brexit scenario or after the implementation period in an orderly Brexit scenario—UK firms will need to receive EU authorization to supply their services to customers in the EEA. This will require that the EC deem the UK an equivalent jurisdiction for the provision of particular services and grant recognition to individual firms in some cases. These are unilateral determinations of the EC and can be withdrawn with limited notice.
The equivalence and recognition framework does not apply to all financial services, however. Even if authorizations are approved in all cases for UK firms, the framework would not replicate the access that UK firms currently have to the EU single market or the access that EU customers currently have to the full range of UK financial services. The UK has proposed an enhanced equivalence regime that would allow for a higher degree of market access as compared to the standard equivalence regime. The political declaration for the future relationship between the UK and the EU, published on November 25, 2018, indicates that both sides have agreed to provide greater transparency with regard to the adoption and withdrawal of equivalence decisions. However, the political declaration does not suggest that the EU has agreed to the UK’s proposal on providing market access beyond the EU’s standard equivalence regime.
Brexit has prompted the EU to reconsider the treatment of all third-country entities, not just UK firms. Proposed EU legislation on the treatment of third-country CCPs, for example, could increase the regulatory burden on U.S. entities and produce market fragmentation, if finalized.
Box E: Risks Associated with United Kingdom Exit from the European Union (continued)

Abbrev ia t ions 119
ABS Asset-Backed Security
ACIS Agency Credit Insurance Structure
AIS Automated Indicator Sharing
AML Anti-Money Laundering
ANPR Advance Notice of Proposed Rulemaking
ARRC Alternative Reference Rates Committee
AUM Assets Under Management
BCBS Basel Committee on Bank Supervision
BCFP Bureau of Consumer Financial Protection
BHC Bank Holding Company
BIS Bank for International Settlements
BoE Bank of England
BoJ Bank of Japan
CAPE Cyclically-Adjusted Price-to-Earnings
C&I Commercial and Industrial
CAS Connecticut Avenue Securities
CBO Congressional Budget Office
CCAR Comprehensive Capital Analysis and Review
CCP Central Counterparty
CDS Credit Default Swap
CECL Current Expected Credit Losses
CET1 Common Equity Tier 1
CFTC Commodity Futures Trading Commission
CIRT Credit Insurance Risk Transfer
CLO Collateralized Loan Obligation
Abbreviations

2 0 1 8 F S O C / / Annual Report120
CMBS Commercial Mortgage-Backed Security
CME .CME Group Inc
CMG Crisis Management Group
ComFrame Common Framework for the Supervision of Internationally Active Insurance Groups
Council Financial Stability Oversight Council
CP Commercial Paper
CPI Consumer Price Index
CPMI Committee on Payments and Market Infrastructures
CRA Community Reinvestment Act
CRE Commercial Real Estate
CSBS Conference of State Bank Supervisors
CSP Common Securitization Platform
CSS Common Securitization Solutions
DCM Designated Contract Market
DFAST Dodd-Frank Act Stress Tests
DHS Department of Homeland Security
Dodd-Frank Act Dodd-Frank Wall Street Reform and Consumer Protection Act
DVP Delivery-versus-Payment
EBITDA Earnings Before Interest, Taxes, Depreciation, and Amortization
EC European Commission
ECB European Central Bank
EEA European Economic Area
EGRRCPA Economic Growth, Regulatory Relief, and Consumer Protection Act
EME Emerging Market Economy
ENN Entity-Netted Notional
Enterprises Fannie Mae and Freddie Mac
ESM European Stability Mechanism
ESMA European Securities and Markets Authority

Abbrev ia t ions 121
ETF Exchange-Traded Fund
ETN Exchange-Traded Note
ETP Exchange-Traded Product
EU European Union
FASB Financial Accounting Standards Board
FAST Act Fixing America’s Surface Transportation Act of 2015
FBIIC Financial and Banking Information Infrastructure Committee
FBO Foreign Banking Organization
FCA Financial Conduct Authority
FCM Futures Commission Merchant
FDIC Federal Deposit Insurance Corporation
FederalReserve
Board of Governors of the Federal Reserve System
FHA Federal Housing Administration
FHFA Federal Housing Finance Agency
FHLB Federal Home Loan Bank
FICC Fixed Income Clearing Corporation
FICO Fair Isaac Corporation
FIO Federal Insurance Office
FMI Financial Market Infrastructure
FMU Financial Market Utility
FOMC Federal Open Market Committee
FRA Forward Rate Agreements
FRBNY Federal Reserve Bank of New York
FSB Financial Stability Board
FS-ISAC Financial Services Information Sharing and Analysis Center
FSOC Financial Stability Oversight Council
FSSCC Financial Services Sector Coordinating Council

2 0 1 8 F S O C / / Annual Report122
FX Foreign Exchange
G-SIB Global Systemically Important Bank
G7 Group of 7
G20 Group of 20
GAV Gross Asset Value
GCF General Collateral Finance
GDP Gross Domestic Product
GSE Government-Sponsored Enterprise
GUUG FSB’s Working Group on UTI and UPI Governance
HarmonisationGroup
CPMI-IOSCO Working Group for the Harmonisation of Key OTC Derivatives Data Elements
HFR Hedge Fund Research
HMDA Home Mortgage Disclosure Act
HQLA High-Quality Liquid Asset
HTM Held-to-Maturity
HY High-Yield
IAIG Internationally Active Insurance Group
IAIS International Association of Insurance Supervisors
ICC ICE Clear Credit
ICE Intercontinental Exchange
ICEU ICE Clear Europe
ICO Initial Coin Offering
ICI Investment Company Institute
ICS Insurance Capital Standard
ICUS ICE Clear U.S
IG Investment Grade
IHC Intermediate Holding Company
IMF International Monetary Fund

Abbrev ia t ions 123
IOSCO International Organization of Securities Commissions
IRA Individual Retirement Account
ISDA International Swaps and Derivatives Association
LBO Leveraged Buyout
LCH Ltd. LCH Clearnet Ltd.
LCR Liquidity Coverage Ratio
LEI Legal Entity Identifier
LIBOR London Interbank Offered Rate
MBS Mortgage-Backed Security
MMF Money Market Mutual Fund
MOVE Merrill Lynch Option Volatility Estimate
MPI Macro Prudential Initiative
MSR Mortgage Servicing Right
NAIC National Association of Insurance Commissioners
NAV Net Asset Value
NCUA National Credit Union Administration
NIM Net Interest Margin
NIST National Institute of Standards and Technology
NMLS Nationwide Multistate Licensing System
OCC Office of the Comptroller of the Currency
OFR Office of Financial Research
OIS Overnight Indexed Swap
ON RRP Overnight Reverse Repurchase Agreement
OPEC Organization of Petroleum Exporting Countries
OTC Over-the-Counter
P/B Price-to-Book
P&C Property and Casualty
P/E Price-to-Earnings

2 0 1 8 F S O C / / Annual Report124
PBGC Pension Benefit Guaranty Corporation
PBOC People’s Bank of China
PFMI Principles for Financial Market Infrastructures
PROMESA Puerto Rico Oversight, Management, and Economic Stability Act
Prudential Prudential Financial, Inc
PTF Principal Trading Firm
QFC Qualified Financial Contract
REIT Real Estate Investment Trust
Repo Repurchase Agreement
RMB Chinese Renminbi
RMBS Residential Mortgage-Backed Security
ROA Return on Assets
ROE Return on Equity
RRC Regulation and Resolution Committee
RWA Risk-Weighted Asset
S&P Standard & Poor’s
SCCL Single-Counterparty Credit Limits
SEC Securities and Exchange Commission
SEF Swap Execution Facility
SIFMA Securities Industry and Financial Markets Association
SLR Supplementary Leverage Ratio
SOFR
SRC
Secured Overnight Financing Rate
Systemic Risk Committee
STACR Structured Agency Credit Risk
TIPS Treasury Inflation-Protected Securities
TRACE Trade Reporting and Compliance Engine
Treasury Department of the Treasury

Abbrev ia t ions 125
TRID TILA-RESPA Integrated Mortgage Disclosures
TRIP Terrorism Risk Insurance Program
TRIPRA Terrorism Risk Insurance Program Reauthorization Act of 2015
UK United Kingdom
ULI Universal Loan Identifier
UMBS Uniform Mortgage-Backed Security
UPB Unpaid Principal Balance
UPI
USD
Unique Product Identifier
U.S. Dollar
UTI
VA
Unique Transaction Identifier
U.S. Department of Veterans Affairs
VIX Chicago Board Options Exchange Volatility Index
WAM Weighted-Average Maturity
WTI West Texas Intermediate
YTD Year-to-Date


Glossar y 127
Additional Tier 1 Capital A regulatory capital measure which may include items such as noncumulative perpetual preferred stock and mandatory convertible preferred securities which satisfy the eligibility criteria in the Revised Capital Rule, as well as related surplus and minority interests.
Advanced Approaches Capital Framework
The Advanced Approaches capital framework requires certain banking organizations to use an internal ratings-based approach and other methodologies to calculate risk-based capital requirements for credit risk and advanced measurement approaches to calculate risk-based capital requirements for operational risk. The framework applies to large, internationally active banking organizations—generally those with at least $250 billion in total consolidated assets or at least $10 billion in total on-balance sheet foreign exposure—and includes the depository institution subsidiaries of those firms.
Affiliate In general, a company is an affiliate of another company if 1) either company consolidates the other on financial statements prepared in accordance with U.S. Generally Accepted Accounting Principles, the International Financial Reporting Standards, or other similar standards; 2) both companies are consolidated with a third company on financial statements prepared in accordance with such principles or standards; 3) for a company that is not subject to such principles or standards, consolidation as described above would have occurred if such principles or standards had applied; or 4) a primary regulator determines that either company provides significant support to, or is materially subject to the risks or losses of, the other company.
Asset-Backed Commercial Paper (ABCP)
Short-term debt which has a fixed maturity of up to 270 days and is backed by some financial asset, such as trade receivables, consumer debt receivables, securities, or auto and equipment loans or leases.
Asset-Backed Security (ABS) A fixed income or other type of security which is collateralized by self-liquidating financial assets that allows the holder of the security to receive payments that depend primarily on cash flows from the assets.
Bilateral Repo A repo between two institutions in which negotiations are conducted directly between the participants or through a broker, and in which the participants must agree on the specific securities to be used as collateral. The bilateral repo market includes both non-cleared trades and trades cleared through Fixed Income Clearing Corporation’s DVP repo service.
Central Counterparty (CCP) An entity which interposes itself between counterparties to contracts traded in one or more financial markets, becoming the buyer to every seller and the seller to every buyer, thereby ensuring the performance of open contracts.
Glossary

2 0 1 8 F S O C / / Annual Report128
Clearing Bank A BHC subsidiary that facilitates payment and settlement of financial transactions, such as check clearing, or facilitates trades between the sellers and buyers of securities or other financial instruments or contracts.
Collateral Any asset pledged by a borrower to guarantee payment of a debt.
Collateralized Loan Obligation (CLO) A securitization vehicle backed predominantly by commercial loans.
Commercial Mortgage-Backed Security (CMBS)
A security which is collateralized by a pool of commercial mortgage loans and makes payments derived from the interest and principal payments on the underlying mortgage loans.
Commercial Paper (CP) Short-term (maturity of up to 270 days), unsecured corporate debt.
Common Equity Tier 1 Capital A regulatory capital measure which includes capital with the highest loss-absorbing capacity, such as common stock and retained earnings.
Common Equity Tier 1 Capital Ratio A ratio which divides common equity tier 1 capital by total risk-weighted assets. The ratio applies to all banking organizations subject to the Revised Capital Rule.
Common Securitization Platform A common RMBS securitization infrastructure between Fannie Mae and Freddie Mac.
Comprehensive Capital Analysis and Review (CCAR)
An annual exercise by the Federal Reserve to ensure that institutions have robust, forward-looking capital planning processes which account for their unique risks and sufficient capital to continue operations throughout times of economic and financial stress.
Consumer Price Index (CPI) A monthly index containing data on changes in the prices paid by urban consumers for a representative basket of goods and services.
Credit Default Swap (CDS) A financial contract in which one party agrees to make a payment to the other party in the event of a specified credit event, in exchange for one or more fixed payments.
Defined Benefit Plan A retirement plan in which the cost to the employer is based on a predetermined formula to calculate the amount of a participant’s future benefit. In defined benefit plans, the investment risk is borne by the plan sponsor.
Defined Contribution Plan A retirement plan in which the cost to the employer is limited to the specified annual contribution. In defined contribution plans, the investment risk is borne by the plan participant.
Dodd-Frank Act Stress Tests (DFAST)
Annual stress tests required by the Dodd-Frank Act for national banks and federal savings associations with total consolidated assets of more than $10 billion.
Duration The sensitivity of the prices of bonds and other fixed income securities to changes in the level of interest rates.

Glossar y 129
Emerging Market Economy Although there is no single definition, emerging market economies are generally classified according to their state of economic development, liquidity, and market accessibility. This report has grouped economies based on the classifications used by significant data sources such as the IMF and Standard & Poor’s, which include, for example, Brazil, China, India, and Russia.
EU27 Refers to the 27 member states of the European Union, excluding the United Kingdom.
Exchange-Traded Product (ETP) An investment fund or note whose shares are traded on an exchange. ETPs offer continuous pricing—unlike mutual funds, which offer only end-of-day pricing. ETPs are often designed to track an index or a portfolio of assets.
Federal Funds Rate The interest rate at which depository institutions lend reserve balances to other depository institutions overnight. The FOMC sets a target range for the level of the overnight federal funds rate. The Federal Reserve Bank of New York then uses open market operations to influence the rate so that it trades within the target range.
FICO Score A measure of a borrower’s creditworthiness based on the borrower’s credit data; developed by the Fair Isaac Corporation.
Financial and Banking Information Infrastructure Committee (FBIIC)
The FBIIC consists of 18 member organizations from across the financial regulatory community, both federal and state. It was chartered under the President’s Working Group on Financial Markets following September 11, 2001 to improve coordination and communication among financial regulators, enhance the resiliency of the financial sector, and promote public-private partnership.
Financial Market Infrastructure (FMI)
A multilateral system among participating financial institutions, including the operator of the system, used for the purposes of recording, clearing, or settling payments, securities, derivatives, or other financial transactions. Under the Dodd-Frank Act, certain FMIs are recognized as FMUs.
Financial Market Utility (FMU) A Dodd-Frank defined entity, which, subject to certain exclusions, is “any person that manages or operates a multilateral system for the purpose of transferring, clearing, or settling payments, securities, or other financial transactions among financial institutions or between financial institutions and the person.”
Fire Sale The disorderly liquidation of assets to meet margin requirements or other urgent cash needs. Such a sudden sell-off drives down prices, potentially below their intrinsic value, when the quantities to be sold are large relative to the typical volume of transactions. Fire sales can be self-reinforcing and lead to additional forced selling by some market participants which, subsequent to an initial fire sale and consequent decline in asset prices, may also need to meet margin or other urgent cash needs.
Fiscal Year Any 12-month accounting period. The fiscal year for the federal government begins on October 1 and ends on September 30 of the following year; it is named after the calendar year in which it ends.

2 0 1 8 F S O C / / Annual Report130
Futures Contract An agreement to purchase or sell a commodity for delivery in the future: (1) at a price that is determined at initiation of the contract; (2) that obligates each party to the contract to fulfill the contract at the specified price; (3) that is used to assume or shift price risk; and (4) that may be satisfied by delivery or offset.
General Collateral Finance (GCF) An interdealer repo market in which the Fixed Income Clearing Corporation plays the role of CCP. Trades are netted at the end of each day and settled at the tri-party clearing bank. See Tri-party Repo.
Government-Sponsored Enterprise (GSE)
A corporate entity with a federal charter authorized by law, but which is a privately owned financial institution. Examples include the Federal National Mortgage Association (Fannie Mae) and the Federal Home Loan Mortgage Corporation (Freddie Mac).
Gross Domestic Product (GDP) The broadest measure of aggregate economic activity, measuring the total value of all final goods and services produced within a country’s borders during a specific period.
Gross Notional Exposure The sum of the absolute values of long and short notional amounts. The “notional” amount of a derivative contract is the amount used to calculate payments due on that contract, just as the face amount of a bond is used to calculate coupon payments.
Haircut The discount, represented as a percentage of par or market value, at which an asset can be pledged as collateral. For example, a $1,000,000 bond with a 5 percent haircut would collateralize a $950,000 loan. The purpose of a haircut is to provide a collateral margin for a secured lender.
Held-to-Maturity An accounting term for debt securities accounted for at amortized cost, under the proviso that the company can assert that it has the positive intent and ability to hold the securities to maturity.
High-Quality Liquid Asset (HQLA) An asset—such as a government bond—which is considered eligible as a liquidity buffer in the U.S. banking agencies’ liquidity coverage ratio. High-quality liquid assets should be liquid in markets during times of stress and, ideally, be central bank-eligible.
Home Equity Line of Credit (HELOC) A line of credit extended to a homeowner which uses the home as collateral.
Household Debt Service Ratio An estimate of the ratio of debt payments to disposable personal income. Debt payments consist of the estimated required payments on outstanding mortgage and consumer debt.
Household Formation A measure of housing demand, calculated as the month-to-month change in the number of occupied housing units.
Interest Rate Risk Management The management of the exposure of an individual’s or an institution’s financial condition to movements in interest rates.

Glossar y 131
Interest Rate Swap A derivative contract in which two parties swap interest rate cash flows on a periodic basis, referencing a specified notional amount for a fixed term. Typically one party will pay a predetermined fixed rate while the other party will pay a short-term variable reference rate which resets at specified intervals.
Large-Scale Asset Purchases Purchases by the Federal Reserve of securities issued by the U.S. government or securities issued or guaranteed by government-sponsored agencies (including Fannie Mae, Freddie Mac, Ginnie Mae, and the Federal Home Loan Banks) in the implementation of monetary policy.
Legal Entity Identifier (LEI) A 20-character alpha-numeric code that connects to key reference information which enables clear and unique identification of companies participating in global financial markets. The LEI system is designed to facilitate many financial stability objectives, including improved risk management in firms; better assessment of microprudential and macroprudential risks; expedition of orderly resolution; containment of market abuse and financial fraud; and provision of higher-quality and more accurate financial data.
Leveraged Buyout An acquisition of a company financed by a private equity contribution combined with borrowed funds, with debt comprising a significant portion of the purchase price.
Leveraged Loan A loan for which the obligor’s post-financing leverage as measured by debt-to-assets, debt-to-equity, cash flow-to-total debt, or other such standards unique to particular industries significantly exceeds industry norms. Leveraged borrowers typically have a diminished ability to adjust to unexpected events and changes in business conditions because of their higher ratio of total liabilities to capital.
Liquidity Coverage Ratio (LCR) A standard to ensure that covered companies maintain adequate unencumbered, high-quality liquid assets to meet anticipated liquidity needs for a 30-day horizon under a standardized liquidity stress scenario.
Loan-to-Value Ratio The ratio of the amount of a loan to the value of the asset that the loan funds, typically expressed as a percentage. This is a key metric when considering the level of collateralization of a mortgage.
London Interbank Offered Rate (LIBOR)
The interest rate at which banks can borrow unsecured funds from other banks in London wholesale money markets, as measured by daily surveys. The published rate is a trimmed average of the rates obtained in the survey.
Major Swap Participant A person that is not a swap dealer and maintains a substantial position in swaps, creates substantial counterparty exposure, or is a financial entity that is highly leveraged and not subject to federal banking capital rules.
Money Market Mutual Fund (MMF) A type of mutual fund which invests in short-term, high-quality, liquid securities such as government bills, CDs, CP, or repos.

2 0 1 8 F S O C / / Annual Report132
Mortgage-Backed Security (MBS) An ABS backed by a pool of mortgages. Investors in the security receive payments derived from the interest and principal payments on the underlying mortgages.
Mortgage Servicing Company A company which acts as an agent for mortgage holders by collecting and distributing mortgage cash flows. Mortgage servicers also manage defaults, modifications, settlements, foreclosure proceedings, and various notifications to borrowers and investors.
Municipal Bond A bond issued by states, cities, counties, local governmental agencies, or certain nongovernment issuers to finance certain general or project-related activities.
Net Asset Value (NAV) An investment company’s total assets minus its total liabilities.
Net Interest Margin (NIM) Net interest income as a percent of interest-earning assets.
Net Stable Funding Ratio (NSFR) A liquidity standard to promote the funding stability of internationally active banks, through the maintenance of stable funding resources relative to assets and off-balance sheet exposures.
Open Market Operations The purchase and sale of securities in the open market by a central bank to implement monetary policy.
Option A financial contract granting the holder the right but not the obligation to engage in a future transaction on an underlying security or real asset. The most basic examples are an equity call option, which provides the right but not the obligation to buy a block of shares at a fixed price for a fixed period, and an equity put option, which similarly grants the right to sell a block of shares.
Over-the-Counter (OTC) A method of trading which does not involve an organized exchange. In OTC markets, participants trade directly on a bilateral basis, typically through voice or computer communication and often with certain standardized documentation with counterparty-dependent terms.
Part 30 Accounts Accounts which are for U.S. customers who trade futures and options on exchanges outside the U.S.
Primary Dealer A financial institution that is a trading counterparty of the Federal Reserve Bank of New York. Primary dealers are expected to make markets for the Federal Reserve Bank of New York on behalf of its official accountholders as needed, and to bid on a pro-rata basis in all Treasury auctions at reasonably competitive prices.
Prudential Regulation Regulation aimed at ensuring the safe and sound operation of financial institutions, set by both state and federal authorities.
Public Debt All debt issued by Treasury and the Federal Financing Bank, including both debt held by the public and debt held in intergovernmental accounts, such as the Social Security Trust Funds. Not included is debt issued by government agencies other than Treasury.

Glossar y 133
Qualifying Hedge Fund A hedge fund advised by a Large Hedge Fund Adviser that has a net asset value (individually or in combination with any feeder funds, parallel funds, and/or dependent parallel managed accounts) of at least $500 million as of the last day of any month in the fiscal quarter immediately preceding the adviser’s most recently completed fiscal quarter. Large Hedge Fund Advisers are advisers that have at least $1.5 billion in hedge fund assets under management.
Real Estate Investment Trust (REIT) An operating company which manages income-producing real estate or real estate-related assets. Certain REITs also operate real estate properties in which they invest. To qualify as a REIT, a company must have three-fourths of its assets and gross income connected to real estate investment and must distribute at least 90 percent of its taxable income to shareholders annually in the form of dividends.
Repurchase Agreement (Repo) The sale of a security combined with an agreement to repurchase the security, or a similar security, on a specified future date at a prearranged price. A repo is a secured lending arrangement.
Residential Mortgage-Backed Security (RMBS)
A security which is collateralized by a pool of residential mortgage loans and makes payments derived from the interest and principal payments on the underlying mortgage loans.
Revised Capital Rule The capital rule which revised the risk-based and leverage capital requirements for U.S. banking organizations, as finalized by the Federal Reserve Board and the OCC in October 2013 (78 FR 62018), and for which the FDIC issued a substantially identical interim rule in September 2013 (78 FR 55340). In April 2014, the FDIC adopted the interim final rule as a final rule with no substantive changes (79 FR 20754).
Risk-Based Capital An amount of capital, based on the risk-weighting of various asset categories, which a financial institution holds to help protect against losses.
Risk-Weighted Assets (RWAs) A risk-based concept used as the denominator of risk-based capital ratios (common equity tier 1, tier 1, and total). The total RWAs for an institution are a weighted total asset value calculated from assigned risk categories or modeled analysis. Broadly, total RWAs are determined by calculating RWAs for market risk and operational risk, as applicable, and adding the sum of RWAs for on-balance sheet, off-balance sheet, counterparty, and other credit risks.
Rollover Risk The risk that as an institution’s debt nears maturity, the institution may not be able to refinance the existing debt or may have to refinance at less favorable terms.
Run Risk The risk that investors lose confidence in an institution—due to concerns about counterparties, collateral, solvency, or related issues—and respond by pulling back their funding.

2 0 1 8 F S O C / / Annual Report134
Secured Overnight Financing Rate (SOFR)
A broad measure of the cost of borrowing cash overnight collateralized by Treasury securities. The rate is calculated as a volume-weighted median of transaction-level tri-party repo data as well as GCF Repo transaction data and data on bilateral Treasury repo transactions.
Securities Lending/Borrowing The temporary transfer of securities from one party to another for a specified fee and term, in exchange for collateral in the form of cash or securities.
Securitization A financial transaction in which assets such as mortgage loans are pooled, securities representing interests in the pool are issued, and proceeds from the underlying pooled assets are used to service and repay the securities.
Security-Based Swap Dealer A person that holds itself out as a dealer in security-based swaps, makes a market in security-based swaps, regularly enters into security-based swaps with counterparties, or engages in any activity causing it to be known as a dealer or market maker in security-based swaps; does not include a person entering into security-based swaps for such person’s own account.
Separately Managed Accounts Portfolios of assets or securities which are directly owned by investors and managed by professional investment firms.
Short-Term Wholesale Funding Short-term funding instruments not covered by deposit insurance which are typically issued to institutional investors. Examples include large checkable and time deposits, brokered CDs, CP, Federal Home Loan Bank borrowings, and repos.
Supplementary Leverage Ratio (SLR)
Tier 1 capital of an advanced approaches banking organization divided by total leverage exposure. All advanced approaches banking organizations must maintain an SLR of at least 3 percent. The SLR is effective January 1, 2018, and organizations must calculate and publicly disclose their SLRs beginning March 31, 2015.
Swap An exchange of cash flows with defined terms and over a fixed period, agreed upon by two parties. A swap contract may reference underlying financial products across various asset classes including interest rates, credit, equities, commodities, and FX.
Swap Data Repository (SDR) A person that collects and maintains information or records with respect to transactions or positions in, or the terms and conditions of, swaps entered into by third parties for the purpose of providing a centralized recordkeeping facility for swaps. In certain jurisdictions, SDRs are referred to as trade repositories. The Committee on Payments and Settlement Systems and IOSCO describe a trade repository as “an entity that maintains a centralized electronic record (database) of transaction data.”
Swap Dealer A person that holds itself out as a dealer in swaps, makes a market in swaps, regularly enters into swaps with counterparties, or engages in any activity causing it to be known as a dealer or market maker in swaps; does not include a person entering into swaps for such person’s own account.

Glossar y 135
Swap Execution Facility (SEF) A term defined in the Dodd-Frank Act as a trading system or platform which market participants use to execute and trade swaps by accepting bids and offers made by other participants, through any means of interstate commerce.
Swap Future A futures contract which mimics the economic substance of a swap.
Swaption An option granting the right to enter into a swap. See Option and Swap.
Tier 1 Capital A regulatory capital measure comprised of common equity tier 1 capital and additional tier 1 capital. See Common Equity Tier 1 Capital and Additional Tier 1 Capital.
Tier 2 Capital A regulatory capital measure which includes subordinated debt with a minimum maturity of five years and satisfies the eligibility criteria in the Revised Capital Rule.
Time Deposits Deposits which the depositor generally does not have the right to withdraw before a designated maturity date without paying an early withdrawal penalty. A CD is a time deposit.
Total Capital A regulatory capital measure comprised of tier 1 capital and tier 2 capital. See Tier 1 Capital and Tier 2 Capital.
Tri-Party Repo A repo in which a clearing bank acts as third-party agent to provide collateral management services and to facilitate the exchange of cash against collateral between the two counterparties.
Underwriting Standards Terms, conditions, and criteria used to determine the extension of credit in the form of a loan or bond.
VIX (Chicago Board Options Exchange Market Volatility Index)
A standard measure of market expectations of short-term volatility based on S&P equity index option prices.
Weighted-Average Maturity (WAM) A weighted average of the time to maturity on all loans in an asset-backed security.
Yield Curve A graphical representation of the relationship between bond yields and their respective maturities.


L is t o f Char ts 137
4.1.1 Federal Debt Held by the Public ........................................................ 15
4.1.2 U.S. Treasury Yields and Yield Curve ................................................ 15
4.1.3 10-Year Treasury Yields ..................................................................... 16
4.1.4 Fixed Income Implied Volatility........................................................... 16
4.2.1 Advanced Economies Real GDP Growth .......................................... 17
4.2.2 Euro Area Real GDP Growth ............................................................. 17
4.2.3 European 10-Year Yields ................................................................... 17
4.2.4 Italian Sovereign Bond Spreads ........................................................ 18
4.2.5 Greece Fiscal Projections ................................................................. 18
4.2.6 Contributions to UK GDP Growth ..................................................... 18
4.2.7 UK Yield Curve ................................................................................. 19
4.2.8 Japanese Consumer Price Inflation ................................................... 19
4.2.9 Japan 10-Year Government Bond Yield ............................................ 19
4.2.10 Gross Foreign Investor Capital Inflows to EMEs ................................ 20
4.2.11 Emerging Market Gross Global Bond Issuance ................................. 20
4.2.12 Emerging Market Sovereign CDS Spreads ........................................ 21
4.2.13 Emerging Market Current Account Deficits ...................................... 21
4.2.14 Emerging Market External Debt ....................................................... 21
4.2.15 Emerging Market Core CPI ............................................................... 22
4.2.16 Chinese Real GDP Growth ............................................................... 22
4.2.17 Chinese Manufacturing and Services Growth ................................... 22
4.2.18 Chinese Credit Growth ..................................................................... 23
4.2.19 Credit to the Chinese Nonfinancial Private Sector ............................. 23
4.2.20 Changes in State and Local Government Tax Revenues ................... 23
4.2.21 Long-Term Mutual Fund Flows: Municipal Bonds .............................. 24
4.2.22 Municipal Bond Spreads ................................................................... 24
4.2.23 Municipal Bond Issuance ................................................................. 24
4.3.1 Nonfinancial Corporate Debt as a Percent of GDP ............................ 25
4.3.2 U.S. Nonfinancial Business Leverage ................................................ 25
4.3.3 U.S. Nonfinancial Business Interest Coverage Ratios ........................ 25
4.3.4 Nonfinancial Corporate Liquid Assets ............................................. 26
4.3.5 U.S. Cash Corporate Credit Spreads ............................................... 26
4.3.6 Gross Issuance of Corporate Bonds ................................................. 27
4.3.7 CLO Issuance ................................................................................... 27
4.3.8 Leveraged Loan Primary Market by Investor Type ............................. 27
4.4.1 Household Debt as a Percent of Disposable Personal Income .............28
List of Charts

2 0 1 8 F S O C / / Annual Report138
4.4.2 Components of Consumer Credit ..................................................... 28
4.4.3 Household Debt Service Ratio .......................................................... 29
4.4.4 Owners’ Equity as Share of Household Real Estate .......................... 29
4.5.1 House Prices by Census Region ....................................................... 30
4.5.2 Mortgage Originations and Rates ...................................................... 31
4.5.3 Mortgage Origination Market ............................................................ 32
4.5.4 Mortgage Servicing Market ............................................................... 32
4.5.5 Mortgage Delinquency and Foreclosure ............................................ 32
4.5.6 Mortgages with Negative Equity ........................................................ 33
4.5.7 Purchase Origination Volume by Credit Score .................................. 33
4.5.8 Mortgage Originations by Product ................................................... 34
4.5.9 RMBS Issuance .............................................................................. 34
4.5.10 Commercial Property Price Indices .................................................. 37
4.5.11 Multifamily Capitalization Rates and Spreads ................................... 37
4.5.12 CMBS Issuance ................................................................................ 38
4.6.1 Nominal U.S. Dollar Trade-Weighted Index ........................................ 39
4.6.2 U.S. Dollar Exchange Rates .............................................................. 39
4.6.3 Change in U.S. Dollar Exchange Rates ............................................. 40
4.7.1 Returns in Selected Equities Indices ................................................. 41
4.7.2 U.S. Stock Valuations ....................................................................... 42
4.7.3 S&P 500 Volatility ............................................................................. 42
4.8.1 Commodities .................................................................................... 42
4.9.1 Commercial Paper Outstanding ........................................................ 43
4.9.2 Commercial Paper Interest Rates ...................................................... 43
4.9.3 Primary Dealer Repo Agreements ..................................................... 44
4.9.4 Collateral of the Tri-Party Repo Market .............................................. 45
4.9.5 Value of Securities on Loan ............................................................... 45
4.9.6 U.S. Securities Lending Cash Reinvestment ................................... 46
4.9.7 U.S. Securities Lending Cash Reinvestment ................................... 46
4.10.1 Normalized Futures Prices ................................................................ 47
4.10.2 Market Volatility Indices ..................................................................... 47
4.10.3 Normalized Futures Exchange Volume .............................................. 47
4.10.4 Normalized Futures Exchange Open Interest .................................... 48
4.10.5 Normalized Futures Exchange Number of Products .......................... 48
4.10.6 OTC Equity Options: Global Notional Outstanding ........................... 48
4.10.7 OTC Equity Option Share of All OTC Derivatives ............................... 49
4.10.8 OTC Equity Options: Global Market Value ........................................ 49
4.10.9 Derivatives Notional Amount Outstanding ........................................ 49
4.10.10 Derivatives Notional Volume ............................................................. 51
4.10.11 Interest Rate Derivatives: Global Notional Outstanding ..................... 51

F inanc ia l S tab i l i t y Ove rs ight Counc i l 139
4.10.12 Interest Rate Derivative Compression Volume .................................. 51
4.10.13 Global Cleared OTC Interest Rate Derivatives .................................. 52
4.10.14 Global Credit Derivatives by Product ................................................ 52
4.10.15 Interest Rate Derivatives Inflation Swap Clearing .............................. 52
4.10.16 FX Non-Deliverable-Forward Clearing .............................................. 53
4.10.17 Global OTC Central Clearing Market Share ...................................... 53
4.10.18 U.S. Central Clearing Market Share .................................................. 53
4.10.19 Margin Funds Held at CFTC Registered FCMs ................................. 54
4.10.20 CFTC Registered FCMs Holding Client Funds .................................. 55
4.10.21 FCM Concentration: Customer 4d(a)(2) Balances ............................. 55
4.10.22 FCM Concentration: Customer Swap Balances ............................... 55
4.10.23 U.S. On-SEF Trading Volume ........................................................... 56
4.10.24 U.S. On-SEF Trading Share ............................................................... 56
4.11.1 Total Assets by BHC Type ................................................................. 57
4.11.2 Common Equity Tier 1 Ratios ........................................................... 57
4.11.3 Selected Sources of Funding at CCAR BHCs ................................... 57
4.11.4 Cumulative Changes in Deposit Rates ............................................. 58
4.11.5 LIBOR-OIS Spread ........................................................................... 58
4.11.6 Return on Equity and Return on Assets ............................................ 58
4.11.7 Net Interest Margins .......................................................................... 59
4.11.8 Delinquency Rates ........................................................................... 59
4.11.9 Loan-Loss Reserves ......................................................................... 59
4.11.10 Credit Card Delinquency Rates ......................................................... 60
4.11.11 Auto Loan Delinquency Rates ........................................................... 60
4.11.12 Loans to Nondepository Financial Institutions .................................. 60
4.11.13 Liquidity Coverage Ratio ................................................................... 61
4.11.14 High-Quality Liquid Assets by BHC Type .......................................... 61
4.11.15 Selected Liquid Assets at All BHCs ................................................... 61
4.11.16 Cumulative Change in Securities ....................................................... 62
4.11.17 Held-to-Maturity Securities .............................................................. 62
4.11.18 Duration Gap .................................................................................... 62
4.11.19 Stock Prices ..................................................................................... 63
4.11.20 Price-to-Book ................................................................................... 63
4.11.21 U.S. Banks 5-Year CDS Spreads ...................................................... 64
4.11.22 Foreign Banks 5-Year CDS Spreads ................................................. 64
4.11.23 Initial and Stressed Capital Ratios ..................................................... 65
4.11.24 Federal Reserve’s Actions in CCAR 2017 .......................................... 65
4.11.25 Federal Reserve’s Actions in CCAR 2018 .......................................... 66
4.11.26 FDIC-Insured Failed Institutions ........................................................ 66
4.11.27 Commercial Bank and Thrift Pre-Tax Income ................................... 67

2 0 1 8 F S O C / / Annual Report140
4.11.28 U.S. Branches and Agencies of Foreign Banks: Assets .................... 67
4.11.29 U.S. Branches and Agencies of Foreign Banks: Liabilities ................ 68
4.11.30 Credit Union Income ........................................................................ 70
4.11.31 Credit Union Deposits ...................................................................... 71
4.11.32 Credit Union Net Long-Term Assets .................................................. 71
4.11.33 Credit Union Investments by Maturity ................................................ 71
4.12.1 Number of Broker-Dealers and Industry Net Income ......................... 72
4.12.2 Broker-Dealer Revenues ................................................................... 72
4.12.3 Broker-Dealer Assets and Leverage .................................................. 72
4.12.4 Large Broker-Dealer Assets and Leverage by Affiliation .................... 73
4.12.5 Insurance Industry Net Income ......................................................... 74
4.12.6 Net Yield on Invested Assets ............................................................ 74
4.12.7 Insurance Industry Capital and Surplus ............................................ 75
4.12.8 Consumer Loans and Leases Outstanding ....................................... 75
4.12.9 Business Loans and Leases Outstanding ........................................ 75
4.12.10 ABS Issuance .................................................................................. 76
4.12.11 Selected ABS Spreads .................................................................... 77
4.12.12 Agency REIT Assets and Leverage .................................................. 77
4.12.13 Agency REIT Price-to-Book Ratio .................................................... 78
4.13.1 MMF Assets by Fund Type ............................................................... 78
4.13.2 Liquid Asset Shares of Prime MMFs ................................................ 78
4.13.3 Weighted Average Maturities by Fund Type ..................................... 79
4.13.4 Net Assets of the Investment Company Industry .............................. 80
4.13.5 Monthly Bond Mutual Fund Flows .................................................... 80
4.13.6 Monthly Equity Mutual Fund Flows ................................................... 80
4.13.7 High-Yield Mutual Funds: Quarterly Flows ........................................ 81
4.13.8 Bank Loan Mutual Funds: Quarterly Flows ....................................... 81
4.13.9 Alternative Mutual Funds: Quarterly Flows ........................................ 81
4.13.10 Cumulative Equity Fund Flows ......................................................... 82
4.13.11 U.S.-Listed ETP AUM ....................................................................... 82
4.13.12 Retirement Fund Assets by Plan Type .............................................. 83
4.13.13 Public and Private Pension Funding Levels ...................................... 84
4.13.14 North American Private Equity AUM ................................................. 86
4.13.15 M&A Loan Volume for Private Equity-Backed Issuers ........................ 87
4.14.1 Market Capitalization of Blockchain-Based Digital Assets ................ 88
4.14.2 U.S. Consumer Adoption of Payment Instruments ..........................90
D.1 VIX and S&P 500 Indices .................................................................114
D.2 Total Assets of Inverse VIX ETPs ......................................................114


F I N A N C I A L S T A B I L I T Y O V E R S I G H T C O U N C I L
1500 PENNSYLVANIA AVENUE, N W | WASHINGTON, D.C. 20220
Revised (06/20/2019)