2018 half year financial results - touax.com - prez sfaf h1-2018 - final.pdf · 4 financial...
TRANSCRIPT

Financial Analysts Meeting, 13 September 2018
2018 Half Year Financial Results

2Financial Analysts Meeting 13 September 2018
Agenda
► Executive Summary
► Part 1- Touax Fundamentals
► Part 2- H1-2018 Highlights
► Part 3- H1-2018 Financials
► Part 4- Market Outlook and Strategy
► Appendix - Touax and the Stock Market

3Financial Analysts Meeting 13 September 2018
Disclaimer
This presentation does not constitute an offer to sell, or a solicitation of an offer to buy TOUAX SCA
(“Company”) shares.
This presentation may contain forward-looking statements. Such forward-looking statements do not
constitute forecasts regarding the Company’s results or any other performance indicator, but rather
trends or targets, as the case may be.
These statements are by their nature subject to risks and uncertainties as described in the Registration
Document filed with the French Autorité des Marchés Financiers (AMF) on April 18, 2018 under
number D.18-0345.
This document includes only summary information and must be read in conjunction with the
Company’s Registration Document, as well as the consolidated financial statements and activity report
for the 2017 fiscal year and the 2018 half-year financial report.
More comprehensive information about TOUAX SCA may be obtained on the Group website
(www.touax.com), under Investors Relations.

4Financial Analysts Meeting 13 September 2018
► Strategic refocusing on the leasing of transport eq uipment following the sale of
modular buildings activities in the USA and Europe in December 2017
► Priority given to improving the profitability of th e Group's activities based on
its fundamentals: its tangible asset base, its exte nded global network, and its
diversified and long-standing trusted relationships with its customers
► In the first half of 2018, Touax has notably launch ed a Change Management
Program, a new fleet management organization in the Railcar leasing activity,
raised € 110m in asset financing, syndicated 14m€ of assets to third party
investors and signed further investment commitments of $ 80 m, the first steps
of its action plan
► At June 30 th 2018, Touax recorded a significant improvement in i ts net income
and a strengthening of its balance sheet
Executive Summary

5Financial Analysts Meeting 13 September 2018
Agenda
► Executive Summary
► Part 1- Touax Fundamentals
► Part 2- H1-2018 Highlights
► Part 3- H1-2018 Financials
► Part 4- Market Outlook and Strategy
► Appendix - Touax and the Stock Market
6Financial Analysts Meeting 13 September 2018
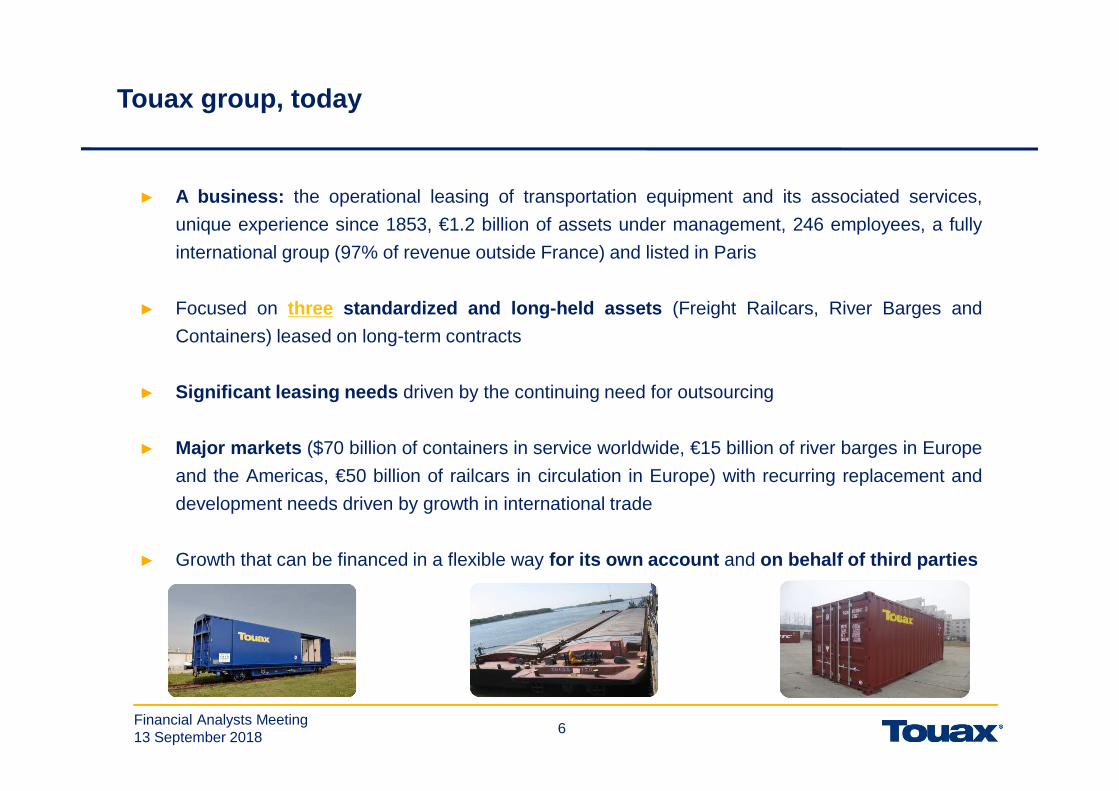
► A business: the operational leasing of transportation equipment and its associated services,
unique experience since 1853, €1.2 billion of assets under management, 246 employees, a fully
international group (97% of revenue outside France) and listed in Paris
► Focused on three standardized and long-held assets (Freight Railcars, River Barges and
Containers) leased on long-term contracts
► Significant leasing needs driven by the continuing need for outsourcing
► Major markets ($70 billion of containers in service worldwide, €15 billion of river barges in Europe
and the Americas, €50 billion of railcars in circulation in Europe) with recurring replacement and
development needs driven by growth in international trade
► Growth that can be financed in a flexible way for its own account and on behalf of third parties
Touax group, today

7Financial Analysts Meeting 13 September 2018
7
A proven economic model
Multi-year leasing contracts (3-6 years)
Standardized and mobile equipment
Low obsolescence
generating high residual value
Long-life assets(30-50 years)
► Diversified
markets on
different zones
► Strong leading
positions
Key advantages TOUAX
79% of
recurrent
leasing
revenues
79% of
recurrent
leasing
revenues
► Recurrent cash
flow
► Balanced risk
management
► (prop vs 1/3rd
party)
8Financial Analysts Meeting 13 September 2018
DivisionRevenue
shareMarket Position
Assets under management (2)Geography (1)
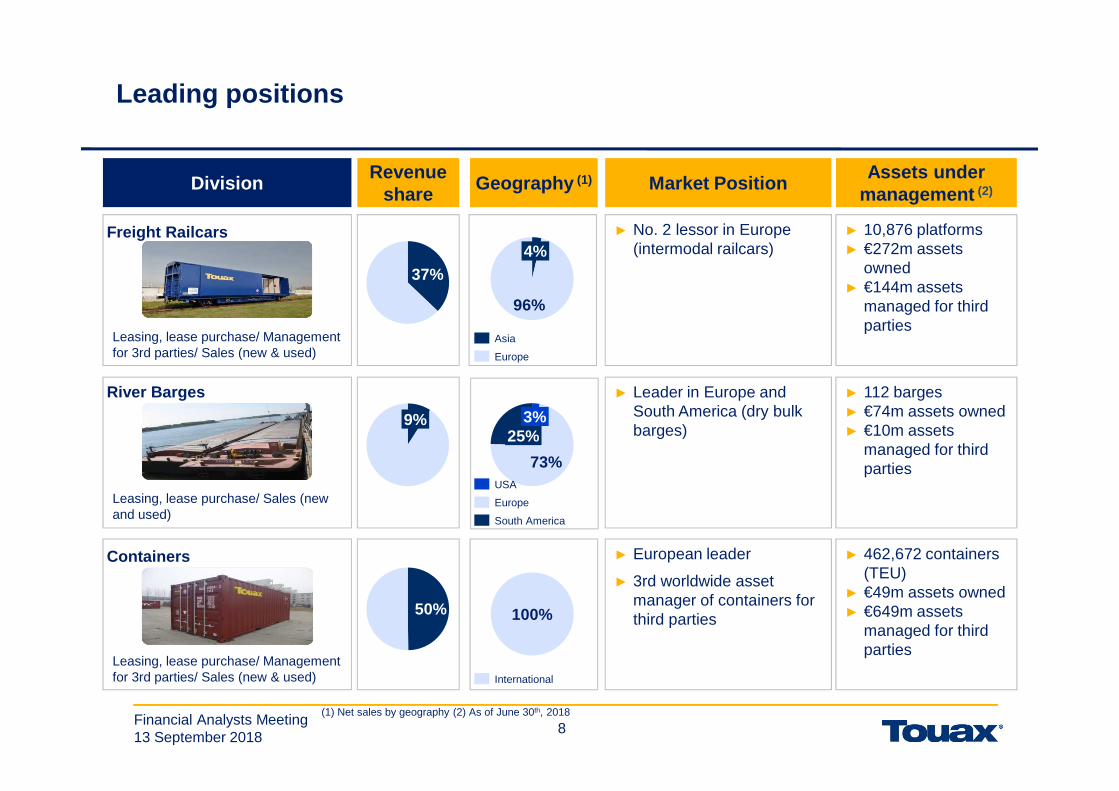
Leading positions
(1) Net sales by geography (2) As of June 30th, 2018
Containers ► European leader
► 3rd worldwide asset manager of containers for third parties
► 462,672 containers (TEU)
► €49m assets owned ► €649m assets
managed for third parties
Leasing, lease purchase/ Management for 3rd parties/ Sales (new & used)
50%
Freight Railcars ► No. 2 lessor in Europe (intermodal railcars)
► 10,876 platforms ► €272m assets
owned► €144m assets
managed for third parties
Leasing, lease purchase/ Management for 3rd parties/ Sales (new & used)
37%
River Barges ► Leader in Europe and South America (dry bulk barges)
► 112 barges► €74m assets owned ► €10m assets
managed for third parties
Leasing, lease purchase/ Sales (new and used)
9%
96%
4%
Asia
Europe
73%
3%25%
USA
South America
Europe
100%
International

9Financial Analysts Meeting 13 September 2018
9
A tangible asset base - Freight Railcars
A recent high quality fleetNumber of Railcars (platform equivalent)
Dec.2017 H1-20188
Average age of the fleet 19.7 years 19.1 years
Average utilization rate 82% 84,2%
Average leasing period 3.4 years 3.4 years
Economic lifespan 30 to 50 years
Depreciation 36 years
Increasing utilization rate
6 683
7 531
8 2318 706
9 119
2013
9 256
20122008
9 335
2009 2010 2011 2014 2015 2016 2017 30 June 2018
10 804
8 653
10 824 10 839
1 504
10 876
1 304
7 952
1 304
7 349
1 304
9 500
1 404
9 420
1 504
9 372
Number of Railcars (Platforms) Technical Management

10Financial Analysts Meeting 13 September 2018
10
A tangible asset base – River Barges
A recent high quality fleet
47% of assets in Europe & 44% in South America
Dec.2017 H1-20188
Average age of the fleet 14.2 years 13.3 years
Average utilization rate 93.2% 94,4%
Average leasing period 6.7 years 6.1 years
Economic lifespan 30 to 50 years
Depreciation 30 years
112 River Barges

11Financial Analysts Meeting 13 September 2018
11
A tangible asset base – Containers
A high quality fleet (standard dry containers 20’ and 40’)Number of Containers (TEU size)
Dec.2017 H1-20188
Average age of the fleet 9.3 years 9.6 years
Average utilization rate 98.1% 98.9%
Average leasing period 6.2 years 6.2 years
Long term contract leasing (3-7 yrs) 88.6% 88.7%
Economic lifespan
Seagoing 15 years
Land 20 years
Depreciation 13 years
Residual value from $1,000 to $1,400
High utilization rate reflecting strong needs from custo mers
508 850481 819 481 759 494 363
564 866
602 096627 108
585 231553 382
475 027 462 672
2008 2009 2010 2015 20162011 2012 2013 2014 2017 30 June 2018
12Financial Analysts Meeting 13 September 2018
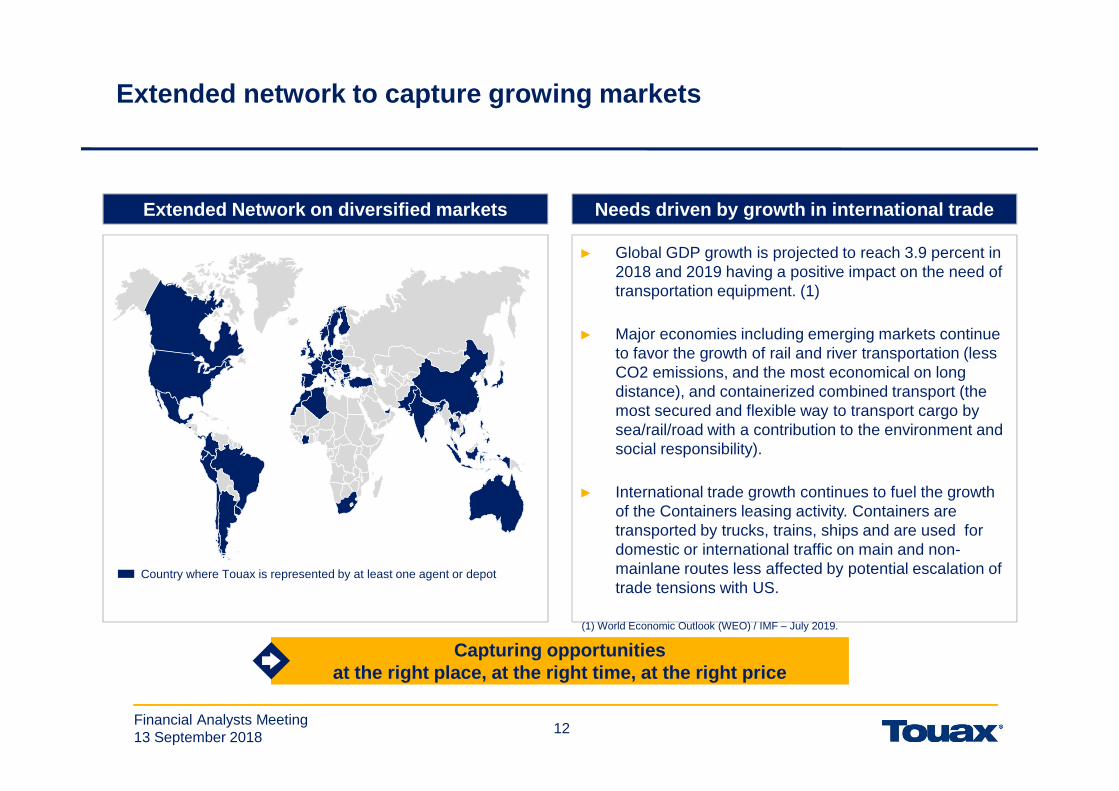
Extended network to capture growing markets
Capturing opportunities at the right place, at the right time, at the right price
► Global GDP growth is projected to reach 3.9 percent in 2018 and 2019 having a positive impact on the need of transportation equipment. (1)
► Major economies including emerging markets continue to favor the growth of rail and river transportation (less CO2 emissions, and the most economical on long distance), and containerized combined transport (the most secured and flexible way to transport cargo by sea/rail/road with a contribution to the environment and social responsibility).
► International trade growth continues to fuel the growth of the Containers leasing activity. Containers are transported by trucks, trains, ships and are used for domestic or international traffic on main and non-mainlane routes less affected by potential escalation of trade tensions with US.
Needs driven by growth in international tradeExtended Network on diversified markets
Country where Touax is represented by at least one agent or depot
(1) World Economic Outlook (WEO) / IMF – July 2019.
13Financial Analysts Meeting 13 September 2018
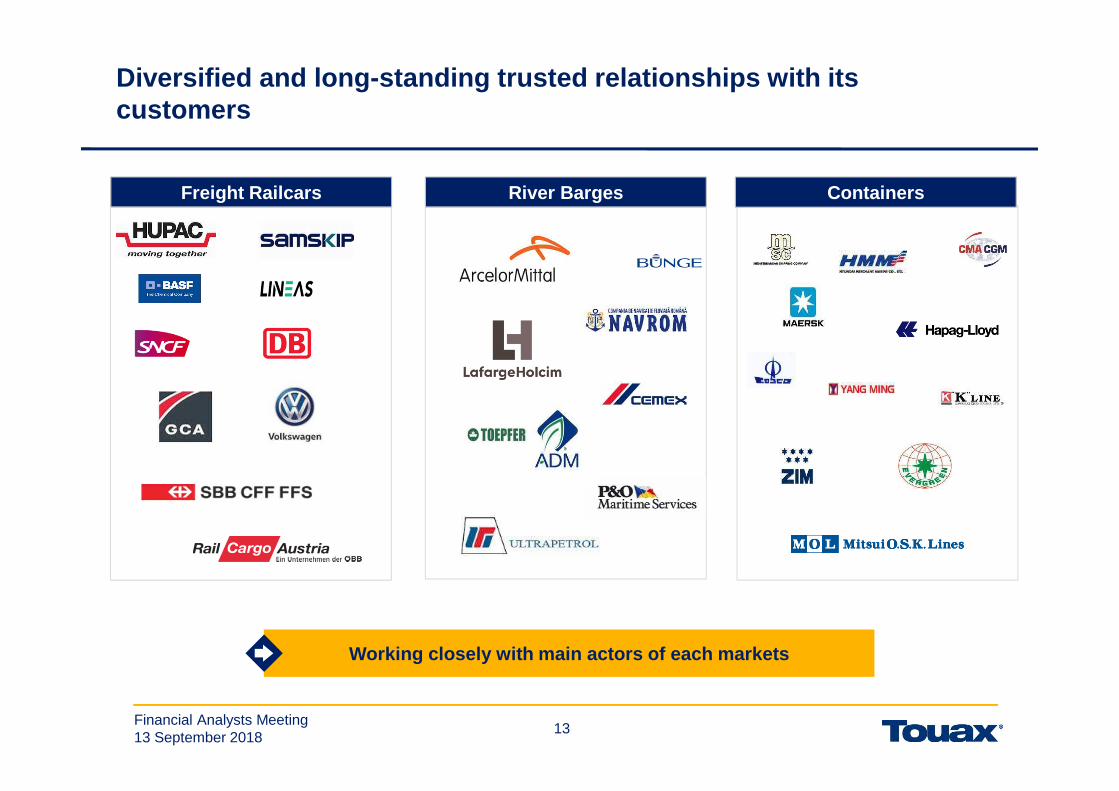
Diversified and long-standing trusted relationships with its customers
Working closely with main actors of each markets
ContainersFreight Railcars River Barges
14Financial Analysts Meeting 13 September 2018
Agenda
► Executive Summary
► Part 1- Touax Fundamentals
► Part 2- H1-2018 Highlights
► Part 3- H1-2018 Financials
► Part 4- Market Outlook and Strategy
► Appendix - Touax and the Stock Market

15Financial Analysts Meeting 13 September 2018
H1-2018 Highlights
Change Management Program launched 6 theme groups working on the improvement of the future
Touax – “COBRA” Project.
Railcars - Customer Satisfaction Program - To improve
equipment availability – Implementation H2-2018
Program Launched
New Fleet Management Organization designed
Increase utilization & leasing rates for freight
railcars
More than 1,000 containers soldNew containers trading development
USD80 million committed in container investments.
€125m soft commitment in rail investmentsNew commitment from third party investors to
increase Touax fleet under management
May 2018 - Renewed confidence of close asset-financing
banks and participation of new lenders
110m€ asset–backed financing raised
Launched in January 2018 – On time in full KPI improves
from 53% to 100% in 6 months
(“CIP”) Continuous Improvement Programimplemented in Morocco
Main achievements to boost profitability
84.2% average utilization rate (+4,9% vs H1-2017)
€10.8m of Railcars and USD4m of Containers soldSuccessful syndications
16Financial Analysts Meeting 13 September 2018
Agenda
► Executive Summary
► Part 1- Touax Fundamentals
► Part 2- H1-2018 Highlights
► Part 3- H1-2018 Financials
► Part 4- Market Outlook and Strategy
► Appendix - Touax and the Stock Market

17Financial Analysts Meeting 13 September 2018
Financial Highlights
Improved Net Result
Strengthened Balance Sheet
► Total Balance Sheet of €409 million vs €398 million as of 31 December 2017
► Net debt €179 million vs €181 million at the end of December 2017
► Gearing 1.32x stable compared to 31 December 2017
► Low ratio of Loan to Value at 53%, vs 54% end of December 2017
► Revenues of €74.4 million vs €84.3 million as of 30 June 2017 – (IFRS15)
► Improved Current Operating Income at €4.3 million, +24%
► Net income up from €(10,2) million to €(1,2) million
• Improvement of all operational activities on comparable basis and excluding one-offitems
Success in Financing
► Renewed Confidence from banks and investors
• €66m Railcars asset-backed financing, releveraging
• $60m Containers asset-backed financing with a new banking pool
► Post closing, Euro PP €16.6 million
18Financial Analysts Meeting 13 September 2018
Agenda
► Executive Summary
► Part 1- Touax Fundamentals
► Part 2- H1-2018 Highlights
► Part 3- H1-2018 Financials
o P&L analysis
o Balance Sheet & Cash Flow Statement analysis
o Asset Management
► Part 4- Market Outlook and Strategy
► Appendix - Touax and the Stock Market

19Financial Analysts Meeting 13 September 2018
19
► IFRS 15o Margin on sales of investors equipment are recorded in sales and not anymore shown as sales / cost of sales
o Syndication fees are recorded in Income and not anymore presented as sales / cost of sales
Income StatementKey figures
H1-2017 H1-2018
Leasing revenues 76,318 65,165
Sales of equipment 6,851 8,285
TOTAL 83,169 73,450
Syndication Fees & Capital Gains 1,129 978
Total Revenues from activities 84,298 74,429
Cost of sales -4,609 -5,591
Operating expenses -25,701 -16,685
Sales, general and administrative expenses -11,189 -11,891
EBITDAR (EBITDA before distribution to investors) 42,799 40,262
Depreciation, amortization and impairments -9,574 -8,575
Net distributions to investors -29,796 -27,426
CURRENT OPERATING INCOME 3,429 4,261
Other operating income and expenses 1,830 -251
NET OPERATING INCOME 5,259 4,010
Financial result & Profit (loss) of investments in associates -4,985 -4,509
Income tax expense -94 -684
Earnings from discontinued operations -10,363
NET INCOME -10,183 -1,183
Attributable to Owners of the ParentAttributable to non controlling Interests
-13,910*3,727
-1,774592
Net earnings per share -1,99 -0,25
* Including -13,837 from discontinued operations
20Financial Analysts Meeting 13 September 2018
20
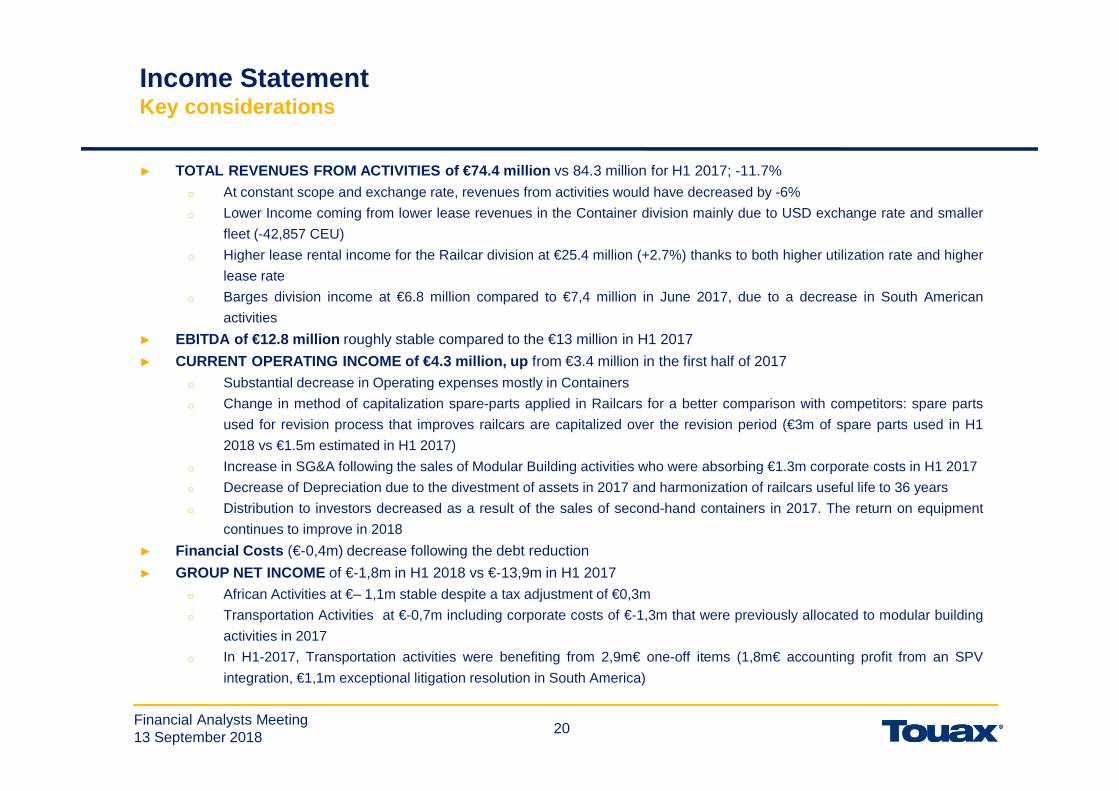
Income StatementKey considerations
► TOTAL REVENUES FROM ACTIVITIES of €74.4 million vs 84.3 million for H1 2017; -11.7%
o At constant scope and exchange rate, revenues from activities would have decreased by -6%
o Lower Income coming from lower lease revenues in the Container division mainly due to USD exchange rate and smaller
fleet (-42,857 CEU)
o Higher lease rental income for the Railcar division at €25.4 million (+2.7%) thanks to both higher utilization rate and higher
lease rate
o Barges division income at €6.8 million compared to €7,4 million in June 2017, due to a decrease in South American
activities
► EBITDA of €12.8 million roughly stable compared to the €13 million in H1 2017
► CURRENT OPERATING INCOME of €4.3 million, up from €3.4 million in the first half of 2017
o Substantial decrease in Operating expenses mostly in Containers
o Change in method of capitalization spare-parts applied in Railcars for a better comparison with competitors: spare parts
used for revision process that improves railcars are capitalized over the revision period (€3m of spare parts used in H1
2018 vs €1.5m estimated in H1 2017)
o Increase in SG&A following the sales of Modular Building activities who were absorbing €1.3m corporate costs in H1 2017
o Decrease of Depreciation due to the divestment of assets in 2017 and harmonization of railcars useful life to 36 years
o Distribution to investors decreased as a result of the sales of second-hand containers in 2017. The return on equipment
continues to improve in 2018
► Financial Costs (€-0,4m) decrease following the debt reduction
► GROUP NET INCOME of €-1,8m in H1 2018 vs €-13,9m in H1 2017
o African Activities at €– 1,1m stable despite a tax adjustment of €0,3m
o Transportation Activities at €-0,7m including corporate costs of €-1,3m that were previously allocated to modular building
activities in 2017
o In H1-2017, Transportation activities were benefiting from 2,9m€ one-off items (1,8m€ accounting profit from an SPV
integration, €1,1m exceptional litigation resolution in South America)

21Financial Analysts Meeting 13 September 2018
21
H1-2018 H1-2017
(in € million)
EBITDAR (EBITDA before
distribution to investors)
Distribution to investors
EBITDA (EBITDA after distribution to
investors)
EBITDA (EBITDA after distribution to
investors)
VARIATION June 2018-2017
Freight railcars 13.6 -2 11.5 10.5 1
River barges 2.4 2.4 3.5 (1.1)
Containers 26.1 -25.4 0.8 0.3 0.5
Other (1.8) (1.8) (1.3) (0.5)
30/06/2018 40.3 -27.4 12.8 13 (0.2)
30/06/2017 42.8 -29.8 13
Income StatementEBITDA
Roughly stable EBITDA at €13m, led by the Freight R ailcars division proprietary of assets

22Financial Analysts Meeting 13 September 2018
22
Performance Analysis - Freight Railcars
► Margin rate representative of a mix between managed and owned equipments
► Improvement in Leasing activities with:
► Higher average utilization rate: 84.2% vs 80.3% in H1-2017
► Increase in lease rate on contract renewal
► Lower sales & syndication margin with lower volume
► Syndication of €10.8m of railcars to investors in H1 2018 vs €23m in H1 2017
► Change of Policy in capitalization of spare parts and harmonization of useful life of railcars
Key ConsiderationsIncome & Ebitda
In € million
Improvement in Leasing activities with a p ositive trend on price increase
27,4 27,0
12,113,6
10,5
H1-2017 H1-2018
11,5
Ebitdar
Ebitda
Revenues from activities
23Financial Analysts Meeting 13 September 2018
23
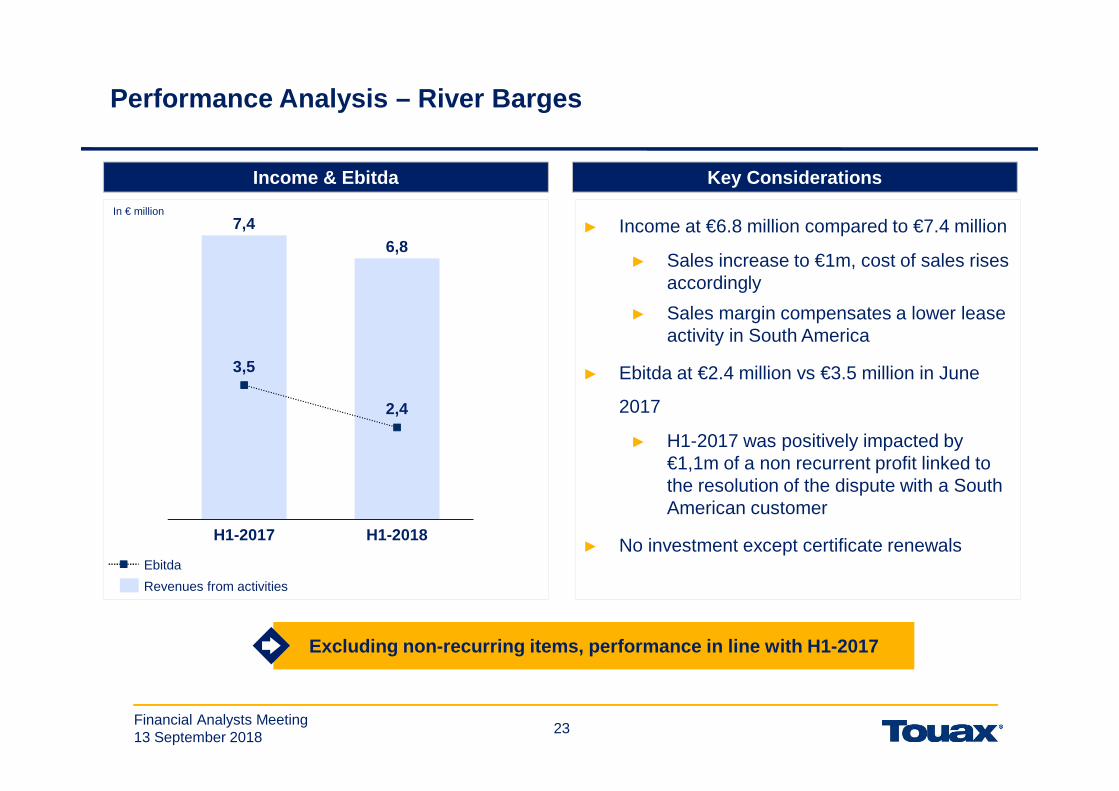
Excluding non-recurring items, performance in line with H1-2017
Performance Analysis – River Barges
Key ConsiderationsIncome & Ebitda
In € million
► Income at €6.8 million compared to €7.4 million
► Sales increase to €1m, cost of sales rises accordingly
► Sales margin compensates a lower lease activity in South America
► Ebitda at €2.4 million vs €3.5 million in June
2017
► H1-2017 was positively impacted by €1,1m of a non recurrent profit linked to the resolution of the dispute with a South American customer
► No investment except certificate renewals
7,46,8
3,5
2,4
H1-2017 H1-2018
Ebitda
Revenues from activities

24Financial Analysts Meeting 13 September 2018
24
Performance Analysis – Containers
Key ConsiderationsIncome & Ebitda
In € million
Major leasing activity improvement
► Margin structurally lower than the other Divisions due to the high level of managed assets (94%)
► Lower lease rental income in the Container division mainly due to USD exchange rate (-16%); smaller fleet (- 42,857 CEU)
► Sales proceeds up by +8%
► Increasing Ebitda to €0.8 million
► Syndication of 5,433 CEU in March
► Limited new investments as refinancing was closed end of May 2018
► Utilization rate at 98,9% vs 98% one year ago
48,0
37,6
28,526,1
0,3 0,8
H1-2018H1-2017
Ebitda
Revenues from activities
Ebitdar

25Financial Analysts Meeting 13 September 2018
Agenda
► Executive Summary
► Part 1- Touax Fundamentals
► Part 2- H1-2018 Highlights
► Part 3- H1-2018 Financials
o P&L analysis
o Balance Sheet & Cash Flow Statement analysis
o Asset Management
► Part 4- Market Outlook and Strategy
► Appendix - Touax and the Stock Market

26Financial Analysts Meeting 13 September 2018
26
Balance SheetComparative Summary Balance Sheet
AssetsIn € million
30 33
60 71
2020
288284
Current assets
Capitalizedequipment
398
31 Dec 2017
Other non current assets
30 June 2018
Cash & Cash equivalents
409
13491
123180
137135
409
4
Current liabilities
31 Dec 2017 30 June 2018
3 Provisions
LT financialliabilities
Shareholders equity
398
Liabilities

27Financial Analysts Meeting 13 September 2018
27
Balance SheetKey Considerations
► Capitalized Equipment €284m vs. €288 (€-4m): Stable owned fleet
► Other Non current assets record mostly €5.1m Goodwill, €5.9m escrow account, €2.6m long termreceivables and €3.5 m of tax certificates
► Current assets (excluding cash and cash equivalent) €71m vs. €61m
• Inventory €34m (€+10m)
• Clients €29m (€-1m)
• Others €8m (€ +1m)
► Equity €135m vs. €137m (including €24m of minority interest)
► LT financial liabilities €180m vs. €123m (€+57m)• Short term financial liabilities have been refinanced• Net financial liabilities (including short term debt) €179m vs. €181m
► Current liabilities €91m vs. €134m (€-43m)
• Short term liabilities €33m (Bonds: €7m, Balloon €6.4m, Natural Amortization €14.9m, Overdraft
and liabilities on derivatives €4.3m)
• Supplier indebtedness €15m
• Other debts €43m

28Financial Analysts Meeting 13 September 2018
28
Balance SheetEconomic balance sheet
In € million
Net debt (€179m) is financing only the tangible assets (€318m)
332 338
30 June 201831 Dec 2017
Capital assets
24
181179
137 135
338
14
31 Dec 2017
332
Net financial liabilities
30 June 2018
Shareholders equity
Working Capital
Assets Liabilities
*
*including Inventories

29Financial Analysts Meeting 13 September 2018
29
Balance SheetDebt
74% of debt is without recourse - well diversified s ource of funding
17938
33
156
Gross Debt
18
Cash & cash equivalents
Net Debt
212In € million
Debt with recourse
Debt without recourse
86% of Group’s debt from international banksFrom €212m of Gross Debt to €179m of Net Debt
14%
71%
13%
Debt Capital Market
2%
Asset Backed Financing
Financial Lease
Short TermFacility & overdraft

30Financial Analysts Meeting 13 September 2018
30
► Successful Refinancing in May 2018 for c.€110million:
� Freight Railcar :• Term Loan of €48m with a maturity of 5 years• RCF of €18m over 3 years
� Container :• Term Loan of $26m over 4 years• RCF of $34m over 2 years maturity• Existing lender + 2 new banks
► Post closing, successful issuance of €16,6million Euro PP :
� 31 July 2018, Touax SCA issued a €16.6 millionof Euro PP – 5 years, coupon 5.75%
Debt maturity profile Key highlights
In € million – Nominal debt
7
23
6
38
7
92
6
15
5
2
2020
2
38
2018
4
98
>5years2019
3
2021
3
2022
49
15
3
Bonds
Debt without recourseLoans with recourse
Finance lease with recourse
Balance SheetDebt
Refinancing Program launched in H1 2018 to continue on H2 2018 and in 2019
31Financial Analysts Meeting 13 September 2018
31
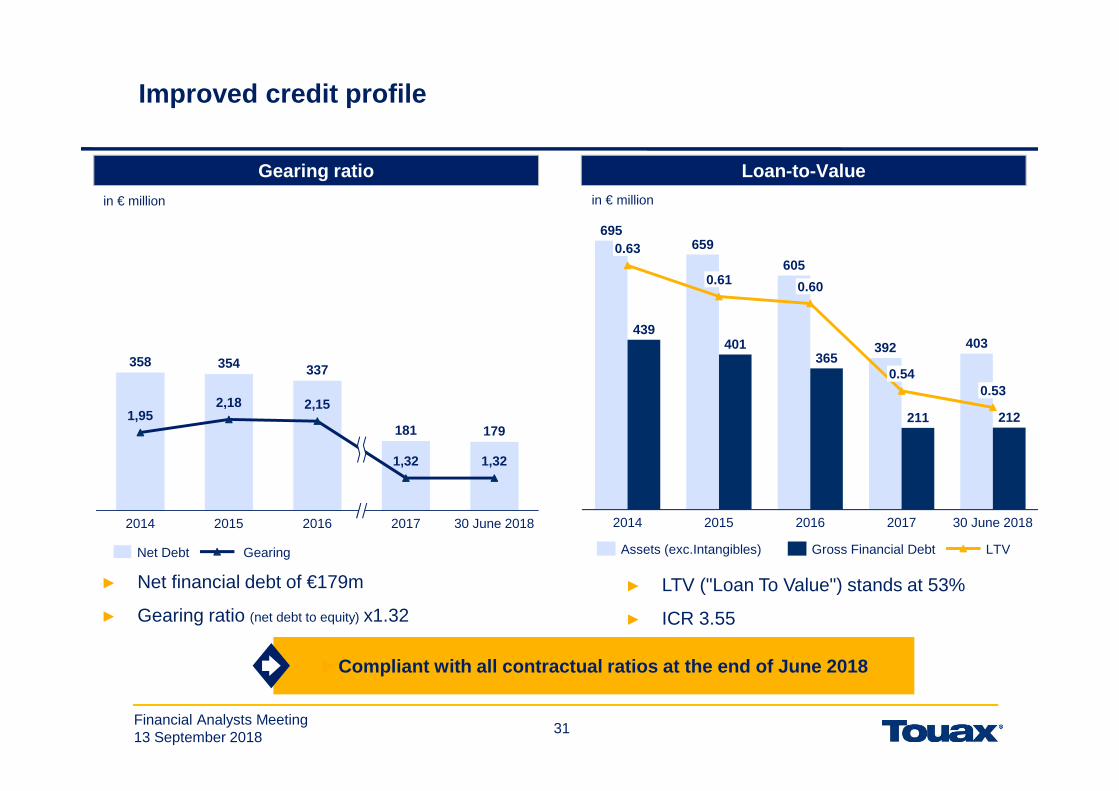
Improved credit profile
► Net financial debt of €179m
► Gearing ratio (net debt to equity) x1.32
► LTV ("Loan To Value") stands at 53%
► ICR 3.55
Gearing ratio Loan-to-Value
in € million in € million
358 354 337
181 1791,95
2,18 2,15
1,32 1,32
2014 201720162015 30 June 2018
Net Debt Gearing
►Compliant with all contractual ratios at the end of June 2018
695659
605
392 403439
401365
211 212
0.63
2015
0.53
0.61
2014
0.60
20172016
0.54
30 June 2018
LTVAssets (exc.Intangibles) Gross Financial Debt

32Financial Analysts Meeting 13 September 2018
32
Revenues and FinancingCash Flow statement
► The operating free cash flow is positive at €10.4m with a positive operating cash of €10.6m, a
net change in working capital of €8.4m and net purchase of equipment and change in
inventory of - €8.6m (new capex in transportation divisions)
► The financing flow is mainly represented by the refinancing and debt reimbursements that
occurred in May 2018
€ million H1-2017 H1-2018
Operating activities excluding WCR 11.6 10.6
WCR (excluding inventory) 0.6 8,4
Net purchase of equipment and change in inventory 21.2 (8.6)
Discontinued activities 6.3
Operating activities 39.8 10.4
Investing activities 6.1 (2.5)
Financing activities (30.7) (7.1)
Exchange rate variation 0.3 0.1
CHANGE IN NET CASH POSITION 15.5 0.9
33Financial Analysts Meeting 13 September 2018
Agenda
► Executive Summary
► Part 1- Touax Fundamentals
► Part 2- H1-2018 Highlights
► Part 3- H1-2018 Financials
o P&L analysis
o Balance Sheet & Cash Flow Statement analysis
o Asset Management
► Part 4- Market Outlook and Strategy
► Appendix - Touax and the Stock Market
34Financial Analysts Meeting 13 September 2018
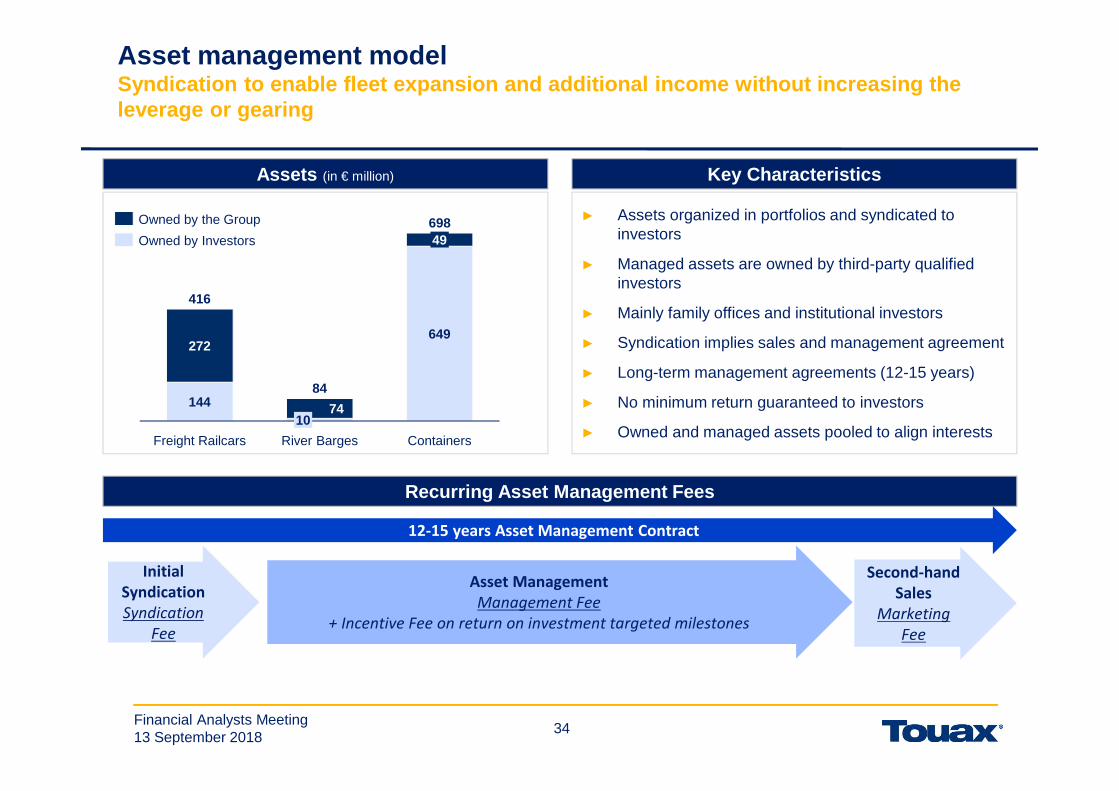
Asset management modelSyndication to enable fleet expansion and additiona l income without increasing the leverage or gearing
Recurring Asset Management Fees
12-15 years Asset Management Contract
Key Characteristics
Initial
Syndication
Syndication
Fee
Asset Management
Management Fee
+ Incentive Fee on return on investment targeted milestones
Second-hand
Sales
Marketing
Fee
Assets (in € million)
► Assets organized in portfolios and syndicated to investors
► Managed assets are owned by third-party qualified investors
► Mainly family offices and institutional investors
► Syndication implies sales and management agreement
► Long-term management agreements (12-15 years)
► No minimum return guaranteed to investors
► Owned and managed assets pooled to align interests
144
649272
74
Freight Railcars
49
Containers
10
416
River Barges
84
698Owned by the Group
Owned by Investors
35Financial Analysts Meeting 13 September 2018
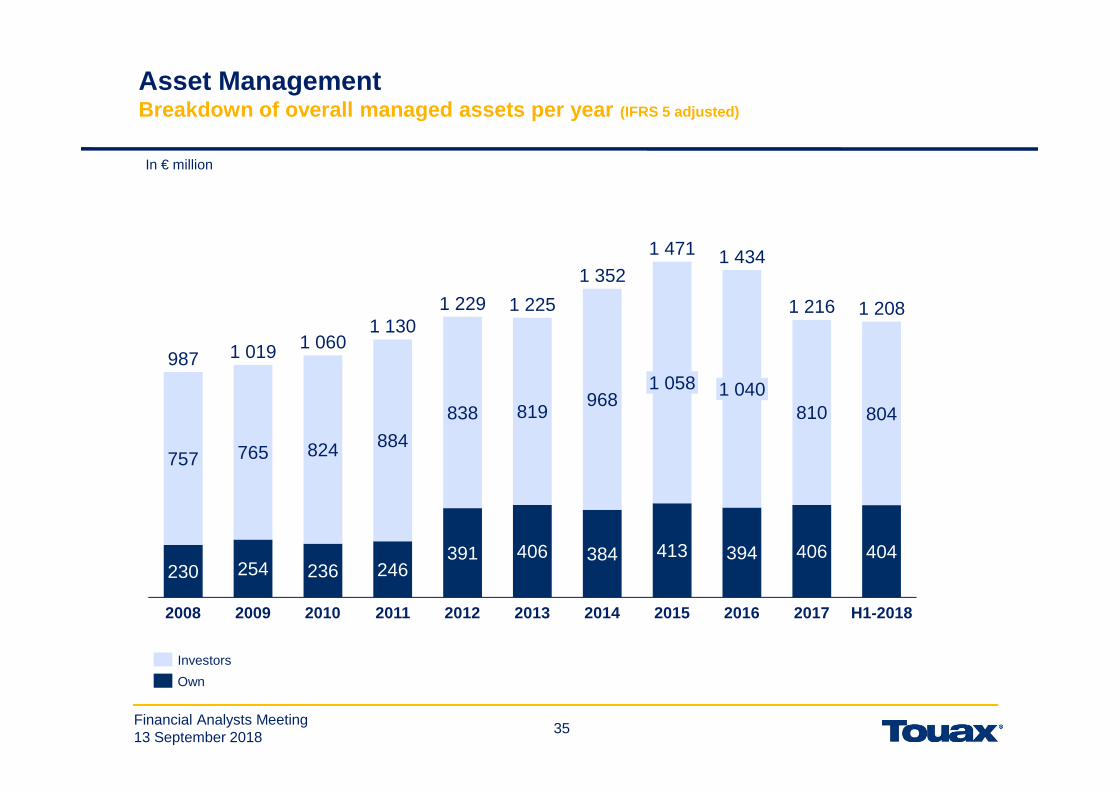
35
In € million
Asset ManagementBreakdown of overall managed assets per year (IFRS 5 adjusted)
230 254 236 246391 406 384 413 394 406 404
757 765 824 884
838 819968
810 8041 040
1 208
2012
1 060
20092008 2011
1 229
2010 2013
1 225
1 058
2014 2015
1 216
2016 2017
987
H1-2018
1 0191 130
1 352
1 471 1 434
Investors
Own

36Financial Analysts Meeting 13 September 2018
36
Asset ManagementStrategy & Performance analysis
► Asset Management strategy� Investment in tangible assets on lease, offering consistent returns and a hedge against
inflation to investors� Attractive returns in a context of historically low interest rates� Successfull launch in July 2016 of the SICAV-SIF (Touax Euro Capital Equipment
Fund) and in Feb 2018 of the Touax USD Capital Equipment Fund simplifying theinvestment process providing a European regulated fund structure with greater legalprotection, independent governance with delegated AIFM management, structuredleverage, organised liquidity after 3 years and an independent valuation process
� The SICAV has more than 40 investors (family office and corporate). It holds 3,114railcars for a market value of €115 million and 5,433 containers (Ceus) for a marketvalue of $4M in two separate dedicated Sub Funds
► 2018 First half p erformance analysis� As of the end of June €10.8 million of railcars were sold to the SICAV-SIF (Touax Euro
capital equipment fund)� A new investor (infrastructure fund) committed to invest 13 million € of equity in the
SICAV - SIF� Successful syndication of the first portfolio (US$4 millions) of containers to the SICAV -
SIF
► 2018 Second half outlook� Signed agreements for €22 million of Railcars to be syndicated between July and
October2018, and $80M of containers including $10 million to be syndicated in October.� Soft commitments of €125 million signed for direct investment in railcars
Profile and investors strategiesInvestors with diverse profiles (family office, financial company, investment company, corporate etc.)Investors are seeking a diversification strategy with recurring yields on real and tangible assets with a long useful life

37Financial Analysts Meeting 13 September 2018
Agenda
► Executive Summary
► Part 1- Touax Fundamentals
► Part 2- H1-2018 Highlights
► Part 3- H1-2018 Financials
► Part 4- Market Outlook and Strategy
► Appendix - Touax and the Stock Market
38Financial Analysts Meeting 13 September 2018
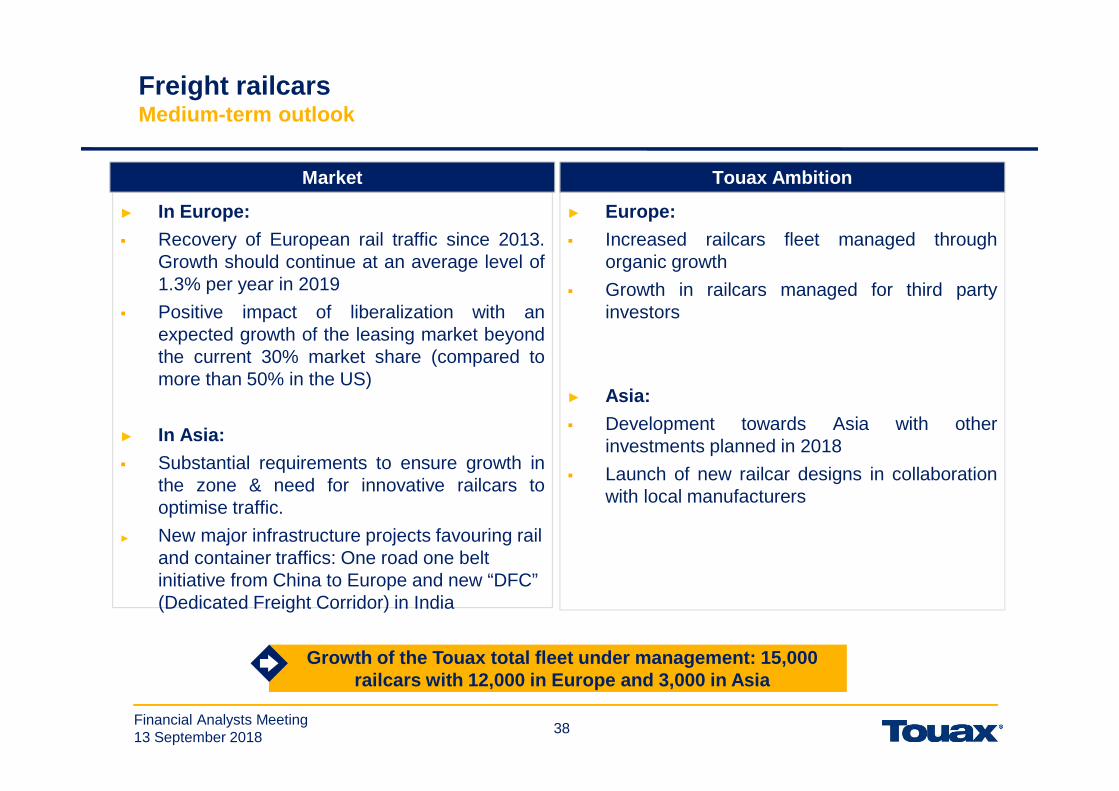
38
Freight railcarsMedium-term outlook
► Europe:
� Increased railcars fleet managed throughorganic growth
� Growth in railcars managed for third partyinvestors
► Asia:
� Development towards Asia with otherinvestments planned in 2018
� Launch of new railcar designs in collaborationwith local manufacturers
► In Europe:
� Recovery of European rail traffic since 2013.Growth should continue at an average level of1.3% per year in 2019
� Positive impact of liberalization with anexpected growth of the leasing market beyondthe current 30% market share (compared tomore than 50% in the US)
► In Asia:
� Substantial requirements to ensure growth inthe zone & need for innovative railcars tooptimise traffic.
► New major infrastructure projects favouring rail and container traffics: One road one belt initiative from China to Europe and new “DFC” (Dedicated Freight Corridor) in India
Growth of the Touax total fleet under management: 1 5,000 railcars with 12,000 in Europe and 3,000 in Asia
Market Touax Ambition

39Financial Analysts Meeting 13 September 2018
39
River barges Medium-term outlook
► Investment projects on the Rhine and Seineriver in new barges
► Supporting major customers (trading andfinancing of new barges)
► Satisfactory level of activity in Europe
► No short-term growth expected in SouthAmerica and the United States
► Europe: Market growth in France (transport ofaggregates for construction sites in GreaterParis), and on the Rhine (transport of grain andbiomass)
► Stable market in the USA (few investments in2017 and 2018)
► Gradual improvement of the market in SouthAmerica , but which will take time to recover itspre-crisis volumes (increased transport of grainbut still low level of transport of iron ore to China)
► Awareness of European and governmentalauthorities on the ecological issues favourable toriver transport
Selective investments on the Seine and the Rhine
Market Touax Ambition
40Financial Analysts Meeting 13 September 2018
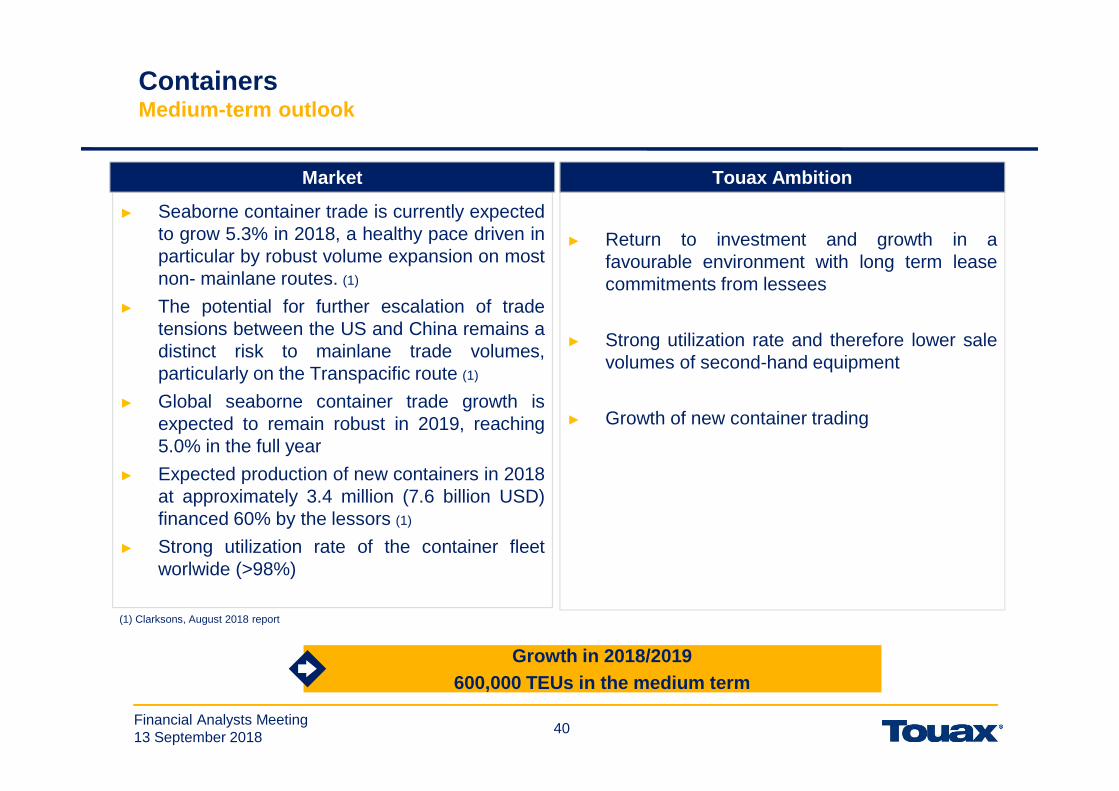
40
Containers Medium-term outlook
► Return to investment and growth in afavourable environment with long term leasecommitments from lessees
► Strong utilization rate and therefore lower salevolumes of second-hand equipment
► Growth of new container trading
► Seaborne container trade is currently expectedto grow 5.3% in 2018, a healthy pace driven inparticular by robust volume expansion on mostnon- mainlane routes. (1)
► The potential for further escalation of tradetensions between the US and China remains adistinct risk to mainlane trade volumes,particularly on the Transpacific route (1)
► Global seaborne container trade growth isexpected to remain robust in 2019, reaching5.0% in the full year
► Expected production of new containers in 2018at approximately 3.4 million (7.6 billion USD)financed 60% by the lessors (1)
► Strong utilization rate of the container fleetworlwide (>98%)
Growth in 2018/2019600,000 TEUs in the medium term
Market Touax Ambition
(1) Clarksons, August 2018 report

41Financial Analysts Meeting 13 September 2018
StrategyIncrease performance and accelerate the return to p rofitability to be part of the best in class competitors
► New fleet management program to improve Railcars’ availability and
customer satisfaction
► International expansion outside Europe (Asia)
Freight Railcars
► Development of associated services: Trading and management on
behalf of third parties
► Resumption of investments
Containers
► Selective investments in Europe on long term lease contracts to answer
our customer needsBarges14 bold
► Continuous transformation program to enhance customer satisfaction and increase sales volume, along with our partner (DPI, an investment fund specialized on African market) to increase the value of the 51% financial stake in Touax Africa
Modular Buildings business in Africa
By focusing on customer satisfaction
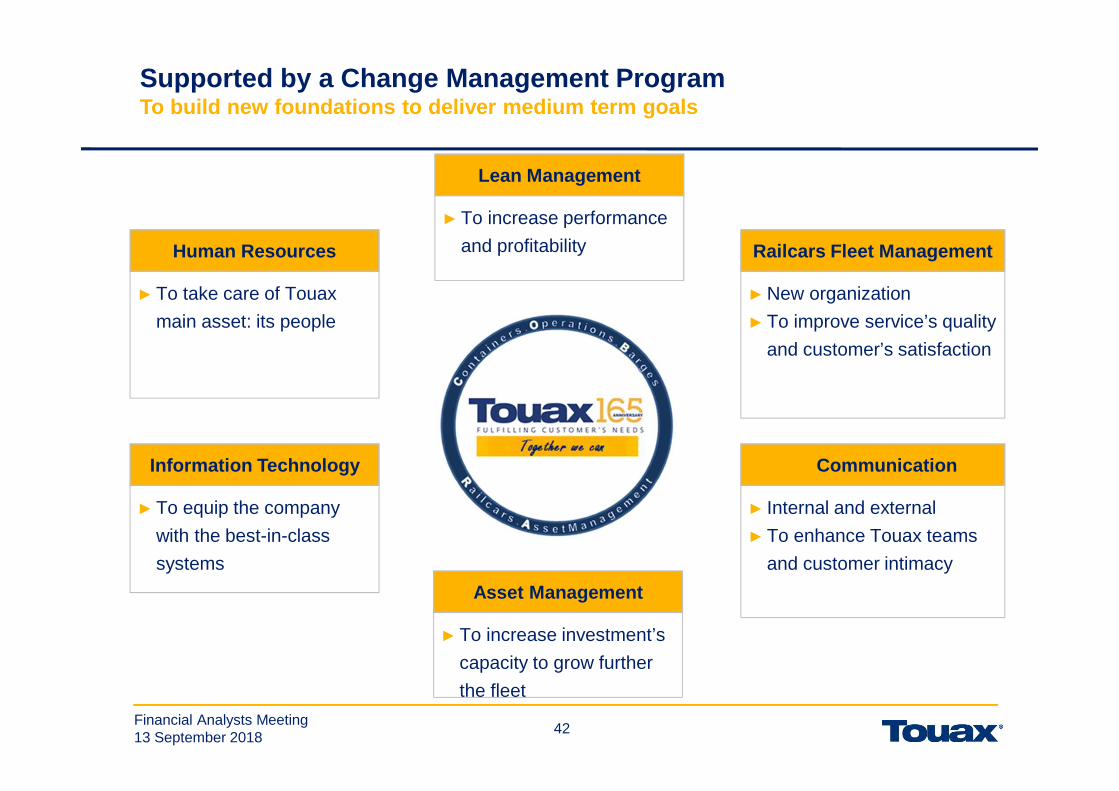
42Financial Analysts Meeting 13 September 2018
Supported by a Change Management ProgramTo build new foundations to deliver medium term goa ls
► To increase investment’s
capacity to grow further
the fleet
Asset Management
► To increase performance
and profitability
Lean Management
►New organization
► To improve service’s quality
and customer’s satisfaction
Railcars Fleet Management
► Internal and external
► To enhance Touax teams
and customer intimacy
► Communication
► To take care of Touax
main asset: its people
Human Resources
► To equip the company
with the best-in-class
systems
Information Technology

43Financial Analysts Meeting 13 September 2018
43
Following the 2017 strategic refocusing on lease and sales of
transportation equipment…
…Touax now aims at focusing on its customers needs to improve
profitability …
…while closely monitoring its financial profile…
…in a globally favorable market environment…
…to achieve growth in a medium term.
Conclusion
44Financial Analysts Meeting 13 September 2018
Agenda
► Executive Summary
► Part 1- Touax Fundamentals
► Part 2- H1-2018 Highlights
► Part 3- H1-2018 Financials
► Part 4- Market Outlook and Strategy
► Appendix - Touax and the Stock Market

45Financial Analysts Meeting 13 September 2018
45
TOUAX and the Stock MarketShares Market Data
2014 2015 2016 2017 06/2018
Number of shares (in thousands) 5,884 5,884 7,011 7,011 7,011
Market capitalization (in €m) 86.49 58.84 77.13 81.96 65.1
Consolidated shareholders’ Group equity (€m) 162.78 142.81 139.28 112.70 111.06
Price to Book Ratio (excluding hybrid capital ) 0.77 0.64 0.87 1.31 1.07
Annualized net earnings per share (€) (2.20) (4.08) (1.82) (2.58) (0.25)
Highest share price (€) 21.03 16.80 11.81 14.28 12.40
Lowest share price (€) 13.51 9.85 7.45 8.93 9.10
Average daily trading volume (in number of shares) 2,866 6,689 4,720 13,014 5,586
Closing price 14.70€ 10.00€ 11.00€ 11.69€ 9.28€
Overall net distributions per share (€) 0.50 - - - -
Overall return per share 3.4% - - - -The existing share price of 7.94€ means a price to book ratio (excluding hybrid capital) of 0.92. The book price (IFRS) does not include the value (NPV of future management commissions) of the € 804 million of assets managed on behalf of third party investors. Touax intention is to return to a stable dividend distribution of 33% of net profit as soon as it materializes.