2018 market analysis update - cranberry township
TRANSCRIPT

2018 Market Analysis Update
1

CRANBERRY TOWNSHIP MARKET PROFILE: 2018 Market Analysis Update
2018 MARKET ANALYSIS UPDATE
Introduction ......................................................................................................................................3
The Study Area ..................................................................................................................................4
The Demographic Environment ..........................................................................................................5
Key Demographic Observations ..................................................................................................5
New Housing Development Trends ................................................................................................... 15
The Workforce ................................................................................................................................. 18
Worker Inflow/Outflow ............................................................................................................ 18
2010-2015 Commuter Trends .................................................................................................... 18
2017 Employment Trends ......................................................................................................... 18
The Economy ................................................................................................................................... 22
Industry Mix and Job Growth .................................................................................................... 22
Job Earnings ............................................................................................................................. 26
Location Quotient ..................................................................................................................... 26
Shift-Share Analysis .................................................................................................................. 30
The Retail Market ............................................................................................................................ 32
The Commercial Market ................................................................................................................... 38
Regional Economic Opportunities ..................................................................................................... 44
Growth of the Marcellus Shale Industry in the Region ....................................................................... 44
Ethane Cracker Related Opportunities .............................................................................................. 49
Business Retention and Recruitment Recommendations ................................................................... 51
2

CRANBERRY TOWNSHIP MARKET PROFILE: 2018 Market Analysis Update
INTRODUCTION
Located in Butler County, Pennsylvania, Cranberry Township continues to be one of the fastest growing
municipalities in the state. From 2010-2014, Cranberry surpassed McCandless Township as the
municipality with the largest population in the Cranberry Corridor. The Cranberry Corridor consists of
Adams, Cranberry, Jackson, Marshall, McCandless, and Pine townships and Seven Fields Borough. In 2009,
Cranberry included a market analysis (the 2007 Market Analysis) in its comprehensive plan update as a
tool to guide decision-making in developing the Cranberry Plan, the township’s 25-year comprehensive
plan. The 2007 Market Analysis was designed to answer the following questions.
1. Who lives in the Township and what are their demographic characteristics?
2. Who lives here and works there, and who lives there and works here?
3. Who are the Township’s regional competitors and how does the Township compare to
those areas?
4. What are the growth trends in the Township and its competitive areas?
5. What is the economic profile of the Township and its larger economic region?
6. What local and regional assets and strengths can be leveraged to create new business
opportunities in the region?
7. What is the expected impact of the new or planned business operations in the Township?
8. What are the Township’s greatest weaknesses/challenges to economic growth?
9. What level of business development can the Township support, and what types of
businesses should be targeted?
As part the Township’s economic development strategy, it was determined that the key indicators
evaluated in the original market assessment would be updated at three-year intervals to measure the
effectiveness of the Township’s economic development strategy. The 2018 Market Analysis Update
provides indicators to measure five key areas:
1. Demographic Environment
2. Workforce (Inflow/Outflow and Age)
3. Economy (Jobs, Earnings, and Employment Trends)
4. Retail Market
5. Commercial Market
This 2018 Market Analysis is intended to provide an update to Cranberry Township’s 2015 Market Analysis
to better reflect current economic realities and incorporate changes in local demographics and overall
business climate occurring over the last three years. The 2018 Market Analysis provides an overview of
current and emerging real estate and demographic trends associated with Cranberry’s retail, housing and
commercial markets, as well as identifying opportunities for industrial growth relative to the Marcellus
Shale industry and future cracker plant in Beaver County.
3

CRANBERRY TOWNSHIP MARKET PROFILE: 2018 Market Analysis Update
THE STUDY AREA
The study area for the Market Analysis was established in 2007 with the initial assessment; the 2018
analysis remains consistent with that approach. The Market Analysis was designed to look at indicators
and trends, as well as to present peer-to-peer comparisons with competitive areas and micro-to-macro
comparisons to the Township’s larger economic region. Based on growth patterns and anecdotal
information, it was determined that areas in the region most competitive to the Township from both
residential and business standpoints are: (1) the City of Pittsburgh; (2) the Monroeville/Murrysville
Corridor; (3) the North Washington Corridor; and (4) the Airport Corridor. As with the previous market
analysis, this update presents peer-to-peer comparisons of the Township with these areas to identify
comparative strengths and weaknesses in its ability to attract new residents and businesses.
In addition to peer-to-peer comparisons, this market assessment update also compares Cranberry
Township to a larger economic region that includes Butler and Allegheny counties, and select adjacent
municipalities in Beaver, Westmoreland, and Washington counties.
FIGURE 1. CORRIDORS SELECTED FOR COMPARATIVE ASSESSMENT
4

CRANBERRY TOWNSHIP MARKET PROFILE: 2018 Market Analysis Update
THE DEMOGRAPHIC ENVIRONMENT
The residents of the Cranberry provide the talent and skills of the Township’s employment base and are
the consumer base for goods and services in the area. Analyzing the Township’s demographic trends
present indicators of the market for future housing and commercial development. Residents are the
workforce that supports existing business and industry and, in today’s economy, residents are also a
knowledge resource that serves to attract new businesses to the area resulting in higher salaries
commensurate with local knowledge and skills.
Tables 1 - 7 present a comparative overview of seven key indicators comparing Cranberry’s well-being to
its competitive communities.
KEY DEMOGRAPHIC OBSERVATIONS
• Trends in the Cranberry Corridor’s population growth are a key indicator of its attractiveness to new
residents and businesses. From 2000-2010, the Cranberry Corridor outpaced its peer corridors,
increasing from 78,875 to 93,163 – the largest population gain in the region. Since 2010, Cranberry
Township has experienced steady growth and surpassed McCandless Township as the most populous
Township in the Cranberry Corridor with 30,655 residents. Absent new development, baseline
population projections through 2022 show continued growth, with a total population of 32,171.
• Nearly one third of the 100,000+ residents in the Cranberry Corridor live in Cranberry Township. The
Cranberry Corridor is anticipated to attract the greatest number of new residents over the next four
years, with a population growth of 5,136, and Cranberry Township’s growth will account for 1,516 of
the new residents.
• As part of The Cranberry Plan, Cranberry Township evaluated three potential growth scenarios and
projected likely population change with each. The scenario - most similar to the new zoning
regulations that resulted from the Plan – was selected as the desirable vision for Cranberry Township’s
future. This preferred scenario established benchmarks for growth within the community including a
target population of 50,011 by 2030. Within seven years of the established growth scenario
benchmarks, Cranberry Township’s population grew by 2,557 new residents and achieved 61% of its
targeted population. The Township’s progressive growth is indicative of its relative attractiveness to
new residents.
• From 2010-2017, Cranberry Township experienced a faster rate of growth in households than any
other community within the study area. The Township attracted 913 new households, followed by
Marshall Township and Pine Township at 526 households and 464 households, respectively. Over the
next four years, Cranberry’s family-friendly community, affordable housing, and employment
opportunities is anticipated to attract 554 new households. This increase will account for 42% of the
total household growth in the Cranberry Corridor.
•
5

CRANBERRY TOWNSHIP MARKET PROFILE: 2018 Market Analysis Update
• Since 2010, Cranberry Township and Pine Township are the only communities within the
Cranberry Corridor to maintain or increase the size of their households. From 2010 -2017, Pine
Township’s household size remained 2.92, whereas Cranberry Township’s household size
increased from 2.72 to 2.73.
• Household income is a quantitative measure of the economic well-being of a community and is
an indicator of the spending power of residents, as well as an indicator of the quality of jobs that
are available to residents. The Cranberry Corridor possesses the highest median household
income compared to its peers, averaging $111,349. The Washington Corridor and
Monroeville/Murrysville Corridor trail behind at $90,451 and $77,448, respectively. Since 2010,
the median household income in Cranberry Township has increased from $84,007 to $104,618 in
2017. In comparison, the median household income in 2017 for Pennsylvania and the United
States was $56,184 and $56,124, respectively. This trend is expected to continue through 2022 as
Cranberry’s median household income will be approximately $47,000 higher than the median
household income of Pennsylvania and the United States. This income difference can be
attributed to numerous factors including Cranberry’s lively business market, access to family-
sustaining jobs, and low taxes.
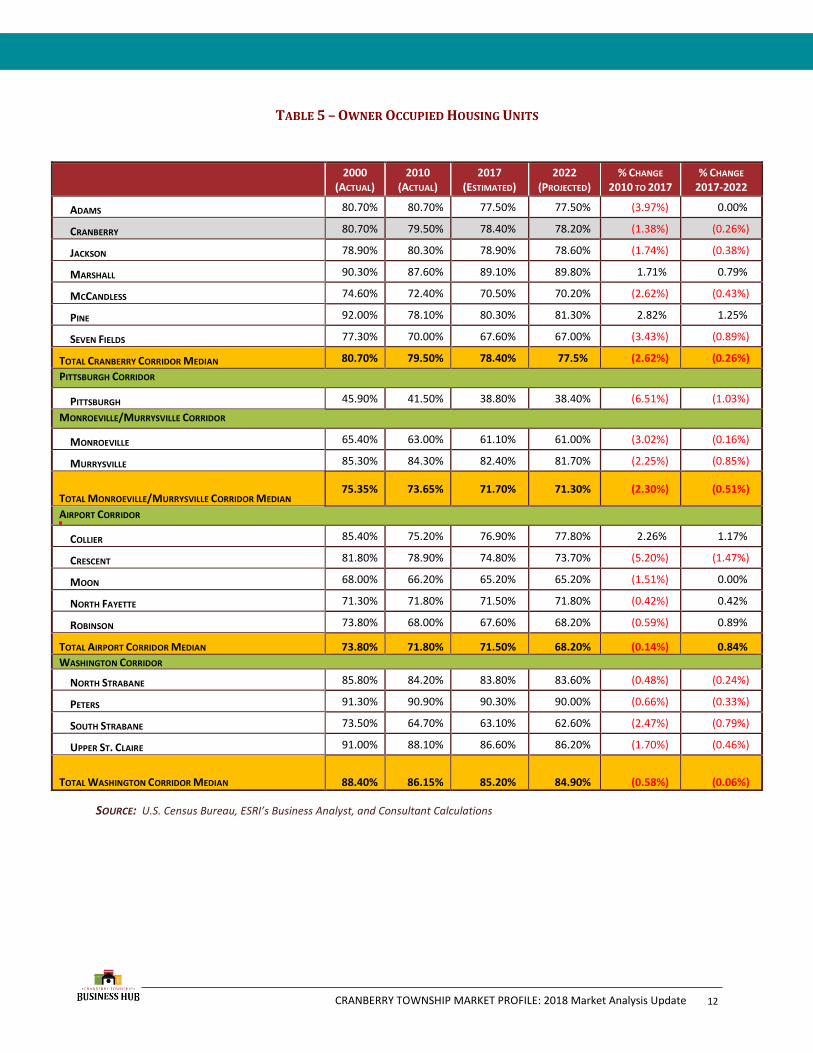
• A key factor in a community’s attractiveness is a housing supply that matches the needs of an
increasingly diverse population. Historically, most housing units in the Cranberry Corridor were
owner occupied and this trend is expected to continue through 2022. In 2017, Cranberry
Township had 11,859 housing units and 9,297 of those units were owner occupied. Over the next
four years, the number of housing units in Cranberry Township is expected to grow to 12,496,
with 9,771 of those units being owner occupied. As a transient-oriented area, the City of
Pittsburgh possesses the smallest number of owner occupied units, accounting for only 62,006 of
the 159,810 housing units. With housing options as a consideration for potential new knowledge
workers, Cranberry Township should promote its diversified housing stock and affordable family-
friendly housing units.
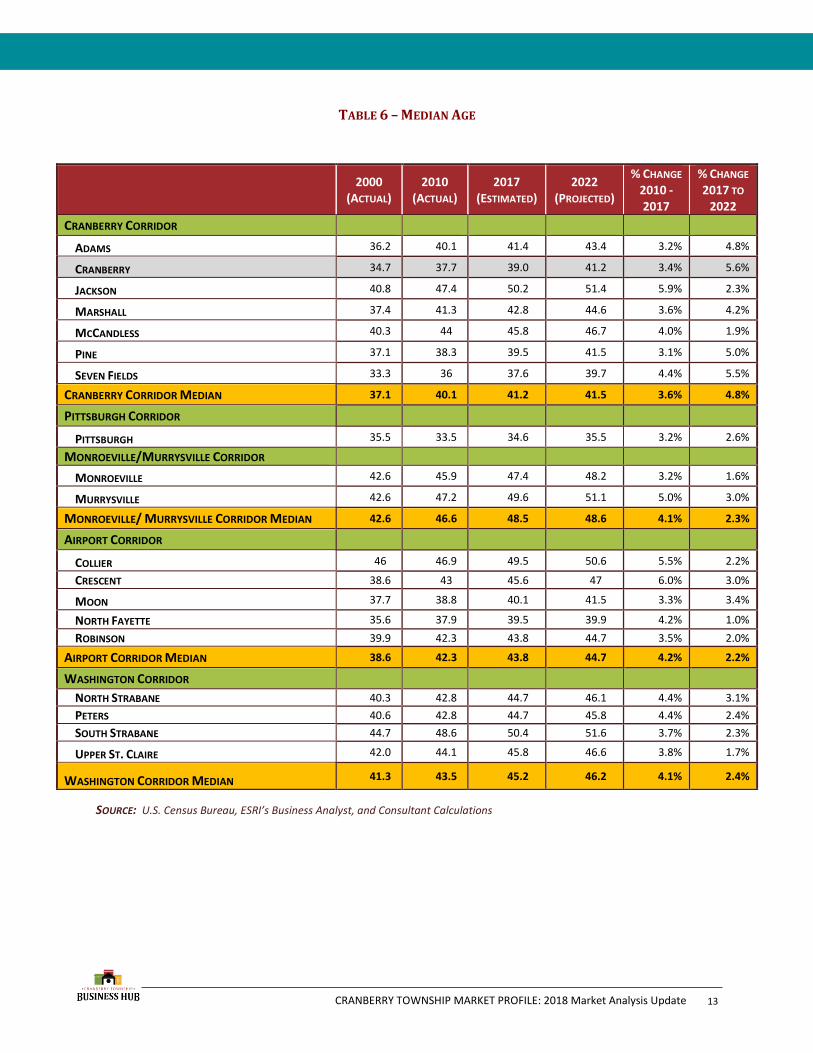
• Apart from the City of Pittsburgh, Cranberry Township is home to youngest population throughout
the entire study area. Densely populated urban areas typically attract a younger population; such
is the case in Cranberry Township, which has a median age of 39. The City of Pittsburgh, for
comparison, has a median age of 34. The presence of younger residents represents a population
likely to have children and raise families; therefore, their consistency is critical to the Township’s
economic well-being. It will be important for Cranberry to continually evaluate quality of life
factors such as affordable housing, low cost of living, and lively business climate to maintain and
attract young professional and families.
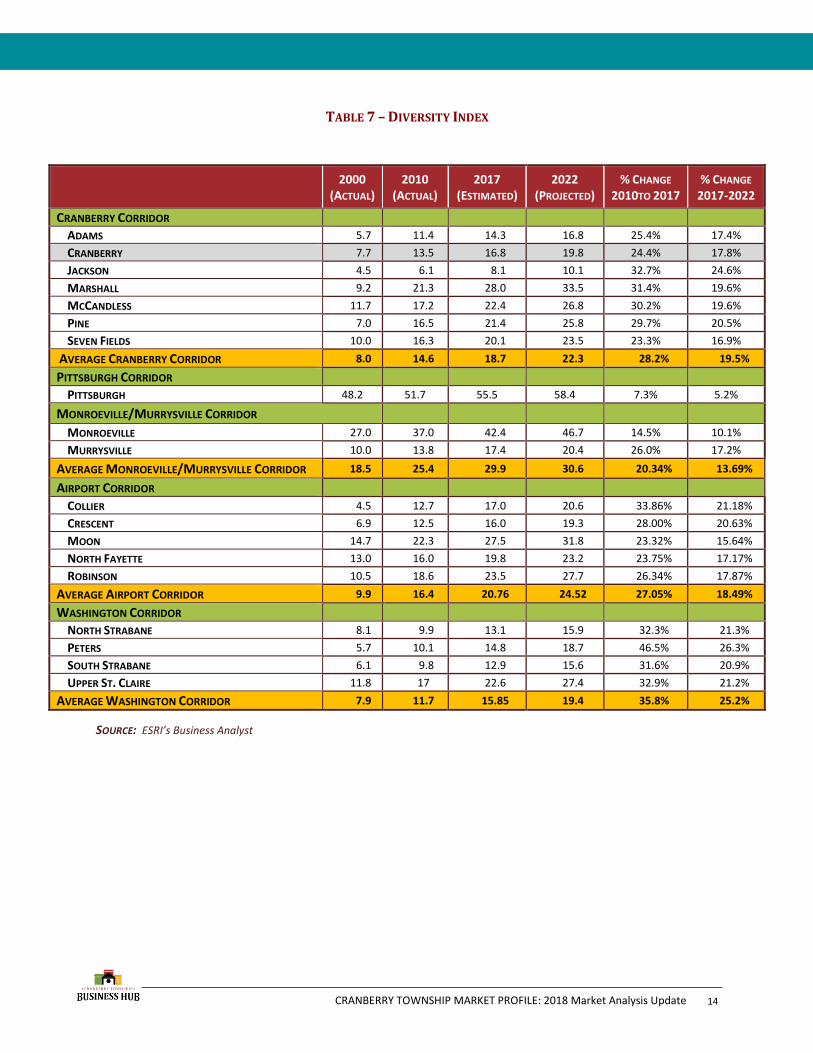
• ESRI measures the diversity of a community using a “diversity index” that indicates the probability
that two people in the same community would be from the same race/ethnic group. A
community’s diversity index captures the racial and ethnical diversity in a single number, 0 to 100,
6
CRANBERRY TOWNSHIP MARKET PROFILE: 2018 Market Analysis Update
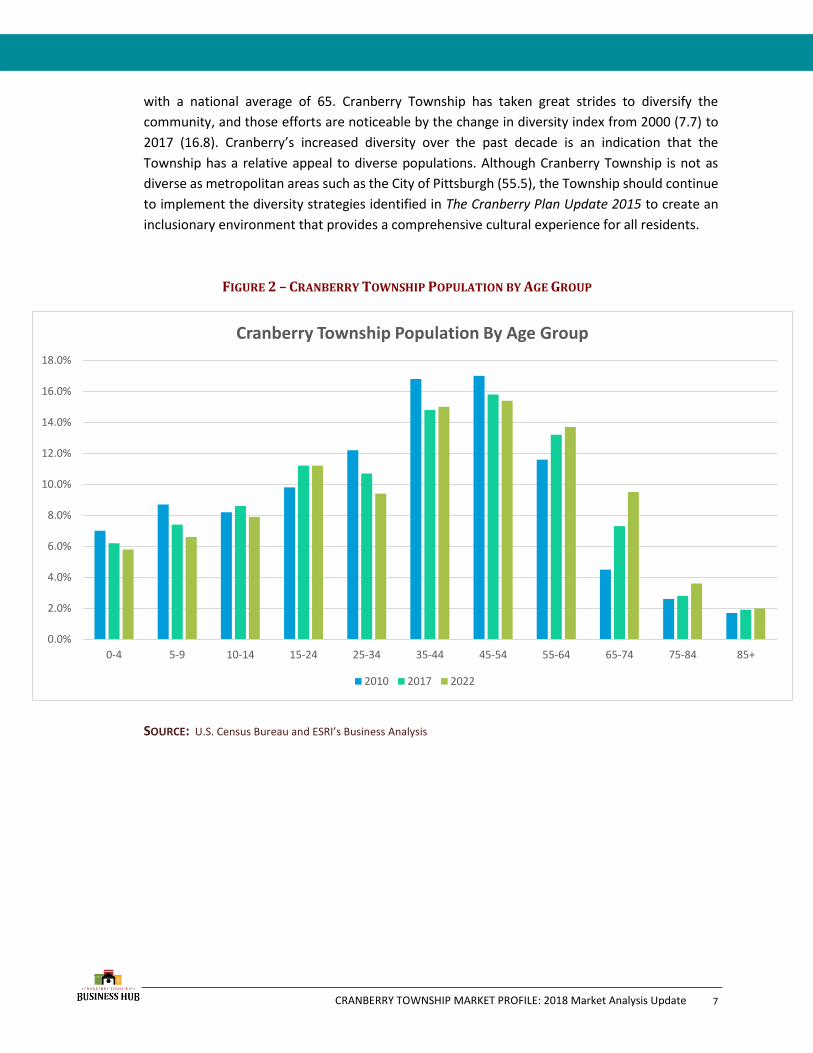
with a national average of 65. Cranberry Township has taken great strides to diversify the
community, and those efforts are noticeable by the change in diversity index from 2000 (7.7) to
2017 (16.8). Cranberry’s increased diversity over the past decade is an indication that the
Township has a relative appeal to diverse populations. Although Cranberry Township is not as
diverse as metropolitan areas such as the City of Pittsburgh (55.5), the Township should continue
to implement the diversity strategies identified in The Cranberry Plan Update 2015 to create an
inclusionary environment that provides a comprehensive cultural experience for all residents.
FIGURE 2 – CRANBERRY TOWNSHIP POPULATION BY AGE GROUP
SOURCE: U.S. Census Bureau and ESRI’s Business Analysis
0.0%
2.0%
4.0%
6.0%
8.0%
10.0%
12.0%
14.0%
16.0%
18.0%
0-4 5-9 10-14 15-24 25-34 35-44 45-54 55-64 65-74 75-84 85+
Cranberry Township Population By Age Group
2010 2017 2022
7
CRANBERRY TOWNSHIP MARKET PROFILE: 2018 Market Analysis Update
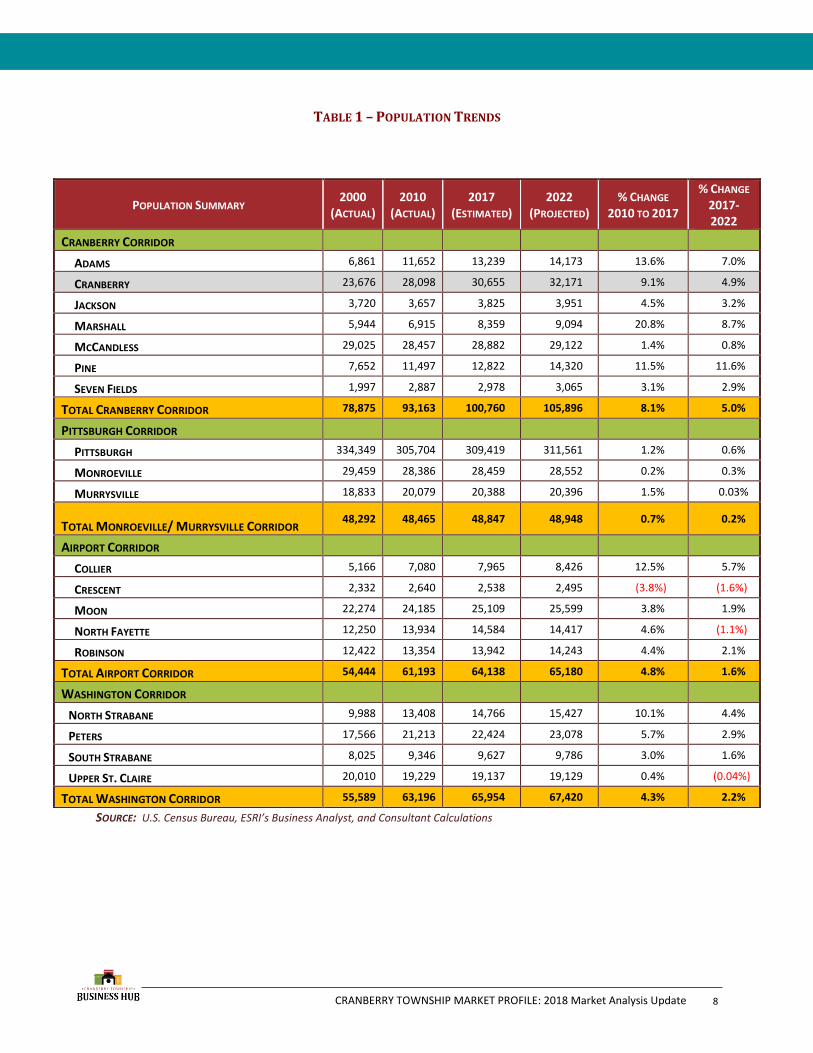
TABLE 1 – POPULATION TRENDS
SOURCE: U.S. Census Bureau, ESRI’s Business Analyst, and Consultant Calculations
POPULATION SUMMARY 2000
(ACTUAL) 2010
(ACTUAL) 2017
(ESTIMATED) 2022
(PROJECTED) % CHANGE
2010 TO 2017
% CHANGE 2017-2022
CRANBERRY CORRIDOR
ADAMS 6,861 11,652 13,239 14,173 13.6% 7.0%
CRANBERRY 23,676 28,098 30,655 32,171 9.1% 4.9%
JACKSON 3,720 3,657 3,825 3,951 4.5% 3.2%
MARSHALL 5,944 6,915 8,359 9,094 20.8% 8.7%
MCCANDLESS 29,025 28,457 28,882 29,122 1.4% 0.8%
PINE 7,652 11,497 12,822 14,320 11.5% 11.6%
SEVEN FIELDS 1,997 2,887 2,978 3,065 3.1% 2.9%
TOTAL CRANBERRY CORRIDOR 78,875 93,163 100,760 105,896 8.1% 5.0%
PITTSBURGH CORRIDOR
PITTSBURGH 334,349 305,704 309,419 311,561 1.2% 0.6%
MONROEVILLE 29,459 28,386 28,459 28,552 0.2% 0.3%
MURRYSVILLE 18,833 20,079 20,388 20,396 1.5% 0.03%
TOTAL MONROEVILLE/ MURRYSVILLE CORRIDOR 48,292 48,465 48,847 48,948 0.7% 0.2%
AIRPORT CORRIDOR
COLLIER 5,166 7,080 7,965 8,426 12.5% 5.7%
CRESCENT 2,332 2,640 2,538 2,495 (3.8%) (1.6%)
MOON 22,274 24,185 25,109 25,599 3.8% 1.9%
NORTH FAYETTE 12,250 13,934 14,584 14,417 4.6% (1.1%)
ROBINSON 12,422 13,354 13,942 14,243 4.4% 2.1%
TOTAL AIRPORT CORRIDOR 54,444 61,193 64,138 65,180 4.8% 1.6%
WASHINGTON CORRIDOR
NORTH STRABANE 9,988 13,408 14,766 15,427 10.1% 4.4%
PETERS 17,566 21,213 22,424 23,078 5.7% 2.9%
SOUTH STRABANE 8,025 9,346 9,627 9,786 3.0% 1.6%
UPPER ST. CLAIRE 20,010 19,229 19,137 19,129 0.4% (0.04%)
TOTAL WASHINGTON CORRIDOR 55,589 63,196 65,954 67,420 4.3% 2.2%
8

CRANBERRY TOWNSHIP MARKET PROFILE: 2018 Market Analysis Update
TABLE 2 – HOUSEHOLDS
SOURCE: U.S. Census Bureau, ESRI’s Business Analyst, and Consultant Calculations
2000 (ACTUAL)
2010 (ACTUAL)
2017 (ESTIMATED)
2022 (PROJECTED)
NUMERIC
CHANGE (2010 TO
2017)
% CHANGE 2010 TO
2017
% CHANGE 2017 TO
2022
CRANBERRY CORRIDOR
ADAMS 2,352 4,389 5,036 5,414 647 14.7% 7.5%
CRANBERRY 8,367 10,248 11,161 11,715 913 8.9% 4.9%
JACKSON 1,386 1,423 1,503 1,559 80 5.6% 3.7%
MARSHALL 1,929 2,415 2,941 3,201 526 21.7% 8.8%
MCCANDLESS 11,153 11,659 11,947 12,107 288 2.4% 1.3%
PINE 2,401 3,933 4,387 4,630 454 11.5% 5.5%
SEVEN FIELDS 760 1,186 1,236 1,276 50 4.2% 3.2%
TOTAL CRANBERRY
CORRIDOR 28,348 35,253 36,804 38,113 1,551 4.4% 3.5%
PITTSBURGH CORRIDOR
PITTSBURGH 143,695 136,217 138,152 139,560 -1,935 (1.4%) 1.0%
MONROEVILLE 12,432 12,612 12,732 12,813 120 0.9% 0.6%
MURRYSVILLE 7,087 7,917 8,100 8,115 183 2.3% 0.1%
TOTAL MONROEVILLE/ MURRYSVILLE CORRIDOR 19,519 20,529 20,832 20,928 1,010 1.4% 0.4%
AIRPORT CORRIDOR
COLLIER 2,168 3,095 3,501 3,714 406 13.1% 6.0%
CRESCENT 891 1,067 1,034 1,020 -33 (3.1%) (1.3%)
MOON 8,441 9,646 10,036 10,252 390 4.0% 2.1%
NORTH FAYETTE 5,003 5,810 6,110 6,276 300 5.1% 2.7%
ROBINSON 4,905 5,652 5,947 6,102 295 5.3% 2.6%
TOTAL AIRPORT CORRIDOR 21,408 25,270 26,628 27,364 1,358 5.3% 2.7%
WASHINGTON CORRIDOR
NORTH STRABANE 3,947 5,432 6,012 6,298 580 10.6% 4.7%
PETERS 6,026 7,292 7,699 7,918 407 5.5% 2.8%
SOUTH STRABANE 3,335 4,256 4,400 4,480 144 3.3% 1.8%
UPPER ST. CLAIRE 6,944 6,976 6,992 7,013 16 0.2% 0.3%
TOTAL WASHINGTON
CORRIDOR 20,252 23,956 25,103 25,709 1,147 4.7% 2.4%
9

CRANBERRY TOWNSHIP MARKET PROFILE: 2018 Market Analysis Update
TABLE 3 – HOUSEHOLD SIZE
SOURCE: U.S. Census Bureau, ESRI’s Business Analyst, and Consultant Calculations
2000 (ACTUAL)
2010 (ACTUAL)
2017 (ESTIMATED)
2022 (PROJECTED)
% CHANGE 2010 TO
2017
% CHANGE 2017-2022
CRANBERRY CORRIDOR
ADAMS 2.84 2.64 2.61 2.60 (1.13%) (0.38%)
CRANBERRY 2.81 2.72 2.73 2.73 (0.36%) 0.00%
JACKSON 2.60 2.50 2.48 2.47 (0.80%) (0.40%)
MARSHALL 3.07 2.86 2.84 2.84 (0.69%) 0.00%
MCCANDLESS 2.49 2.36 2.33 2.32 (1.27%) (0.42%)
PINE 3.14 2.92 2.92 2.93 0.00% 0.34%
SEVEN FIELDS 2.58 2.43 2.41 2.40 (0.82%) (0.41%)
CRANBERRY CORRIDOR AVERAGE 2.79 2.63 2.62 2.61 (0.62%) (0.18%)
PITTSBURGH CORRIDOR PITTSBURGH 2.17 2.07 2.06 2.05 (0.48%) (0.48%)
PITTSBURGH CORRIDOR AVERAGE 2.17 2.07 2.06 2.05 (0.48%) (0.48%)
MONROEVILLE 2.29 2.21 2.19 2.19 (1.36%) 0.00%
MURRYSVILLE 2.63 2.51 2.49 2.49 (0.79%) 0.00%
MONROEVILLE/MURRYSVILLE CORRIDOR AVERAGE 2.46 2.36 2.34 2.34 (1.08%) 0.00%
AIRPORT CORRIDOR COLLIER 2.37 2.28 2.27 2.26 (0.43%) (0.44%)
CRESCENT 2.61 2.47 2.45 2.44 (0.41%) (0.40%)
MOON 2.44 2.37 2.36 2.36 (0.81%) 0.00%
NORTH FAYETTE 2.43 2.40 2.39 2.38 (0.41%) (0.41%)
ROBINSON 2.44 2.31 2.29 2.28 (0.86%) (0.43%)
AIRPORT CORRIDOR AVERAGE 2.46 2.37 2.35 2.34 (0.58%) (0.33%)
WASHINGTON CORRIDOR NORTH STRABANE 2.45 2.43 2.42 2.42 (0.41%) 0.00%
PETERS 2.87 2.88 2.88 2.89 0.00% 0.34%
SOUTH STRABANE 2.34 2.17 2.17 2.16 0.00% (0.46%)
UPPER ST. CLAIRE 2.82 2.75 2.73 2.72 (0.72%) (0.36%)
WASHINGTON CORRIDOR AVERAGE 2.62 2.56 2.55 2.54 (0.28%) (0.16%)
10

CRANBERRY TOWNSHIP MARKET PROFILE: 2018 Market Analysis Update
TABLE 4 – MEDIAN HOUSEHOLD INCOME
SOURCE: U.S. Census Bureau, ESRI’s Business Analyst, and Consultant Calculations
2000 (ACTUAL)
2010 (ESTIMATED)
2017 (ESTIMATED
2022 (PROJECTED)
% CHANGE 2010 TO 2017
% CHANGE
2017 TO 2022
CRANBERRY CORRIDOR
ADAMS $64,382 $78,098 $103,511 $113,706 32.5% 9.8%
CRANBERRY $66,994 $84,007 $104,618 $110,238 24.5% 5.3%
JACKSON $47,155 $55,486 $68,831 $79,085 24.0% 14.9%
MARSHALL $102,270 $121,198 $153,639 $157,571 26.7% 2.5%
MCCANDLESS $62,183 $71,867 $84,261 $92,975 17.2% 10.3%
PINE $86,692 $109,540 $158,389 $165,102 44.5% 4.2%
SEVEN FIELDS $66,818 $79,825 $106,196 $115,273 33.4% 8.5%
TOTAL CRANBERRY CORRIDOR AVERAGE $70,928 $85,717 $111,349 $119,135 28.9% 7.9%
PITTSBURGH CORRIDOR
PITTSBURGH $28,666 $38,446 $40,535 $45,357 5.4% 11.8%
MONROEVILLE/MURRYSVILLE CORRIDOR
MONROEVILLE $44,509 $55,902 $62,288 $69,731 11.4% 11.9%
MURRYSVILLE $63,091 $75,936 $92,609 $99,610 21.1% 7.5%
TOTAL MONROEVILLE/ MURRYSVILLE
CORRIDOR AVERAGE $53,800 $65,919 $77,448 $84,670 16.2% 9.7%
AIRPORT CORRIDOR
COLLIER $41,056 $57,301 $69,039 $80,073 20.4% 15.9%
CRESCENT $49,465 $65,255 $64,382 $76,057 (1.3%) 18.1%
MOON $57,208 $68,592 $77,265 $85,508 12.6% 10.6%
NORTH FAYETTE $51,534 $63,547 $73,206 $81,746 15.2% 11.6%
ROBINSON $55,061 $73,531 $77,605 $87,029 5.5% 12.1%
TOTAL AIRPORT CORRIDOR AVERAGE $50,865 $65,645 $72,299 $82,082 3.0% 21.6%
WASHINGTON CORRIDOR
NORTH STRABANE $50,635 $65,533 $76,719 $83,796 17.0% 9.2%
PETERS $77,100 $89,065 $108,306 $113,576 21.6% 4.8%
SOUTH STRABANE $42,604 $57,769 $59,952 $66,647 3.7% 11.1%
UPPER ST. CLAIRE $85,280 $100,805 $116,830 $121,404 15.9% 3.9%
TOTAL WASHINGTON CORRIDOR AVERAGE $63,905 $78,293 $90,451 $96,355 11.6% 5.8%
11
CRANBERRY TOWNSHIP MARKET PROFILE: 2018 Market Analysis Update
TABLE 5 – OWNER OCCUPIED HOUSING UNITS
SOURCE: U.S. Census Bureau, ESRI’s Business Analyst, and Consultant Calculations
2000 (ACTUAL)
2010 (ACTUAL)
2017 (ESTIMATED)
2022 (PROJECTED)
% CHANGE 2010 TO 2017
% CHANGE 2017-2022
ADAMS 80.70% 80.70% 77.50% 77.50% (3.97%) 0.00%
CRANBERRY 80.70% 79.50% 78.40% 78.20% (1.38%) (0.26%)
JACKSON 78.90% 80.30% 78.90% 78.60% (1.74%) (0.38%)
MARSHALL 90.30% 87.60% 89.10% 89.80% 1.71% 0.79%
MCCANDLESS 74.60% 72.40% 70.50% 70.20% (2.62%) (0.43%)
PINE 92.00% 78.10% 80.30% 81.30% 2.82% 1.25%
SEVEN FIELDS 77.30% 70.00% 67.60% 67.00% (3.43%) (0.89%)
TOTAL CRANBERRY CORRIDOR MEDIAN 80.70% 79.50% 78.40% 77.5% (2.62%) (0.26%)
PITTSBURGH CORRIDOR
PITTSBURGH 45.90% 41.50% 38.80% 38.40% (6.51%) (1.03%)
MONROEVILLE/MURRYSVILLE CORRIDOR
MONROEVILLE 65.40% 63.00% 61.10% 61.00% (3.02%) (0.16%)
MURRYSVILLE 85.30% 84.30% 82.40% 81.70% (2.25%) (0.85%)
TOTAL MONROEVILLE/MURRYSVILLE CORRIDOR MEDIAN 75.35% 73.65% 71.70% 71.30% (2.30%) (0.51%)
AIRPORT CORRIDOR
COLLIER 85.40% 75.20% 76.90% 77.80% 2.26% 1.17%
CRESCENT 81.80% 78.90% 74.80% 73.70% (5.20%) (1.47%)
MOON 68.00% 66.20% 65.20% 65.20% (1.51%) 0.00%
NORTH FAYETTE 71.30% 71.80% 71.50% 71.80% (0.42%) 0.42%
ROBINSON 73.80% 68.00% 67.60% 68.20% (0.59%) 0.89%
TOTAL AIRPORT CORRIDOR MEDIAN 73.80% 71.80% 71.50% 68.20% (0.14%) 0.84%
WASHINGTON CORRIDOR
NORTH STRABANE 85.80% 84.20% 83.80% 83.60% (0.48%) (0.24%)
PETERS 91.30% 90.90% 90.30% 90.00% (0.66%) (0.33%)
SOUTH STRABANE 73.50% 64.70% 63.10% 62.60% (2.47%) (0.79%)
UPPER ST. CLAIRE 91.00% 88.10% 86.60% 86.20% (1.70%) (0.46%)
TOTAL WASHINGTON CORRIDOR MEDIAN 88.40% 86.15% 85.20% 84.90% (0.58%) (0.06%)
12
CRANBERRY TOWNSHIP MARKET PROFILE: 2018 Market Analysis Update
TABLE 6 – MEDIAN AGE
SOURCE: U.S. Census Bureau, ESRI’s Business Analyst, and Consultant Calculations
2000 (ACTUAL)
2010 (ACTUAL)
2017 (ESTIMATED)
2022 (PROJECTED)
% CHANGE 2010 -2017
% CHANGE 2017 TO
2022
CRANBERRY CORRIDOR
ADAMS 36.2 40.1 41.4 43.4 3.2% 4.8%
CRANBERRY 34.7 37.7 39.0 41.2 3.4% 5.6%
JACKSON 40.8 47.4 50.2 51.4 5.9% 2.3%
MARSHALL 37.4 41.3 42.8 44.6 3.6% 4.2%
MCCANDLESS 40.3 44 45.8 46.7 4.0% 1.9%
PINE 37.1 38.3 39.5 41.5 3.1% 5.0%
SEVEN FIELDS 33.3 36 37.6 39.7 4.4% 5.5%
CRANBERRY CORRIDOR MEDIAN 37.1 40.1 41.2 41.5 3.6% 4.8%
PITTSBURGH CORRIDOR
PITTSBURGH 35.5 33.5 34.6 35.5 3.2% 2.6%
MONROEVILLE/MURRYSVILLE CORRIDOR
MONROEVILLE 42.6 45.9 47.4 48.2 3.2% 1.6%
MURRYSVILLE 42.6 47.2 49.6 51.1 5.0% 3.0%
MONROEVILLE/ MURRYSVILLE CORRIDOR MEDIAN 42.6 46.6 48.5 48.6 4.1% 2.3%
AIRPORT CORRIDOR
COLLIER 46 46.9 49.5 50.6 5.5% 2.2%
CRESCENT 38.6 43 45.6 47 6.0% 3.0%
MOON 37.7 38.8 40.1 41.5 3.3% 3.4%
NORTH FAYETTE 35.6 37.9 39.5 39.9 4.2% 1.0%
ROBINSON 39.9 42.3 43.8 44.7 3.5% 2.0%
AIRPORT CORRIDOR MEDIAN 38.6 42.3 43.8 44.7 4.2% 2.2%
WASHINGTON CORRIDOR
NORTH STRABANE 40.3 42.8 44.7 46.1 4.4% 3.1%
PETERS 40.6 42.8 44.7 45.8 4.4% 2.4%
SOUTH STRABANE 44.7 48.6 50.4 51.6 3.7% 2.3%
UPPER ST. CLAIRE 42.0 44.1 45.8 46.6 3.8% 1.7%
WASHINGTON CORRIDOR MEDIAN 41.3 43.5 45.2 46.2 4.1% 2.4%
13
CRANBERRY TOWNSHIP MARKET PROFILE: 2018 Market Analysis Update
TABLE 7 – DIVERSITY INDEX
SOURCE: ESRI’s Business Analyst
2000 (ACTUAL)
2010 (ACTUAL)
2017 (ESTIMATED)
2022 (PROJECTED)
% CHANGE 2010TO 2017
% CHANGE 2017-2022
CRANBERRY CORRIDOR
ADAMS 5.7 11.4 14.3 16.8 25.4% 17.4%
CRANBERRY 7.7 13.5 16.8 19.8 24.4% 17.8%
JACKSON 4.5 6.1 8.1 10.1 32.7% 24.6%
MARSHALL 9.2 21.3 28.0 33.5 31.4% 19.6%
MCCANDLESS 11.7 17.2 22.4 26.8 30.2% 19.6%
PINE 7.0 16.5 21.4 25.8 29.7% 20.5%
SEVEN FIELDS 10.0 16.3 20.1 23.5 23.3% 16.9%
AVERAGE CRANBERRY CORRIDOR 8.0 14.6 18.7 22.3 28.2% 19.5%
PITTSBURGH CORRIDOR
PITTSBURGH 48.2 51.7 55.5 58.4 7.3% 5.2%
MONROEVILLE/MURRYSVILLE CORRIDOR
MONROEVILLE 27.0 37.0 42.4 46.7 14.5% 10.1%
MURRYSVILLE 10.0 13.8 17.4 20.4 26.0% 17.2%
AVERAGE MONROEVILLE/MURRYSVILLE CORRIDOR 18.5 25.4 29.9 30.6 20.34% 13.69%
AIRPORT CORRIDOR
COLLIER 4.5 12.7 17.0 20.6 33.86% 21.18%
CRESCENT 6.9 12.5 16.0 19.3 28.00% 20.63%
MOON 14.7 22.3 27.5 31.8 23.32% 15.64%
NORTH FAYETTE 13.0 16.0 19.8 23.2 23.75% 17.17%
ROBINSON 10.5 18.6 23.5 27.7 26.34% 17.87%
AVERAGE AIRPORT CORRIDOR 9.9 16.4 20.76 24.52 27.05% 18.49%
WASHINGTON CORRIDOR
NORTH STRABANE 8.1 9.9 13.1 15.9 32.3% 21.3%
PETERS 5.7 10.1 14.8 18.7 46.5% 26.3%
SOUTH STRABANE 6.1 9.8 12.9 15.6 31.6% 20.9%
UPPER ST. CLAIRE 11.8 17 22.6 27.4 32.9% 21.2%
AVERAGE WASHINGTON CORRIDOR 7.9 11.7 15.85 19.4 35.8% 25.2%
14
CRANBERRY TOWNSHIP MARKET PROFILE: 2018 Market Analysis Update
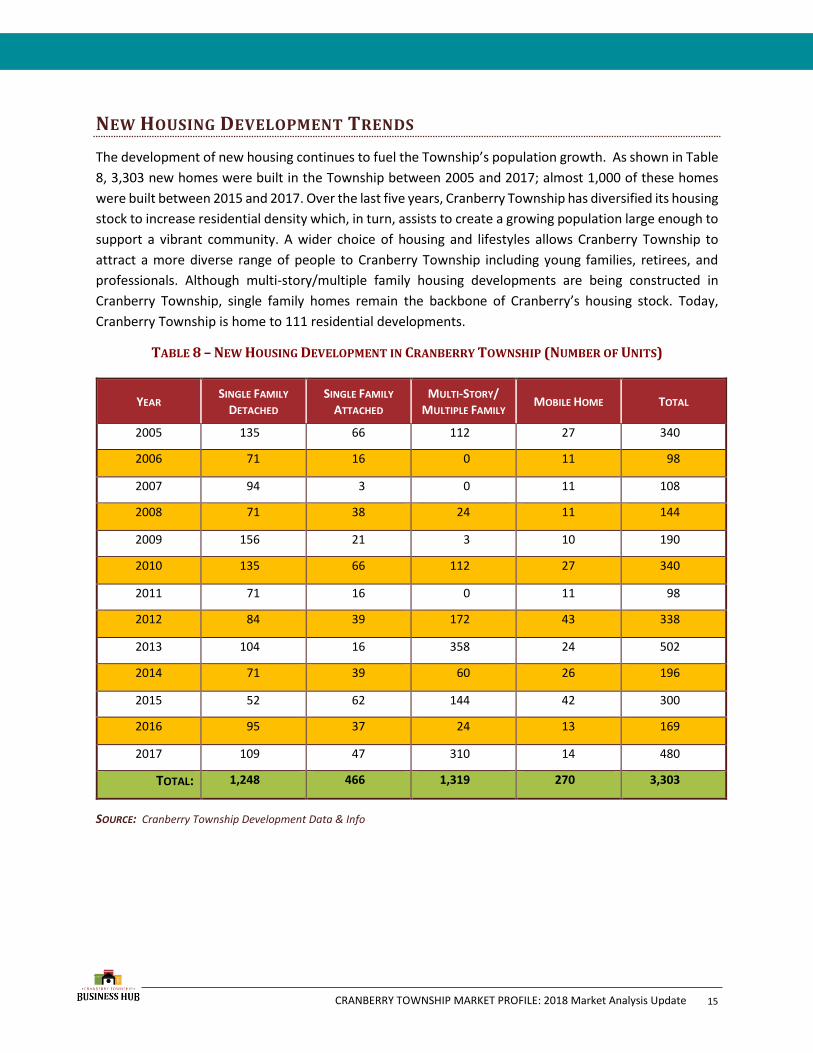
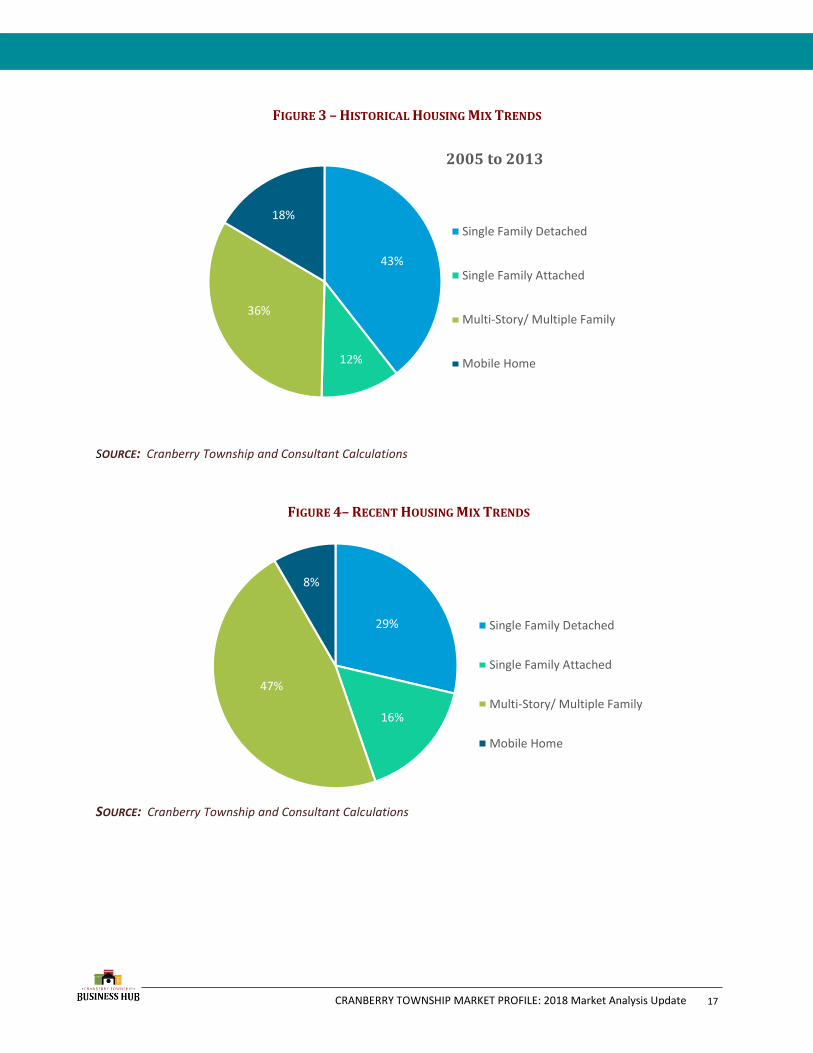
NEW HOUSING DEVELOPMENT TRENDS
The development of new housing continues to fuel the Township’s population growth. As shown in Table
8, 3,303 new homes were built in the Township between 2005 and 2017; almost 1,000 of these homes
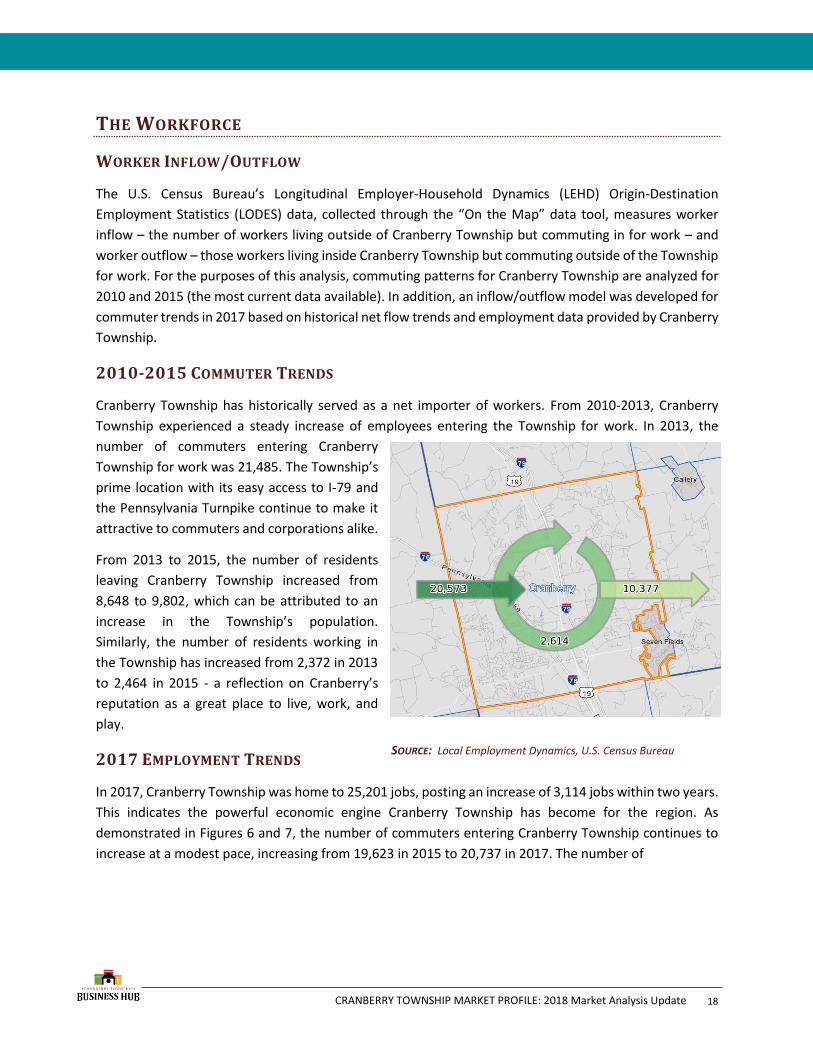
were built between 2015 and 2017. Over the last five years, Cranberry Township has diversified its housing
stock to increase residential density which, in turn, assists to create a growing population large enough to
support a vibrant community. A wider choice of housing and lifestyles allows Cranberry Township to
attract a more diverse range of people to Cranberry Township including young families, retirees, and
professionals. Although multi-story/multiple family housing developments are being constructed in
Cranberry Township, single family homes remain the backbone of Cranberry’s housing stock. Today,
Cranberry Township is home to 111 residential developments.
TABLE 8 – NEW HOUSING DEVELOPMENT IN CRANBERRY TOWNSHIP (NUMBER OF UNITS)
YEAR SINGLE FAMILY
DETACHED SINGLE FAMILY
ATTACHED MULTI-STORY/
MULTIPLE FAMILY MOBILE HOME TOTAL
2005 135 66 112 27 340
2006 71 16 0 11 98
2007 94 3 0 11 108
2008 71 38 24 11 144
2009 156 21 3 10 190
2010 135 66 112 27 340
2011 71 16 0 11 98
2012 84 39 172 43 338
2013 104 16 358 24 502
2014 71 39 60 26 196
2015 52 62 144 42 300
2016 95 37 24 13 169
2017 109 47 310 14 480
TOTAL: 1,248 466 1,319 270 3,303
SOURCE: Cranberry Township Development Data & Info
15
CRANBERRY TOWNSHIP MARKET PROFILE: 2018 Market Analysis Update
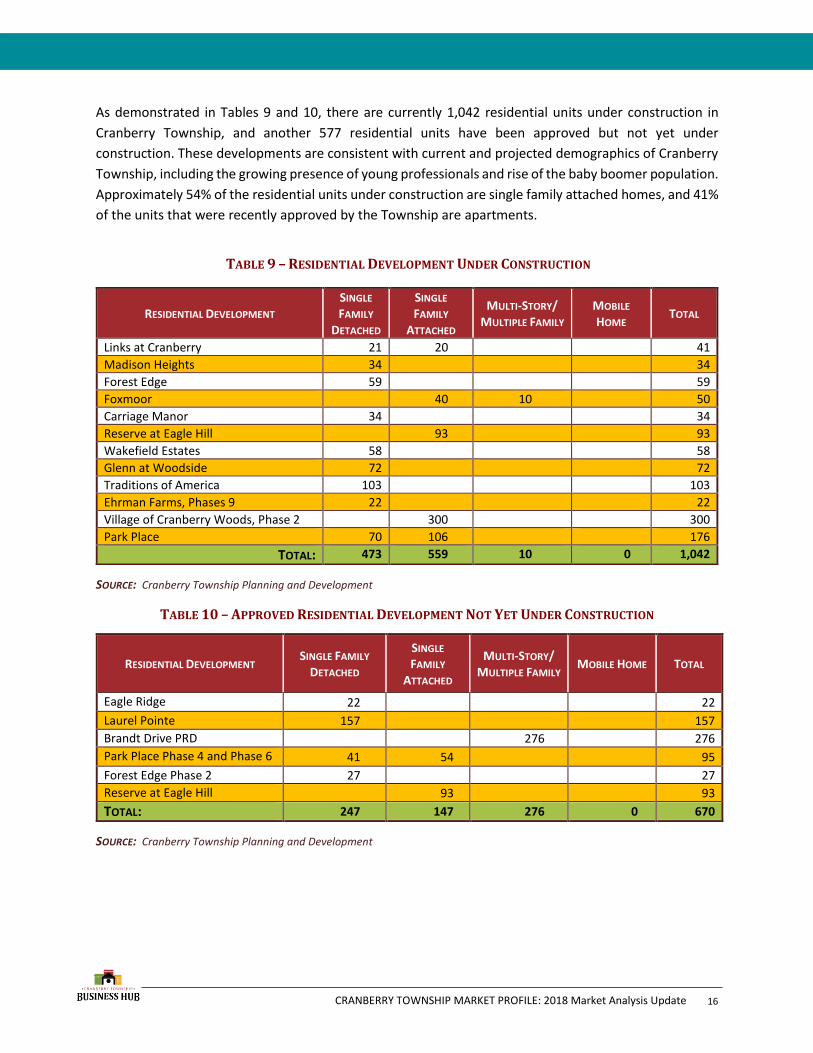
As demonstrated in Tables 9 and 10, there are currently 1,042 residential units under construction in
Cranberry Township, and another 577 residential units have been approved but not yet under
construction. These developments are consistent with current and projected demographics of Cranberry
Township, including the growing presence of young professionals and rise of the baby boomer population.
Approximately 54% of the residential units under construction are single family attached homes, and 41%
of the units that were recently approved by the Township are apartments.
TABLE 9 – RESIDENTIAL DEVELOPMENT UNDER CONSTRUCTION
SOURCE: Cranberry Township Planning and Development
TABLE 10 – APPROVED RESIDENTIAL DEVELOPMENT NOT YET UNDER CONSTRUCTION
SOURCE: Cranberry Township Planning and Development
RESIDENTIAL DEVELOPMENT SINGLE
FAMILY
DETACHED
SINGLE
FAMILY
ATTACHED
MULTI-STORY/
MULTIPLE FAMILY MOBILE
HOME TOTAL
Links at Cranberry 21 20 41
Madison Heights 34 34
Forest Edge 59 59
Foxmoor 40 10 50
Carriage Manor 34 34
Reserve at Eagle Hill 93 93
Wakefield Estates 58 58
Glenn at Woodside 72 72
Traditions of America 103 103
Ehrman Farms, Phases 9 22 22
Village of Cranberry Woods, Phase 2 300 300
Park Place 70 106 176
TOTAL: 473 559 10 0 1,042
RESIDENTIAL DEVELOPMENT SINGLE FAMILY
DETACHED
SINGLE
FAMILY
ATTACHED
MULTI-STORY/
MULTIPLE FAMILY MOBILE HOME TOTAL
Eagle Ridge 22 22
Laurel Pointe 157 157
Brandt Drive PRD 276 276
Park Place Phase 4 and Phase 6 41 54 95
Forest Edge Phase 2 27 27
Reserve at Eagle Hill 93 93
TOTAL: 247 147 276 0 670
16
CRANBERRY TOWNSHIP MARKET PROFILE: 2018 Market Analysis Update
FIGURE 3 – HISTORICAL HOUSING MIX TRENDS
SOURCE: Cranberry Township and Consultant Calculations
SOURCE: Cranberry Township and Consultant Calculations
43%
12%
36%
18%Single Family Detached
Single Family Attached
Multi-Story/ Multiple Family
Mobile Home
2005 to 2013
29%
16%
47%
8%
Single Family Detached
Single Family Attached
Multi-Story/ Multiple Family
Mobile Home
FIGURE 4– RECENT HOUSING MIX TRENDS
17
CRANBERRY TOWNSHIP MARKET PROFILE: 2018 Market Analysis Update
THE WORKFORCE
WORKER INFLOW/OUTFLOW
The U.S. Census Bureau’s Longitudinal Employer-Household Dynamics (LEHD) Origin-Destination
Employment Statistics (LODES) data, collected through the “On the Map” data tool, measures worker
inflow – the number of workers living outside of Cranberry Township but commuting in for work – and
worker outflow – those workers living inside Cranberry Township but commuting outside of the Township
for work. For the purposes of this analysis, commuting patterns for Cranberry Township are analyzed for
2010 and 2015 (the most current data available). In addition, an inflow/outflow model was developed for
commuter trends in 2017 based on historical net flow trends and employment data provided by Cranberry
Township.
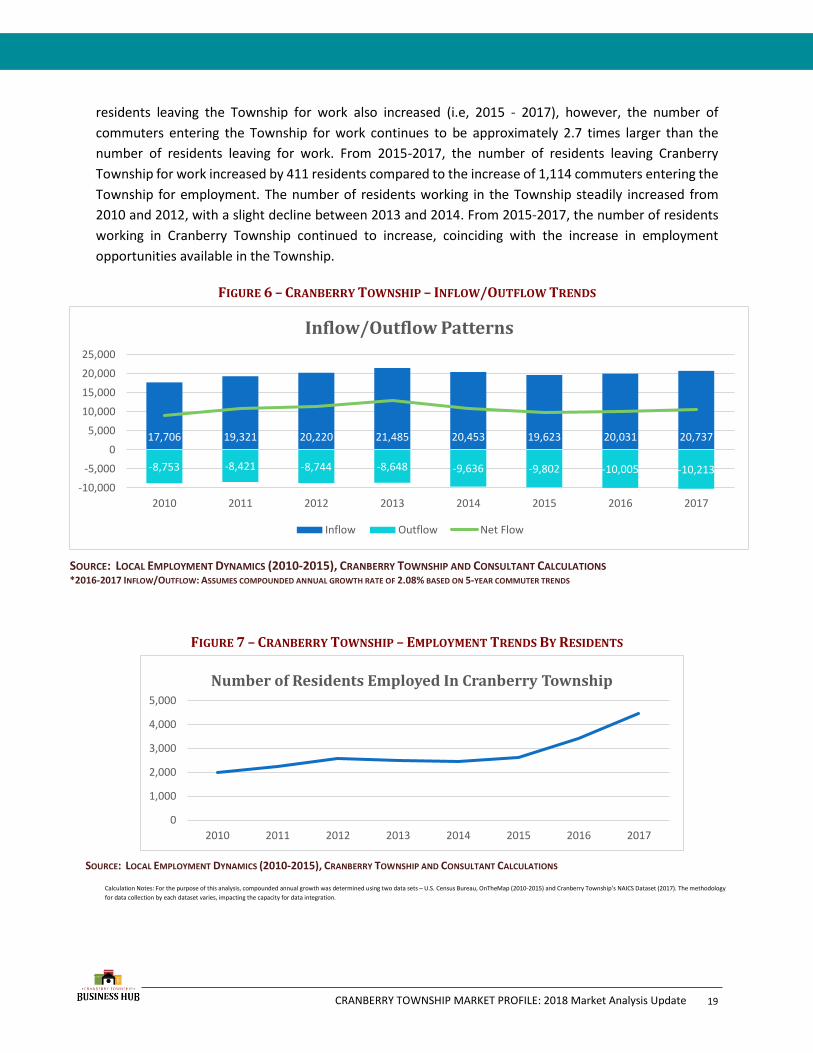
2010-2015 COMMUTER TRENDS
Cranberry Township has historically served as a net importer of workers. From 2010-2013, Cranberry
Township experienced a steady increase of employees entering the Township for work. In 2013, the
number of commuters entering Cranberry
Township for work was 21,485. The Township’s
prime location with its easy access to I-79 and
the Pennsylvania Turnpike continue to make it
attractive to commuters and corporations alike.
From 2013 to 2015, the number of residents
leaving Cranberry Township increased from
8,648 to 9,802, which can be attributed to an
increase in the Township’s population.
Similarly, the number of residents working in
the Township has increased from 2,372 in 2013
to 2,464 in 2015 - a reflection on Cranberry’s
reputation as a great place to live, work, and
play.
2017 EMPLOYMENT TRENDS
In 2017, Cranberry Township was home to 25,201 jobs, posting an increase of 3,114 jobs within two years.
This indicates the powerful economic engine Cranberry Township has become for the region. As
demonstrated in Figures 6 and 7, the number of commuters entering Cranberry Township continues to
increase at a modest pace, increasing from 19,623 in 2015 to 20,737 in 2017. The number of
FIGURE 5 – CRANBERRY TOWNSHIP INFLOW/OUTFLOW (2015)
SOURCE: Local Employment Dynamics, U.S. Census Bureau
18
CRANBERRY TOWNSHIP MARKET PROFILE: 2018 Market Analysis Update
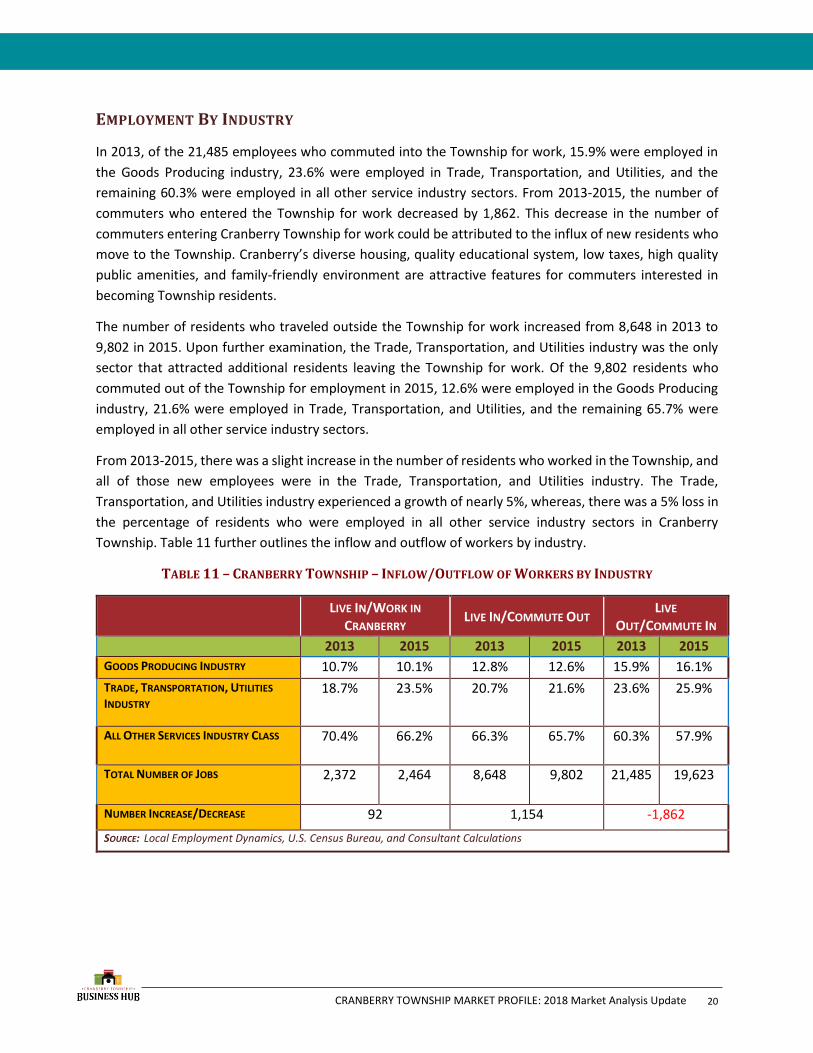
residents leaving the Township for work also increased (i.e, 2015 - 2017), however, the number of
commuters entering the Township for work continues to be approximately 2.7 times larger than the
number of residents leaving for work. From 2015-2017, the number of residents leaving Cranberry
Township for work increased by 411 residents compared to the increase of 1,114 commuters entering the
Township for employment. The number of residents working in the Township steadily increased from
2010 and 2012, with a slight decline between 2013 and 2014. From 2015-2017, the number of residents
working in Cranberry Township continued to increase, coinciding with the increase in employment
opportunities available in the Township.
FIGURE 6 – CRANBERRY TOWNSHIP – INFLOW/OUTFLOW TRENDS
FIGURE 7 – CRANBERRY TOWNSHIP – EMPLOYMENT TRENDS BY RESIDENTS
SOURCE: LOCAL EMPLOYMENT DYNAMICS (2010-2015), CRANBERRY TOWNSHIP AND CONSULTANT CALCULATIONS *2016-2017 INFLOW/OUTFLOW: ASSUMES COMPOUNDED ANNUAL GROWTH RATE OF 2.08% BASED ON 5-YEAR COMMUTER TRENDS
17,706 19,321 20,220 21,485 20,453 19,623 20,031 20,737
-8,753 -8,421 -8,744 -8,648 -9,636 -9,802 -10,005 -10,213
-10,000
-5,000
0
5,000
10,000
15,000
20,000
25,000
2010 2011 2012 2013 2014 2015 2016 2017
Inflow/Outflow Patterns
Inflow Outflow Net Flow
0
1,000
2,000
3,000
4,000
5,000
2010 2011 2012 2013 2014 2015 2016 2017
Number of Residents Employed In Cranberry Township
SOURCE: LOCAL EMPLOYMENT DYNAMICS (2010-2015), CRANBERRY TOWNSHIP AND CONSULTANT CALCULATIONS
Calculation Notes: For the purpose of this analysis, compounded annual growth was determined using two data sets – U.S. Census Bureau, OnTheMap (2010-2015) and Cranberry Township’s NAICS Dataset (2017). The methodology
for data collection by each dataset varies, impacting the capacity for data integration.
19
CRANBERRY TOWNSHIP MARKET PROFILE: 2018 Market Analysis Update
EMPLOYMENT BY INDUSTRY
In 2013, of the 21,485 employees who commuted into the Township for work, 15.9% were employed in
the Goods Producing industry, 23.6% were employed in Trade, Transportation, and Utilities, and the
remaining 60.3% were employed in all other service industry sectors. From 2013-2015, the number of
commuters who entered the Township for work decreased by 1,862. This decrease in the number of
commuters entering Cranberry Township for work could be attributed to the influx of new residents who
move to the Township. Cranberry’s diverse housing, quality educational system, low taxes, high quality
public amenities, and family-friendly environment are attractive features for commuters interested in
becoming Township residents.
The number of residents who traveled outside the Township for work increased from 8,648 in 2013 to
9,802 in 2015. Upon further examination, the Trade, Transportation, and Utilities industry was the only
sector that attracted additional residents leaving the Township for work. Of the 9,802 residents who
commuted out of the Township for employment in 2015, 12.6% were employed in the Goods Producing
industry, 21.6% were employed in Trade, Transportation, and Utilities, and the remaining 65.7% were
employed in all other service industry sectors.
From 2013-2015, there was a slight increase in the number of residents who worked in the Township, and
all of those new employees were in the Trade, Transportation, and Utilities industry. The Trade,
Transportation, and Utilities industry experienced a growth of nearly 5%, whereas, there was a 5% loss in
the percentage of residents who were employed in all other service industry sectors in Cranberry
Township. Table 11 further outlines the inflow and outflow of workers by industry.
TABLE 11 – CRANBERRY TOWNSHIP – INFLOW/OUTFLOW OF WORKERS BY INDUSTRY
LIVE IN/WORK IN
CRANBERRY LIVE IN/COMMUTE OUT
LIVE
OUT/COMMUTE IN
2013 2015 2013 2015 2013 2015
GOODS PRODUCING INDUSTRY 10.7% 10.1% 12.8% 12.6% 15.9% 16.1%
TRADE, TRANSPORTATION, UTILITIES
INDUSTRY 18.7% 23.5% 20.7% 21.6% 23.6% 25.9%
ALL OTHER SERVICES INDUSTRY CLASS 70.4% 66.2% 66.3% 65.7% 60.3% 57.9%
TOTAL NUMBER OF JOBS 2,372 2,464 8,648 9,802 21,485 19,623
NUMBER INCREASE/DECREASE 92 1,154 -1,862
SOURCE: Local Employment Dynamics, U.S. Census Bureau, and Consultant Calculations
20
CRANBERRY TOWNSHIP MARKET PROFILE: 2018 Market Analysis Update
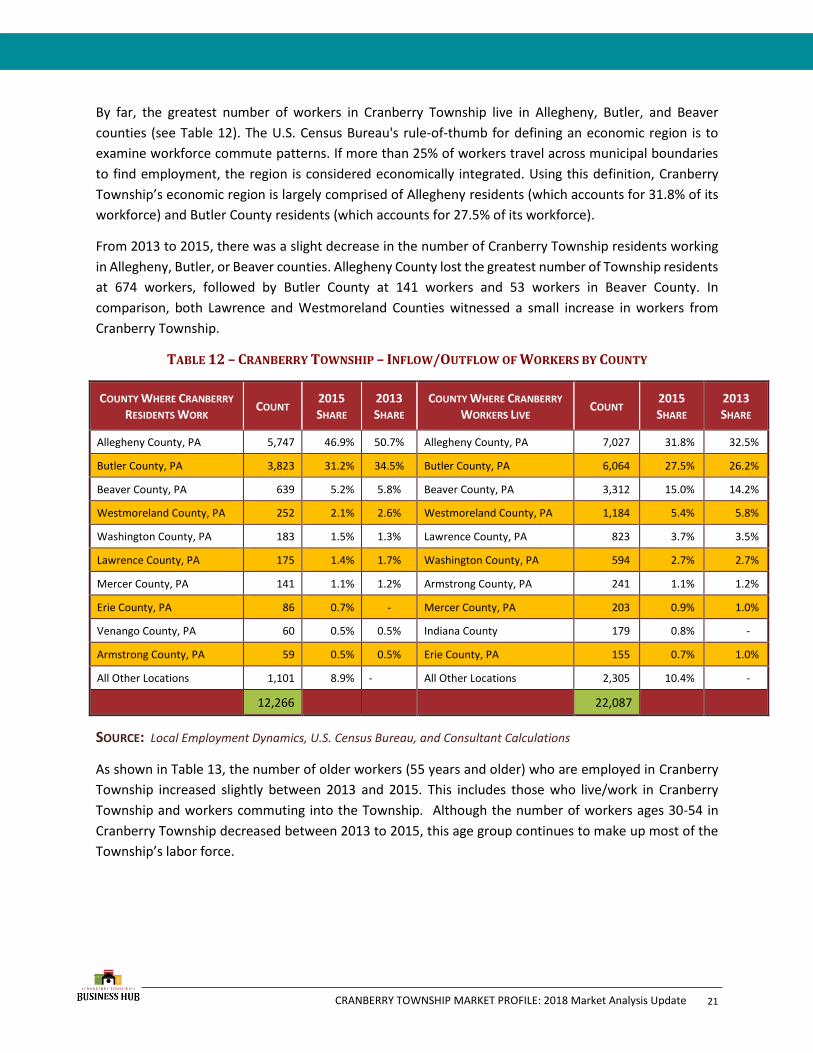
By far, the greatest number of workers in Cranberry Township live in Allegheny, Butler, and Beaver
counties (see Table 12). The U.S. Census Bureau's rule-of-thumb for defining an economic region is to
examine workforce commute patterns. If more than 25% of workers travel across municipal boundaries
to find employment, the region is considered economically integrated. Using this definition, Cranberry
Township’s economic region is largely comprised of Allegheny residents (which accounts for 31.8% of its
workforce) and Butler County residents (which accounts for 27.5% of its workforce).
From 2013 to 2015, there was a slight decrease in the number of Cranberry Township residents working
in Allegheny, Butler, or Beaver counties. Allegheny County lost the greatest number of Township residents
at 674 workers, followed by Butler County at 141 workers and 53 workers in Beaver County. In
comparison, both Lawrence and Westmoreland Counties witnessed a small increase in workers from
Cranberry Township.
TABLE 12 – CRANBERRY TOWNSHIP – INFLOW/OUTFLOW OF WORKERS BY COUNTY
COUNTY WHERE CRANBERRY
RESIDENTS WORK COUNT
2015 SHARE
2013
SHARE COUNTY WHERE CRANBERRY
WORKERS LIVE COUNT
2015 SHARE
2013
SHARE
Allegheny County, PA 5,747 46.9% 50.7% Allegheny County, PA 7,027 31.8% 32.5%
Butler County, PA 3,823 31.2% 34.5% Butler County, PA 6,064 27.5% 26.2%
Beaver County, PA 639 5.2% 5.8% Beaver County, PA 3,312 15.0% 14.2%
Westmoreland County, PA 252 2.1% 2.6% Westmoreland County, PA 1,184 5.4% 5.8%
Washington County, PA 183 1.5% 1.3% Lawrence County, PA 823 3.7% 3.5%
Lawrence County, PA 175 1.4% 1.7% Washington County, PA 594 2.7% 2.7%
Mercer County, PA 141 1.1% 1.2% Armstrong County, PA 241 1.1% 1.2%
Erie County, PA 86 0.7% - Mercer County, PA 203 0.9% 1.0%
Venango County, PA 60 0.5% 0.5% Indiana County 179 0.8% -
Armstrong County, PA 59 0.5% 0.5% Erie County, PA 155 0.7% 1.0%
All Other Locations 1,101 8.9% - All Other Locations 2,305 10.4% -
12,266 22,087
SOURCE: Local Employment Dynamics, U.S. Census Bureau, and Consultant Calculations
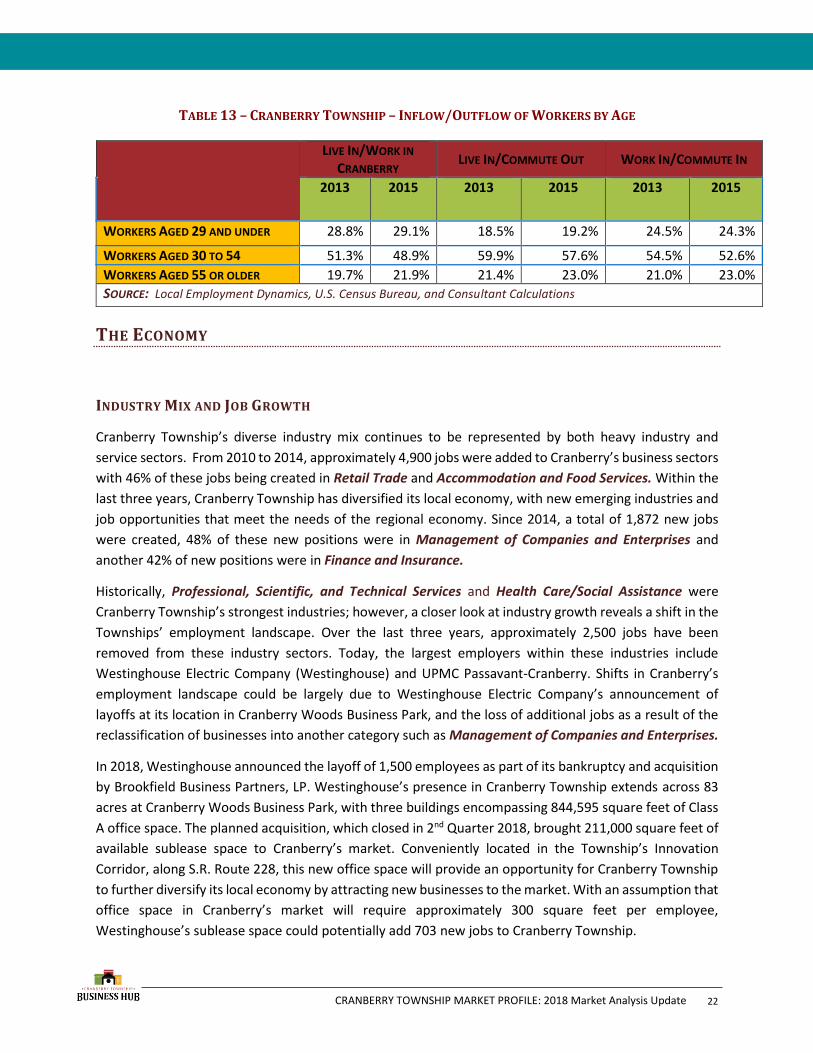
As shown in Table 13, the number of older workers (55 years and older) who are employed in Cranberry
Township increased slightly between 2013 and 2015. This includes those who live/work in Cranberry
Township and workers commuting into the Township. Although the number of workers ages 30-54 in
Cranberry Township decreased between 2013 to 2015, this age group continues to make up most of the
Township’s labor force.
21
CRANBERRY TOWNSHIP MARKET PROFILE: 2018 Market Analysis Update
TABLE 13 – CRANBERRY TOWNSHIP – INFLOW/OUTFLOW OF WORKERS BY AGE
LIVE IN/WORK IN
CRANBERRY LIVE IN/COMMUTE OUT WORK IN/COMMUTE IN
2013 2015 2013 2015 2013 2015
WORKERS AGED 29 AND UNDER 28.8% 29.1% 18.5% 19.2% 24.5% 24.3%
WORKERS AGED 30 TO 54 51.3% 48.9% 59.9% 57.6% 54.5% 52.6%
WORKERS AGED 55 OR OLDER 19.7% 21.9% 21.4% 23.0% 21.0% 23.0%
SOURCE: Local Employment Dynamics, U.S. Census Bureau, and Consultant Calculations
THE ECONOMY
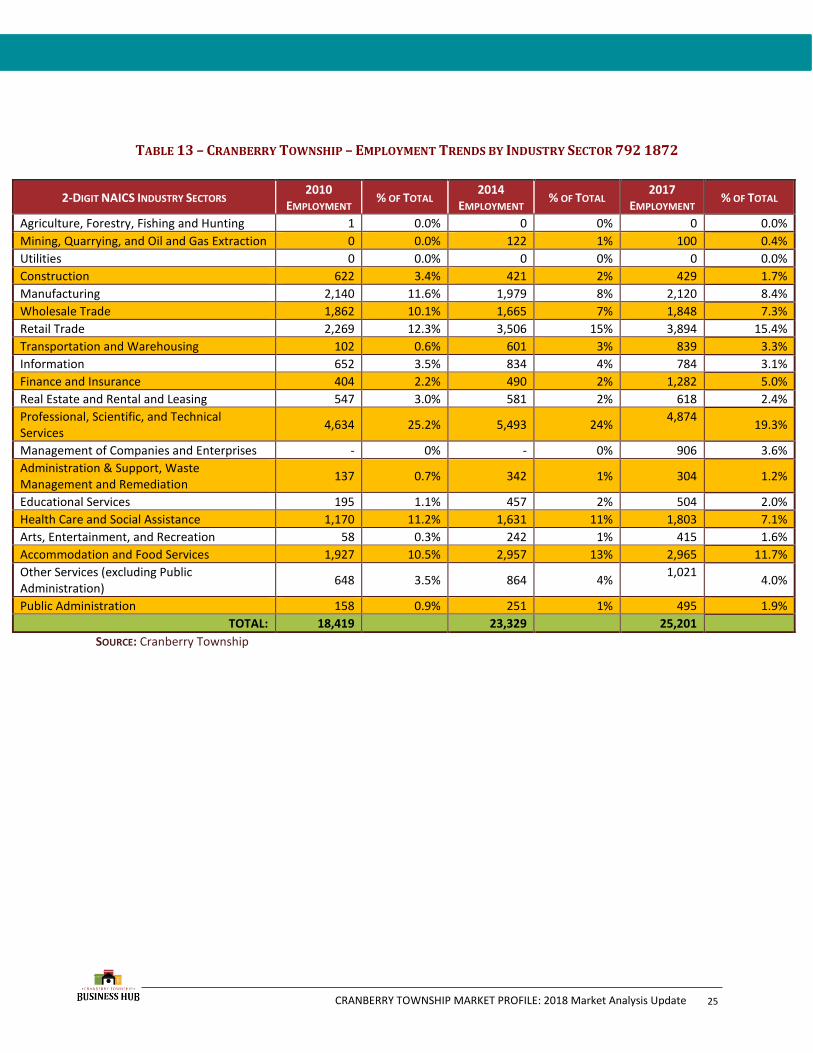
INDUSTRY MIX AND JOB GROWTH
Cranberry Township’s diverse industry mix continues to be represented by both heavy industry and
service sectors. From 2010 to 2014, approximately 4,900 jobs were added to Cranberry’s business sectors
with 46% of these jobs being created in Retail Trade and Accommodation and Food Services. Within the
last three years, Cranberry Township has diversified its local economy, with new emerging industries and
job opportunities that meet the needs of the regional economy. Since 2014, a total of 1,872 new jobs
were created, 48% of these new positions were in Management of Companies and Enterprises and
another 42% of new positions were in Finance and Insurance.
Historically, Professional, Scientific, and Technical Services and Health Care/Social Assistance were
Cranberry Township’s strongest industries; however, a closer look at industry growth reveals a shift in the
Townships’ employment landscape. Over the last three years, approximately 2,500 jobs have been
removed from these industry sectors. Today, the largest employers within these industries include
Westinghouse Electric Company (Westinghouse) and UPMC Passavant-Cranberry. Shifts in Cranberry’s
employment landscape could be largely due to Westinghouse Electric Company’s announcement of
layoffs at its location in Cranberry Woods Business Park, and the loss of additional jobs as a result of the
reclassification of businesses into another category such as Management of Companies and Enterprises.
In 2018, Westinghouse announced the layoff of 1,500 employees as part of its bankruptcy and acquisition
by Brookfield Business Partners, LP. Westinghouse’s presence in Cranberry Township extends across 83
acres at Cranberry Woods Business Park, with three buildings encompassing 844,595 square feet of Class
A office space. The planned acquisition, which closed in 2nd Quarter 2018, brought 211,000 square feet of
available sublease space to Cranberry’s market. Conveniently located in the Township’s Innovation
Corridor, along S.R. Route 228, this new office space will provide an opportunity for Cranberry Township
to further diversify its local economy by attracting new businesses to the market. With an assumption that
office space in Cranberry’s market will require approximately 300 square feet per employee,
Westinghouse’s sublease space could potentially add 703 new jobs to Cranberry Township.
22
CRANBERRY TOWNSHIP MARKET PROFILE: 2018 Market Analysis Update
The following are additional highlights of changes within the Township’s industry sectors during this same
period:
• A large gain in employment included the Management of Companies and Enterprises (906 jobs).
• Retail Trade added 338 jobs from 2014 to 2017; it represents the second largest share of jobs within
the Township (15%).
• Professional, Scientific, and Technical Services continues to provide the largest share of jobs within
the Township (19%).
• Transportation and Warehousing gained 238 new jobs from 2014 to 2017. This industry has
undergone rapid expansion in the last seven years with a total of 737 new positions. This significant
increase in activity, 238 jobs, could be a result of:
o E-commerce growth and increased number of competitors.
o
o Cranberry’s proximity to major market areas in the Mid-Atlantic region, and access to major
transportation and commercial shipping arteries.
• Healthcare and Social Assistance gained 172 jobs from 2014 to 2017; representing a 10.5% increase
in jobs. Cranberry Township’s job growth within this sector is nearly double the national growth rate
of 5.6%. 1
• Mining, Quarrying, and Oil and Gas Extraction Sectors lost 22 jobs from 2014 to 2017; however, this
sector could continue to expand within the next few years, based on the Marcellus Shale drilling
activities, and the proposed cracker plant in Beaver County.
1 Bureau of Labor Statistics, Employment, Hours, and Earnings from the Current Employment Statistics – All Employees Health Care and Social Assistance. 2008-2018.
23

CRANBERRY TOWNSHIP MARKET PROFILE: 2018 Market Analysis Update
FIGURE 7 – JOB GROWTH/LOSS BY INDUSTRY SECTOR IN CRANBERRY TOWNSHIP
SOURCE: Cranberry Township *SHIFTS IN THIS SECTOR COULD BE LARGELY ATTRIBUTED TO WESTINGHOUS ELECTRIC COMPANY’S ANNOUNCED LAYOFFS AT ITS LOCATION IN
CRANBERRY WOODS BUSINESS PARK. THE LOSS OF ADDITIONAL JOBS IS DUE TO THE RECLASSIFICATION OF BUSINESSES INTO OTHER INDUSTRY SECTORS SHOWN HERE.
-800 -600 -400 -200 0 200 400 600 800 1000
Agriculture, Forestry, Fishing and Hunting
Mining, Quarrying, and Oil and Gas Extraction
Utilities
Construction
Manufacturing
Whoelsale Trade
Retail Trade
Transportation and Warehousing
Information
Finance and Insurance
Real Estate and Rental and Leasing
Professional, Scientific, and Technical Services
Management of Companies and Enterprises
Administration & Support, Waste Management and Remediation
Educational Services
Health Care and Social Assistance
Arts, Entertainment, and Recreation
Accomoodation and Food Services
Other Services (excluding Public Administration)
Public Administration
Job Growth and Loss by Industry Sector 2014 to 2017
24
CRANBERRY TOWNSHIP MARKET PROFILE: 2018 Market Analysis Update
TABLE 13 – CRANBERRY TOWNSHIP – EMPLOYMENT TRENDS BY INDUSTRY SECTOR 792 1872
SOURCE: Cranberry Township
2-DIGIT NAICS INDUSTRY SECTORS 2010
EMPLOYMENT % OF TOTAL
2014
EMPLOYMENT % OF TOTAL
2017
EMPLOYMENT % OF TOTAL
Agriculture, Forestry, Fishing and Hunting 1 0.0% 0 0% 0 0.0%
Mining, Quarrying, and Oil and Gas Extraction 0 0.0% 122 1% 100 0.4%
Utilities 0 0.0% 0 0% 0 0.0%
Construction 622 3.4% 421 2% 429 1.7%
Manufacturing 2,140 11.6% 1,979 8% 2,120 8.4%
Wholesale Trade 1,862 10.1% 1,665 7% 1,848 7.3%
Retail Trade 2,269 12.3% 3,506 15% 3,894 15.4%
Transportation and Warehousing 102 0.6% 601 3% 839 3.3%
Information 652 3.5% 834 4% 784 3.1%
Finance and Insurance 404 2.2% 490 2% 1,282 5.0%
Real Estate and Rental and Leasing 547 3.0% 581 2% 618 2.4%
Professional, Scientific, and Technical Services
4,634 25.2% 5,493 24% 4,874
19.3%
Management of Companies and Enterprises - 0% - 0% 906 3.6%
Administration & Support, Waste Management and Remediation
137 0.7% 342 1% 304 1.2%
Educational Services 195 1.1% 457 2% 504 2.0%
Health Care and Social Assistance 1,170 11.2% 1,631 11% 1,803 7.1%
Arts, Entertainment, and Recreation 58 0.3% 242 1% 415 1.6%
Accommodation and Food Services 1,927 10.5% 2,957 13% 2,965 11.7%
Other Services (excluding Public Administration)
648 3.5% 864 4% 1,021
4.0%
Public Administration 158 0.9% 251 1% 495 1.9%
TOTAL: 18,419 23,329 25,201
25
CRANBERRY TOWNSHIP MARKET PROFILE: 2018 Market Analysis Update
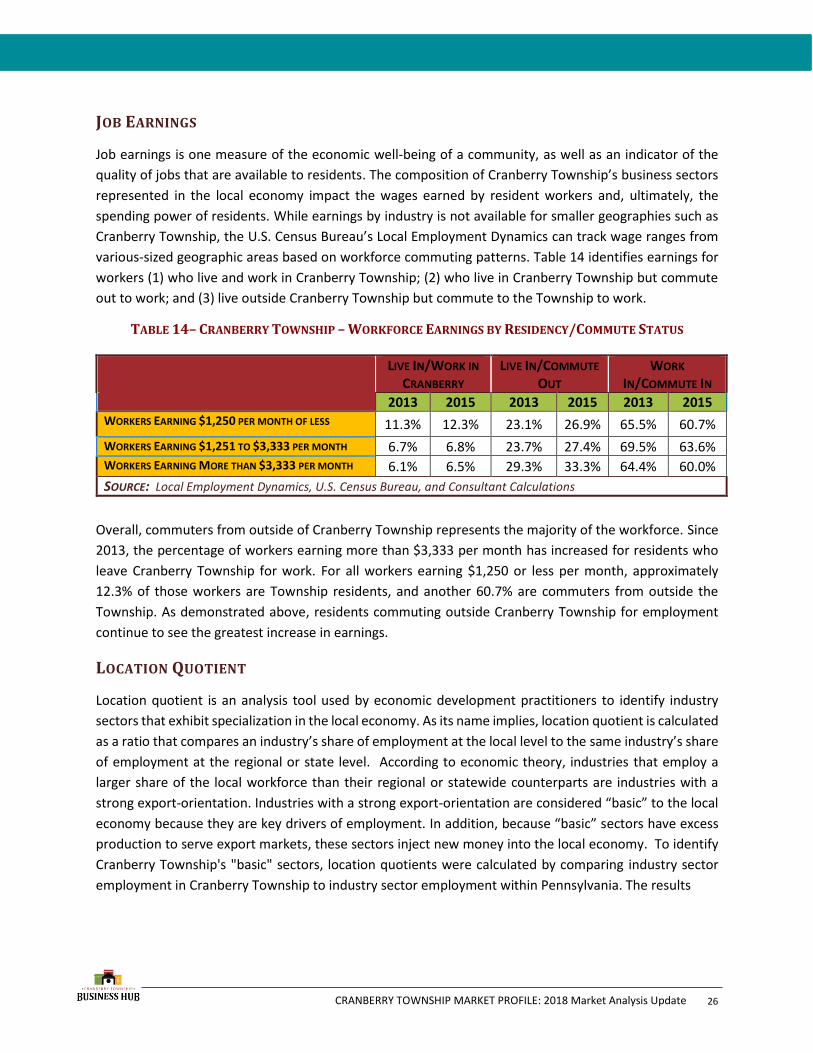
JOB EARNINGS
Job earnings is one measure of the economic well-being of a community, as well as an indicator of the
quality of jobs that are available to residents. The composition of Cranberry Township’s business sectors
represented in the local economy impact the wages earned by resident workers and, ultimately, the
spending power of residents. While earnings by industry is not available for smaller geographies such as
Cranberry Township, the U.S. Census Bureau’s Local Employment Dynamics can track wage ranges from
various-sized geographic areas based on workforce commuting patterns. Table 14 identifies earnings for
workers (1) who live and work in Cranberry Township; (2) who live in Cranberry Township but commute
out to work; and (3) live outside Cranberry Township but commute to the Township to work.
TABLE 14– CRANBERRY TOWNSHIP – WORKFORCE EARNINGS BY RESIDENCY/COMMUTE STATUS
LIVE IN/WORK IN
CRANBERRY LIVE IN/COMMUTE
OUT WORK
IN/COMMUTE IN
2013 2015 2013 2015 2013 2015 WORKERS EARNING $1,250 PER MONTH OF LESS 11.3% 12.3% 23.1% 26.9% 65.5% 60.7%
WORKERS EARNING $1,251 TO $3,333 PER MONTH 6.7% 6.8% 23.7% 27.4% 69.5% 63.6% WORKERS EARNING MORE THAN $3,333 PER MONTH 6.1% 6.5% 29.3% 33.3% 64.4% 60.0%
SOURCE: Local Employment Dynamics, U.S. Census Bureau, and Consultant Calculations
Overall, commuters from outside of Cranberry Township represents the majority of the workforce. Since
2013, the percentage of workers earning more than $3,333 per month has increased for residents who
leave Cranberry Township for work. For all workers earning $1,250 or less per month, approximately
12.3% of those workers are Township residents, and another 60.7% are commuters from outside the
Township. As demonstrated above, residents commuting outside Cranberry Township for employment
continue to see the greatest increase in earnings.
LOCATION QUOTIENT
Location quotient is an analysis tool used by economic development practitioners to identify industry
sectors that exhibit specialization in the local economy. As its name implies, location quotient is calculated
as a ratio that compares an industry’s share of employment at the local level to the same industry’s share
of employment at the regional or state level. According to economic theory, industries that employ a
larger share of the local workforce than their regional or statewide counterparts are industries with a
strong export-orientation. Industries with a strong export-orientation are considered “basic” to the local
economy because they are key drivers of employment. In addition, because “basic” sectors have excess
production to serve export markets, these sectors inject new money into the local economy. To identify
Cranberry Township's "basic" sectors, location quotients were calculated by comparing industry sector
employment in Cranberry Township to industry sector employment within Pennsylvania. The results
26
CRANBERRY TOWNSHIP MARKET PROFILE: 2018 Market Analysis Update
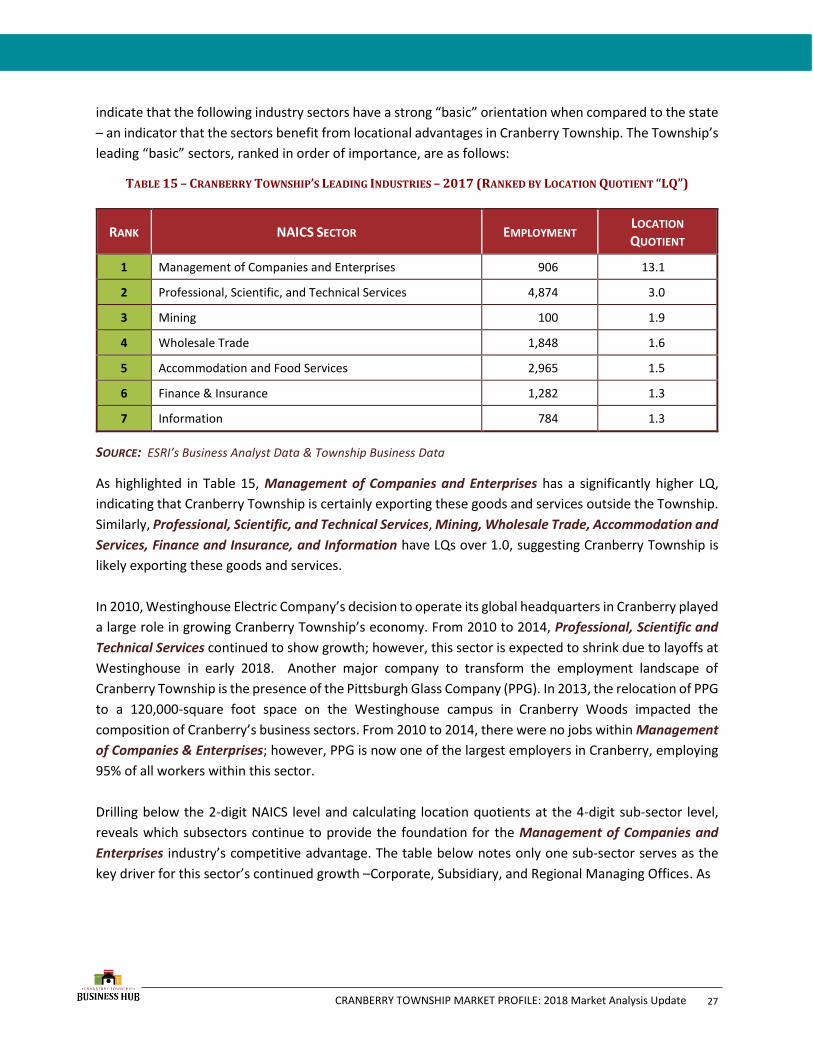
indicate that the following industry sectors have a strong “basic” orientation when compared to the state
– an indicator that the sectors benefit from locational advantages in Cranberry Township. The Township’s
leading “basic” sectors, ranked in order of importance, are as follows:
TABLE 15 – CRANBERRY TOWNSHIP’S LEADING INDUSTRIES – 2017 (RANKED BY LOCATION QUOTIENT “LQ”)
RANK NAICS SECTOR EMPLOYMENT LOCATION
QUOTIENT
1 Management of Companies and Enterprises 906 13.1
2 Professional, Scientific, and Technical Services 4,874 3.0
3 Mining 100 1.9
4 Wholesale Trade 1,848 1.6
5 Accommodation and Food Services 2,965 1.5
6 Finance & Insurance 1,282 1.3
7 Information 784 1.3
SOURCE: ESRI’s Business Analyst Data & Township Business Data
As highlighted in Table 15, Management of Companies and Enterprises has a significantly higher LQ,
indicating that Cranberry Township is certainly exporting these goods and services outside the Township.
Similarly, Professional, Scientific, and Technical Services, Mining, Wholesale Trade, Accommodation and
Services, Finance and Insurance, and Information have LQs over 1.0, suggesting Cranberry Township is
likely exporting these goods and services.
In 2010, Westinghouse Electric Company’s decision to operate its global headquarters in Cranberry played
a large role in growing Cranberry Township’s economy. From 2010 to 2014, Professional, Scientific and
Technical Services continued to show growth; however, this sector is expected to shrink due to layoffs at
Westinghouse in early 2018. Another major company to transform the employment landscape of
Cranberry Township is the presence of the Pittsburgh Glass Company (PPG). In 2013, the relocation of PPG
to a 120,000-square foot space on the Westinghouse campus in Cranberry Woods impacted the
composition of Cranberry’s business sectors. From 2010 to 2014, there were no jobs within Management
of Companies & Enterprises; however, PPG is now one of the largest employers in Cranberry, employing
95% of all workers within this sector.
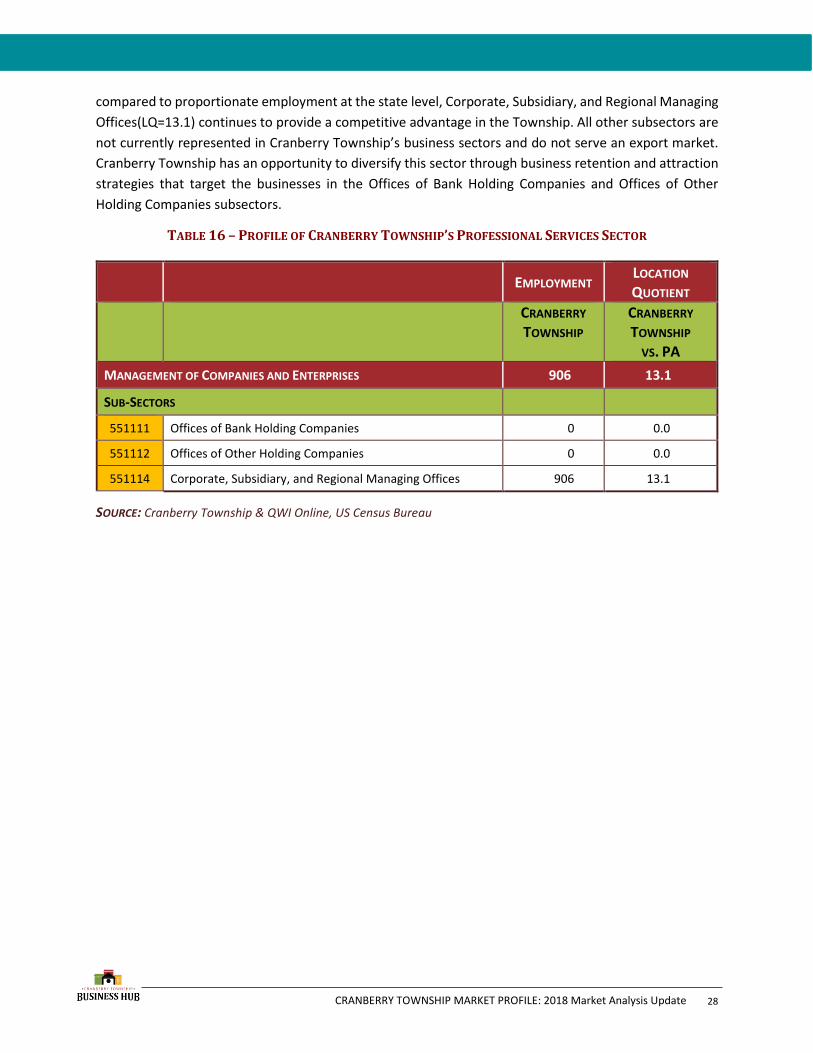
Drilling below the 2-digit NAICS level and calculating location quotients at the 4-digit sub-sector level,
reveals which subsectors continue to provide the foundation for the Management of Companies and
Enterprises industry’s competitive advantage. The table below notes only one sub-sector serves as the
key driver for this sector’s continued growth –Corporate, Subsidiary, and Regional Managing Offices. As
27
CRANBERRY TOWNSHIP MARKET PROFILE: 2018 Market Analysis Update
compared to proportionate employment at the state level, Corporate, Subsidiary, and Regional Managing
Offices(LQ=13.1) continues to provide a competitive advantage in the Township. All other subsectors are
not currently represented in Cranberry Township’s business sectors and do not serve an export market.
Cranberry Township has an opportunity to diversify this sector through business retention and attraction
strategies that target the businesses in the Offices of Bank Holding Companies and Offices of Other
Holding Companies subsectors.
TABLE 16 – PROFILE OF CRANBERRY TOWNSHIP’S PROFESSIONAL SERVICES SECTOR
EMPLOYMENT LOCATION
QUOTIENT CRANBERRY
TOWNSHIP CRANBERRY
TOWNSHIP VS. PA
MANAGEMENT OF COMPANIES AND ENTERPRISES 906 13.1
SUB-SECTORS
551111 Offices of Bank Holding Companies 0 0.0
551112 Offices of Other Holding Companies 0 0.0
551114 Corporate, Subsidiary, and Regional Managing Offices 906 13.1
SOURCE: Cranberry Township & QWI Online, US Census Bureau
28

CRANBERRY TOWNSHIP MARKET PROFILE: 2018 Market Analysis Update
TABLE 17– LOCATION QUOTIENTS BY INDUSTRY SECTOR (2017)
JOBS BY INDUSTRY TYPE (2-DIGIT NAICS) EMPLOYMENT LQ
AGRICULTURE, FORESTRY, FISHING AND HUNTING - 0.0
MINING 100 1.9
UTILITIES - 0.0
CONSTRUCTION 429 0.4
MANUFACTURING 2,120 0.9
WHOLESALE TRADE 1,848 1.6
RETAIL TRADE 3,894 1.2
TRANSPORTATION AND WAREHOUSING 839 0.8
INFORMATION 784 1.3
REAL ESTATE AND RENTAL AND LEASING 618 1.2
PROFESSIONAL, SCIENTIFIC, AND TECHNICAL SERVICES 4,874 3.0
MANAGEMENT OF COMPANIES AND ENTERPRISES 906 13.0
ADMINISTRATION & SUPPORT, WASTE MANAGEMENT AND REMEDIATION 304 0.5
EDUCATIONAL SERVICES 504 0.3
HEALTH CARE AND SOCIAL ASSISTANCE 1,803 0.4
ARTS, ENTERTAINMENT, AND RECREATION 415 0.9
ACCOMMODATION AND FOOD SERVICES 2,965 1.5
OTHER SERVICES (EXCLUDING PUBLIC ADMINISTRATION 1,021 0.7
PUBIC ADMINISTRATION 495 0.3
MANAGEMENT OF COMPANIES AND ENTERPRISES — 0.0
SOURCE: Cranberry Township, ESRI’s Business Analyst Data, and Consultant Calculations
29

CRANBERRY TOWNSHIP MARKET PROFILE: 2018 Market Analysis Update
SHIFT-SHARE ANALYSIS
Building from the location quotient technique that establishes which local industries are key drivers of the
local economy, shift-share analysis begins to uncover the factors that influence an industry’s growth
trend. Shift-share analysis compares employment trends in the Township to employment changes in the
state to attribute employment growth and/or decline in any industry sector to three (3) components of
growth: state share, industry mix share, and local share. The analysis quantifies the “share” of
employment change that can be attributed to each component.
1. STATE SHARE – State share represents the number of jobs that would have been created (or lost)
in the Township had the local economy mirrored statewide trends.
2. INDUSTRY MIX SHARE – Industry mix share represents the number of jobs that would have been
created (or lost) in the Township had the local economy changed at the rate of the regional
economy and had individual industry employment mirrored regional trends.
3. LOCAL SHARE – Local share represents the number of jobs the Township may have gained because
local industry sectors outpaced their regional counterparts in terms of job creation. Local share
also estimates the number of jobs the Township may have lost because local industry sectors
could not keep pace with regional job growth. In shift-share analysis, industries are considered to
have local competitive advantage if their rate of job growth outpaces regional employment
growth in the same industry sector. Industries that have a strong local competitive advantage -
and are deemed “key drivers” of economic growth based on their location quotient – should be
central to a community's economic development strategy.
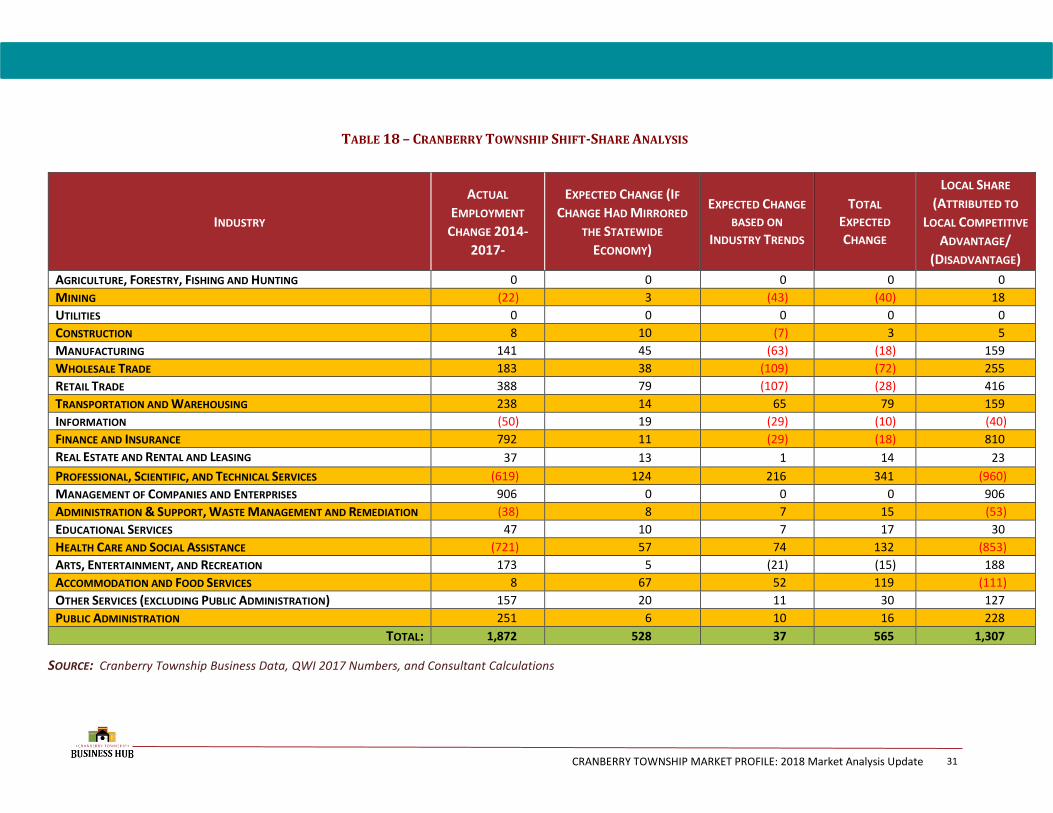
The results of the shift-share analysis for Cranberry Township are featured in Table 18. A positive number
under “local competitive advantage” indicates that local industry growth outpaced industry growth at the
regional level – a sign of competitive advantage. A negative number indicates that local conditions may
not support continued job growth because the local industry did not keep pace with regional industry
growth.
The results of the shift-share analysis show that of 1,872 new jobs created in Cranberry Township between
2014 and 2017, an estimated 28% (or 528), can be attributed to growth in the statewide economy, with
the remaining growth attributed to attractiveness factors specific to Cranberry Township.
Over this three-year period, the statewide economy posted 2.3% percent employment growth. In
contrast, the Township posted 8% growth in employment over the same period - far outpacing the
statewide trend. Sectors that recorded growth largely due to local attractiveness factors include
Management of Companies and Enterprises, Finance and Insurance, Retail Trade, and Wholesale Trade.
30
Pennsylvania 2018
CRANBERRY TOWNSHIP MARKET PROFILE: 2018 Market Analysis Update
TABLE 18 – CRANBERRY TOWNSHIP SHIFT-SHARE ANALYSIS
SOURCE: Cranberry Township Business Data, QWI 2017 Numbers, and Consultant Calculations
INDUSTRY
ACTUAL
EMPLOYMENT
CHANGE 2014-
2017-
EXPECTED CHANGE (IF
CHANGE HAD MIRRORED
THE STATEWIDE
ECONOMY)
EXPECTED CHANGE
BASED ON
INDUSTRY TRENDS
TOTAL
EXPECTED
CHANGE
LOCAL SHARE
(ATTRIBUTED TO
LOCAL COMPETITIVE
ADVANTAGE/
(DISADVANTAGE)
AGRICULTURE, FORESTRY, FISHING AND HUNTING 0 0 0 0 0
MINING (22) 3 (43) (40) 18
UTILITIES 0 0 0 0 0
CONSTRUCTION 8 10 (7) 3 5
MANUFACTURING 141 45 (63) (18) 159
WHOLESALE TRADE 183 38 (109) (72) 255
RETAIL TRADE 388 79 (107) (28) 416
TRANSPORTATION AND WAREHOUSING 238 14 65 79 159
INFORMATION (50) 19 (29) (10) (40)
FINANCE AND INSURANCE 792 11 (29) (18) 810
REAL ESTATE AND RENTAL AND LEASING 37 13 1 14 23
PROFESSIONAL, SCIENTIFIC, AND TECHNICAL SERVICES (619) 124 216 341 (960)
MANAGEMENT OF COMPANIES AND ENTERPRISES 906 0 0 0 906
ADMINISTRATION & SUPPORT, WASTE MANAGEMENT AND REMEDIATION (38) 8 7 15 (53)
EDUCATIONAL SERVICES 47 10 7 17 30
HEALTH CARE AND SOCIAL ASSISTANCE (721) 57 74 132 (853)
ARTS, ENTERTAINMENT, AND RECREATION 173 5 (21) (15) 188
ACCOMMODATION AND FOOD SERVICES 8 67 52 119 (111)
OTHER SERVICES (EXCLUDING PUBLIC ADMINISTRATION) 157 20 11 30 127
PUBLIC ADMINISTRATION 251 6 10 16 228
TOTAL: 1,872 528 37 565 1,307
31

CRANBERRY TOWNSHIP MARKET PROFILE: 2018 Market Analysis Update
THE RETAIL MARKET
To assess the retail market potential in Cranberry Township, five study areas were examined:
• Cranberry Township – was used as the base geography for measuring local retail sales.
• 5-Mile, 10-Mile, and 15-Mile Radii – represents the capture range identified by the
International Council of Shopping Centers for regional retail centers.
• Cranberry Draw Area – the most likely draw area for Cranberry Township as spatially
calculated using a gravity model that measures the likelihood that residents in surrounding areas
will drive to Cranberry to shop based on the distance they have to travel and the concentration
of retail options in the Township as compared to retail options in surrounding areas (see map on
following page).
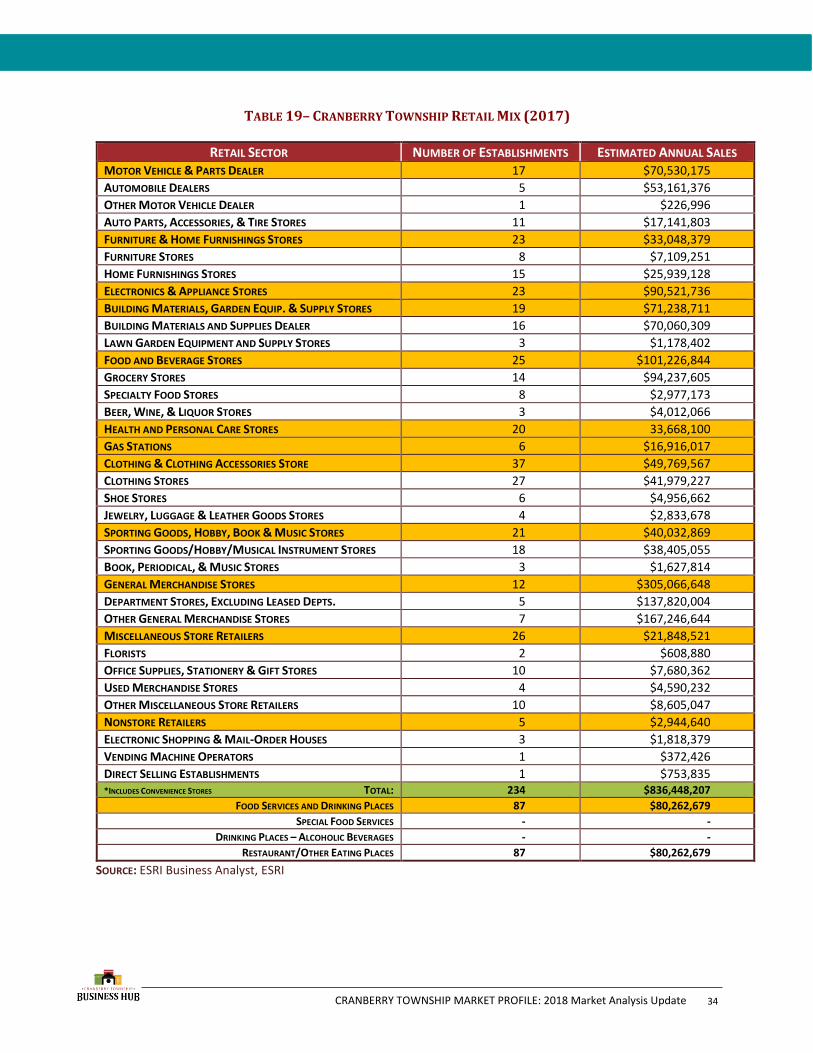
In 2017, there were 234 retail establishments in Cranberry Township with annual sales estimated at over
$836 million. In addition, there were 87 restaurants in the Township with annual sales estimated at over
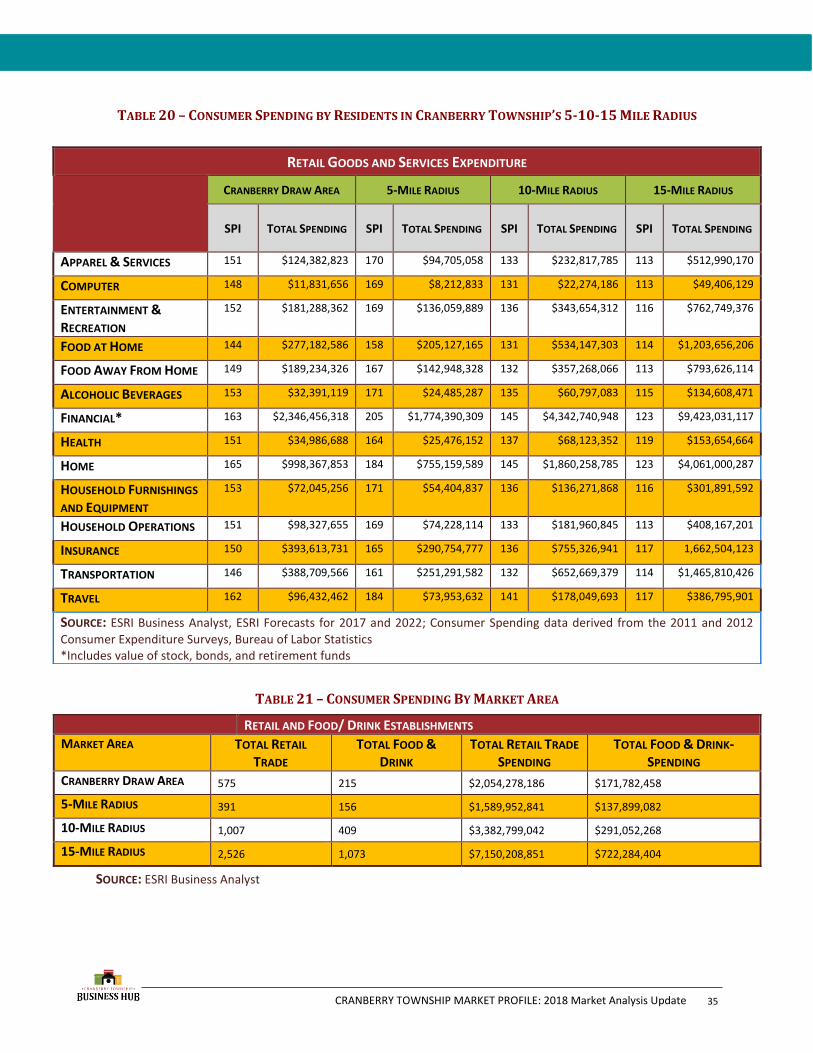
$80 million. Table 19 provides a snapshot of the distribution of those sales. Tables 20 -21 provide a
snapshot of the spending power of residents in the Cranberry Draw Area, as well as the 5-10-15 mile radii.
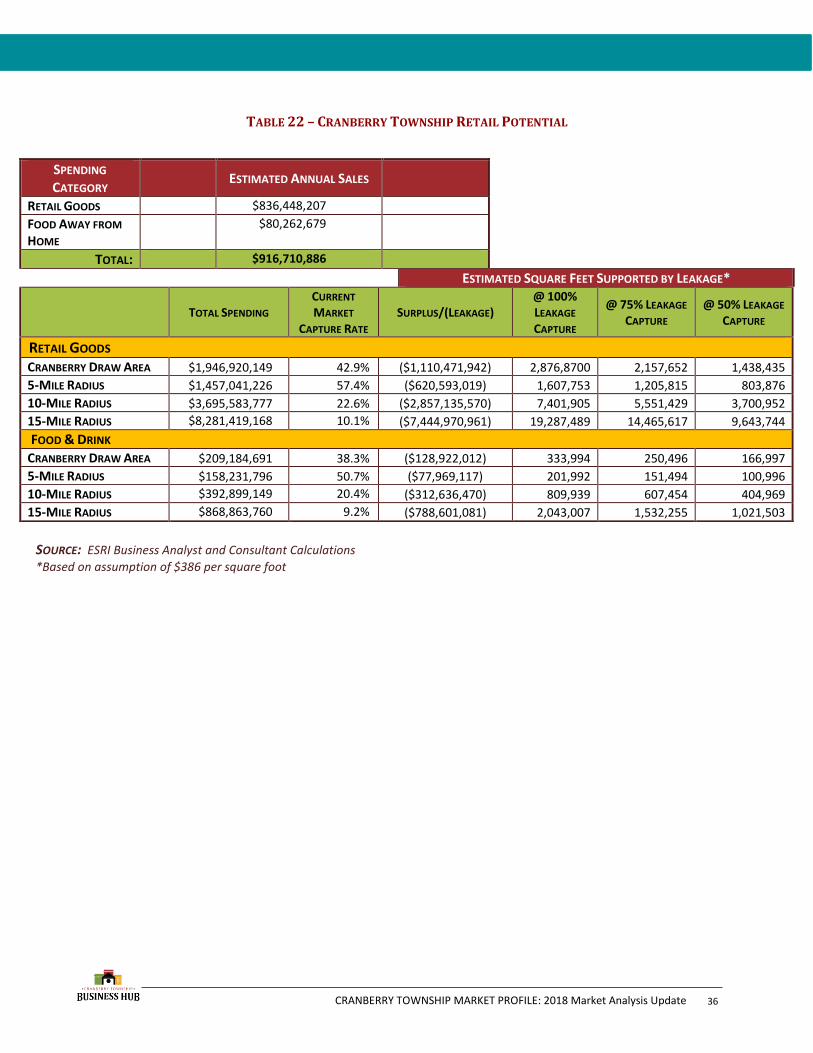
Table 22 provides a detailed overview of the estimated surplus and leakage of retail spending for each of
the above study areas comparing retail sales to spending in each area.
32

CRANBERRY TOWNSHIP MARKET PROFILE: 2018 Market Analysis Update
FIGURE 8 – THE RETAIL STUDY AREAS
33
CRANBERRY TOWNSHIP MARKET PROFILE: 2018 Market Analysis Update
TABLE 19– CRANBERRY TOWNSHIP RETAIL MIX (2017)
RETAIL SECTOR NUMBER OF ESTABLISHMENTS ESTIMATED ANNUAL SALES MOTOR VEHICLE & PARTS DEALER 17 $70,530,175
AUTOMOBILE DEALERS 5 $53,161,376
OTHER MOTOR VEHICLE DEALER 1 $226,996
AUTO PARTS, ACCESSORIES, & TIRE STORES 11 $17,141,803
FURNITURE & HOME FURNISHINGS STORES 23 $33,048,379
FURNITURE STORES 8 $7,109,251
HOME FURNISHINGS STORES 15 $25,939,128
ELECTRONICS & APPLIANCE STORES 23 $90,521,736
BUILDING MATERIALS, GARDEN EQUIP. & SUPPLY STORES 19 $71,238,711
BUILDING MATERIALS AND SUPPLIES DEALER 16 $70,060,309
LAWN GARDEN EQUIPMENT AND SUPPLY STORES 3 $1,178,402
FOOD AND BEVERAGE STORES 25 $101,226,844
GROCERY STORES 14 $94,237,605
SPECIALTY FOOD STORES 8 $2,977,173
BEER, WINE, & LIQUOR STORES 3 $4,012,066
HEALTH AND PERSONAL CARE STORES 20 33,668,100
GAS STATIONS 6 $16,916,017
CLOTHING & CLOTHING ACCESSORIES STORE 37 $49,769,567
CLOTHING STORES 27 $41,979,227
SHOE STORES 6 $4,956,662
JEWELRY, LUGGAGE & LEATHER GOODS STORES 4 $2,833,678
SPORTING GOODS, HOBBY, BOOK & MUSIC STORES 21 $40,032,869
SPORTING GOODS/HOBBY/MUSICAL INSTRUMENT STORES 18 $38,405,055
BOOK, PERIODICAL, & MUSIC STORES 3 $1,627,814
GENERAL MERCHANDISE STORES 12 $305,066,648
DEPARTMENT STORES, EXCLUDING LEASED DEPTS. 5 $137,820,004
OTHER GENERAL MERCHANDISE STORES 7 $167,246,644
MISCELLANEOUS STORE RETAILERS 26 $21,848,521
FLORISTS 2 $608,880
OFFICE SUPPLIES, STATIONERY & GIFT STORES 10 $7,680,362
USED MERCHANDISE STORES 4 $4,590,232
OTHER MISCELLANEOUS STORE RETAILERS 10 $8,605,047
NONSTORE RETAILERS 5 $2,944,640
ELECTRONIC SHOPPING & MAIL-ORDER HOUSES 3 $1,818,379
VENDING MACHINE OPERATORS 1 $372,426
DIRECT SELLING ESTABLISHMENTS 1 $753,835 *INCLUDES CONVENIENCE STORES TOTAL: 234 $836,448,207
FOOD SERVICES AND DRINKING PLACES 87 $80,262,679
SPECIAL FOOD SERVICES - -
DRINKING PLACES – ALCOHOLIC BEVERAGES - -
RESTAURANT/OTHER EATING PLACES 87 $80,262,679
SOURCE: ESRI Business Analyst, ESRI
34
CRANBERRY TOWNSHIP MARKET PROFILE: 2018 Market Analysis Update
TABLE 20 – CONSUMER SPENDING BY RESIDENTS IN CRANBERRY TOWNSHIP’S 5-10-15 MILE RADIUS
TABLE 21 – CONSUMER SPENDING BY MARKET AREA
SOURCE: ESRI Business Analyst
RETAIL GOODS AND SERVICES EXPENDITURE
CRANBERRY DRAW AREA 5-MILE RADIUS 10-MILE RADIUS 15-MILE RADIUS
SPI TOTAL SPENDING SPI TOTAL SPENDING SPI TOTAL SPENDING SPI TOTAL SPENDING
APPAREL & SERVICES 151 $124,382,823 170 $94,705,058 133 $232,817,785 113 $512,990,170
COMPUTER 148 $11,831,656 169 $8,212,833 131 $22,274,186 113 $49,406,129
ENTERTAINMENT &
RECREATION
152 $181,288,362 169 $136,059,889 136 $343,654,312 116 $762,749,376
FOOD AT HOME 144 $277,182,586 158 $205,127,165 131 $534,147,303 114 $1,203,656,206
FOOD AWAY FROM HOME 149 $189,234,326 167 $142,948,328 132 $357,268,066 113 $793,626,114
ALCOHOLIC BEVERAGES 153 $32,391,119 171 $24,485,287 135 $60,797,083 115 $134,608,471
FINANCIAL* 163 $2,346,456,318 205 $1,774,390,309 145 $4,342,740,948 123 $9,423,031,117
HEALTH 151 $34,986,688 164 $25,476,152 137 $68,123,352 119 $153,654,664
HOME 165 $998,367,853 184 $755,159,589 145 $1,860,258,785 123 $4,061,000,287
HOUSEHOLD FURNISHINGS
AND EQUIPMENT
153 $72,045,256 171 $54,404,837 136 $136,271,868 116 $301,891,592
HOUSEHOLD OPERATIONS 151 $98,327,655 169 $74,228,114 133 $181,960,845 113 $408,167,201
INSURANCE 150 $393,613,731 165 $290,754,777 136 $755,326,941 117 1,662,504,123
TRANSPORTATION 146 $388,709,566 161 $251,291,582 132 $652,669,379 114 $1,465,810,426
TRAVEL 162 $96,432,462 184 $73,953,632 141 $178,049,693 117 $386,795,901
SOURCE: ESRI Business Analyst, ESRI Forecasts for 2017 and 2022; Consumer Spending data derived from the 2011 and 2012
Consumer Expenditure Surveys, Bureau of Labor Statistics *Includes value of stock, bonds, and retirement funds
RETAIL AND FOOD/ DRINK ESTABLISHMENTS MARKET AREA TOTAL RETAIL
TRADE TOTAL FOOD &
DRINK TOTAL RETAIL TRADE
SPENDING TOTAL FOOD & DRINK-
SPENDING
CRANBERRY DRAW AREA 575 215 $2,054,278,186 $171,782,458
5-MILE RADIUS 391 156 $1,589,952,841 $137,899,082
10-MILE RADIUS 1,007 409 $3,382,799,042 $291,052,268
15-MILE RADIUS 2,526 1,073 $7,150,208,851 $722,284,404
35
CRANBERRY TOWNSHIP MARKET PROFILE: 2018 Market Analysis Update
TABLE 22 – CRANBERRY TOWNSHIP RETAIL POTENTIAL
SPENDING
CATEGORY ESTIMATED ANNUAL SALES
RETAIL GOODS $836,448,207
FOOD AWAY FROM
HOME
$80,262,679
TOTAL: $916,710,886
ESTIMATED SQUARE FEET SUPPORTED BY LEAKAGE*
TOTAL SPENDING CURRENT
MARKET
CAPTURE RATE SURPLUS/(LEAKAGE)
@ 100%
LEAKAGE
CAPTURE
@ 75% LEAKAGE
CAPTURE @ 50% LEAKAGE
CAPTURE
RETAIL GOODS CRANBERRY DRAW AREA $1,946,920,149 42.9% ($1,110,471,942) 2,876,8700 2,157,652 1,438,435
5-MILE RADIUS $1,457,041,226 57.4% ($620,593,019) 1,607,753 1,205,815 803,876
10-MILE RADIUS $3,695,583,777 22.6% ($2,857,135,570) 7,401,905 5,551,429 3,700,952
15-MILE RADIUS $8,281,419,168 10.1% ($7,444,970,961) 19,287,489 14,465,617 9,643,744
FOOD & DRINK CRANBERRY DRAW AREA $209,184,691 38.3% ($128,922,012) 333,994 250,496 166,997
5-MILE RADIUS $158,231,796 50.7% ($77,969,117) 201,992 151,494 100,996
10-MILE RADIUS $392,899,149 20.4% ($312,636,470) 809,939 607,454 404,969
15-MILE RADIUS $868,863,760 9.2% ($788,601,081) 2,043,007 1,532,255 1,021,503
SOURCE: ESRI Business Analyst and Consultant Calculations
*Based on assumption of $386 per square foot
36

CRANBERRY TOWNSHIP MARKET PROFILE: 2018 Market Analysis Update
Cranberry Township retail establishments currently capture around 43% of consumer spending within the
Cranberry Draw Area. Assuming that the Cranberry Draw Area is the primary market area for the
Township, the Township could potentially support an additional 1,438,435 square feet of retail space if it
captured 50% of the current estimated leakage. Given the same assumptions, the Township could
potentially support an additional 166, 997 feet of restaurant space.
Within a 10-mile radius, the township’s retail establishments capture around 23% of consumer spending.
While there is an estimated leakage of $3 billion in consumer spending within a 10-mile radius of
Cranberry Township, a significant portion of the
leakage is likely attributed to consumers in the
southern portion of the radius, as illustrated in
Figure 9. The proximity of these consumers to
retail amenities in the northern portion of the
Pittsburgh metropolitan area means stiff
competition for retail establishments in Cranberry
Township.
Sales estimates in Table 22 reflect all sales by local
establishments; however, the surplus/leakage
estimates include household spending only and
are not reflective of the spending of the 19,623
workers who commute to Cranberry Township to
work each day. To put this in perspective, if half of
those workers spend $30 per week in Cranberry
Township, that spending could support as much as
39,650 square feet of additional space (see Table
23).
It should be noted that the estimates of retail
potential are based solely on statistical calculations
and do not take into consideration other variable
factors such as the age and curb appeal of competitive retail centers, the curb appeal of new development,
changes in the economy and spending, and marketing, etc.
FIGURE 9 – DISTRIBUTION OF HOUSEHOLDS
37

CRANBERRY TOWNSHIP MARKET PROFILE: 2018 Market Analysis Update
TABLE 23- COMMUTER SPENDING POTENTIAL
MARKET POTENTIAL BY COMMUTERS
TOTAL COMMUTERS (2015) 19,623
50% CAPTURE RATE 9,811
AVG. WEEKLY EXPENDITURE $30.00
TOTAL SPENDING POTENTIAL $15,305,160
COST PER SQUARE FOOTAGE $386.00
SQUARE FOOTAGE SUPPORTED BY COMMUTERS 39,650 SQ. FT.
SOURCE: Consultant Calculations
THE COMMERCIAL MARKET
The commercial real estate market includes offices, retail centers, hotels, and other properties used for
business purposes. As stated in the previous 2012
Market Analysis Update, the 2008 economic
downturn impacted the commercial real estate
market forcing many businesses to downsize or close
their doors. New construction was sluggish due to
lending restrictions imposed by federal regulators. As
of 2012, the commercial real estate market had begun
to stabilize due to the limited supply, and growth in
the economy. One indicator of the health of the
commercial real estate market is the real estate index
published by The Society of Industrial and Office
Realtors (SIOR). The index is based on a survey of SIOR
members, which are asked to characterize the
strength or weakness of property markets across 10
major categories, including recent leasing activity,
trends in asking rents, trends in vacancy rates,
concession packages, site acquisition activity, and
development activity. An SIOR index value of 100
represents a well-balanced market for industrial and office property. An index value significantly lower
than 100 indicates weak market conditions.
During the 4th Quarter of 2017, the SIOR Commercial Real Estate Index (CREI) grew 3.2 points from the
previous quarter, achieving an office index of 113.8. This steady increase can be attributed to the
construction of new office and industrial spaces, which are projected to reach the historical average for
new building development. Private service-oriented industries, similar to many of the business sectors
SOURCE: Grubb & Ellis
FIGURE 10 – OFFICE SUBMARKETS
38

CRANBERRY TOWNSHIP MARKET PROFILE: 2018 Market Analysis Update
represented in Cranberry’s local economy, provided the majority of new positions in 2017 including
101,000 new professional and business service positions; 99,100 health care and social assistance
opportunities; and 24,000 new positions in financial services throughout the United States.
Similarly, the industrial index rose to 136.3 during the 4th quarter of 2017, representing a 3.5%gain year-
over-year. The increased demand for industrial space is a result of international trade and on-line
shopping, which is diverting space from retail centers to warehouses. The industrial index has hovered
over the 100-point value for the past 13 months indicating the strong demand for industrial space.
The commercial real estate advisory firm Newmark Grubb Knight Frank reports that the Pittsburgh Region
was one of the 10 cities with the highest percentage of new jobs in occupations that pay a living-wage.
This information was obtained from a study completed by CareerBuilder.com. Within the Pittsburgh
Region, office vacancy during the 4th quarter of 2017 was 16.9%. In comparison, the vacancy rate for
Pittsburgh’s Industrial Market was 7.9% during this same period. The Northern Submarket was slightly
lower at 15.1% vacancy. In the 4th quarter of 2017, Cranberry Township reported a 3.2% unemployment
rate compared to 4.8% in Pennsylvania and 4.1% nationwide. The prominence of three (3) primary sectors
– health care, education, and energy – continue to stabilize metropolitan Pittsburgh’s labor market and
fuel demand for Class A office space.
In 4th quarter of 2016, asking rent for Class A office space in the North Suburbs, a suburban submarket of
Pittsburgh that includes Cranberry Township, was $24.82 per square foot. By the end of the 4th quarter of
2017, asking rent increased to $25.26. During this same time, the asking rent for Class B commercial office
space increased from $19.56 per square foot to 20.63 per square foot.
TABLE 24 - TRENDS FOR PITTSBURGH OFFICE MARKET – 4TH QUARTER 2017
TRENDS FOR PITTSBURGH OFFICE MARKET 4TH QUARTER 2017
ASKING RENT (PRICE/SF)
SUBMARKETS TOTAL INVENTORY
SF VACANT %
NET ABSORPTION
YTD CLASS A CLASS B
CBD 20,293,397 14.5% 260,809 $29.73 $21.70
Fringe 6,499,416 19.2% -52,025 $26.76 $23.30
CBD/FRINGE
TOTAL: 26,792,813 15.6% 208,784 $29.54 $22.53
East 3,164,785 24.6% 39,232 $22.79 $16.67
North 7,486,361 15.1% -248,681 $25.26 $20.47
Oakland/East End
2,490,689 4.0% 47,411 $29.66 $20.63
Parkway West 8,656,709 21.9% 159,383 $23.57 $19.79
South 5,420,408 19.0% 35,670 $22.75 $18.54
SUBURBAN TOTAL: 27,218,952 18.1% -196,324 $23.68 $19.06
PITTSBURGH 54,011,765 16.9% 218,156 $25.88 $21.14
SOURCE: Pittsburgh 4Q17 Office Market – Newmark Grubb Knight Frank Research
39
CRANBERRY TOWNSHIP MARKET PROFILE: 2018 Market Analysis Update
While lease rates speak indirectly to the balance between supply and demand, net absorption provides a
more informative snapshot of health within any real estate market. Fundamentally, net absorption
measures the change in occupied square footage over a period of time. Net absorption can be either
positive or negative, depending upon the pace of leasing activity and new construction. Positive net
absorption occurs when space has been taken off the market (i.e. through new leases and lease renewals)
at a faster pace than square footage has been added to the market through new construction or lease
terminations. In this scenario, demand exceeds supply, which pushes vacancy rates down and asking rents
up. In contrast, negative net absorption occurs when more square footage has been added to the market
than is absorbed through leasing activity. In this scenario, supply exceeds demand, which pushes vacancy
rates up and places downward pressure on asking rents.
The Newmark Grubb Knight Frank Office Trends Report referenced for this market assessment update
calculates net absorption based on physical occupancies and vacancies – i.e. when a tenant moves in or
out of a given space. Given the lag time that can exist between leasing transactions and physical
occupancy/vacancy, net absorption for the 4th quarter 2017 (as reflected in Table 24) may speak more to
market demand in the previous three quarters. The table shows year to date (YTD) net absorption for the
Pittsburgh CBD and suburbs. During the 4th quarter of 2017, the CBD’s net absorption was 260,809 square
feet, which indicates a period of steady demand for leasing activity. During this same quarter, the
suburban market overall was also active, except for the North submarket. Included in this North
submarket is Westinghouse Electric Company, which placed 315,000 square feet of sublease space into
the market.
The North Suburbs, which includes Cranberry Township, had a negative YTD net absorption of 248,681
with a vacancy rate of 15.1%. This 15.1% vacancy rate is still lower than the region with a 16.9% vacancy
rate. According to the trends report, technology companies are primarily responsible for the decrease in
vacancy rates. Although several have already expanded their presence in the Pittsburgh market, other
companies such as Argo Al, Uber, Petuum, Inc., and APTV have announced plans for new employment
opportunities. In addition, Amazon has listed Pittsburgh for its potential HQ2.
Asking rent for Class A office space in the Pittsburgh market maintained an upward climb in 2017,
increasing by $0.44/SF; however, asking rent has been inconsistent throughout the last three years. In the
2nd quarter of 2015, the asking rate for Class A office space in the North submarket was $25.42, and
dropped to just under $23.00 in the 2nd quarter of 2016. Since the 2nd quarter of 2017, asking rent has
steadily increased to $25.88.
The following bar charts show the five-year trend for building permit activity and construction value in
Cranberry Township. More than $149 million in construction activity took place in 2017 – representing
the strongest construction year of this period. Approximately 28% of this value was represented by
commercial development. This ratio of commercial to residential development value is not consistent with
development activity in previous years. Over the last three years, commercial development has accounted
for nearly 50% of the total construction value in the Township. As of January 2018, approximately $6
million in new residential and commercial development will be constructed in Cranberry Township. In
comparison, only $3.3 million in residential and commercial development was reported in January 2017.
40

CRANBERRY TOWNSHIP MARKET PROFILE: 2018 Market Analysis Update
Residential development permit activity has steadily increased over this five-year period and is consistent
with the Township’s population trends and projected growth.
FIGURE 10 – 5-YEAR TRENDS IN CONSTRUCTION VALUE IN CRANBERRY TOWNSHIP
SOURCE: Cranberry Township Data Development & Info
FIGURE 12– 5-YEAR TREND IN BUILDING PERMIT ACTIVITY IN CRANBERRY TOWNSHIP
SOURCE: Cranberry Township Data Development & Info
2013 2014 2015 2016 20172018 (As ofJanuary '18)
Nonresidential $44,350,203 $62,583,899 $44,261,706 $69,936,837 $41,568,024 $3,090,477
Residential $90,495,841 $49,481,306 $55,582,765 $59,043,815 $107,660,083 $3,080,375
$-
$20,000,000
$40,000,000
$60,000,000
$80,000,000
$100,000,000
$120,000,000
$140,000,000
$160,000,000
5 Year Trend: Construction Value
Residential Nonresidential
2013 2014 2015 2016 20172018 (January'18 Permits)
Nonresidential 106 132 125 148 100 9
Residential 502 196 300 169 480 8
0
100
200
300
400
500
600
700
5 Year Trend: Building Permit Activity
Residential Nonresidential
41
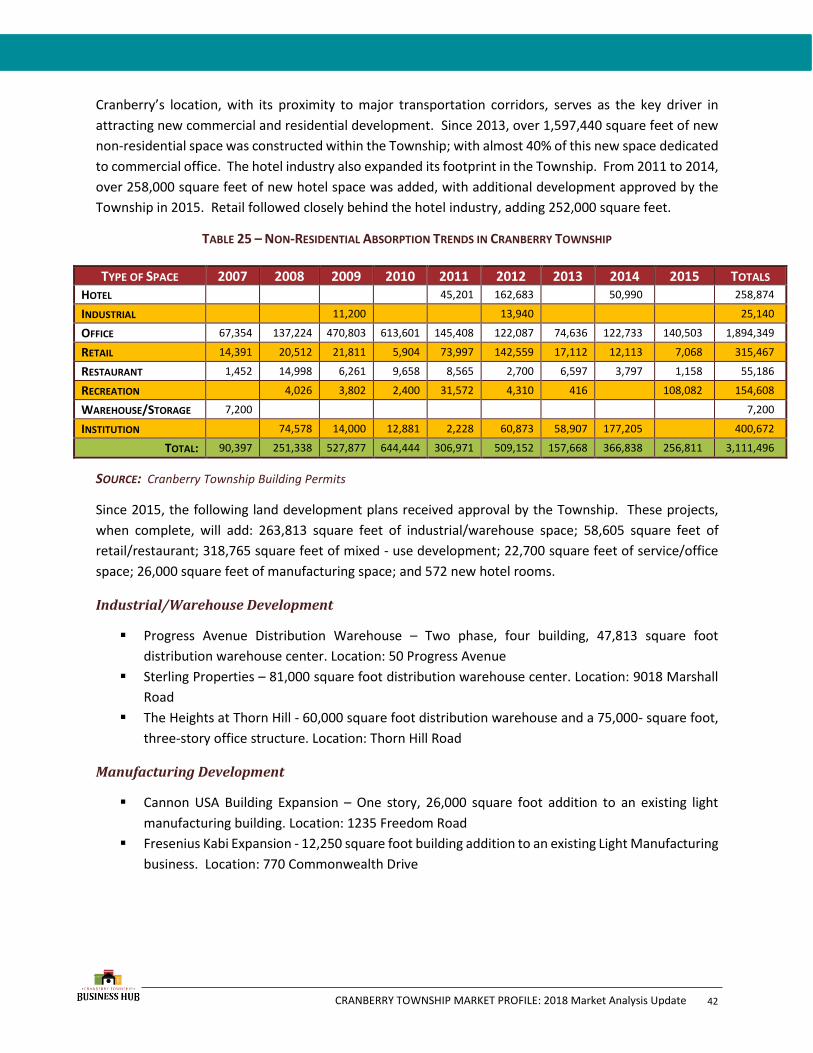
CRANBERRY TOWNSHIP MARKET PROFILE: 2018 Market Analysis Update
Cranberry’s location, with its proximity to major transportation corridors, serves as the key driver in
attracting new commercial and residential development. Since 2013, over 1,597,440 square feet of new
non-residential space was constructed within the Township; with almost 40% of this new space dedicated
to commercial office. The hotel industry also expanded its footprint in the Township. From 2011 to 2014,
over 258,000 square feet of new hotel space was added, with additional development approved by the
Township in 2015. Retail followed closely behind the hotel industry, adding 252,000 square feet.
TABLE 25 – NON-RESIDENTIAL ABSORPTION TRENDS IN CRANBERRY TOWNSHIP
TYPE OF SPACE 2007 2008 2009 2010 2011 2012 2013 2014 2015 TOTALS HOTEL 45,201 162,683 50,990 258,874
INDUSTRIAL 11,200 13,940 25,140
OFFICE 67,354 137,224 470,803 613,601 145,408 122,087 74,636 122,733 140,503 1,894,349
RETAIL 14,391 20,512 21,811 5,904 73,997 142,559 17,112 12,113 7,068 315,467
RESTAURANT 1,452 14,998 6,261 9,658 8,565 2,700 6,597 3,797 1,158 55,186
RECREATION 4,026 3,802 2,400 31,572 4,310 416 108,082 154,608
WAREHOUSE/STORAGE 7,200 7,200
INSTITUTION 74,578 14,000 12,881 2,228 60,873 58,907 177,205 400,672
TOTAL: 90,397 251,338 527,877 644,444 306,971 509,152 157,668 366,838 256,811 3,111,496
SOURCE: Cranberry Township Building Permits
Since 2015, the following land development plans received approval by the Township. These projects,
when complete, will add: 263,813 square feet of industrial/warehouse space; 58,605 square feet of
retail/restaurant; 318,765 square feet of mixed - use development; 22,700 square feet of service/office
space; 26,000 square feet of manufacturing space; and 572 new hotel rooms.
Industrial/Warehouse Development
▪ Progress Avenue Distribution Warehouse – Two phase, four building, 47,813 square foot
distribution warehouse center. Location: 50 Progress Avenue
▪ Sterling Properties – 81,000 square foot distribution warehouse center. Location: 9018 Marshall
Road
▪ The Heights at Thorn Hill - 60,000 square foot distribution warehouse and a 75,000- square foot,
three-story office structure. Location: Thorn Hill Road
Manufacturing Development
▪ Cannon USA Building Expansion – One story, 26,000 square foot addition to an existing light
manufacturing building. Location: 1235 Freedom Road
▪ Fresenius Kabi Expansion - 12,250 square foot building addition to an existing Light Manufacturing
business. Location: 770 Commonwealth Drive
42

CRANBERRY TOWNSHIP MARKET PROFILE: 2018 Market Analysis Update
Retail/Restaurant Development
▪ Franklin Square – 11,000 square foot retail development. Location: 1656 Route 228
▪ Cranberry Square Annex – 3,850 square foot building for retail use. Location: 20269 Route 19
▪ Healing Center – 10,680 square foot medical marijuana sales facility. Location: 270 Executive Drive
▪ O’Reilly Auto Parts – 8,075 square foot retail building. Location: 20541 Route 1
▪ American Building Products, Phase 1 – 25,000 square foot space at former Basketville Casket site.
Location: 2 Alps Avenue
Services/Office Development
▪ National Tire & Battery – 6,777 square foot auto repair facility. Location: 20425 Route 19
▪ American Building Products, Phase 2 – 16,000 square foot office space adjacent to existing
building. Location: Alps Avenue
Mixed Use Development
▪ Village of Cranberry Woods, Phase 2 – 63,363 square foot Community Character Development
featuring office, large retail, 361 room hotel, and a 235,724-square foot continuing care/personal
care facility. Location: Longtree Way and Cranberry Woods Drive
▪ Cranberry Springs, Phase 1 D-1 – 19,678 square foot office, restaurant, and retail building within
the Cranberry Springs development. Location: 2080 Mackenzie Way
Hotel Development
▪ Best Western Plus Hotel – 67,910 square foot, 101 room Hotel. Location: 5001 Cranberry Springs
Road
▪ Hampton Inn & Suites – 110 room, 64,653 square foot hotel. Location: 10015 Pendleton Way in
the Village of Cranberry Woods
43
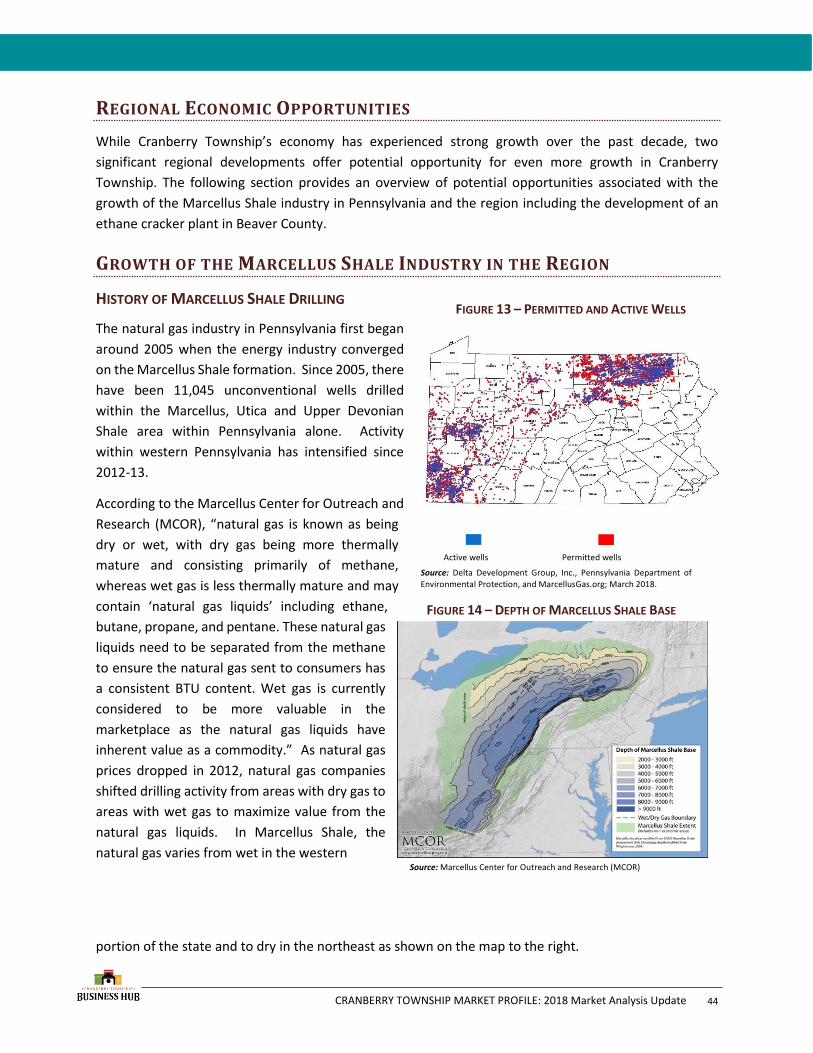
CRANBERRY TOWNSHIP MARKET PROFILE: 2018 Market Analysis Update
REGIONAL ECONOMIC OPPORTUNITIES
While Cranberry Township’s economy has experienced strong growth over the past decade, two
significant regional developments offer potential opportunity for even more growth in Cranberry
Township. The following section provides an overview of potential opportunities associated with the
growth of the Marcellus Shale industry in Pennsylvania and the region including the development of an
ethane cracker plant in Beaver County.
GROWTH OF THE MARCELLUS SHALE INDUSTRY IN THE REGION
HISTORY OF MARCELLUS SHALE DRILLING
The natural gas industry in Pennsylvania first began
around 2005 when the energy industry converged
on the Marcellus Shale formation. Since 2005, there
have been 11,045 unconventional wells drilled
within the Marcellus, Utica and Upper Devonian
Shale area within Pennsylvania alone. Activity
within western Pennsylvania has intensified since
2012-13.
According to the Marcellus Center for Outreach and
Research (MCOR), “natural gas is known as being
dry or wet, with dry gas being more thermally
mature and consisting primarily of methane,
whereas wet gas is less thermally mature and may
contain ‘natural gas liquids’ including ethane,
butane, propane, and pentane. These natural gas
liquids need to be separated from the methane
to ensure the natural gas sent to consumers has
a consistent BTU content. Wet gas is currently
considered to be more valuable in the
marketplace as the natural gas liquids have
inherent value as a commodity.” As natural gas
prices dropped in 2012, natural gas companies
shifted drilling activity from areas with dry gas to
areas with wet gas to maximize value from the
natural gas liquids. In Marcellus Shale, the
natural gas varies from wet in the western
portion of the state and to dry in the northeast as shown on the map to the right.
FIGURE 13 – PERMITTED AND ACTIVE WELLS
Active wells Permitted wells
Source: Delta Development Group, Inc., Pennsylvania Department of Environmental Protection, and MarcellusGas.org; March 2018.
Source: Marcellus Center for Outreach and Research (MCOR)
FIGURE 14 – DEPTH OF MARCELLUS SHALE BASE
44

CRANBERRY TOWNSHIP MARKET PROFILE: 2018 Market Analysis Update
Figure 15 depicts the activity within the Marcellus Shale gas industry from 2007 through March 2018.
Statewide average production per well has increased to about $1.8 million per well, while the total
number of wells continues to steadily increase. The average production per well is about $1.2 million per
well in Butler County as shown in Figure 16.
FIGURE 15 – AVERAGE PRODUCTION PER WELL, BY YEAR, ENTIRE STATE OF PENNSYLVANIA
83 204513
1,233
2,273
3,611
4,945
6,098
7,057
7,699
8,3908,121
55 129429
834
1,3041,579
1,751 1,862 1,819 1,847 1,784
169
0
1,000,000,000
2,000,000,000
3,000,000,000
4,000,000,000
5,000,000,000
6,000,000,000
0
1,000
2,000
3,000
4,000
5,000
6,000
7,000
8,000
9,000
2007 2008 2009 2010 2011 2012 2013 2014 2015 2016 2017 2018
number of wells $ in thousands Mcf
Source: Delta Development Group, Inc, PA Department of Environmental Protection, and MarcellusGas.org;
March 2018. *MCF – 1,000 cubic feet ** 2018 data only includes 1st Quarter 2018
45

CRANBERRY TOWNSHIP MARKET PROFILE: 2018 Market Analysis Update
SOURCE: DELTA DEVELOPMENT GROUP, INC, PA DEPARTMENT OF ENVIRONMENTAL PROTECTION, AND
MARCELLUSGAS.ORG; MARCH 2018.
DRILLING IN THE NORTHERN PITTSBURGH REGION
Table 26 and Figure 17 highlight the spud wells in the six-county region surrounding Butler County
(northern Pittsburgh Region) from 2007 to 2018. Drilling activity in Butler County has been steadily
increasing from 2007 through 2014, then varied through the current year 2018. A total of 584 wells have
been drilled in Butler County from 2007 to 2018 (as of March 2018).
2007 2008 2009 2010 2011 2012 2013 2014 2015 2016 2017 2018 Grand
Total
Allegheny 1 3 5 13 9 34 23 14 26 12 140
Armstrong 2 7 19 36 35 42 34 25 12 8 20 3 243
Beaver
1 1 6 17 10 12 4 13 20 17 101
Butler 12 11 10 35 35 70 92 117 85 31 67 19 584
Lawrence
2 18 10 34 7
1
72
Westmoreland 4 33 40 49 58 43 28 6 5 3 7 2 278
Grand Total 18 52 73 121 141 203 183 228 136 69 141 53 1418
FIGURE 16– AVERAGE PRODUCTION PER WELL, BY YEAR, BUTLER COUNTY
37 65115
206
533
664730
1,064
1,220 1,2441,189
120
4 13 23 36 6188
146
243
325382
435403
0
200
400
600
800
1,000
1,200
1,400
2007 2008 2009 2010 2011 2012 2013 2014 2015 2016 2017 2018
$ in thousands number of wells
TABLE 26– MARCELLUS SHALE, SPUD WELLS 2007 TO 2018, FOR SELECTED COUNTIES
46
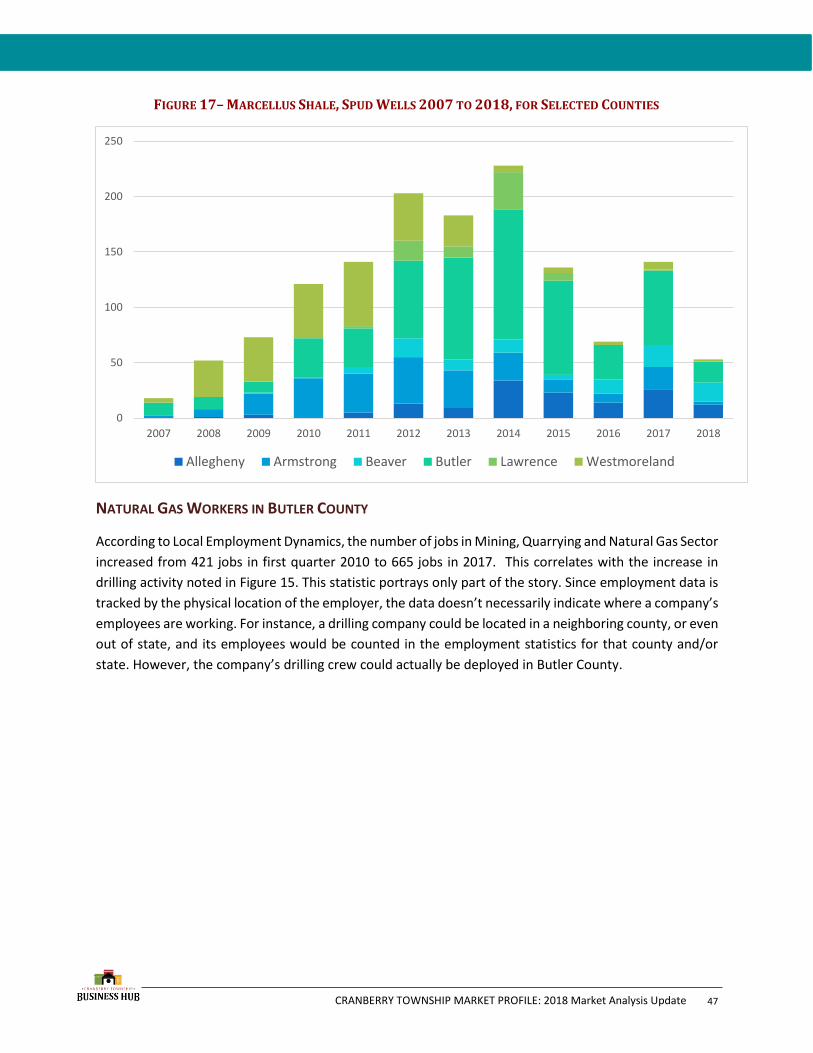
CRANBERRY TOWNSHIP MARKET PROFILE: 2018 Market Analysis Update
NATURAL GAS WORKERS IN BUTLER COUNTY
According to Local Employment Dynamics, the number of jobs in Mining, Quarrying and Natural Gas Sector
increased from 421 jobs in first quarter 2010 to 665 jobs in 2017. This correlates with the increase in
drilling activity noted in Figure 15. This statistic portrays only part of the story. Since employment data is
tracked by the physical location of the employer, the data doesn’t necessarily indicate where a company’s
employees are working. For instance, a drilling company could be located in a neighboring county, or even
out of state, and its employees would be counted in the employment statistics for that county and/or
state. However, the company’s drilling crew could actually be deployed in Butler County.
0
50
100
150
200
250
2007 2008 2009 2010 2011 2012 2013 2014 2015 2016 2017 2018
Allegheny Armstrong Beaver Butler Lawrence Westmoreland
FIGURE 17– MARCELLUS SHALE, SPUD WELLS 2007 TO 2018, FOR SELECTED COUNTIES
47

CRANBERRY TOWNSHIP MARKET PROFILE: 2018 Market Analysis Update
While there is no single statistical data source to capture the number of workers physically working in the
County, the number can be estimated using workforce statistics for the industry. According to a workforce
model developed by the Marcellus Shale Education and Training Center (MSETC Model) in Williamsport,
Pennsylvania, between 9.46 and 12.9 workers (average 11.18 workers) are required to prepare and drill a
natural gas well, depending upon whether a single well is being drilled, or if multiple wells are being drilled
at a single pad site. This estimate includes workers for drilling and for pipeline construction. These workers
move with drilling rigs and, unless their employer is physically located in the County, they are not counted
in the County’s employment. In addition to the workers who move with the drilling rigs, each well drilled
will require 0.39 permanent workers for production and processing throughout the production period.
Using the MSETC Model estimates, at an average efficiency of 11.18 workers per well, 791 workers would
have been required to drill Butler County’s 67 wells in 2017.
PROPOSED CRACKER FACILITY – BEAVER COUNTY
Shell Oil Co., a division of the Dutch petrochemical giant Royal Dutch Shell, purchased the former
Horsehead zinc smelter site in Potter Township, Beaver County, Pennsylvania. The facility has been vacant
since 2011. Shell has also purchased an additional 12 parcels in the area, investing over $50 million in
land acquisition.
FIGURE 18– TOTAL EMPLOYMENT – MINING, QUARRYING, AND NATURAL GAS, BUTLER COUNTY
QUARTERLY FROM 2010 THROUGH 2017
421379
426516
547564
434289
371470
479569
582620
682637
617655
684715
698657
688637
533531
553566
631665
275 325 375 425 475 525 575 625 675 725
2010-1
2010-3
2011-1
2011-3
2012-1
2012-3
2013-1
2013-3
2014-1
2014-3
2015-1
2015-3
2016-1
2016-3
2017-1
Total Employment Linear (Total Employment)
SOURCE: DELTA DEVELOPMENT GROUP, INC. AND LOCAL EMPLOYMENT DYNAMICS; MARCH 2018
48

CRANBERRY TOWNSHIP MARKET PROFILE: 2018 Market Analysis Update
The site will accommodate an ethane cracker which
would turn Marcellus Shale natural gas liquids into
polyethylene pellets for use in the plastic industry.
Currently, the liquid must be transported to plants
located near the Gulf of Mexico for processing. Shell
intends to feed the plant with ethane by pipeline, and
then transport the product out on rail lines.
The site has been acquired, and site preparation work
is progressing. Shell made a final investment decision
in June 2016 to move forward with building the
ethane cracker facility. In November 2017, Shell
launched the next phase of facility construction; total
investment in the site will be approximately $6
billion. The core of the plant will include a single ethane cracker and three polyethylene processing units.
The facility will also include a 250-megawatt natural gas fired power plant, as well as a 900-foot long
cooling structure.
As reported by Shell, the plant would create an
estimated 6,000 construction jobs, in addition to 600
operational positions. Construction would typically
take five years from the initial site preparation to full
operation.
The greatest opportunity for business retention,
expansion and attraction will lie within this supply of
the polyethylene pellets and their use within the
plastic industry. Cranberry Township’s proximity to
the feedstock, consumer markets, and access to major
transportation corridors provides an excellent
marketing opportunity for business recruitment.
ETHANE CRACKER RELATED OPPORTUNITIES
The Pennsylvania Department of Community and Economic Development (PA DCED) in partnership with
the Team Pennsylvania commissioned a study to understand the potential impacts resulting from the
ethane cracker plant and Marcellus and Utica Shale production. The resulting study, Prospects to Enhance
Pennsylvania’s Opportunities in Petrochemical Manufacturing, was completed by IHS Markit in March
2017; this study provides insight into specific industries that could expand due to a fully operational
ethane cracker plant in the region. The study also evaluated opportunities from the expanding Marcellus
and Utica Shale production.
Source: Reid Frazier – The Allegheny Front
49

CRANBERRY TOWNSHIP MARKET PROFILE: 2018 Market Analysis Update
The report finds that natural gas and natural gas liquid production is abundant within the Marcellus and
Utica Shale formations beneath Pennsylvania. Drilling activity in this region has remained economical
despite relatively weak natural gas prices in the market. A key to this efficiency is the high natural gas
liquids content (approximately 30 to 40 percent of the natural gas extracted), which is mostly comprised
of ethane and propane (nearly 70 percent of the natural gas liquid). The Marcellus and Utica Shale gas in
the region is rich in content.
According to the IHS Markit study, the Marcellus and Utica Shale gas production, specifically the
abundance of ethane, could support an additional four ethane cracker plants even after accounting for
the projected production from the under-construction Shell plant in Southwest Pennsylvania.
The Shell plant will produce 1.5 million metric tons per year of ethylene that will be further processed to
generate 1.0 million metric tons per year of high-density polyethylene (HDPE) and 550,000 metric tons
per year of linear low-density polyethylene (LLDPE). HDPE and LLDPE are plastic resins that have
experienced increasing demand in manufacturing.
Plastic resins produced in the region will be competitive on a global market due first to the relatively low
cost of producing ethane from the Marcellus and Utica Shale production, and secondly from the proximity
to plastic resin demand, which results in freight savings. The DCED/Team PA report concludes:
“To maximize the potential economic development benefits of increasing natural gas
liquids production volumes and related investment, including both attracting additional
FIGURE 19– ETHYLENE CHAIN
50

CRANBERRY TOWNSHIP MARKET PROFILE: 2018 Market Analysis Update
petrochemical companies and expanding the plastics manufacturing sector, HIS Markit
recommends that Pennsylvania take aggressive action to address potential development
and infrastructure constraints proactively. This includes investing in suitable sites to
accelerate pad-ready development and supporting natural gas liquid pipeline
infrastructure and storage capacity.”
The increasing natural gas production and specifically the ethane cracker plant presents an opportunity
for Cranberry Township to benefit by supporting manufacturers seeking sites with amenities in proximity
to the ethane cracker plant.
BUSINESS RETENTION AND RECRUITMENT RECOMMENDATIONS
The proposed Ethane Cracker in Beaver County will provide opportunities for growth and new business
attraction. The ethane products are used by specific chemical (NAICS 325) and plastics manufacturers
(NAICS 3261). The logistics industry is also expected to be directly impact by the new ethane cracker
operation. These target industries generally include the following:
➢ Plastic and resin manufacturing
➢ Adhesive manufacturing
➢ Plastic pipe and parts
➢ Laminated plastic
➢ Plastics wholesaling
➢ Logistics
Some producers may benefit from co-locating near the ethane cracker plant, depending if it is more cost
effective to ship their output products rather than ship the plastic resin inputs. There are approximately
90 manufacturers located in Pennsylvania that either use the exact resins that would be produced from
the ethane cracker plant or similar resins.
According to Local Employment Dynamics data analyzed by Delta as part of this study, Butler County
currently has businesses identified in the Other Chemical Product and Preparation Manufacturing (NAICS
3259) and Plastics Products Manufacturing (NAICS 3261) industries. The change in quarterly employment
for both these industry sectors was compared with Pennsylvania’s overall change in employment for those
sectors.
The Other Chemical Product and Preparation Manufacturing subsector shows a decreasing trendline for
Pennsylvania’s employment from the first quarter of 2010 through the fourth quarter of 2016. During the
same period, Butler County’s employment in this subsector decreased as well, but shows a more stable
trendline as seen in Figure 20.
51
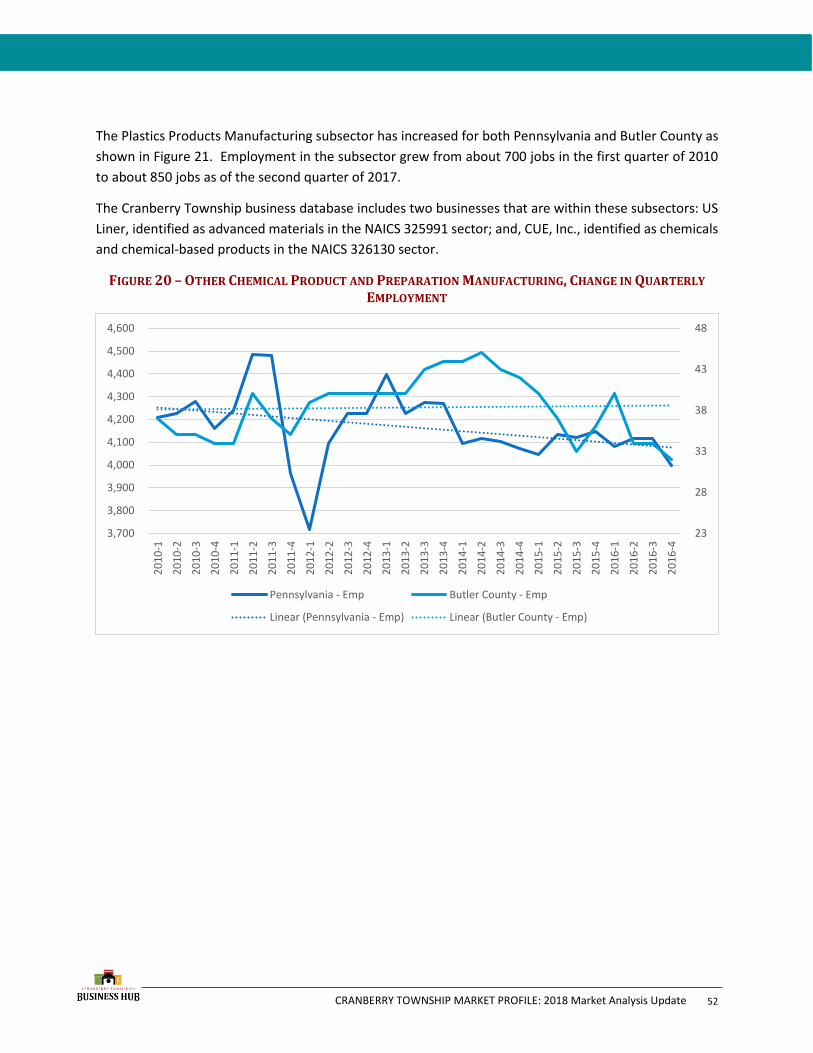
CRANBERRY TOWNSHIP MARKET PROFILE: 2018 Market Analysis Update
The Plastics Products Manufacturing subsector has increased for both Pennsylvania and Butler County as
shown in Figure 21. Employment in the subsector grew from about 700 jobs in the first quarter of 2010
to about 850 jobs as of the second quarter of 2017.
The Cranberry Township business database includes two businesses that are within these subsectors: US
Liner, identified as advanced materials in the NAICS 325991 sector; and, CUE, Inc., identified as chemicals
and chemical-based products in the NAICS 326130 sector.
23
28
33
38
43
48
3,700
3,800
3,900
4,000
4,100
4,200
4,300
4,400
4,500
4,600
20
10
-1
20
10
-2
20
10
-3
20
10
-4
20
11
-1
20
11
-2
20
11
-3
20
11
-4
20
12
-1
20
12
-2
20
12
-3
20
12
-4
20
13
-1
20
13
-2
20
13
-3
20
13
-4
20
14
-1
20
14
-2
20
14
-3
20
14
-4
20
15
-1
20
15
-2
20
15
-3
20
15
-4
20
16
-1
20
16
-2
20
16
-3
20
16
-4
Pennsylvania - Emp Butler County - Emp
Linear (Pennsylvania - Emp) Linear (Butler County - Emp)
FIGURE 20 – OTHER CHEMICAL PRODUCT AND PREPARATION MANUFACTURING, CHANGE IN QUARTERLY
EMPLOYMENT
52

CRANBERRY TOWNSHIP MARKET PROFILE: 2018 Market Analysis Update
In order to retain and expand current industry, the Township should periodically survey all industry to
determine their needs for growth, and to identify any warning signs that the industry may be downsizing
or closing. Meeting periodically with CEOs and operation managers for these industries should become a
routine practice for the Township.
As the Marcellus Shale industry continues to grow, Cranberry Township should work to develop the
following:
1. Inventory of all available industrial sites.
2. Continue to market key assets including access to major transportation corridors, proximity to
customers, skilled workforce, and key employers.
3. Develop and improve critical infrastructure including roads, water and sewer.
4. Work with Butler County Community College to ensure the workforce is prepared for the new
industry that may result from the construction of the Cracker.
650
700
750
800
850
900
30,000
31,000
32,000
33,000
34,000
35,000
36,000
37,000
20
10
-1
20
10
-2
20
10
-3
20
10
-4
20
11
-1
20
11
-2
20
11
-3
20
11
-4
20
12
-1
20
12
-2
20
12
-3
20
12
-4
20
13
-1
20
13
-2
20
13
-3
20
13
-4
20
14
-1
20
14
-2
20
14
-3
20
14
-4
20
15
-1
20
15
-2
20
15
-3
20
15
-4
20
16
-1
20
16
-2
20
16
-3
20
16
-4
20
17
-1
20
17
-2
Pennsylvania - Emp Butler County - Emp
Linear (Pennsylvania - Emp) Linear (Butler County - Emp)
FIGURE 22 – PLASTICS PRODUCTS MANUFACTURING, CHANGE IN QUARTERLY EMPLOYMENT
53