2018 mbncanada performance measurement report 1
TRANSCRIPT

2018 MBNCanada Performance Measurement Report 1


2018 MBNCanada Performance Measurement Report 3
A Message from the Board …………………………………………. 4 MBN Canada Framework …………………………………………… 5 Performance Report Overview ………………………………….. 6 How to Read a Graph ……………………………………………….... 8 Who Reports What…………………………………………………….. 9 Executive Summary …………………………………………………… 11 2018 Municipal Data ………………………………………………..... 12
Service Area Sections Accounts Payable ……………………………………………………... 14
Building Permits & Inspections ………………………………… 20 By-law Enforcement …………………………………………………. 25 Child Care …………………………………………………………………. 34 Clerks ……………………………………………………………………...... 41
Culture ……………………………………………………………………… 47
Emergency Medical Services (EMS) ………………………..... 52
Emergency Shelters ………………………………………………..... 61
Facilities ……………………………………………………………………. 67
Fire and Rescue Services ………………………………………….. 73
Fleet ……………………………………………………………………….... 80
General Government ………………………………………………... 88
General Revenue ……………………………………………………… 92
Human Resources …………………………………………………..... 98
Information Technology …………………………………………. 102
Investment Management ………………………………………... 107
Legal ……………………………………………………………………….. 112
Libraries ………………………………………………………………….. 117
Licensing …………………………………………………………………. 123
Long Term Care (LTC) …………………………………………….. 132
Parking …………………………………………………………………… 138
Parks ……………………………………………………………………….. 144
Payroll……………………………………………………………………… 150
Planning ………………………………………………………………….. 154
Provincial Offences Act—POA (Court Services) ……………. 158
Police Services ………………………………………………………… 164
Purchasing ………………………………………………………………. 176
Roads ……………………………………………………………………… 181
Social Assistance …………………………………………………….. 189
Social Housing ………………………………………………………… 193
Sports & Recreation ………………………………………………... 198
Taxation ………………………………………………………………….. 205
Transit …………………………………………………………………….. 211
Waste Management ……………………………………………….. 216
Wastewater ……………………………………………………………. 225
Water ……………………………………………………………………… 233
Contacts ………………………………………………………………. 240
TABLE OF CONTENTS

2018 MBNCanada Performance Measurement Report 4
The MBNCanada Board is pleased to present the 2018 MBNCanada Performance Measurement Report. MBNCanada is a collaborative
of Canadian municipalities whose mission is to enhance municipal service delivery by leading the development and application of
municipal performance measurement and benchmarking. MBNCanada collects data from across 36 municipal service areas that informs
evidence-based decision making and ensures our member municipalities are providing effective and efficient public services that
citizens want and need.
Through participation in MBNCanada, member municipalities have the opportunity to see what others are doing and to learn from each
other. The collaborative approach to measure development, data collection and analysis, as well as, regular opportunities to network
allow our members to establish baselines, recognize trends, celebrate successes and identify opportunities to continuously improve
performance.
Over the past several years, we have focused on key strategic priorities by strengthening internal operations, implementing a measure
review project, which looks at each service from the perspective of the customer, and investigating opportunities to network and build
capacity. Throughout the coming year, we will continue our work to strengthen our measures and data collection processes to facilitate
the identification of best practices and improved performance.
We would like to take this opportunity to thank our Municipal Leads and our municipal service area experts for their commitment to
MBNCanada. Their contributions and expertise and their collaboration with the Program Office are essential to the success of this
collaborative.
Chris Murray, Chair, MBNCanada City Manager, City of Toronto
A MESSAGE FROM THE BOARD

2018 MBNCanada Performance Measurement Report 5
Each measure within the framework is assigned a measure source that reflects the relevant service area and measure classification (i.e., Community Impact—100 series; Service Level - 200 series; Efficiency—300 Series and Customer Service - 400 Series). Other measures included in this report are Statistics (800 Series), which may be used to calculate other measures. Sources can be found at the bottom of the tables for each of the measures in this performance report. For example, the measure Total Percent of General Revenue Billed has a measure source of GREV210 (Service Level).
MBN CANADA FRAMEWORK
MBNCanada’s benchmarking framework includes four types of measures (measure classifications): community impact, service level, efficiency and customer service. The first two evaluate “what we do”—basically Council’s decisions. The second two evaluate “how well we do it”—in
essence, staff’s delivery of the service.

2018 MBNCanada Performance Measurement Report 6
PERFORMANCE REPORT OVERVIEW
Amortization
Amortization rates and capitalization thresholds are unique to each individual municipality and can lead to significant differences between operating cost and total cost.
Cost Methodology
MBNCanada reports the total cost for a service wherever possible. This calculation includes the operating cost, plus amortization. In a few instances, the operating cost only is reported because there is no amortization. Measures that do not fully follow this cost methodology will utilize a measure name indicating “Direct Cost ”.
Government Structure
Single-tier: A municipality (or City) that does not form part of an upper-tier municipality for municipal purposes and assumes all municipal responsibilities set out under the Municipal Act and/or Provincial legislation.
Upper-tier: A municipality (or Region) that is formed by two or more lower-tier municipalities. Municipal responsibilities set out under the Municipal Act and/or Provincial legislation are split between the upper-tier and lower-tier municipalities.
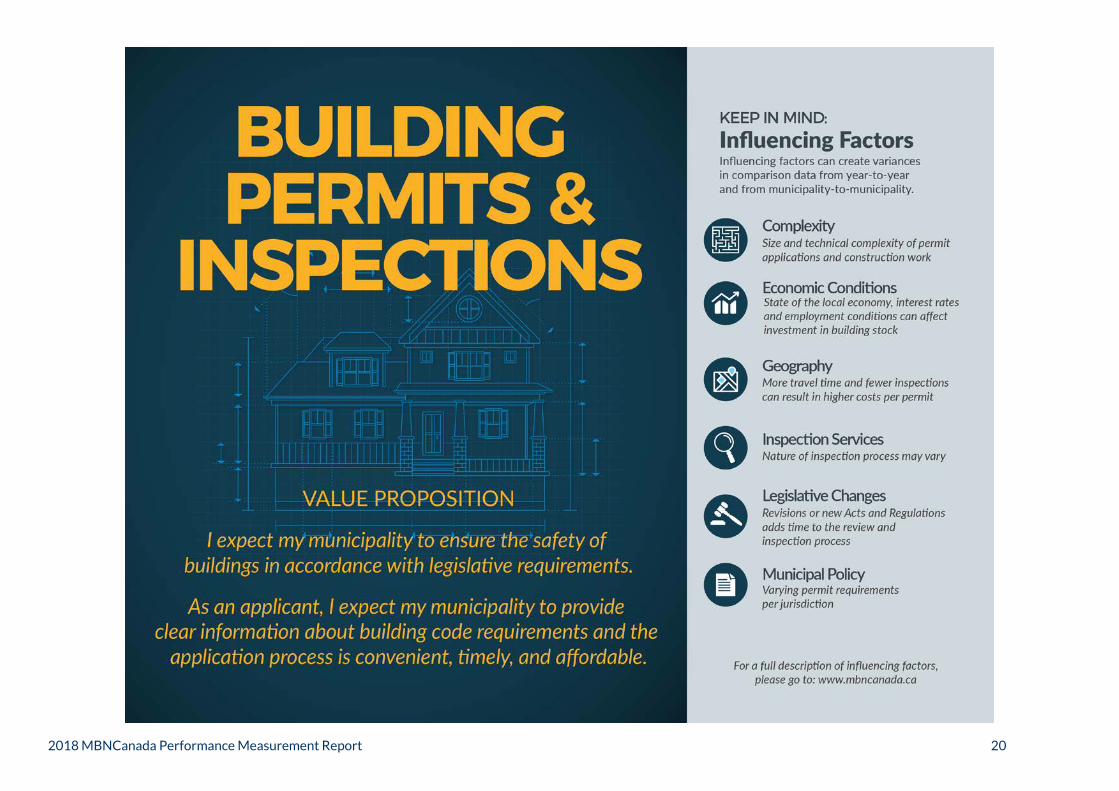
Influencing Factors
Results can be influenced by a number of factors. For the purposes of this report, an abbreviated version of influencing factors is located on the Snapshot page for each service area. Influencing factors are presented in alphabetical order; importance varies by municipality. The full description of influencing factors for each service area can be found at: www.mbncanada.ca, in the individual service area sections.

2018 MBNCanada Performance Measurement Report 7
Measure Source Update
Starting in 2018, many measures had their original source (ID) changed to remove the reference to the Municipal Performance Measurement Program (MPMP) and many measures were re-numbered to reflect correct measure classification. The new measure IDs are presented underneath each graph, with reference to the previous measure source [e.g., Source: BLDG801 (Statistic) Formerly BLDG206.]
Ontario Specific Measures
The following services areas are reported by Ontario municipal members only due to provincial funding and reporting requirements: Child Care, Emergency Medical Services (EMS), Emergency Shelters, Long-Term Care, Provincial Offences Act (POA), Social Assistance and Social Housing.
Population Figures
In 2019, Statistics Canada adjusted its population estimates for the previous years. For those municipalities impacted by these adjusted figures, per capita measures may not be comparable to previous years.
Results
The results presented in the report were downloaded from the MBNCanada Data Warehouse on September 27, 2019. Changes made after this date are not reflected in the report. Questions regarding the report can be directed to the Municipal Lead. See page 223 for a list of contacts.
PERFORMANCE REPORT OVERVIEW
2018 MBNCanada Performance Measurement Report 8
Partner Municipalities and Abbreviations
City of Calgary CAL
Region of Durham DUR
Halton Region HAL
City of Hamilton HAM
Halifax Regional Municipality HFX
City of London LON
City of Montreal MTL
Niagara Region NIAG
City of Regina REG
City of Greater Sudbury SUD
City of Thunder Bay TBAY
City of Toronto TOR
Region of Waterloo WAT
City of Windsor WIND
City of Winnipeg WINN
York Region YORK
Median MEDIAN
HOW TO READ A GRAPH
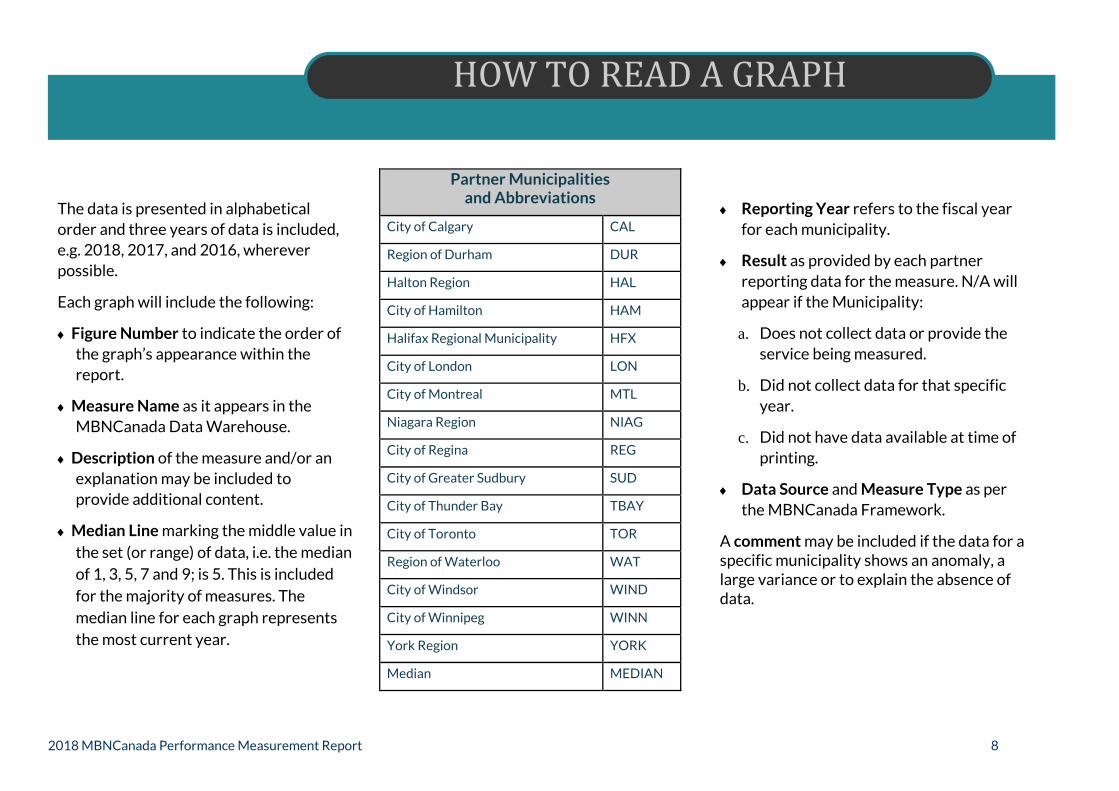
The data is presented in alphabetical order and three years of data is included, e.g. 2018, 2017, and 2016, whereverpossible.
Each graph will include the following:
♦ Figure Number to indicate the order ofthe graph’s appearance within thereport.
♦ Measure Name as it appears in theMBNCanada Data Warehouse.
♦ Description of the measure and/or anexplanation may be included toprovide additional content.
♦ Median Line marking the middle value inthe set (or range) of data, i.e. the medianof 1, 3, 5, 7 and 9; is 5. This is includedfor the majority of measures. Themedian line for each graph representsthe most current year.
♦ Reporting Year refers to the fiscal yearfor each municipality.
♦ Result as provided by each partnerreporting data for the measure. N/A willappear if the Municipality:
a. Does not collect data or provide theservice being measured.
b. Did not collect data for that specificyear.
c. Did not have data available at time ofprinting.
♦ Data Source and Measure Type as perthe MBNCanada Framework.
A comment may be included if the data for a specific municipality shows an anomaly, a large variance or to explain the absence of data.

2018 MBNCanada Performance Measurement Report 9
SECTION SERVICE AREA CAL DUR HAL HAM HFX LON MTL NIAG REG SUD TBAY TOR WAT WIND WINN YORK# OF
PARTICIPATING MUNICIPALITIES
1 Accounts Payable x x x x x x x x x x x x x x x x 16
2Building Permits and
Inspectionx x x x x x x x x x x 11
3 By-law Enforcement x x x x x x x x x x 10
4 Child Care x x x x x x x x x x 10
5 Clerks x x x x x x x x x x x x x x x x 16
6 Culture x x x x x x x x x x 10
7Emergency Medical
Services (EMS)x x x x x x x x x x x x 12
8 Emergency Shelters x x x x x x x x x x 10
9 Facilities x x x x x x x x x x x x x x x x 16
10 Fire Services x x x x x x x x x x x 11
11 Fleet x x x x x x x x x x x x x x x 15
12 General Government x x x x x x x x x x x x x x x x 16
13 General Revenue x x x x x x x x x x x x x x x 15
14 Human Resources x x x x x x x x x x x x x x x x 16
15Information Technology
x x x x x x x x x x x x x x x x 16
16Investment
Managementx x x x x x x x x x x x x x x x 16
17 Legal x x x x x x x x x x x x x x x 15
18 Libraries x x x x x x x x x x x 11
WHO REPORTS WHAT Service delivery differs between Single-tier municipalities (Calgary, Halifax, Hamilton, London, Montreal, Regina, Sudbury (Greater), Thunder Bay, Toronto, Windsor and Winnipeg) and Upper-tier municipalities (Durham, Halton, Niagara, Waterloo and York); therefore, not all partners collect and/or report for all service areas. This chart reflects the data that has been provided by each municipality in this report.

2018 MBNCanada Performance Measurement Report 10
SECTION SERVICE AREA CAL DUR HAL HAM HFX LON MTL NIAG REG SUD TBAY TOR WAT WIND WINN YORK# OF PARTICIPATING
MUNICIPALITIES
19 Licensing x x x x x x x x x x x x 12
20 Long Term Care x x x x x x x x x x x 11
21 Parking x x x x x x x x x x x 11
22 Parks x x x x x x x x x x x 11
23 Payroll x x x x x x x x x x x x x x x x 16
24 Planning x x x x x x x x x x x x x x x 15
25POA (Court
Services)x x x x x x x x x x 10
26 Police Services x x x x x x x x x x x x x x x x 16
27 Purchasing x x x x x x x x x x x x x x x 15
28 Roads x x x x x x x x x x x x x x x x 16
29 Social Assistance x x x x x x x x x x 10
30 Social Housing x x x x x x x x x x 10
31Sports and Recreation
x x x x x x x x x 9
32 Taxation x x x x x x x x x x x 11
33 Transit x x x x x x x x x x x x x 13
34Waste
Managementx x x x x x x x x x x x x x x x 16
35 Wastewater x x x x x x x x x x x x x x x x 16
36 Water x x x x x x x x x x x x x x x x 16
# OF SERVICE AREAS REPORTING
29 25 24 36 28 35 28 25 28 36 31 36 28 36 27 26
WHO REPORTS WHAT Service delivery differs between Single-tier municipalities (Calgary, Halifax, Hamilton, London, Montreal, Regina, Sudbury (Greater), Thunder Bay, Toronto, Windsor and Winnipeg) and Upper-tier municipalities (Durham, Halton, Niagara, Waterloo and York); therefore, not all partners collect and/or report for all service areas. This chart reflects the data that has been provided by each municipality in this report.

2018 MBNCanada Performance Measurement Report 11
EXECUTIVE SUMMARY
In the last year, MBNCanada has continued to advance our strategic plan through several organizational and process reviews. With a strategic plan in place, the Board has embraced a new direction to look at measures from the perspective of the customer. Through this work, MBNCanada will ensure accountability and transparency and continue to build trust and confidence in Municipal Government.
During my tenure as Executive Director, MBNCanada has come a long way from its beginning as an Ontario-based program. It has been an honour and privilege to serve the MBNCanada Board of Directors, and to work with Municipal Lead Co-chairs, Municipal Leads and staff from across the network.
Connie Wheeler Former Executive Director
The 2018 MBNCanada Performance Measurement Report presents the results of 11 single-tier and 5 upper-tier municipalities, representing 6 provinces. This is the 13th public performance report and includes 168 measures across 36 municipal service areas.
Each service area begins with a ‘snapshot’ which includes the current value proposition and highlights the key influencing factors for the measures in that service area. Within the service area performance graphs, a description may be provided under the figure name to provide additional context to the specific graph and/or table. Factors that speak to the uniqueness of a particular municipality or provide a more detailed explanation of a municipal result may appear under the table below the measure source. Three years of data is displayed for the majority of measures, although there are instances where only one or two years may appear. All data is peer reviewed prior to publishing.
MBNCanada provides an opportunity for municipal staff from across the country to collaborate, share their knowledge and learn from each other. The results contained within this report are used to initiate conversations about best practices and processes, and to identify opportunities to enhance service. It is this collaboration that continues to strengthen MBNCanada and to move from data to action.
Meighan Finlay Executive Director
2018 MBNCanada Performance Measurement Report 12
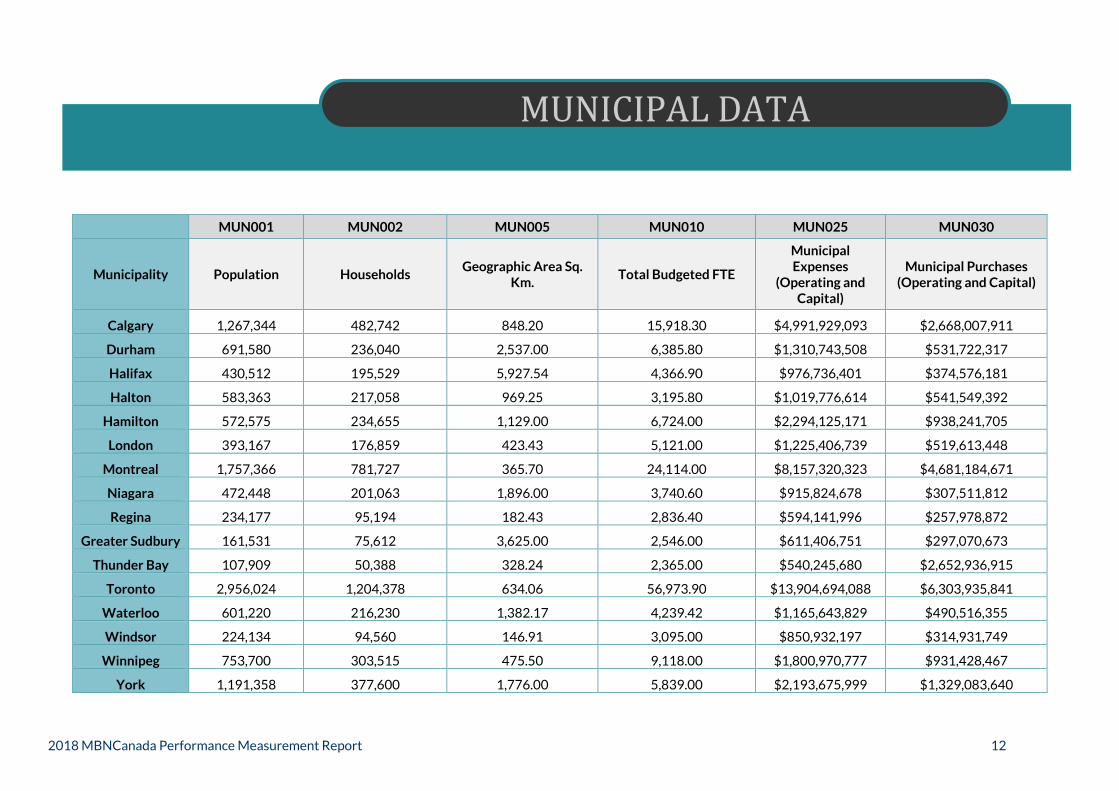
MUN001 MUN002 MUN005 MUN010 MUN025 MUN030
Municipality Population Households Geographic Area Sq.
Km. Total Budgeted FTE
Municipal Expenses
(Operating and Capital)
Municipal Purchases (Operating and Capital)
Calgary 1,267,344 482,742 848.20 15,918.30 $4,991,929,093 $2,668,007,911
Durham 691,580 236,040 2,537.00 6,385.80 $1,310,743,508 $531,722,317
Halifax 430,512 195,529 5,927.54 4,366.90 $976,736,401 $374,576,181
Halton 583,363 217,058 969.25 3,195.80 $1,019,776,614 $541,549,392
Hamilton 572,575 234,655 1,129.00 6,724.00 $2,294,125,171 $938,241,705
London 393,167 176,859 423.43 5,121.00 $1,225,406,739 $519,613,448
Montreal 1,757,366 781,727 365.70 24,114.00 $8,157,320,323 $4,681,184,671
Niagara 472,448 201,063 1,896.00 3,740.60 $915,824,678 $307,511,812
Regina 234,177 95,194 182.43 2,836.40 $594,141,996 $257,978,872
Greater Sudbury 161,531 75,612 3,625.00 2,546.00 $611,406,751 $297,070,673
Thunder Bay 107,909 50,388 328.24 2,365.00 $540,245,680 $2,652,936,915
Toronto 2,956,024 1,204,378 634.06 56,973.90 $13,904,694,088 $6,303,935,841
Waterloo 601,220 216,230 1,382.17 4,239.42 $1,165,643,829 $490,516,355
Windsor 224,134 94,560 146.91 3,095.00 $850,932,197 $314,931,749
Winnipeg 753,700 303,515 475.50 9,118.00 $1,800,970,777 $931,428,467
York 1,191,358 377,600 1,776.00 5,839.00 $2,193,675,999 $1,329,083,640
MUNICIPAL DATA

2018 MBNCanada Performance Measurement Report 13

2018 MBNCanada Performance Measurement Report 14

2018 MBNCanada Performance Measurement Report 15
Accounts Payable
Figure 1.1 Total Number of Invoices Processed per $1,000,000 of Municipal Purchases (Operating and Capital) for Goods and Services
The measure represents how many invoices are processed by the Accounts Payable division in the reporting year per $1,000,000 of municipal purchases. Invoices counted in this calculation include paper and electronic purchase orders, non-purchase orders, and P-card (purchasing or procurement) payments.
2016 177 264 137 325 N/A 184 266 180 306 297 401 150 261 271 185 102 261
2017 181 273 153 301 240 175 228 262 272 274 430 146 278 243 189 82 242
2018 173 265 156 257 265 186 187 316 298 280 421 133 352 230 153 94 244
Source: FINV230 (Service Level)

2018 MBNCanada Performance Measurement Report 16
Accounts Payable
Figure 1.2 Accounts Payable Operating Cost per Invoice Processed
This measure represents the operating cost directly associated with the processing of accounts payable invoices. Invoices counted in this calculation include paper and electronic purchases orders, non-purchase orders, and P-card (purchasing or procurement) payments.
2016 $7.08 $7.46 $6.66 $4.51 N/A $7.50 $4.09 $5.75 $9.09 $5.85 $6.02 $11.20 $3.46 $8.25 $6.32 $5.91 $6.32
2017 $6.56 $7.52 $6.87 $4.50 $7.37 $7.63 $4.62 $5.58 $7.65 $5.43 $5.66 $11.32 $2.96 $8.66 $6.68 $6.56 $6.62
2018 $7.08 $7.65 $8.70 $4.19 $7.39 $7.75 $5.29 $5.53 $10.03 $5.44 $6.56 $11.12 $2.67 $8.14 $6.77 $6.61 $6.93
Source: FINV317 (Efficiency)

2018 MBNCanada Performance Measurement Report 17
Accounts Payable
Figure 1.3 Number of Invoices Processed per Accounts Payable FTE
The measure represents the number of invoices processed by each accounts payable staff member. The types of invoices included are paper and electronic purchase orders, non-purchase orders, and P-card (purchasing card or procurement) payments.
2016 15,808 10,474 15,311 21,871 N/A 12,003 20,934 12,367 8,968 12,217 12,196 11,533 19,962 8,102 13,107 18,476 12,367
2017 18,515 10,429 15,139 22,193 9,502 12,208 19,622 12,034 9,653 13,682 12,019 12,542 17,721 7,888 13,151 17,258 12,847
2018 18,059 10,961 13,718 22,950 9,923 12,872 14,753 13,018 9,146 14,366 12,297 13,509 18,413 8,654 14,236 19,267 13,614
Source: FINV325 (Efficiency)
Montreal: Temporary positions have been created to make up for a significant delay in the billing period and to facilitate the transition to the new accounts payable system.

2018 MBNCanada Performance Measurement Report 18
Accounts Payable
Figure 1.4 Percent of Invoices Paid Within 30 Days
This measure represents the proportion of invoices paid within 30 days after the invoice date.
2016 83.5% 75.3% 65.5% 76.7% N/A 83.0% 69.8% 95.8% 88.9% 59.6% 79.7% 64.7% 85.4% 73.7% 72.1% 57.2% 75.3%
2017 87.3% 72.4% 68.2% 78.5% 55.0% 83.9% 63.2% 81.5% 91.2% 56.4% 77.0% 68.4% 82.5% 66.7% 66.3% 52.2% 70.4%
2018 89.3% 75.1% 68.0% 78.8% 60.4% 81.4% 72.7% 83.3% 91.8% 63.6% 77.8% 69.0% 81.4% 63.4% 68.8% 55.9% 73.9%
Source: FINV410 (Customer Service)

2018 MBNCanada Performance Measurement Report 19
2018 MBNCanada Performance Measurement Report 20

2018 MBNCanada Performance Measurement Report 21
Building Permits & Inspections
Figure 2.1 Number of Residential and ICI (Industrial, Commercial & Institutional) Building Permits Issued in the Fiscal Year
Building Permits are defined as “permits required for construction” and are subject to the respective Building Code Act of each province.
IMPORTANT: In 2017, the definition for this measure was changed to exclude “other building permits”. In most cases, the removal of “other building permits” was not material.
2016 21,394 8,351 N/A 3,682 16,198 3,220 2,032 1,168 18,896 2,441 10,929
2017 20,353 7,155 3,439 3,865 16,741 2,974 1,761 1,068 19,865 3,580 11,669
2018 25,536 6,863 3,486 3,412 18,300 2,426 1,680 941 19,028 4,106 9,879
Source: BLDG801 (Statistic) Formerly BLDG206
Calgary: In 2018, Calgary received a significant amount of Multi-residential applications.
Windsor: The City has experienced an increase in residential work, partly due to the basement flooding subsidy program.
2018 MBNCanada Performance Measurement Report 22
Building Permits & Inspections
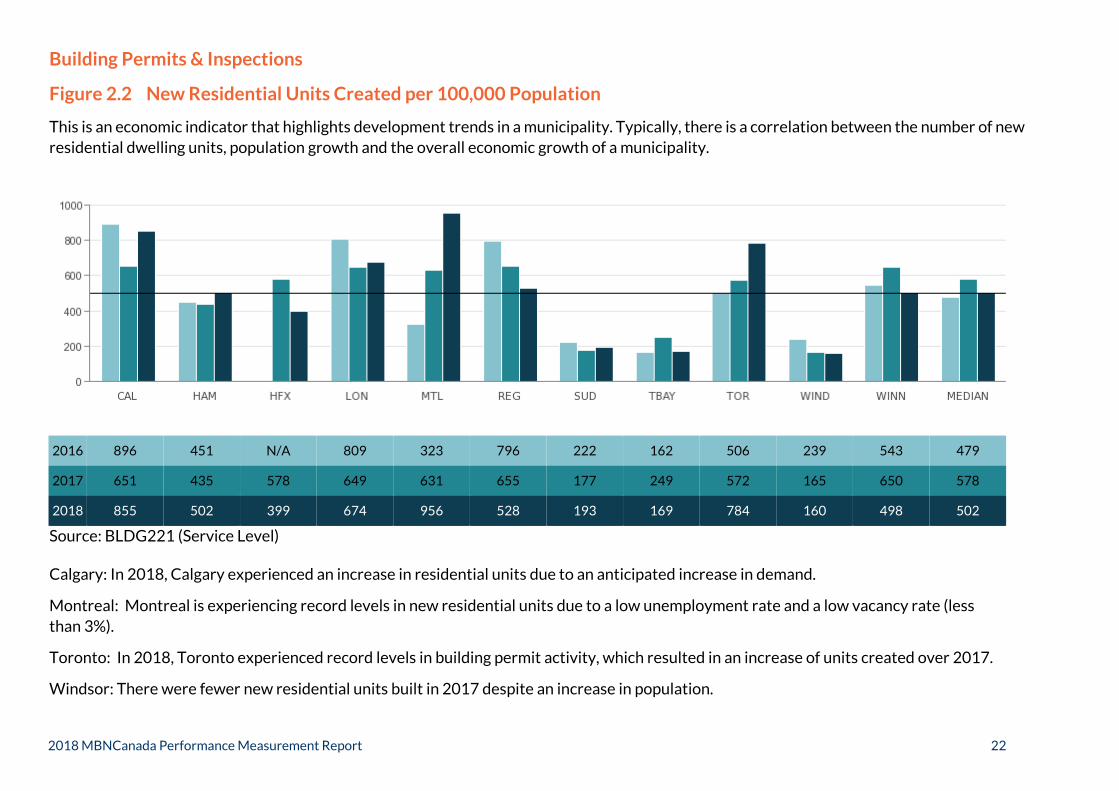
Figure 2.2 New Residential Units Created per 100,000 Population
This is an economic indicator that highlights development trends in a municipality. Typically, there is a correlation between the number of new residential dwelling units, population growth and the overall economic growth of a municipality.
2016 896 451 N/A 809 323 796 222 162 506 239 543 479
2017 651 435 578 649 631 655 177 249 572 165 650 578
2018 855 502 399 674 956 528 193 169 784 160 498 502
Source: BLDG221 (Service Level)
Calgary: In 2018, Calgary experienced an increase in residential units due to an anticipated increase in demand.
Montreal: Montreal is experiencing record levels in new residential units due to a low unemployment rate and a low vacancy rate (less than 3%).
Toronto: In 2018, Toronto experienced record levels in building permit activity, which resulted in an increase of units created over 2017.
Windsor: There were fewer new residential units built in 2017 despite an increase in population.

2018 MBNCanada Performance Measurement Report 23
Building Permits & Inspections
Figure 2.3 Operating Cost of Building Permits and Inspection Services per $1,000 of Residential and ICI (Industrial, Commercial and Institutional) Construction Value
This measure represents the operating costs associated with the provision of building permits and inspection services. The fluctuation in year over year results is impacted by the value of residential and ICI construction activity. IMPORTANT: In 2017, the definition for this measure was changed to exclude “other building permits”. In most cases, the removal of "other building permits" was not material; however the variance between 2017 results and that of prior years may be due to this change.
2016 $9.38 $11.75 N/A $3.36 $6.04 $14.92 $17.22 $7.69 $12.64 $4.78 $9.38
2017 $10.11 $10.17 $4.45 $4.72 $6.38 $9.93 $11.72 $6.65 $13.48 $5.49 $8.29
2018 $8.36 $10.48 $4.30 $5.86 $9.75 $13.97 $19.34 $5.55 $16.54 $7.25 $9.06
Source: BLDG325 (Efficiency) Formerly BLDG325M
Montreal: Does not track.
Sudbury: The result reflects near-double increase in construction value in 2017, mostly in the mining sector.
Thunder Bay: Overall downturn in permit activity.
Windsor: While the number of permits being issued is robust, the overall value of construction compared to previous years is significantly less due to the small size of the typical project, which has impacted the 2018 results.

2018 MBNCanada Performance Measurement Report 24

2018 MBNCanada Performance Measurement Report 25

2018 MBNCanada Performance Measurement Report 26
By-Law Enforcement
Figure 3.1 Number of Noise, Property Standards, Yard Maintenance and Zoning By-law Complaints per 100,000 Population
The measure includes reactive (citizen-initiated) and proactive (municipally-initiated) investigations logged.
2016 2,451 2,847 N/A 1,169 N/A 1,193 774 1,537 3,474 1,938 1,738
2017 2,501 2,416 839 1,441 2,369 1,250 894 1,651 3,870 1,725 1,688
2018 2,494 2,496 804 1,468 2,422 1,567 915 1,670 3,823 1,770 1,720
Source: BYLW205 (Service Level)
Windsor: The City has traditionally seen a higher number of citizen complaints through their 311 Call Centre.

2018 MBNCanada Performance Measurement Report 27
By-Law Enforcement
Figure 3.2 Number of Inspections per Noise, Property Standards, Yard Maintenance and Zoning By-law Complaint
Inspections are used to verify the validity of a complaint and/or remedial actions taken. Lower results may be due to alternative methods of citizen interaction, e.g. sending a letter and/or calling a citizen.
2016 1.39 2.32 N/A 2.50 N/A 1.17 3.20 1.39 1.83 2.24 2.04
2017 1.31 1.86 1.91 2.51 2.24 0.86 3.21 1.30 1.55 0.99 1.71
2018 1.07 1.53 2.71 2.42 2.12 0.81 3.44 1.17 1.53 0.91 1.53
Source: BYLW226 (Service Level)
Windsor: In 2017, the City resolved more complaints with fewer site visits, which has continued for 2018.

2018 MBNCanada Performance Measurement Report 28
By-Law Enforcement
Figure 3.3 Percent of Compliance to Noise, Property Standards, Yard Maintenance and Zoning By-laws
Experts interpret compliance to mean no municipal action or prosecution required. If a contractor is hired by the City or court action is taken, this would be considered non-compliance.
2016 97% 90% N/A 77% N/A 100% 94% 84% 69% 90% 90%
2017 98% 69% 89% 82% 89% 99% 96% 83% 66% 94% 89%
2018 98% 35% 95% 74% 92% 99% 97% 92% 69% 81% 92%
Source: BYLW120 (Community Impact)
Hamilton: A process change in mid 2018 has resulted in lower compliance. Officers are not re-issuing Orders for properties where there are repeat violations within the last 12 months. Repeat violations are issued an Administrative Penalty Notice. Fees for Inspection on the Property Taxes and/or Contractors are being sent to bring the property into compliance. This new procedure has affected our compliance as property owners are not given another chance to comply.
Toronto: The business practice of sending advisory letters has helped increase compliance across the City of Toronto.
Windsor: Increase in construction activity has limited our ability to deal with property standards and complaints which are enforced by by-laws in the City of Windsor.

2018 MBNCanada Performance Measurement Report 29
By-Law Enforcement
Figure 3.4 Percent of All By-law Complaints Represented by Noise, Property Standards, Yard Maintenance and Zoning By-laws
A variety of by-laws govern various aspects within municipalities. This measure compares the proportion of overall complaints that are represented by noise, property standards, yard maintenance and zoning by-laws.
2016 68% 76% N/A 56% N/A 68% 79% 92% 48% 97% 72%
2017 68% 69% 70% 66% 78% 77% 75% 92% 59% 97% 73%
2018 54% 72% 75% 57% 78% 69% 77% 91% 54% 91% 74%
Source: BYLW207 (Service Level)
Calgary: The main driver of the variance is due to the increase in total by-law complaints related to snow and ice. Therefore, the proportion related to noise, property, yard and zoning decreased.
Windsor: The data reflects calls received by our 311 Call Centre from residents. Windsor is below the median as we have more by-laws than most of our comparators.

2018 MBNCanada Performance Measurement Report 30
By-Law Enforcement
Figure 3.5 Operating Cost of Enforcement for Noise, Property Standards, Yard Maintenance and Zoning By-laws per 100,000 Population
This measure reports the operating costs relevant to the enforcement of noise, property standards, yard maintenance, and zoning by-laws. Municipalities have a variety of other by-laws which are not reflected in this measure.
2016 $611,780 $781,245 N/A $310,062 N/A $311,797 $545,849 $598,277 $744,151 $495,250 $572,063
2017 $530,314 $823,975 $450,166 $414,369 $827,776 $250,159 $542,288 $616,041 $774,539 $434,095 $536,301
2018 $396,366 $811,846 $433,676 $348,236 $788,108 $169,389 $550,423 $690,149 $1,107,078 $411,051 $492,050
Source: BYLW273 (Efficiency)
Calgary: The main driver of the variance is due to the increase in total by-law complaints related to snow and ice. Therefore, less officer time was dedicated to the enforcement of noise, property, yard and zoning by-laws.
Windsor: By-law operating costs increased due to a temporary pilot program approved by Council to administer and enforce the clean up and repair of rental and vacant properties.

2018 MBNCanada Performance Measurement Report 31
By-Law Enforcement
Figure 3.6 Operating Cost of Enforcement for Animal Control By-laws per 100,000 Population
This measure reports the operating costs to enforce animal control by-laws. The costs include animal shelters in some municipalities.
2016 $555,099 $740,714 N/A $569,523 $721,113 $475,144 $284,399 $546,137 $697,861 $555,927 $555,927
2017 $592,239 $763,171 $373,771 $603,310 $712,252 $581,359 $292,371 $583,007 $691,852 $476,326 $587,623
2018 $587,792 $771,879 $364,644 $567,650 $770,877 $587,824 $296,849 $573,261 $575,338 $379,879 $574,300
Source: BYLW275 (Efficiency)
Sudbury: 2017 was the first full year the City operated a municipal animal shelter.
Windsor: 2018 results reflect a decrease in cost for the 2018 Animal Control contract with the Humane Society and a 50% reduction in by-law enforcement hours being spent on animal control activities from the previous year.

2018 MBNCanada Performance Measurement Report 32
By-Law Enforcement
Figure 3.7 Percent of Recovery of Animal Control Costs
This measure reports the percentage of animal control operating costs that are recovered by user fees such as licensing and registration.
2016 70% 38% N/A 53% N/A 16% 34% 14% 10% 60% 36%
2017 66% N/A 16% 49% 26% 24% 31% 13% 12% 77% 26%
2018 66% 37% 14% 54% 22% 32% 32% 12% 14% 93% 32%
Source: BYLW318 (Efficiency)
Sudbury: 2017 was the first year the City operated a municipal animal shelter.
Winnipeg: In 2017, the revenues were adjusted due to a change in the deferred revenue liability calculation.

2018 MBNCanada Performance Measurement Report 33

2018 MBNCanada Performance Measurement Report 34

2018 MBNCanada Performance Measurement Report 35
Child Care
Figure 4.1 Regulated Child Care Spaces in Municipality per 1,000 Children (12 and Under)
The measure reflects the number of licensed spaces in child care centres, preschools and home child care agencies.
2016 229 296 209 221 202 255 205 180 189 313 215
2017 242 301 245 225 207 271 214 208 196 319 234
2018 251 318 260 227 208 276 223 216 205 326 239
Source: CHDC105 (Community Impact)

2018 MBNCanada Performance Measurement Report 36
Child Care
Figure 4.2 Percent of Spaces that are Subsidized
The results illustrate that high demand can be indicative of the number of lower-income families requiring child care. Other factors contributing to the results include total funding and the growth in total number of spaces created. This measure reflects the number of full day equivalents (FDE) as opposed to the actual number of children served.
2016 9% 6% 20% 17% 14% 15% 37% 15% 16% 10% 15%
2017 10% 7% 17% 17% 14% 15% 37% 11% 16% 11% 15%
2018 12% 6% 19% 18% 15% 16% 38% 12% 16% 12% 16%
Source: CHDC112 (Community Impact)

2018 MBNCanada Performance Measurement Report 37
Child Care
Figure 4.3 Percent of Children in the Municipality (12 and under) that are from Lower Income Families
This measure provides the percent of children in the municipality (12 and under) that are from lower income families, as measured by LICO (Low Income Cut-Offs – Statistics Canada) guideline.
2016 12% 9% 24% 22% 14% 20% 28% 12% 11% 15% 15%
2017 12% 9% 24% 22% 14% 20% 28% 12% 12% 15% 15%
2018 12% 9% 23% 22% 14% 20% 28% 12% 12% 15% 15%
Source: CHDC115 (Community Impact)

2018 MBNCanada Performance Measurement Report 38
Child Care
Figure 4.4 Total Cost per Child (12 and Under) in the Municipality
This measure reports the total cost to provide child care services for children 12 years and under and includes all funding sources. Increases to the 2018 ‘cost per child’ reflect increased 2018 Provincial funding, a portion of which was one-time funding.
2016 $561 $614 $841 $792 $751 $987 $1,289 $589 $744 $641 $748
2017 $637 $635 $878 $820 $839 $1,025 $1,383 $621 $793 $716 $807
2018 $803 $742 $1,168 $1,130 $1,065 $1,357 $1,708 $847 $1,099 $983 $1,082
Source: CHDC220T (Service Level)

2018 MBNCanada Performance Measurement Report 39
Child Care
Figure 4.5 Annual Child Care Cost per Normalized Subsidized Child Care Space
The annual gross fee subsidy cost has been normalized to reflect the mix of age groups and required staff ratios. A high cost result could reflect spaces that are being directly operated by a municipality as well as a higher cost of care in urban cities. There are opportunities to help support the cost of fee subsidy through other funding grants which may not be reflected in this measure.
2016 $7,199 $7,287 $5,266 $6,138 $6,758 $5,515 $6,072 $6,191 $4,813 $5,899 $6,105
2017 $6,809 $7,353 $5,447 $6,378 $6,644 $5,571 $6,176 $5,625 $4,903 $5,960 $6,068
2018 $6,933 $7,570 $5,493 $6,210 $5,778 $5,683 $5,496 $6,519 $4,909 $6,073 $5,926
Source: CHDC305 (Efficiency)

2018 MBNCanada Performance Measurement Report 40

2018 MBNCanada Performance Measurement Report 41

2018 MBNCanada Performance Measurement Report 42
Clerks
Figure 5.1 Number of Formal Freedom of Information Requests per 100,000 Population
This measure identifies the number of legislated freedom of information (FOI) requests, including Councillor requests that have gone through the FOI process in the reporting year.
2016 32 28 8 41 N/A 61 547 24 26 173 83 110 14 54 116 20 41
2017 30 23 9 34 115 59 608 28 37 167 69 99 13 63 115 19 48
2018 33 24 8 32 146 47 670 23 31 127 117 98 15 62 122 20 40
Source: CLKS270 (Service Level)
Montreal: Due to a decentralized model, when the City of Montreal receives a proper request, it may be forwarded to one or all of their 19 Boroughs, which significantly increases the number of requests; e.g., a request submitted to the City and sent to 7 of 19 Boroughs would count as 8 requests.

2018 MBNCanada Performance Measurement Report 43
Clerks
Figure 5.2 Direct Cost for Freedom of Information Program per Formal Request
This measure reports the cost to respond to freedom of information (FOI) program requests. The variety and complexity of these requests may impact the cost associated with administering the program.
2016 $2,489 $483 $1,472 $925 N/A $610 $157 $971 $456 $588 $408 $506 $698 $1,015 $738 $1,650 $698
2017 $2,595 $442 $1,305 $1,111 $608 $628 $132 $939 $448 $791 $770 $641 $799 $881 $662 $965 $781
2018 $1,485 $708 $1,560 $1,164 $569 $972 $127 $1,125 $665 $804 $492 $717 $709 $1,009 $628 $914 $761
Source: CLKS370 (Efficiency)
Durham: The number of complicated FOI requests increased from 3, in 2017 to 18 in 2018. Complicated requests require significantly more staff time than a standard request. Standard requests were relatively unchanged from 2017.

2018 MBNCanada Performance Measurement Report 44
Clerks
Figure 5.3 Percent of Formal Freedom of Information Requests Completed Within 30 Days
The measure identifies the number of formal freedom of information (FOI) requests, including Councillor requests that have gone through the FOI process, that were completed within 30 days. The variety and complexity of these requests may impact the timelines associated with administering the program.
2016 74% 97% 91% 82% N/A 70% 86% 88% 75% 100% 78% 57% 59% 92% 95% 80% 82%
2017 47% 96% 94% 81% 88% 92% 85% 92% 78% 85% 76% 70% 70% 94% 95% 79% 85%
2018 58% 98% 93% 78% 88% 99% 89% 90% 73% 88% 79% 65% 67% 87% 64% 85% 86%
Source: CLKS470 (Customer Service)

2018 MBNCanada Performance Measurement Report 45
Clerks
Figure 5.4 Percent of Formal Freedom of Information Requests, Extensions and 3rd Party Notices Completed Within Legislated Timelines
The number of formal freedom of information (FOI) requests, including Councillor requests that have gone through the FOI process, and handled within the legislated timelines applicable to the municipality. The variety and complexity of these requests may impact the timelines associated with administering the program.
2016 98% 97% 98% 82% N/A 77% 88% 98% 98% 100% 100% 59% 100% 98% 97% 85% 98%
2017 63% 98% 98% 79% 97% 100% 87% 97% 99% 91% 24% 76% 100% 97% 98% 81% 97%
2018 69% 100% 98% 78% 98% 98% 90% 97% 99% 99% 15% 73% 87% 89% 67% 87% 90%
Source: CLKS475 (Customer Service)
Thunder Bay: Change is due to increased complexity of requests.

2018 MBNCanada Performance Measurement Report 46

2018 MBNCanada Performance Measurement Report 47

2018 MBNCanada Performance Measurement Report 48
Culture
Figure 6.1 Arts, Heritage & Festival Grants Only per Capita
The measure represents the funding dollars provided for Arts, Heritage and Festivals grants only. The direct municipal investment in arts funding is relative to a city's service delivery model, size of its arts community and its funding envelope. For example, some municipalities provide funding to their "anchor" organizations, e.g. art gallery, community auditorium, theatre and symphony through grants versus municipally owned/operated facilities.
2016 $9.47 $5.56 N/A $4.72 $18.52 N/A $5.09 $18.27 $10.54 $1.07 $7.52
2017 $10.33 $5.91 $6.31 $5.36 $22.56 $6.96 $6.55 $17.91 $10.65 $1.05 $6.76
2018 $9.01 $5.84 $4.42 $4.47 $18.07 $7.01 $37.82 $18.05 $10.80 $1.04 $8.01
Source: CLTR125 (Community Impact)
Montreal: The result is impacted by contributions from the Provincial government.
Sudbury: A sizeable grant commitment to the Place des Arts major project accounts for the variance.

2018 MBNCanada Performance Measurement Report 49
Culture
Figure 6.2 Operating Cost for Arts, Heritage and Festival Grants Only per Capita
This measure reflects the grants provided by municipalities plus costs incurred to administer arts, heritage and festival grants only.
2016 $9.12 $5.56 N/A $5.49 N/A $7.63 $18.46 $10.88 $3.02 $7.63
2017 $10.84 $5.91 $7.15 $6.14 $11.67 $9.32 $18.10 $10.98 $1.05 $9.32
2018 $9.36 $5.84 $5.79 $5.36 $10.69 $40.28 $18.26 $11.61 $1.04 $9.36
Source: CLTR200 (Service Level)
Montreal: Does not track data.
Sudbury: A sizeable grant commitment to the Place des Arts major project accounts for the variance.
Windsor: The cost only includes the grants provided to the community by the municipality. No other administrative costs have been included.
2018 MBNCanada Performance Measurement Report 50
Culture
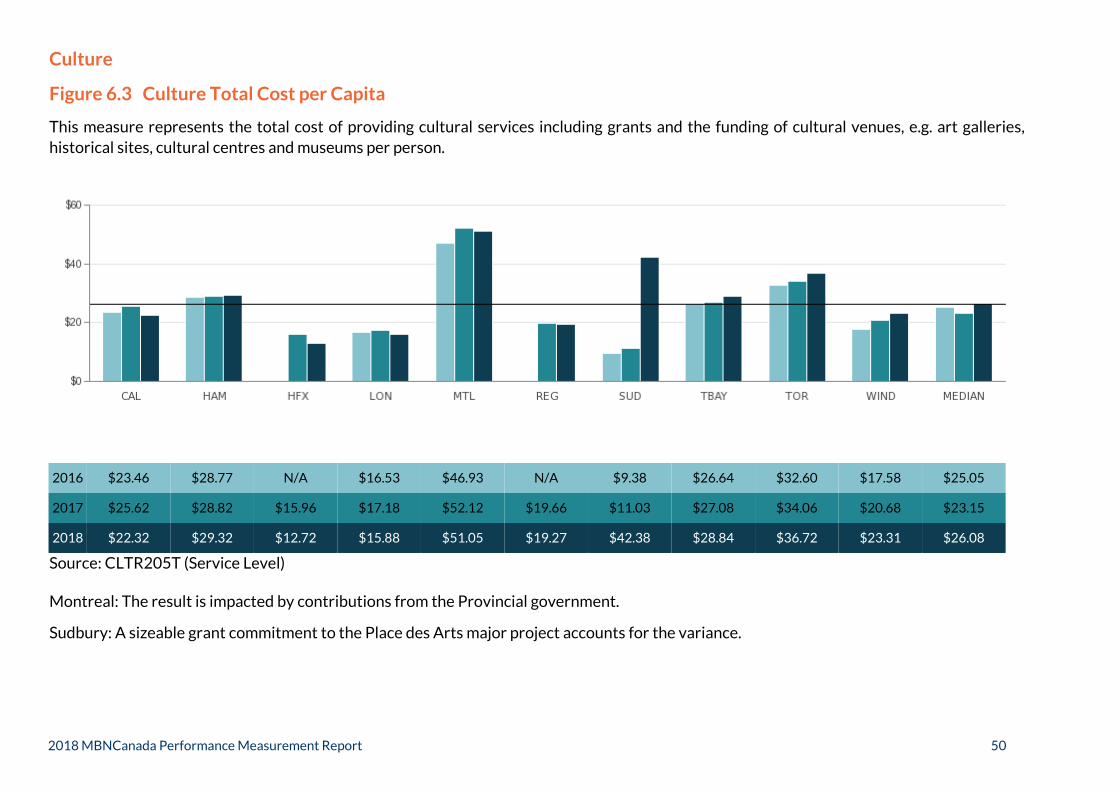
Figure 6.3 Culture Total Cost per Capita
This measure represents the total cost of providing cultural services including grants and the funding of cultural venues, e.g. art galleries, historical sites, cultural centres and museums per person.
2016 $23.46 $28.77 N/A $16.53 $46.93 N/A $9.38 $26.64 $32.60 $17.58 $25.05
2017 $25.62 $28.82 $15.96 $17.18 $52.12 $19.66 $11.03 $27.08 $34.06 $20.68 $23.15
2018 $22.32 $29.32 $12.72 $15.88 $51.05 $19.27 $42.38 $28.84 $36.72 $23.31 $26.08
Source: CLTR205T (Service Level)
Montreal: The result is impacted by contributions from the Provincial government.
Sudbury: A sizeable grant commitment to the Place des Arts major project accounts for the variance.

2018 MBNCanada Performance Measurement Report 51
2018 MBNCanada Performance Measurement Report 52

2018 MBNCanada Performance Measurement Report 53
Emergency Medical Services (EMS)
Figure 7.1 Unique Responses per 1,000 Population
This measure refers to the number of unique events responded to by Emergency Medical Services (EMS). This does not reflect the total number of EMS vehicles responding to events.
2016 90 67 116 117 151 177 223 135 84 140 123 83 120
2017 102 71 120 114 161 190 231 134 90 143 133 86 127
2018 124 72 119 138 172 194 230 142 92 145 137 89 138
Source: EMDS229 (Service Level)

2018 MBNCanada Performance Measurement Report 54
Emergency Medical Services (EMS)
Figure 7.2 Percent of Ambulance Time Lost to Hospital Turnaround
Time spent in hospital includes the time it takes to transfer a patient, delays in transfer care due to lack of hospital resources (off-load delay), paperwork and other activities. The more time paramedics spend in the hospital process equates to less time they are available to respond to calls.
2016 18% 20% 24% 17% 14% 9% 20% 29% 23% 21% 23% 16% 20%
2017 23% 20% 26% 14% 20% 10% 23% 27% 25% 21% 13% 15% 21%
2018 20% 19% 25% 14% 25% 11% 24% 28% 24% 21% 12% 16% 21%
Source: EMDS150 (Community Impact)

2018 MBNCanada Performance Measurement Report 55
Emergency Medical Services (EMS)
Figure 7.3 EMS Weighted Vehicle In-Service Hours per 1,000 Population
‘In-Service Hours’ refers to only the hours that vehicles are available for service.
2016 303 255 373 370 455 596 511 284 219 422 531 283 372
2017 325 265 373 375 507 596 536 299 232 455 530 303 374
2018 314 266 382 391 507 596 584 289 251 494 527 288 387
Source: EMDS226 (Service Level)

2018 MBNCanada Performance Measurement Report 56
Emergency Medical Services (EMS)
Figure 7.4 EMS Total Cost per Weighted Vehicle In-Service Hour
This measure represents total costs to provide Emergency Medical Services on an ‘In-Service Hour’ basis. ‘In-Service Hour’ refers to the hours that vehicles are available.
2016 $215 $223 $218 $180 $203 $220 $207 $252 $213 $219 $146 $235 $217
2017 $217 $219 $221 $213 $191 $226 $212 $248 $213 $209 $149 $228 $215
2018 $237 $230 $229 $234 $205 $239 $214 $267 $220 $207 $162 $256 $230
Source: EMDS306T (Efficiency)

2018 MBNCanada Performance Measurement Report 57
Emergency Medical Services (EMS)
Figure 7.5 Response Time Performance Standard - Sudden Cardiac Arrest Within 6 Minutes
The measure reflects the actual percentage of time any person equipped with a defibrillator arrives on scene to provide defibrillation to a sudden cardiac arrest patient within six minutes of the time notice is received from dispatch.
Annually, each service may determine and set the percentage of compliance for this measure, which is identified in the table as a target. Any person with a defibrillator stops the clock on this measure so the paramedic (service) is required to capture the time of arrival for any defibrillator by a non-paramedic party. These times are reflected as procedure code 385 with a soft time (best estimate) provided by the attending paramedic. The response time is calculated based on the crew notified (T2) time of the first vehicle being notified of the call and the arrived scene (T4) time of the first vehicle to reach the scene.
Target60.0% 55.0% 75.0% N/A 55.0% 70.0% 60.0% 75.0% 50.0% 55.0% 90.0% 60.0%
2016 67.3% 68.0% 79.0% 71.9% 55.0% 70.0% 67.0% 89.5% 39.9% 62.1% 74.6% 70.0%
2017 64.2% 66.0% 88.0% 74.4% 62.7% 73.0% 65.0% 85.5% 60.8% 59.0% 82.3% 66.0%
2018 64.4% 71.2% 88.0% 74.8% 59.0% 70.0% 70.9% 86.0% 61.8% 63.1% 82.1% 63.0%
Source: EMDS430 (Customer Service)
0%
15%
30%
45%
60%
75%
90%
DUR HAL HAM LON NIAG SUD TBAY TOR WAT WIND WINN YORK

2018 MBNCanada Performance Measurement Report 58
Emergency Medical Services (EMS)
Figure 7.6 Response Time Performance Standard - Canadian Triage & Acuity Scale 1
This measure reflects the actual percentage of time an ambulance crew has arrived on scene to provide ambulance services to sudden cardiac arrest patients or other patients categorized as CTAS 1, within eight minutes of the time notice is received respecting such services. The Canadian Triage & Acuity Scale is a standardized tool that enables emergency departments and Paramedic services to prioritize care requirements according to the type and severity of the presenting signs and symptoms. Patients are assigned a CTAS level between 1 – more severe, life threatening; and 5 – least severe.
Annually, each service may determine and set the percentage of compliance for this measure, which is identified in the table as a target. The response time is calculated based on the crew notified (T2) time of the first vehicle being notified of the call and the arrived scene (T4) time of the first vehicle to reach the scene.
Target 75.0% 75.0% 75.0% N/A 80.0% 80.0% 70.0% 75.0% 70.0% 75.0%. 90.0% 75.0%
2016 77.8% 75.0% 78.0% 79.1% 75.7% 78.0% 76.0% 79.4% 71.7% 77.7% 76.3% 80.0%
2017 84.2% 72.0% 79.0% 81.2% 77.8% 75.6% 73.0% 81.4% 73.8% 75.0% 71.3% 78.0%
2018 79.2% 72.8% 82.0% 80.2% 76.2% 79.0% 80.2% 82.3% 72.3% 80.2% 67.7% 76.0%
Source: EMDS431 (Customer Service)
0%
15%
30%
45%
60%
75%
90%
DUR HAL HAM LON NIAG SUD TBAY TOR WAT WIND WINN YORK

2018 MBNCanada Performance Measurement Report 59
Emergency Medical Services (EMS)
Figure 7.7 90th Percentile Call Processing Time (Dispatch) – EMS TO-2 Code 4 (AMPDS 1 and 2/DE, optional in C)
Source: EMDS480 (Customer Service)
MUNICIPALITY
Actual 90th Percentile Call Processing Time (Dispatch)
EMS TO-2, Code (AMPDS 1 and 2/DE, optional in C) (min:sec)
The Ministry of Health and Long-Term Care (MOHLTC) directly operates all land ambulance dispatch service in Ontario with the exception of Niagara and Toronto.
Dispatch time is the time from a phone call being received to the EMS unit being notified.
Code 4 refers to the highest priority calls.
90th percentile means that 90% of all calls of the service have a dispatch time within the period reflected in the graph.
2016 2017 2018
DUR 3:21 3:29 3:39
HAL 3:02 3:21 3:27
HAM 3:07 3:19 3:17
LON 3:11 3:28 3:23
NIAG 2:03 2:10 2:19
SUD 2:44 2:51 2:42
TBAY 2:32 2:57 3:13
TOR 2:53 3:04 2:46
WAT 3:09 3:06 3:00
WIND 3:19 3:15 3:10
WINN 2:45 2:59 3:00
YORK 3:05 3:40 3:53
MEDIAN 3:03 3:10 3:11

2018 MBNCanada Performance Measurement Report 60

2018 MBNCanada Performance Measurement Report 61

2018 MBNCanada Performance Measurement Report 62
Emergency Shelters
Figure 8.1 Average Length of Stay in Days per Admission to Emergency Shelters Results reflect various approaches to providing emergency shelter beds and how motel rooms are counted when they are used as part of the service delivery model. The length of stay increased across most municipalities due to high rental rates, low vacancies and increased demand for shelters.
DUR HAL HAM LON NIAG SUD TOR WAT WIND YORK MEDIAN
Adults and Children
2016 10.5 21.1 8.8 8.2 12.0 N/A 19.9 9.5 6.8 N/A 10.0 2017 12.7 16.7 8.5 8.9 16.2 16.3 27.6 9.4 6.5 N/A 12.7 2018 11.1 20.1 7.9 10.4 25.0 17.3 33.2 10.3 6.8 25.0 14.2
Source: HSTL105 (Community Impact)
Singles
2016 9.3 11.7 6.9 7.6 9.5 N/A 16.6 8.6 8.2 N/A 9.0 2017 10.4 10.6 6.6 8.0 11.2 15.4 21.0 8.7 8.5 N/A 10.4 2018 10.3 11.7 6.0 9.1 17.0 14.5 28.6 9.7 9.3 22.0 11.0
Source: HSTL110 (Community Impact) Families – Head of Households
2016 20.7 36.5 52.9 15.1 22.7 N/A 98.9 23.6 10.2 N/A 23.2 2017 24.9 39.5 50.1 16.9 44.6 22.5 115.4 18.3 9.3 N/A 24.9 2018 25.3 54.2 50.3 17.6 66.4 27.8 128.3 49.7 13.8 36.1 42.9
Source: HSTL115 (Community Impact)
Sudbury and York: Due to the implementation of the federal tracking system, HIFIS, Sudbury (2016) and York (2016 and 2017) results were removed.
Toronto: In 2017 and 2018, Toronto’s shelter system experienced a significant influx of refugee claimants.

2018 MBNCanada Performance Measurement Report 63
Emergency Shelters
Figure 8.2 Average Nightly Number of Emergency Shelter Beds Available per 100,000 Population
Where motel rooms are a permanent part of the shelter model, motel rooms are included in the total. However, where motel rooms are not a permanent part to the model but are used as needed, the total number of shelter beds does not include motel rooms.
2016 13.8 13.3 60.3 83.1 43.2 39.6 158.1 41.6 9.0 13.7 40.6
2017 13.6 11.9 60.5 81.8 44.7 39.6 180.4 41.2 8.9 13.5 40.4
2018 13.4 11.7 59.6 81.9 46.6 39.6 226.2 40.8 11.2 13.4 40.2
Source: HSTL205 (Service Level)
Toronto: The use of motels and hotels is a permanent and significant feature of Toronto's shelter system. As such, all beds in motel/hotel programs are always counted toward total capacity.

2018 MBNCanada Performance Measurement Report 64
Emergency Shelters
Figure 8.3 Direct Cost of Emergency Shelter Program per 100,000 Population
The types of direct operating costs incurred by municipalities vary based on the service delivery models they use to provide emergency shelters. Depending on the service delivery model, operating costs could include municipal shelter staff and building maintenance costs; and/or payments made to third party operators and hotels/motels.
2016 $310,357 $276,021 $1,375,253 $1,419,412 $511,054 $914,357 $4,200,510 $652,187 $346,166 $525,143 $588,665
2017 $369,055 $328,038 $1,425,448 $1,478,020 $543,567 $1,010,991 $4,741,916 $675,740 $385,248 $494,352 $609,654
2018 $368,797 $350,439 $1,507,136 $1,522,525 $637,996 $983,036 $6,136,637 $854,308 $562,659 $524,305 $746,152
Source: HSTL220 (Service Level) Formerly HSTL310
$0
$1
$2
$3
$4
$5
$6
$7
DUR HAL HAM LON NIAG SUD TOR WAT WIND YORK MEDIAN
(In Millions)

2018 MBNCanada Performance Measurement Report 65
Emergency Shelters
Figure 8.4 Average Nightly Bed Occupancy Rate of Emergency Shelters
Rooms can be occupied at less than 100% capacity depending on the family size. A result of greater than 100% is possible through the use of overflow spaces.
2016 66% 81% 96% 95% 98% N/A 95% 87% 94% N/A 95%
2017 101% 79% 96% 96% 108% 60% 94% 90% 123% N/A 96%
2018 76% 92% 99% 97% 100% 64% 95% 95% 128% 88% 95%
Source: HSTL410 (Customer Service)
Sudbury and York: Due to the implementation of the federal tracking system, HIFIS, Sudbury (2016) and York (2016 & 2017) results have been removed.
Windsor: The overage in bed nights is due to the increase demand from families who needed emergency shelter and were placed in motels.

2018 MBNCanada Performance Measurement Report 66

2018 MBNCanada Performance Measurement Report 67

2018 MBNCanada Performance Measurement Report 68
Facilities
Figure 9.1 Gross Square Footage of All Buildings Owned and Leased by Municipality
This graph includes 2017 and 2018 results only.
2017 14.8 4.7 1.1 4.4 2.7 3.4 30.4 2.4 3.0 3.3 2.5 28.3 6.7 3.6 9.5 6.4
2018 15.1 4.7 1.1 4.6 2.5 3.5 30.4 2.4 3.0 3.3 2.5 28.8 6.9 3.6 9.5 6.3
Source: FCLT805 (Statistic)
0
5
10
15
20
25
30
35
CAL DUR HAL HAM HFX LON MTL NIAG REG SUD TBAY TOR WAT WIND WINN YORK
(In Millions)

2018 MBNCanada Performance Measurement Report 69
Facilities
Figure 9.2 Gross Square Footage of Headquarter (HQ) Building
This graph includes 2018 results only.
CAL DUR HAL HAM HFX LON MTL NIAG REG SUD TBAY TOR WAT WIND WINN YORK
2018 802,591 361,441 297,812 167,995 29,760 188,200 245,562 200,110 179,566 157,308 43,500 636,215 259,593 120,000 206,572 452,254
Source: FCLT820 (Statistic)
2018 MBNCanada Performance Measurement Report 70
Facilities
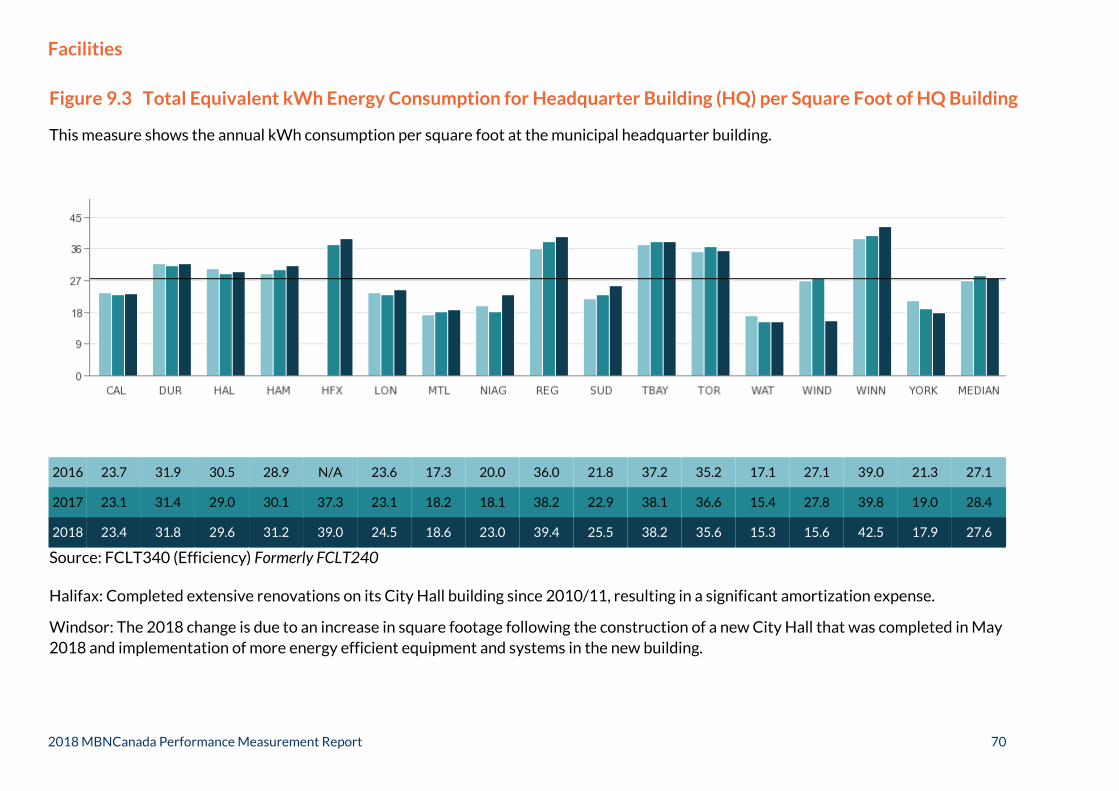
Figure 9.3 Total Equivalent kWh Energy Consumption for Headquarter Building (HQ) per Square Foot of HQ Building
This measure shows the annual kWh consumption per square foot at the municipal headquarter building.
2016 23.7 31.9 30.5 28.9 N/A 23.6 17.3 20.0 36.0 21.8 37.2 35.2 17.1 27.1 39.0 21.3 27.1
2017 23.1 31.4 29.0 30.1 37.3 23.1 18.2 18.1 38.2 22.9 38.1 36.6 15.4 27.8 39.8 19.0 28.4
2018 23.4 31.8 29.6 31.2 39.0 24.5 18.6 23.0 39.4 25.5 38.2 35.6 15.3 15.6 42.5 17.9 27.6
Source: FCLT340 (Efficiency) Formerly FCLT240
Halifax: Completed extensive renovations on its City Hall building since 2010/11, resulting in a significant amortization expense.
Windsor: The 2018 change is due to an increase in square footage following the construction of a new City Hall that was completed in May 2018 and implementation of more energy efficient equipment and systems in the new building.

2018 MBNCanada Performance Measurement Report 71
Facilities
Figure 9.4 Total Direct Cost of Facility Operations for Headquarter Building (HQ) per Square Foot of HQ Building
This measure represents the total cost to operate the municipal headquarter building which includes repairs and maintenance, custodial, utilities and security.
2016 N/A $16.92 $13.08 $24.25 N/A $9.27 $18.68 $13.82 $12.12 $12.85 $14.69 $20.04 $10.07 $5.79 $12.32 $18.60 $13.45
2017 N/A $16.46 $14.94 $23.04 $44.53 $8.26 $20.21 $14.91 $12.28 $13.20 $15.36 $23.45 $10.00 $6.33 $13.66 $17.41 $14.94
2018 $9.83 $17.06 $14.36 $24.75 $45.32 $8.99 $21.26 $14.84 $13.50 $12.25 $13.80 $24.19 $10.45 $7.54 $12.27 $18.30 $14.08
Source: FCLT335T (Efficiency)
Calgary: This is the first year Calgary is reporting on this measure.
Halifax: Completed extensive renovations on its City Hall building since 2010/11, resulting in a significant amortization expense.
Hamilton: Extensive renovation to City Hall in 2010 resulting in a significant amortization expense.

2018 MBNCanada Performance Measurement Report 72

2018 MBNCanada Performance Measurement Report 73

2018 MBNCanada Performance Measurement Report 74
Fire & Rescue Services
Figure 10.1 Number of Staffed Fire In-Service Vehicle Hours per Capita
This measure includes both urban and rural areas. Urban is defined as the area served by full-time firefighters stationed with their vehicles on a continuous basis; and rural is defined as the area served by volunteer firefighters who are on-call to respond to emergencies as they arise. Rural areas tend to have higher vehicle hours per capita because there is a proportionately smaller number of citizens in those response areas. Hamilton, Halifax and Sudbury have both an urban and rural component of service delivery; whereas all other municipalities have an urban component only.
2016 0.65 0.95 N/A 0.50 0.67 0.55 0.65 1.21 0.43 0.56 0.63 0.64
2017 0.65 0.93 3.15 0.50 0.65 0.52 0.65 1.21 0.41 0.56 0.61 0.65
2018 0.68 0.92 3.17 0.49 0.67 0.51 0.65 1.21 0.39 0.55 0.61 0.65
Source: FIRE230 (Service Level)
Halifax: Operates 51 stations across a geographic area of over 5,500 km. 22 of these stations are staffed by volunteers only and a further
20 are composite stations staffed by both volunteers and career firefighters. The large number of stations along with the municipality’s
large volunteer contingent contributes to a high staffed in-service vehicle hour (Halifax includes volunteer-manned stations in its in-
service vehicle count).

2018 MBNCanada Performance Measurement Report 75
Fire & Rescue Services
Figure 10.2 Residential Fire Related Civilian Fatalities per 100,000 Population
Total number of residential fire related civilian fatalities, as determined by each respective jurisdiction, per 100,000 population.
MUNICIPALITY 2016 2017 2018
CAL 0.08 0.16 0.24
HAM 1.98 0.89 1.05
HFX N/A 0.69 1.86
LON 0.26 0.26 0.00
MTL 0.35 0.64 0.35
REG 1.33 0.87 0.43
SUD 0.00 1.86 0.62
TBAY 0.00 0.00 3.67
TOR 0.50 0.49 0.37
WIND 1.38 0.45 0.89
WINN 1.09 0.40 0.80
MEDIAN 0.43 0.49 0.62 Source: FIRE110 (Community Impact)

2018 MBNCanada Performance Measurement Report 76
Fire & Rescue Services
Figure 10.3 Rate of Residential Structural Fires with Losses per 1,000 Households
Number of residential structure fires with losses as reported by the fire department. Results include urban and rural areas.
2016 0.7 0.6 N/A 0.9 0.9 0.6 1.3 1.0 0.8 1.4 1.2 0.9
2017 0.7 0.6 1.5 0.9 0.9 0.6 1.1 1.1 0.8 1.4 1.3 0.9
2018 0.6 0.7 1.5 1.0 0.8 0.6 1.4 1.2 0.8 1.5 1.5 1.0
Source: FIRE115 (Community Impact)

2018 MBNCanada Performance Measurement Report 77
Fire & Rescue Services
Figure 10.4 Actual 90th Percentile Fire Station Notification Response Time in Minutes/Seconds (Urban)
This measure reports the actual 90th percentile response time (from fire station notification to arrival) for municipalities with an urban component. Results are presented in minutes: seconds. Each municipality has a different mix of vehicle types and staffing models, reflecting its fire and community risks.
Figure 10.5 Actual 90th Percentile Fire Station Notification Response Time in Minutes/Seconds (Rural)
This measure reports the actual 90th percentile response time (from fire station notification to arrival) for municipalities with a rural component. Results are presented in minutes: seconds.
MUNICIPALITY 2016 2017 2018 MUNICIPALITY 2016 2017 2018
CAL 06:52 06:59 06:51 HAM 14:24 14:35 14:21
HAM 06:52 06:55 06:53 HFX N/A 16:35 17:00
HFX N/A 08:10 07:59 SUD 15:11 15:38 18:14
LON 06:08 06:23 06:26 MEDIAN 14:47 15:38 17:00
MTL 06:16 06:18 06:20 Source: FIRE406 (Customer Service)
REG 06:32 06:45 06:43
SUD 09:34 09:05 07:32
TBAY 06:40 06:40 06:48
TOR 06:28 06:33 06:43
WIND 06:36 07:01 06:56
WINN 06:57 07:07 07:16
MEDIAN 06:38 06:55 06:51
Source: FIRE405 (Customer Service)

2018 MBNCanada Performance Measurement Report 78
Fire & Rescue Services
Figure 10.6 Total Fire Cost per Staffed In-Service Vehicle Hour
This measure presents the total cost (including costs associated with administration, suppression, prevention, education, training, investigations) to provide fire services divided by the number of in-service emergency response vehicle hours. Costs may vary significantly between municipalities and may be influenced by different municipal priorities, such as investments in community risk mitigation efforts. Municipalities may also have different requirements for specialized vehicle apparatus and/or firefighting capabilities. When there is a mix of urban and rural areas served by volunteer firefighters, the cost tends to be much lower than urban areas served by full-time firefighters because volunteer firefighters are paid only for the hours in which they are actively responding to emergencies. Costs may also be influenced by work related injuries associated with WSIB.
For a full list of influencing factors, please refer to the Influencing Factors at the beginning of this Chapter.
2016 $345 $179 N/A $323 $292 $371 $247 $214 $415 $468 $275 $308
2017 $356 $182 $66 $357 $318 $362 $262 $245 $448 $425 $277 $318
2018 $317 $188 $70 $345 $296 $378 $273 $252 $470 $446 $287 $296
Source: FIRE305T (Efficiency)
Halifax: Of Halifax's 51 stations, 22 are staffed by volunteer firefighters, 21 are composite stations staffed by both career and volunteer firefighters and 8 stations are career firefighters only. Volunteers are paid an honorarium only which results in a lower cost per in-service vehicle hour (Halifax includes volunteer-manned stations in its in-service vehicle count).

2018 MBNCanada Performance Measurement Report 79

2018 MBNCanada Performance Measurement Report 80

2018 MBNCanada Performance Measurement Report 81
Fleet
Figure 11.1 Total Number of Light, Medium and Heavy Vehicles (Municipal Equipment)
Each Municipality’s fleet is comprised of a number of vehicles in each of these 3 classes:
Light Vehicles: Weigh less than 4,500 kg, e.g. cars, vans, or light pickups Medium Vehicles: Weigh between 4,500 kg and 9,000 kg, e.g. heavy-duty pickups and medium size work trucks Heavy Vehicles: Weigh greater than 9,000 kg, e.g. garbage trucks, tandem dump trucks, street sweepers, flushers, vacuum trucks, etc.
The variation between municipalities in heavy vehicle measures is largely due to whether a municipality delivers a garbage pickup service internally or through outsourcing. Garbage pickup is generally a low km traveled, high fuel volume, high equipment maintenance/repair cost service.
Source: FLET827, FLET828, FLET829 (Statistics) Formerly FLET227, FLET228, FLET229
Light 1,072 166 496 253 245 2,060 172 333 174 154 1,871 225 192 556 242
Medium 598 23 172 44 19 517 20 87 125 14 642 14 49 270 47
Heavy 674 10 203 63 136 660 33 114 81 75 732 35 31 148 39
0
500
1000
1500
2000
2500
3000
3500
CAL HAL HAM HFX LON MTL NIAG REG SUD TBAY TOR WAT WIND WINN YORK
2018 MBNCanada Performance Measurement Report 82
Fleet
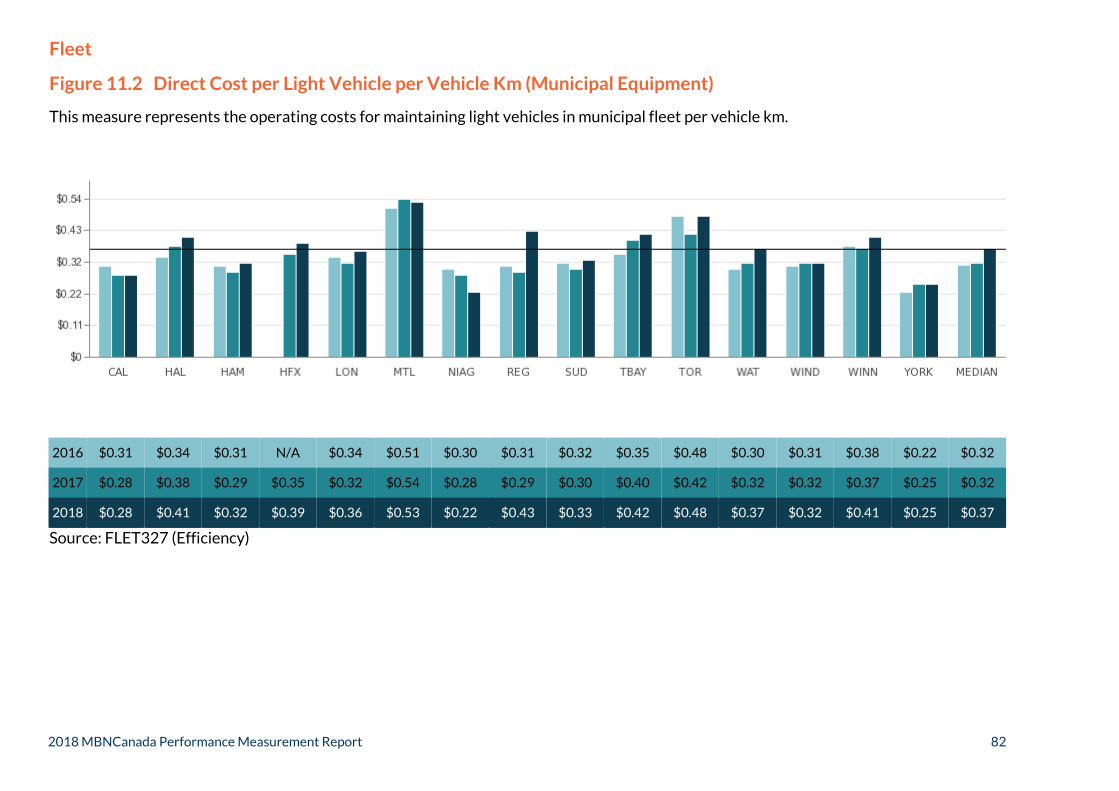
Figure 11.2 Direct Cost per Light Vehicle per Vehicle Km (Municipal Equipment)
This measure represents the operating costs for maintaining light vehicles in municipal fleet per vehicle km.
2016 $0.31 $0.34 $0.31 N/A $0.34 $0.51 $0.30 $0.31 $0.32 $0.35 $0.48 $0.30 $0.31 $0.38 $0.22 $0.32
2017 $0.28 $0.38 $0.29 $0.35 $0.32 $0.54 $0.28 $0.29 $0.30 $0.40 $0.42 $0.32 $0.32 $0.37 $0.25 $0.32
2018 $0.28 $0.41 $0.32 $0.39 $0.36 $0.53 $0.22 $0.43 $0.33 $0.42 $0.48 $0.37 $0.32 $0.41 $0.25 $0.37
Source: FLET327 (Efficiency)

2018 MBNCanada Performance Measurement Report 83
Fleet
Figure 11.3 Direct Cost per Medium Vehicle per Vehicle Km (Municipal Equipment)
This measure represents the operating costs for maintaining medium vehicles in municipal fleet per vehicle km.
2016 $0.55 $0.46 $0.80 N/A $0.58 $1.21 $0.49 $0.52 $0.76 $0.70 $0.96 $0.62 $0.64 $0.70 $0.34 $0.63
2017 $0.54 $0.58 $0.81 $0.49 $0.59 $1.25 $0.47 $0.54 $0.75 $0.78 $0.92 $0.58 $0.61 $0.70 $0.45 $0.59
2018 $0.51 $0.61 $0.86 $0.63 $0.64 $1.25 $0.45 $0.53 $0.87 $1.10 $0.85 $0.65 $0.61 $0.80 $0.50 $0.64
Source: FLET328 (Efficiency)
$0.00
$0.20
$0.40
$0.60
$0.80
$1.00
$1.20
$1.40
CAL HAL HAM HFX LON MTL NIAG REG SUD TBAY TOR WAT WIND WINN YORK MEDIAN

2018 MBNCanada Performance Measurement Report 84
Fleet
Figure 11.4 Direct Cost per Heavy Vehicle per Vehicle Km (Municipal Equipment)
This measure represents the operating costs for maintaining heavy vehicles in municipal fleet per vehicle km. The increases for Ontario municipalities between 2016 and 2017 can be attributed to a regulation change by Ontario’s Ministry of Transportation that redefined the types of vehicles and equipment that can be classified as a road building machine. This change means the 2017 and 2018 results for all municipalities is more comparable given out-of-province members have always included these types of units.
2016 $2.05 $2.06 $2.26 N/A $1.53 $2.21 $1.05 $1.39 $3.05 $2.02 $2.55 $1.93 $1.82 $1.10 $2.43 $2.04
2017 $1.54 $2.11 $2.38 $2.86 $1.75 $2.08 $1.03 $1.31 $3.38 $2.25 $2.57 $2.10 $1.84 $1.22 $2.54 $2.10
2018 $1.51 $2.18 $2.62 $2.82 $2.05 $2.01 $1.04 $1.85 $3.01 $2.49 $1.45 $2.39 $1.88 $1.42 $2.64 $2.05
Source: FLET329 (Efficiency)
Toronto: In 2018, Toronto increased its compressed natural gas (CNG) collection trucks by 63% (from 70 to 114), resulting in a significant decrease in the results. The cost of CNG vehicles is typically lower than diesel.

2018 MBNCanada Performance Measurement Report 85
Fleet
Figure 11.5 Canadian Association of Municipal Fleet Managers (CAMFM) Door Rate
The door rate refers to the in-house shop rate for vehicle maintenance and repairs.
2016 $110.45 $103.25 $102.00 N/A $92.45 $97.00 $92.00 $88.48 $86.91 $91.26 $99.67 $99.36 $99.18 $88.00 $107.00 $98.09
2017 $102.24 $105.04 $102.00 $71.52 $94.17 $97.00 $98.57 $88.48 $91.50 $101.44 $105.34 $99.92 $113.87 $98.00 $104.57 $99.92
2018 $110.99 $103.76 $102.00 $76.16 $101.24 $97.00 $98.57 $93.34 $92.15 $121.30 $115.33 $102.59 $125.13 $98.00 $114.89 $102.00
Source: FLET347 (Efficiency)

2018 MBNCanada Performance Measurement Report 86
Fleet
Figure 11.6 Percent of Unplanned Maintenance Work Order Hours
The measure represents the time a vehicle is being worked on in the shop for work related to any repairs, other than those associated with preventative maintenance work orders as a percentage of total work order hours. The variation between municipalities can be attributed to differences in maintenance system processes and ability to segregate repair activities/costs that were completed while the unit was in for a planned preventative maintenance cycle or separately as a stand-alone repair work order.
2016 40% 73% 72% N/A 40% 58% 57% 42% 52% 63% 65% 78% 69% 85% 64% 64%
2017 38% 72% 74% 84% 42% 56% 48% 38% 50% 56% 45% N/A 60% 84% 70% 56%
2018 33% 71% 74% 84% 46% 58% 52% 41% 47% 48% 39% 81% 60% 83% 80% 58%
Source: FLET415 (Service Level)

2018 MBNCanada Performance Measurement Report 87

2018 MBNCanada Performance Measurement Report 88

2018 MBNCanada Performance Measurement Report 89
General Government
Figure 12.1 Operating Cost for Governance & Corporate Management as a Percent of Total Municipal Operating Cost
This measure includes operating costs relating to Governance, i.e. Mayor, Council, Council support and election management; and costs related to Corporate Management, i.e. CAO/City Manager, finance, communication, legal, real estate, etc.
Current discrepancies exist among municipalities with regards to the classification of External Transfers and Amortization as either Corporate Management or Program Support costs. These differences in classification currently impact the comparability of this cost measure consistently across municipalities. Through the work being conducted with the Measure Identification Review and further clarification being sought from the Ministry of Municipal Affairs and Housing, resolution on the proper classification of these costs is being determined for implementation in 2020.
2016 4.5% 2.8% N/A 4.4% 6.0% 5.6% 4.8% 5.0% 2.6% 3.7% 4.1% 4.5% 1.5% 2.1% 1.4% 1.2% 1.8% 1.5%
2017 5.0% 2.1% 5.3% 4.3% 6.2% 4.5% 4.2% 4.2% 2.8% 4.1% 4.0% 4.2% 1.6% 2.3% 1.4% 1.3% 1.6% 1.6%
2018 5.0% 3.4% 4.8% 4.1% 5.2% 3.6% 4.8% 4.8% 3.0% 4.3% 4.1% 4.3% 1.6% 2.9% 1.4% 1.5% 1.4% 1.5%
Source: GENG301 (Efficiency) Formerly GENG901
Montreal: The decrease in 2018 is due to the change in public transit governance in the metropolitan area.
0%
2%
4%
6%
8%
DUR HAL NIAG WAT YORK MEDIAN
Upper-Tier

2018 MBNCanada Performance Measurement Report 90
General Government
Figure 12.2 Total Cost for Governance & Corporate Management as a Percent of the Total Municipal Operating Cost
This measure includes operating costs plus amortization relating to governance, i.e. Mayor, Council, Council support and election management; and costs related to Corporate Management, i.e. CAO/City Manager, finance, communication, legal, real estate, etc.
Current discrepancies exist among municipalities with regards to the classification of External Transfers and Amortization as either Corporate Management or Program Support costs. These differences in classification currently impact the comparability of this measures consistently across municipalities. Through the work being conducted with the Measure Identification Review and further clarification being sought from the Ministry of Municipal Affairs and Housing, resolution on the proper classification of these costs is being determined for implementation in 2020.
2016 3.8% 2.8% N/A 3.7% 5.1% 4.9% 4.4% 4.4% 2.4% 3.7% 3.5% 3.8% 1.4% 1.8% 2.0% 1.1% 1.6% 1.6%
2017 4.2% 2.0% 4.6% 3.7% 5.3% 3.9% 3.9% 3.8% 2.5% 3.7% 3.5% 3.8% 1.5% 2.0% 2.0% 1.2% 1.4% 1.5%
2018 4.3% 3.3% 4.2% 3.4% 4.6% 3.1% 4.4% 4.2% 2.7% 3.9% 3.5% 3.9% 1.5% 2.5% 2.0% 1.9% 1.2% 1.9%
Source: GENG301T (Efficiency) Formerly GENG901T
Montreal: The decrease in 2018 is due to the change in public transit governance in the metropolitan area.
0%
2%
4%
6%
DUR HAL NIAG WAT YORK MEDIAN
Upper-Tier

2018 MBNCanada Performance Measurement Report 91

2018 MBNCanada Performance Measurement Report 92

2018 MBNCanada Performance Measurement Report 93
General Revenue
Figure 13.1 Total Percent of General Revenues Billed
The measure includes centralized, decentralized and outsourced billings. The results are impacted by revenue sources (user fees, grants), accounting practices and management policies regarding the billing process. In 2018, the calculation definition changed and data was re-stated for 2016 and 2017 to ensure comparability.
Calgary: Revenues billed declined in 2017 as a result of reduced billings from Calgary Approvals Coordination for acreage assessments.
Niagara and York: Social Housing is included in the annual consolidated financial statements.
2016 49% 29% N/A 27% 47% 65% 47% 8% 42% 35% 42% 43% 64% 58% 45% 75% 58%
2017 30% 19% 31% 28% 46% 38% 49% 6% 48% 31% 31% 36% 68% 60% 63% 62% 62%
2018 34% 25% 35% 27% 53% 28% 50% 6% 51% 36% 35% 45% 63% 60% 80% 69% 63%
Source: GREV210 (Service Level)
0%
20%
40%
60%
80%
DUR HAL NIAG WAT YORK MEDIAN
Upper-Tier
0%
20%
40%
60%
80%
CAL HAM HFX LON MTL REG SUD TBAY TOR WIND MEDIAN
Single-Tier

2018 MBNCanada Performance Measurement Report 94
General Revenue
Figure 13.2 Bad Debt Write-off as a Percent of Billed Revenue
This measure represents the percentage of receivables that were written off during the year.
2016 0.0% 0.1% N/A 0.1% 0.3% 0.2% 2.2% 0.1% 0.0% 1.1% 0.1% 0.3% 0.3% 0.3% 0.2% 0.0% 0.3% 2017 0.0% 0.1% 0.2% 0.2% 0.4% 0.0% 0.7% 0.1% 0.1% 0.0% 0.1% 0.1% 0.3% 0.3% 0.1% 0.0% 0.1% 2018 0.1% 0.0% 0.2% 0.0% 0.3% 0.0% 0.2% 0.1% 0.1% 0.1% 0.1% 0.0% 1.4% 0.6% 0.2% 0.0% 0.2% Source: GREV325 (Efficiency)
Sudbury: The City wrote-off large uncollectable receivables in 2016 which caused an uncharacteristically high result.
Halton: Unanticipated settlement in Public Works and defaulted payment plans in Children's Services resulted in higher dollar write-off values in 2018.
Windsor: Under normal circumstances, write-offs should be minimal. Total value of write-off amounts for 2017 is $483,000 lower than 2016,
materially due to the cleansing/housekeeping of large and very old collectable receivables from the books in 2016.
0.0%
0.5%
1.0%
1.5%
2.0%
2.5%
CAL HAM HFX LON MTL REG SUD TBAY TOR WIND MEDIAN
Single-Tier
0.0%
0.5%
1.0%
1.5%
2.0%
2.5%
DUR HAL NIAG WAT YORK MEDIAN
Upper-Tier

2018 MBNCanada Performance Measurement Report 95
General Revenue
Figure 13.3 Operating Cost of Accounts Receivable Function per Invoice
This measure reports the operating costs including centralized, decentralized and outsourced costs relating to accounts receivable.
2016 $7.27 $9.76 N/A $20.90 $43.75 $44.30 $31.20 $11.22 $54.14 $28.55 $28.55 $22.44 $24.73 $5.88 $10.75 $43.10 $22.44
2017 $8.21 $10.31 $24.71 $20.91 $45.69 $63.65 $32.60 $10.08 $53.57 $26.59 $25.65 $22.84 $24.85 $6.33 $16.62 $39.49 $22.84
2018 $6.56 $6.26 $28.87 $22.91 $38.70 $68.77 $33.43 $11.33 $45.17 $25.96 $27.42 $23.08 $26.23 $6.35 $16.88 $51.57 $23.08
Source: GREV310 (Efficiency)
$0
$20
$40
$60
$80
DUR HAL NIAG WAT YORK MEDIAN
Upper-Tier
$0
$20
$40
$60
$80
CAL HAM HFX LON MTL REG SUD TBAY TOR WIND MEDIAN
Single-Tier

2018 MBNCanada Performance Measurement Report 96
General Revenue
Figure 13.4 Average Collection Period (Days)
This measure identifies the average number of days it takes to collect receivables.
2016 35 40 N/A 49 34 49 36 48 33 68 40 51 48 96 29 65 51
2017 41 42 13 49 50 79 31 53 32 49 46 80 36 65 30 53 53
2018 33 43 6 49 54 81 34 45 38 51 44 45 35 56 40 58 45
Source: GREV335 (Efficiency)
Calgary: The economic downturn placed added financial pressure on customers with limited operating capital, resulting in longer collection period in 2017. Halifax: The 2018 result is impacted by a 6.5 million dollar receivable outstanding from April-August, which inflated the average outstanding receivable. Niagara: The Region had sizeable account receivable items impacting the 2016 result. Windsor: In 2017, average outstanding receivables were approximately $2,000,000 lower than in 2016. The change is associated with senior levels of government invoicing, and a very large public-sector account that was not paid in 2016 and then paid in early 2017.
0
20
40
60
80
100
CAL HAM HFX LON MTL REG SUD TBAY TOR WIND MEDIAN
Single-Tier
0
20
40
60
80
100
DUR HAL NIAG WAT YORK MEDIAN
Upper-Tier

2018 MBNCanada Performance Measurement Report 97
2018 MBNCanada Performance Measurement Report 98

2018 MBNCanada Performance Measurement Report 99
Human Resources
Figure 14.1 Total Cost for Human Resources Administration per T4 Supported
This measure is the total cost of Human Resources administration only. The measure does not reflect the total cost of the various programs and supports that Human Resources provides for the municipality.
2016 $1,597 $1,163 $1,196 $979 N/A $797 $2,089 $965 $1,453 $758 $597 $1,560 $982 $903 $1,161 $1,352 $1,161
2017 $1,291 $1,227 $1,252 $940 $1,069 $834 $1,568 $927 $1,706 $782 $655 $1,384 $986 $1,018 $1,114 $1,603 $1,092
2018 $1,311 $1,295 $1,286 $831 $1,043 $887 $1,951 $1,203 $2,024 $860 $701 $1,387 $997 $972 $1,156 $1,930 $1,180
Source: HMRS215T (Service Level) Formerly HMRS305T
Montreal: Increase is due to a higher number of T4's issued because 2017 was a municipal election year.

2018 MBNCanada Performance Measurement Report 100
59%
63%
56%
54%
49%
54%
35%
37%
37%
45%
48%
44%
58%
55%
56%
60%
49%
82%
76%
77%
52%
47%
47%
47%
47%
45%
46%
41%
47%
37%
34%
42%
82%
79%
78%
50%
49%
51%
77%
76%
75%
71%
44%
36%
46%
53%
49%
52%
49%
49%
41% 37
%44
%
46% 51
%46
%
65% 63
%63
%
55% 52
% 56%
42% 45
%
44% 40
%51
%
18% 24
% 23%
48% 53
%53
%
53%
53% 55
%
54%
59%
53%
63%
66%
58%
18%
21% 22
%
50%
51% 49
% 23%
24% 25
%
29% 56%
64%
54%
47%
51%
48%
51%
51%
0%
1%
2%
3%
4%
5%
6%
7%
8%
9%
CAL DUR HAL HAM HFX LON MTL NIAG REG SUD TBAY TOR WAT WIND WINN YORK MEDIAN
% o
f Vo
lunt
ary
Empl
oyee
Tur
nove
r
Proportion of permanent voluntary employee turnover due to resignations and retirments in 2016, 2017 and 2018
Resignations Retirements
CAL DUR HAL HAM HFX LON MTL NIAG REG SUD TBAY TOR WAT WIND WINN YORK MEDIAN
2016 3.38% 4.16% 4.91% 6.62% N/A 5.15% 4.96% 4.37% 7.26% 8.32% 8.06% 4.85% 5.75% 6.34% 5.57% 4.38% 5.15%2017 4.10% 5.41% 5.91% 7.61% 5.04% 5.83% 5.71% 5.50% 6.48% 6.22% 7.28% 4.90% 5.64% 4.94% 7.03% 4.08% 5.68%2018 4.31% 5.31% 5.32% 8.55% 5.70% 5.98% 6.10% 5.50% 7.07% 7.86% 8.57% 5.51% 6.18% 5.84% 7.20% 3.54% 5.91%
2016 168 83 73 236 N/A 55 179 72 69 91 118 187 85 31 125 79 852017 188 123 86 256 70 58 274 92 61 75 107 223 87 24 354 66 902018 234 111 93 312 88 77 288 91 69 86 107 269 91 30 415 64 92
2016 245 96 40 190 N/A 70 821 77 61 78 70 853 84 101 309 67 842017 321 117 51 236 98 86 889 81 55 52 56 838 82 78 276 74 842018 301 130 54 246 106 74 959 80 56 75 77 931 96 92 236 61 94
Permanent Voluntary Employee Turnover Rate
Retirements
Resignations
Source: HMRS406 (Community Impact)
Source: HMRS800 (Statistic)
Source: HMRS801 (Statistic)
Human Resources Figure 14.2 Permanent Voluntary Employee Turnover Rate This measure reflects voluntary separations of permanent staff (full-time and part-time), including resignations (voluntary exits) and retirements of any sort and includes the proportion of resignations and retirements.

2018 MBNCanada Performance Measurement Report 101

2018 MBNCanada Performance Measurement Report 102

2018 MBNCanada Performance Measurement Report 103
Information Technology
Figure 15.1 Number of Visitor Sessions to Municipal Website per Capita
This measure reflects the number of visitor sessions to the main municipal website. A visitor session is a group of interactions that take place on the website within a given time frame, by an individual visitor.
2016 15.7 9.5 N/A 8.6 13.7 8.8 21.3 15.3 11.0 5.0 17.7 12.4 4.4 6.0 3.8 3.5 3.4 3.8
2017 17.0 10.1 8.9 8.0 13.1 9.1 20.4 14.5 10.8 5.0 18.5 10.8 2.6 5.5 4.0 3.4 3.7 3.7
2018 16.7 11.0 9.6 8.8 12.5 9.0 18.7 12.0 9.1 5.6 12.2 11.0 2.8 5.3 4.0 3.0 3.2 3.2
Source: INTN105 (Community Impact)
Durham: In 2016, the Region did extensive outreach to citizens through a series of surveys and focus groups as part of a website redevelopment project.
Winnipeg: Revised tracking tools resulted in non-human visitors (bots, etc) being filtered out. 2018 results are more reflective of actual traffic.
0
5
10
15
20
25
DUR HAL NIAG WAT YORK MEDIAN
Upper-Tier

2018 MBNCanada Performance Measurement Report 104
Information Technology
Figure 15.2 Number of Information Technology Devices per Total Supported Municipal Full Time Equivalent (FTE)
This measure represents how many IT devices are used to support municipal service delivery. It includes desktops, laptops, smartphones, thin clients, and tablets.
2016 1.27 0.70 1.41 0.88 N/A 0.67 0.98 0.81 0.93 1.09 0.56 1.14 1.20 0.70 0.99 1.94 0.98
2017 1.38 0.77 1.51 0.94 0.97 0.66 1.07 0.97 0.99 1.13 0.53 1.22 1.23 0.75 0.90 1.77 0.98
2018 1.27 0.72 1.62 0.99 1.00 0.71 1.15 0.98 0.95 1.21 0.53 1.26 1.33 0.79 0.88 1.75 1.00
Source: INTN205 (Service Level)

2018 MBNCanada Performance Measurement Report 105
Information Technology
Figure 15.3 Total Cost for Information Technology per Total Supported Municipal Full Time Equivalent (FTE)
This measure includes the operating cost, plus amortization for information technology.
2016 $8,090 $3,003 $6,487 $2,371 N/A $3,460 $6,551 $2,207 $4,447 $3,142 $1,974 $4,631 $2,937 $3,066 $4,737 $8,411 $3,460
2017 $8,607 $3,093 $6,721 $2,369 $7,337 $3,714 $6,662 $3,058 $4,291 $3,332 $1,944 $4,737 $3,003 $3,493 $4,629 $8,049 $4,003
2018 $7,701 $2,215 $6,984 $2,511 $7,858 $3,819 $6,517 $2,786 $5,185 $3,404 $1,928 $5,411 $2,867 $3,792 $4,801 $7,217 $4,310
Source: INTN243T (Service Level)

2018 MBNCanada Performance Measurement Report 106

2018 MBNCanada Performance Measurement Report 107

2018 MBNCanada Performance Measurement Report 108
Investment Management
Figure 16.1 Gross Percent Realized Return on the Total Investment Portfolio
This measure is based on the Average Adjusted Book Value and refers to the General Investment Fund only. Sinking funds, pension funds, and trust funds are excluded.
2016 2.24% 1.93% 3.57% 2.58% N/A 1.80% 1.36% 2.63% 3.87% 1.92% 2.42% 2.57% 2.28% 1.39% 0.91% 3.39% 2.28%
2017 3.07% 1.84% 3.15% 2.57% 1.28% 1.54% 1.47% 2.64% 1.75% 1.96% 2.60% 2.56% 2.45% 1.58% 1.03% 2.64% 2.21%
2018 1.67% 2.07% 3.02% 2.69% 2.07% 2.07% 2.03% 3.02% 0.65% 2.41% 2.28% 2.70% 2.82% 2.02% 1.73% 2.43% 2.18%
Source: INVT310 (Efficiency)
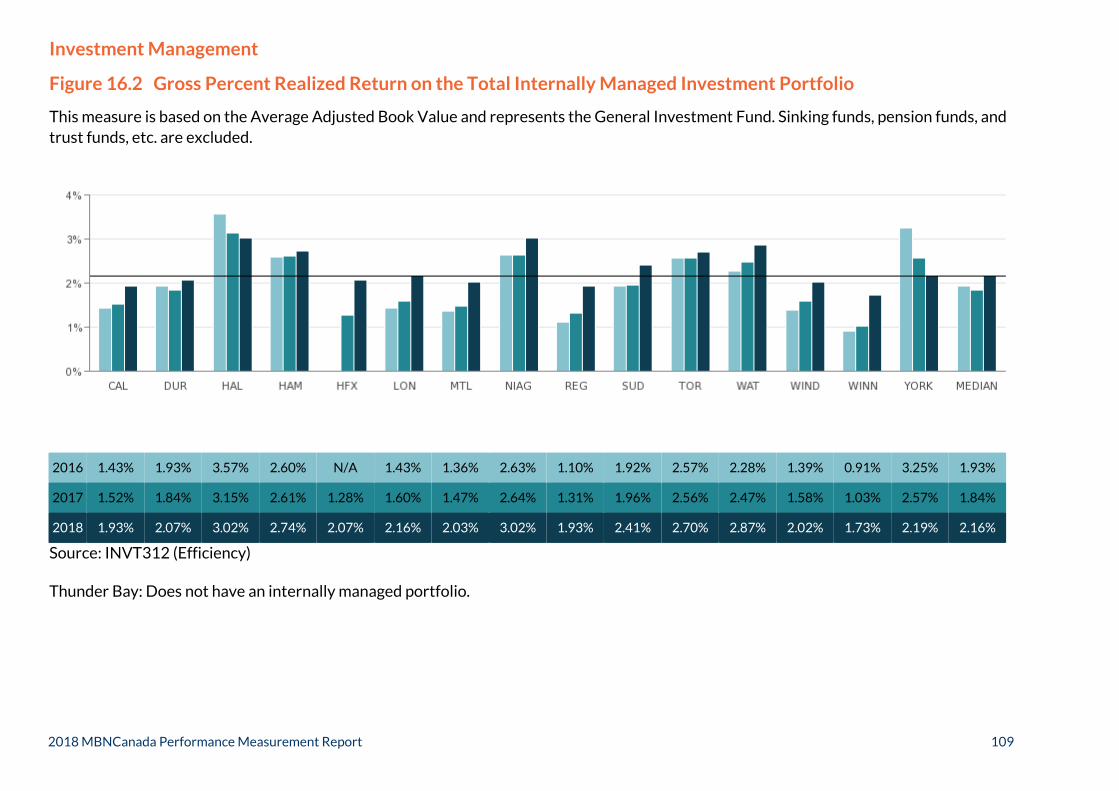
2018 MBNCanada Performance Measurement Report 109
Investment Management
Figure 16.2 Gross Percent Realized Return on the Total Internally Managed Investment Portfolio
This measure is based on the Average Adjusted Book Value and represents the General Investment Fund. Sinking funds, pension funds, and trust funds, etc. are excluded.
2016 1.43% 1.93% 3.57% 2.60% N/A 1.43% 1.36% 2.63% 1.10% 1.92% 2.57% 2.28% 1.39% 0.91% 3.25% 1.93%
2017 1.52% 1.84% 3.15% 2.61% 1.28% 1.60% 1.47% 2.64% 1.31% 1.96% 2.56% 2.47% 1.58% 1.03% 2.57% 1.84%
2018 1.93% 2.07% 3.02% 2.74% 2.07% 2.16% 2.03% 3.02% 1.93% 2.41% 2.70% 2.87% 2.02% 1.73% 2.19% 2.16%
Source: INVT312 (Efficiency)
Thunder Bay: Does not have an internally managed portfolio.

2018 MBNCanada Performance Measurement Report 110
Investment Management
Figure 16.3 Gross Percent Realized Return on the Total Externally Managed Investment Portfolio
This measure is based on the Average Adjusted Book Value and includes the General Investment Fund only (cash, fixed income and equity investments); and excludes all other investment portfolios.
2016 3.02% 0.88% 2.35% 4.11% 2.42% 2.27% 6.65% 2.42%
2017 4.04% 1.15% 1.47% 1.83% 2.60% 2.17% 4.74% 2.17%
2018 1.54% 1.03% 1.90% 0.00% 2.28% 2.10% 9.58% 1.90%
Source: INVT314 (Efficiency)
Durham, Halifax, Halton, Montreal, Niagara, Sudbury, Toronto, Windsor and Winnipeg: Do not have externally managed portfolios.
Regina: In 2018, no portion of the City’s portfolio was externally managed.

2018 MBNCanada Performance Measurement Report 111

2018 MBNCanada Performance Measurement Report 112

2018 MBNCanada Performance Measurement Report 113
Legal
Figure 17.1 In-House Legal Operating Cost per $1,000 Municipal Operating and Capital Expenditures
This measure represents the operating cost to provide in-house legal services. Council direction on budgets, tax rates, collective bargaining, etc., will impact the total municipal spend, which in turn will impact the reported total municipal operating and capital expenditures. This can cause fluctuations in year-over-year results, even if total in-house costs remain stable.
2016 $3.47 $2.16 $2.33 $2.35 N/A $1.93 $3.27 $1.03 $4.14 $2.22 $6.03 $1.15 $2.81 $1.92 $2.63 $2.34
2017 $3.42 $2.20 $2.35 $2.46 $4.79 $2.50 $2.98 $1.06 $3.72 $2.12 $5.94 $1.35 $2.79 $1.98 $2.65 $2.50
2018 $3.75 $2.19 $2.53 $2.13 $5.13 $2.70 $2.80 $1.33 $3.88 $2.23 $4.72 $1.49 $2.54 $1.89 $3.00 $2.54
Source: LEGL252 (Efficiency)

2018 MBNCanada Performance Measurement Report 114
Legal
Figure 17.2 In-House Legal Operating Cost per In-House Lawyer Hour
This measure represents the operating cost to provide in-house legal services. The in-house lawyer hours include standard work week and overtime hours only. Vacation and sick time are not included in the total number of in-house lawyer hours.
2016 $150 $183 $196 $145 N/A $159 $138 $173 $156 $161 $198 $120 $138 $106 $131 $153
2017 $145 $189 $204 $146 $140 $194 $138 $185 $155 $154 $203 $123 $145 $107 $144 $146
2018 $189 $197 $207 $144 $131 $194 $125 $178 $154 $159 $179 $125 $149 $112 $151 $154
Source: LEGL315 (Efficiency)

2018 MBNCanada Performance Measurement Report 115
Legal
Figure 17.3 External Legal Cost per Total Municipal Legal Cost
The external costs include the total payment to external law firms for the purposes of providing legal services only. The calculation does not include payment for other services such as investigations, arbitrations, collective bargaining, etc.
Calgary: The reduction in 2017 was due to the completion of two major projects where significant legal counsel was required.
Toronto and York: Do not report.
Winnipeg: Does not report - unable to track data.
0%
10%
20%
30%
40%
50%
60%
CAL DUR HAL HAM HFX LON MTL NIAG REG SUD WAT WIND MEDIAN
2016 20% 37% 54% 11% N/A N/A 21% 38% 6% 48% 9% 59% 29%
2017 13% 23% 50% 14% 12% 8% 24% 37% 10% 46% 5% 47% 19%
2018 18% 12% 59% 20% 11% 3% 24% 38% 10% 52% 6% 47% 19%
Source: LEGL330 (Efficiency)

2018 MBNCanada Performance Measurement Report 116

2018 MBNCanada Performance Measurement Report 117

2018 MBNCanada Performance Measurement Report 118
0
5
10
15
20
25
30
35
40
45
CAL HAM HFX LON MTL SUD TBAY TOR WAT WIND WINN MEDIANElectronic Uses Non-Electronic Uses
Libraries
Figure 18.1 Number of Electronic and Non-Electronic Library Uses per Capita
This graph shows the sum of electronic uses (computer workstation uses, wireless connections, electronic database uses, electronic circulation, electronic reference transactions, electronic visits, etc.) and non-electronic uses (circulation, program attendance, in-library material use, standard reference transactions, library visits, etc.).
CAL HAM HFX LON MTL SUD TBAY TOR WAT WIND WINN MEDIAN
2016 14.0 14.9 N/A 16.0 8.5 11.5 17.2 17.8 4.6 10.4 22.4 14.5
2017 14.4 13.8 24.0 15.1 9.9 10.7 18.6 16.0 4.7 10.2 18.1 14.4
2018 14.7 14.6 24.3 16.6 10.8 7.7 20.7 16.2 5.0 9.8 17.9 14.7
2016 19.5 18.5 N/A 17.1 17.0 14.1 13.7 19.0 10.3 9.8 11.8 15.6
2017 17.7 17.7 18.6 17.5 17.3 11.6 13.5 17.2 8.4 9.1 11.0 17.2
2018 17.2 17.3 18.7 17.8 17.1 11.4 14.4 16.4 8.1 8.3 10.4 16.4
Electronic Uses Per Capita Source PLIB106 (Community Impact)
Non-Electronic Uses Per Capita Source: PLIB107 (Community Impact)

2018 MBNCanada Performance Measurement Report 119
Libraries
Figure 18.2 Number of Library Holdings per Capita
Library holdings include print form (reference collections, circulating/borrowing collections and periodicals); and electronic media (CDs/DVDs, MP3 materials, audio books and eBooks).
2016 1.5 1.9 N/A 2.5 4.6 2.6 4.3 3.8 3.1 1.8 1.7 2.6
2017 1.4 2.2 2.0 2.1 4.6 2.2 3.9 3.7 3.3 1.7 1.7 2.2
2018 1.3 2.2 1.9 2.0 4.6 3.1 4.2 3.6 3.7 1.6 1.5 2.2
Source: PLIB205 (Service Level)

2018 MBNCanada Performance Measurement Report 120
Libraries
Figure 18.3 Total Cost for Libraries per Use
This measure reflects all costs to provide a wide range of library services including access, collections, technology, programs and staff expertise.
2016 $1.43 $1.78 N/A $1.95 $3.20 $2.23 $2.03 $1.98 $3.19 $2.10 $1.27 $2.01
2017 $1.51 $1.90 $1.75 $1.85 $2.86 $2.52 $2.01 $2.14 $3.57 $2.32 $1.48 $2.01
2018 $1.55 $1.88 $1.78 $1.75 $2.92 $3.09 $1.87 $2.22 $3.62 $2.48 $1.54 $1.88
Source: PLIB305T (Efficiency)

2018 MBNCanada Performance Measurement Report 121
Libraries
Figure 18.4 Average Number of Times in Year Circulating Items are Borrowed (Turnover)
Circulating items include print material and electronic media.
2016 8.8 6.0 N/A 4.0 2.5 2.9 1.6 5.3 1.9 2.9 4.4 3.5
2017 8.1 5.3 5.6 3.6 2.7 2.5 1.7 4.9 1.7 2.9 3.9 3.6
2018 8.7 4.9 5.8 4.2 2.7 1.9 1.6 5.0 1.5 3.1 4.2 4.2
Source: PLIB405 (Customer Service)

2018 MBNCanada Performance Measurement Report 122

2018 MBNCanada Performance Measurement Report 123

2018 MBNCanada Performance Measurement Report 124
Licensing
Figure 19.1 Number of Taxi Driver Licenses Issued per 100,000 Population
A taxi driver license is issued to an individual and permits them to operate a taxicab, limousine, executive car, etc. Increases occurred in 2017 for some municipalities as a result of an increase in licensing of rideshare/personal transportation providers. At the current time, ride-sharing services are administered depending on the municipality. For consistency, they are are now excluded from this measure.
Source: LICN210 (Service Level)
Calgary: Decrease due to drivers leaving the taxi industry or moving to Transportation Network Companies (TNC's).
2016 426 200 N/A 288 484 381 182 73 499 423 229 106 288
2017 433 260 328 311 442 333 179 69 498 951 231 103 319
2018 383 257 346 275 437 290 187 105 412 197 232 245 266

2018 MBNCanada Performance Measurement Report 125
Licensing
Figure 19.2 Number of Taxi Plate-Holder Licenses Issued per 100,000 Population
A taxi plate-holder license authorizes an individual(s) to own license plate(s) to operate one or more vehicles as a taxicab, limousine, executive car, etc.
2016 134 80 N/A 119 232 80 83 93 190 386 99 N/A 109
2017 151 80 282 119 229 83 82 98 184 886 97 N/A 119
2018 148 84 281 118 240 82 82 131 198 896 100 80 125
Source: LICN212 (Service Level)
Waterloo: Increase due to UBER and other auxiliary taxi services increasing vehicle numbers through 2017.
Winnipeg: The City of Winnipeg assumed management of the taxi industry in 2018. This first year of data will form a baseline for future analysis.

2018 MBNCanada Performance Measurement Report 126
Licensing
Figure 19.3 Total Cost for Taxi (Driver and Plate-Holder) Licensing per 100,000 Population
This measure reports the total cost to administer the licensing of taxi drivers and plate holders on a population basis. A taxi driver license is issued to an individual and permits them to operate a taxicab, limousine, executive car, etc. A taxi plate-holder license authorizes an individual(s) to own vehicle license plate(s) to operate one or more vehicles as a taxicab, limousine, executive car, etc.
2016 $307,465 $102,528 N/A $43,853 $102,925 $100,295 $7,227 $134,138 $28,171 $242,758 $24,804 $101,412
2017 $237,845 $110,264 $69,169 $30,146 $110,282 $135,155 $7,461 $124,345 $30,378 $243,832 $22,054 $110,264
2018 $207,964 $101,357 $85,737 $32,159 $107,060 $146,304 $8,270 $127,261 $31,607 $238,403 $132,892 $107,060
Source: LICN250T (Service Level)
Calgary: Decrease due to lower costs in 2018. 2017 costs included one-time costs to implement operating efficiencies.
Regina: Conducted extensive taxi bylaw review in 2017 that included engagement sessions and consultant costs. Also held a lottery for seasonal taxi licences.
Thunder Bay: Does not report - function of Police Services.
Winnipeg: In 2018, responsibility for oversight of taxi industry was transferred from Provincial Taxicab Board to City of Winnipeg, resulting in increased costs.

2018 MBNCanada Performance Measurement Report 127
Licensing
Figure 19.4 Total Cost for Taxi (Driver and Plate-Holder) Licensing per License Issued
This measure reports the total cost to administer the licensing of taxi drivers and plate holders on a per license basis. A taxi driver license is issued to an individual and permits them to operate a taxicab, limousine, executive car, etc. A taxi plate-holder license authorizes an individual(s) to own vehicle license plate(s) to operate one or more vehicles as a taxicab, limousine, executive car, etc.
2016 $549 $366 N/A $108 $144 $217 $27 $195 $35 $741 $234 $206
2017 $407 $324 $113 $70 $164 $325 $29 $182 $17 $745 $214 $182
2018 $392 $297 $137 $82 $158 $394 $31 $209 $16 $718 $410 $209
Source: LICN335T (Efficiency)
Regina: Conducted extensive taxi bylaw review in 2017 and held a lottery for seasonal taxi licences.
Thunder Bay: Does not report - function of Police Services.
Waterloo: Cost of inspections continues to decrease as licensed taxi numbers (metered and auxiliary) increased in 2017, and more inspections can be completed due to enhanced inspection processes and efficiencies.
Winnipeg: In 2018, responsibility for oversight of taxi industry was transferred from Provincial Taxicab Board to City of Winnipeg, resulting in increased costs.

2018 MBNCanada Performance Measurement Report 128
Licensing
Figure 19.5 Number of Business Licenses Issued per 100,000 Population
This measure provides the number of business licenses issued on a population basis. Business licenses are issued pursuant to municipal bylaws including zoning, fire and health requirements as well as building regulations to ensure public health and safety, nuisance control and consumer protection.
2016 3,172 1,468 2,088 1,504 1,593 732 1,467 23 1,385 122 1,468 2017 3,181 1,340 2,217 1,451 1,536 846 1,440 21 1,306 123 1,390 2018 3,161 1,470 1,955 1,372 1,492 876 1,576 19 1,364 119 1,421 Source: LICN215 (Service Level)
Halifax: Does not report – provincial responsibility.
Montreal: Does not report - technology restrictions.
Waterloo: The Region only issues licenses for salvage shops and yards, second hand goods shops and taxi cabs. Results do not appear on graph as the numbers are too low.

2018 MBNCanada Performance Measurement Report 129
Licensing
Figure 19.6 Total Cost for Business Licensing per 100,000 Population
This measure reflects the total cost to issue and administer business licenses on a population basis. Business licenses are issued pursuant to municipal bylaws including zoning, fire and health requirements as well as building regulations to ensure public health and safety, nuisance control and consumer protection.
2016 $459,695 $311,765 $51,541 $100,295 $86,889 $92,222 $567,804 $7,043 $184,840 $28,430 $96,259
2017 $526,344 $268,429 $39,489 $109,083 $87,690 $102,051 $519,976 $7,595 $197,669 $26,191 $105,567
2018 $602,477 $268,049 $164,446 $149,686 $91,805 $104,092 $499,534 $7,611 $189,797 $49,249 $157,066 Source: LICN255T (Efficiency)
Calgary: In 2018, there was an increased cost per licence due to investment in online service tools which will result in customer efficiencies and allow businesses to apply for business licenses and related permits online 24/7.
Halifax: Does not report – provincial responsibility.
London: Unable to restate previous years' data due to realignment of business units. The increase in 2018 results accurately reflect this alignment.
Montreal: Does not report - technology restrictions.

2018 MBNCanada Performance Measurement Report 130
Licensing
Figure 19.7 Total Cost for Business Licensing per License Issued
This measure reflects the total cost to issue and administer business licenses per license. Business licenses are issued pursuant to municipal bylaws including zoning, fire and health requirements as well as building regulations to ensure public health and safety, nuisance control and consumer protection.
2016 $145 $212 $25 $67 $55 $126 $387 $309 $133 $234 $139 2017 $165 $200 $18 $75 $57 $121 $361 $361 $151 $214 $158 2018 $191 $182 $84 $109 $62 $119 $317 $394 $139 $415 $161 Source: LICN340T (Efficiency)
Calgary: In 2018, there was an increased cost per licence due to investment in online service tools which will result in customer efficiencies and allow businesses to apply for business licenses and related permits online 24/7.
Halifax: Does not report - provincial responsibility.
London: Unable to restate previous years' data due to realignment of business units. The increase in 2018 results accurately reflect this alignment.
Montreal: Does not report - technology restrictions.
Winnipeg: Transfer of responsibility for taxi industry to different agency within City of Winnipeg resulted in re-allocation of fixed costs and increase in overall service costs.

2018 MBNCanada Performance Measurement Report 131

2018 MBNCanada Performance Measurement Report 132

2018 MBNCanada Performance Measurement Report 133
Long Term Care (LTC)
Figure 20.1 Percent of Long Term Care Beds per Population 75 Years and Older
The need for long term care beds is influenced by the availability of other services, e.g. hospital beds, complex continuing care, other community care services, supportive housing, adult day spaces, etc. These services are designed to work together to provide a continuum of health care for residents.
2016 6.8% 6.7% 9.5% 9.1% 8.4% 10.7% 10.4% 7.5% 8.4% 8.8% 5.4% 8.4%
2017 6.7% 6.7% 8.9% 9.0% 8.4% 10.8% 11.0% 7.3% 8.1% 9.2% 5.1% 8.4%
2018 6.7% 6.7% 8.9% 8.8% 8.4% 10.8% 11.4% 7.2% 8.0% 9.1% 4.9% 8.4%
Source: LTCR105 (Community Impact)

2018 MBNCanada Performance Measurement Report 134
Long Term Care (LTC)
Figure 20.2 Municipal Long -Term Care Facility Bed Days per Population 75 Years of Age and Older
Municipal homes in northern communities hold a significant proportion of the long-term care (LTC) beds provided in the area. Without municipal participation, some areas of the province would have limited access to LTC services. Conversely, Municipal and district homes in some southern and urban communities make up a smaller proportion of overall LTC beds given the significant number of LTC beds operated by other provider types. As a result, this may lead to greater choice of LTC homes in these communities.
2016 7.63 5.52 3.84 3.09 7.97 11.74 5.43 4.35 2.57 4.61 1.03 4.61
2017 7.50 5.50 3.64 3.02 7.97 11.95 5.42 4.42 2.48 4.83 0.98 4.83
2018 7.41 5.68 3.64 2.95 8.10 11.95 5.42 4.41 2.47 4.76 0.93 4.76
Source: LTCR219 (Service Level)

2018 MBNCanada Performance Measurement Report 135
Long Term Care (LTC)
Figure 20.3 Long-Term Care Facility Direct Cost (CMI Adjusted) per Long Term Care Facility Bed Day
Results are based on calculations using the Ministry of Health and Long-Term Care Annual Report data. Many municipalities contribute additional resources to their long-term care operations to maintain standards of care that exceed provincial requirements.
2016 $303 $257 $254 $234 $213 $193 $233 $222 $243 $269 $264 $243
2017 $314 $261 $262 $240 $221 $201 $240 $222 $248 $271 $272 $248
2018 $316 $252 $271 $250 $225 $216 $245 $228 $261 $274 $278 $252
Source: LTCR305 (Efficiency)

2018 MBNCanada Performance Measurement Report 136
Long Term Care (LTC)
Figure 20.4 Long-Term Care Resident / Family Satisfaction
Residents and/or their family members are surveyed annually to ensure their needs are understood and services are provided to meet those needs. Municipalities use different survey tools to measure resident and family satisfaction and response rates will vary.
2016 95% 99% 94% 93% 96% 95% 93% 94% 97% 96% 93% 95%
2017 91% 90% 97% 99% 96% 93% 95% 91% 96% 93% 94% 94%
2018 91% 87% 96% 87% 95% 93% 95% 91% 97% 97% 93% 93%
Source: LTCR405 (Customer Service)

2018 MBNCanada Performance Measurement Report 137

2018 MBNCanada Performance Measurement Report 138

2018 MBNCanada Performance Measurement Report 139
Parking
Figure 21.1 Number of Paid Parking Spaces Managed per 100,000 Population
The count of paid parking spaces includes on-street metered parking spaces, off-street surface parking spaces and off-street structure spaces. The total number of available parking spaces can be impacted by road construction, weather and the opening or closing of parking structures in any given year.
2016 1,514 1,302 N/A 855 1,381 617 1,361 3,193 1,496 2,044 1,105 1,371
2017 1,504 1,275 731 847 1,367 571 1,361 3,193 1,562 1,963 1,209 1,361
2018 1,508 1,255 721 824 1,371 566 1,325 3,193 1,465 1,855 1,192 1,325
Source: PRKG205 (Service Level)
London, Regina and Sudbury: Do not manage off-street structure spaces.

2018 MBNCanada Performance Measurement Report 140
Parking
Figure 21.2 Gross Parking Revenue Collected per Paid Parking Space Managed
This measure reflects gross parking revenue collected per paid parking space managed.
2016 $3,440 $1,514 N/A $1,245 $6,048 $2,079 $1,228 $587 $3,287 $935 $1,220 $1,380
2017 $3,290 $1,611 $2,573 $1,320 $6,304 $2,437 $1,154 $620 $3,258 $1,010 $1,165 $1,611
2018 $3,121 $1,595 $2,890 $1,281 $6,316 $2,123 $1,172 $661 $3,499 $1,256 $1,462 $1,595
Source: PRKG305 (Efficiency)
Montreal: The revenues collected reflect pricing policies combined with a higher number of spaces and a higher occupancy rate than other MBNCanada participants. The utilization of a web application "P$" has also helped to increase revenues and collection rate.

2018 MBNCanada Performance Measurement Report 141
Parking
Figure 21.3 Total Cost per Paid Parking Space Managed
This measure reflects the total cost to operate paid parking spaces including on-street, off-street surface and off-street structure spaces.
2016 $2,139 $1,370 N/A $498 $1,753 $1,445 $656 $475 $1,812 $796 $598 $1,083
2017 $2,173 $1,407 $1,045 $486 $1,746 $1,565 $657 $478 $1,992 $790 $567 $1,045
2018 $1,784 $1,433 $1,171 $474 $1,628 $1,520 $644 $514 $2,061 $923 $545 $1,171
Source: PRKG320T (Efficiency)
Calgary: Reduced costs in 2018 due to a number of items including lower than expected salaries and wages, lower than expected property taxes and not having to purchase cyclical assets this year.
London, Regina and Sudbury: Do not manage off-street structure spaces.

2018 MBNCanada Performance Measurement Report 142
Parking
Figure 21.4 Revenue to Cost Ratio (RC Ratio): On-street and Off-street Parking Spaces
This measure reflects the ratio of parking fees and fines over the cost to operating on-street spaces, off-street spaces and off-street structure spaces.
2016 1.95 1.23 N/A 2.78 3.71 1.53 2.07 1.62 1.98 1.60 2.33 1.97
2017 1.80 1.36 2.97 3.19 3.83 1.68 2.03 1.58 1.89 1.75 2.76 1.89
2018 2.07 1.35 2.95 3.34 4.00 1.44 2.12 1.53 2.12 1.65 3.53 2.12
Source: PRKG340 (Efficiency)
London, Regina and Sudbury: Do not manage off-street structure spaces.

2018 MBNCanada Performance Measurement Report 143

2018 MBNCanada Performance Measurement Report 144

2018 MBNCanada Performance Measurement Report 145
Parks
Figure 22.1 All Parkland in Municipality as a Percent of Total Area of Municipality
This measure reflects all parkland (natural and maintained) as a percentage of a municipality’s total area. While some municipalities with a predominantly urban form may find it more difficult to establish new or expand existing parks within their developed core area, others with larger geographic areas of unsettled lands may have small percentages of parkland. These account for the differences in the results.
2016 9.5% 2.4% N/A 6.3% 8.8% 6.9% 1.1% 5.7% 12.8% 6.7% 6.2% 6.5%
2017 9.6% 2.4% 0.9% 6.5% 8.9% 7.2% 1.1% 5.7% 12.8% 6.7% 6.4% 6.5%
2018 9.9% 2.4% 0.9% 6.6% 9.0% 7.2% 1.1% 5.7% 12.8% 6.7% 6.3% 6.6%
Source: PRKS125 (Community Impact)
Halifax: A very large geographic area containing vast areas of crown land and lakes yields a very small percentage of parkland.

2018 MBNCanada Performance Measurement Report 146
Parks
Figure 22.2 Hectares of Maintained and Natural Parkland in Municipality per 100,000 Population
Maintained Parkland includes hectares where the municipality is responsible for the direct and non-recoverable costs (should incur costs) to maintain and are available for public use. This could include hectares owned by the municipality or school boards (if a reciprocal agreement is in place) and/or those leased from other third parties (through a formal lease agreement) as long as they are made available for public use.
Natural Parkland includes forests, meadows, storm water management buffer areas above the waterline (unless they are maintained to a high standard) which are lands surrounding ponds and rivers if these areas are part of the trail system or open space system which are available for public use.
In many cases, there is little to no change in the number of hectares reported year over year, therefore only 2018 data is presented.
Maintained 298 248 288 290 128 498 867 257 149 247 256 257
Natural 365 219 972 417 110 66 1617 1485 125 195 144 219
Total 664 468 1260 707 238 564 2484 1741 274 441 400 564
Source: PRKS205 (Service Level), PRKS210 (Service Level), PRKS215 (Service Level)
0
500
1000
1500
2000
2500
CAL HAM HFX LON MTL REG SUD TBAY TOR WIND WINN MEDIAN
Total Parkland
Maintained Natural

2018 MBNCanada Performance Measurement Report 147
Parks
Figure 22.3 Operating Cost of Parks per Capita
This measure reflects the operating cost to maintain parkland.
Maintained Parkland includes hectares where the municipality is responsible for the direct and non-recoverable costs (should incur costs) to maintain and are available for public use. This could include hectares owned by the municipality or school boards (if a reciprocal agreement is in place) and/or those leased from other third parties (through a formal lease agreement) as long as they are made available for public use.
Natural Parkland includes forests, meadows, storm water management buffer areas above the waterline (unless they are maintained to a high standard) which are lands surrounding ponds and rivers if these areas are part of the trail system or open space system. These hectares include those for which the municipality is responsible for the costs (should incur costs) of maintaining and which are available for public use.
2016 $86.35 $53.24 N/A $29.49 $73.11 $51.19 $55.98 $81.43 $67.78 $85.77 $39.51 $61.88
2017 $80.79 $56.90 $41.05 $35.00 $78.29 $55.29 $60.97 $101.93 $68.48 $81.50 $40.94 $60.97
2018 $74.77 $56.38 $40.45 $38.02 $81.41 $57.97 $64.91 $111.45 $64.38 $86.53 $44.03 $64.38
Source: PRKS230 (Service Level) Formerly PRKS230M

2018 MBNCanada Performance Measurement Report 148
Parks
Figure 22.4 Operating Cost per Hectare - Maintained and Natural Parkland
This measure includes the operating cost for maintained and natural parkland that the municipality is responsible to maintain and are available for public use. The higher the population density per hectare of parkland is, the greater the number of users, resulting in increased costs. Maintained parks have higher maintenance standards and levels of maintenance activity than natural areas. Differences in service standards established for maintained parks and variations in level of management applied to natural areas affect the results.
Refer to Figure 22.2 for description of maintained and natural parkland.
2016 $13,272 $10,868 N/A $4,212 $31,672 $9,090 $2,255 $4,677 $23,642 $19,027 $9,905 $10,387
2017 $12,400 $11,808 $3,335 $4,895 $33,549 $9,696 $2,456 $5,854 $24,351 $18,372 $10,148 $10,148
2018 $11,265 $12,059 $3,210 $5,375 $34,226 $10,277 $2,614 $6,401 $23,505 $19,611 $11,004 $11,004
Source: PRKS315 (Efficiency)

2018 MBNCanada Performance Measurement Report 149

2018 MBNCanada Performance Measurement Report 150

2018 MBNCanada Performance Measurement Report 151
Payroll
Figure 23.1 Number of Payroll Direct Deposits and Cheques per Payroll Full Time Equivalent (FTE)
2016 37,210 29,273 21,267 26,861 N/A 19,218 26,152 18,370 15,955 13,906 23,907 25,119 25,965 15,574 23,692 23,877 23,877
2017 40,089 29,422 21,854 26,520 24,998 19,519 24,184 21,659 16,049 13,894 23,852 25,439 26,238 14,340 23,629 25,285 24,018
2018 38,309 30,561 23,300 25,388 26,051 19,639 30,264 24,891 15,865 13,977 23,214 22,683 26,615 16,234 23,495 26,611 24,193
Source: FPRL318 (Efficiency) Formerly FPRL317A
Montreal: Increased number of collective agreements requiring Payroll Direct Deposits and Cheques in 2018 (4 more off-cycle manual payments than in 2017).
Niagara: In 2018, there was a reduction of payroll FTE.
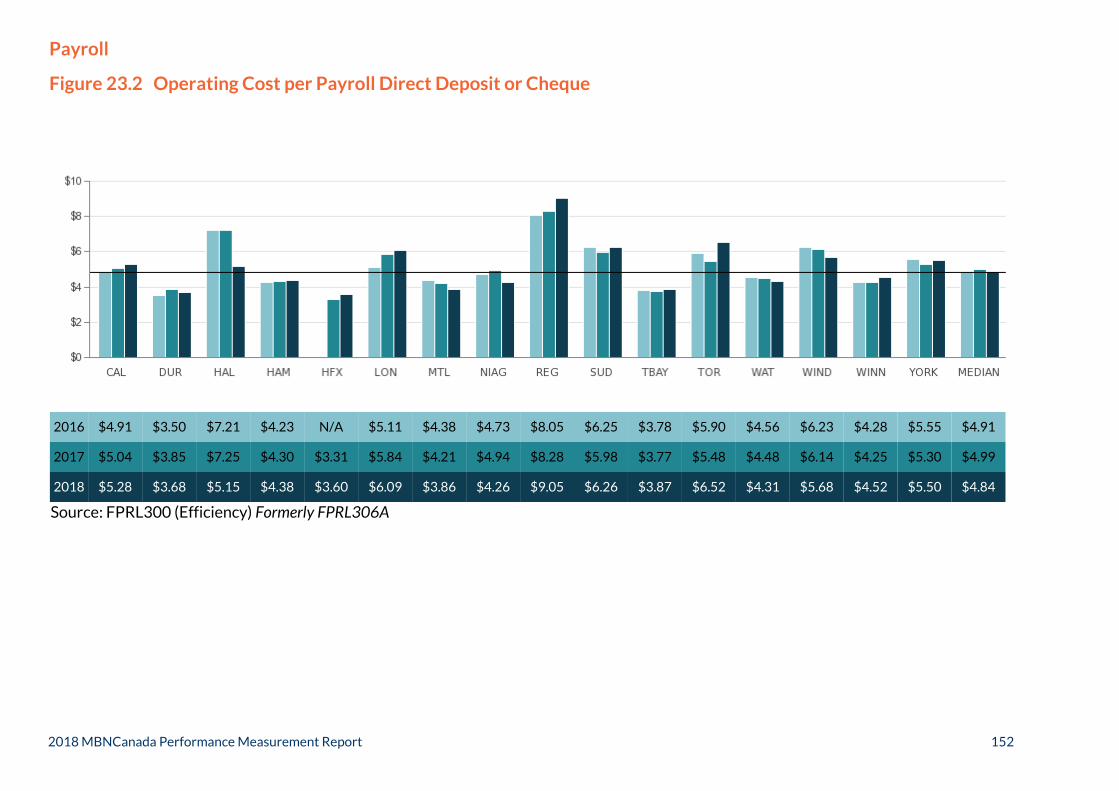
2018 MBNCanada Performance Measurement Report 152
Payroll
Figure 23.2 Operating Cost per Payroll Direct Deposit or Cheque
2016 $4.91 $3.50 $7.21 $4.23 N/A $5.11 $4.38 $4.73 $8.05 $6.25 $3.78 $5.90 $4.56 $6.23 $4.28 $5.55 $4.91
2017 $5.04 $3.85 $7.25 $4.30 $3.31 $5.84 $4.21 $4.94 $8.28 $5.98 $3.77 $5.48 $4.48 $6.14 $4.25 $5.30 $4.99
2018 $5.28 $3.68 $5.15 $4.38 $3.60 $6.09 $3.86 $4.26 $9.05 $6.26 $3.87 $6.52 $4.31 $5.68 $4.52 $5.50 $4.84
Source: FPRL300 (Efficiency) Formerly FPRL306A

2018 MBNCanada Performance Measurement Report 153

2018 MBNCanada Performance Measurement Report 154
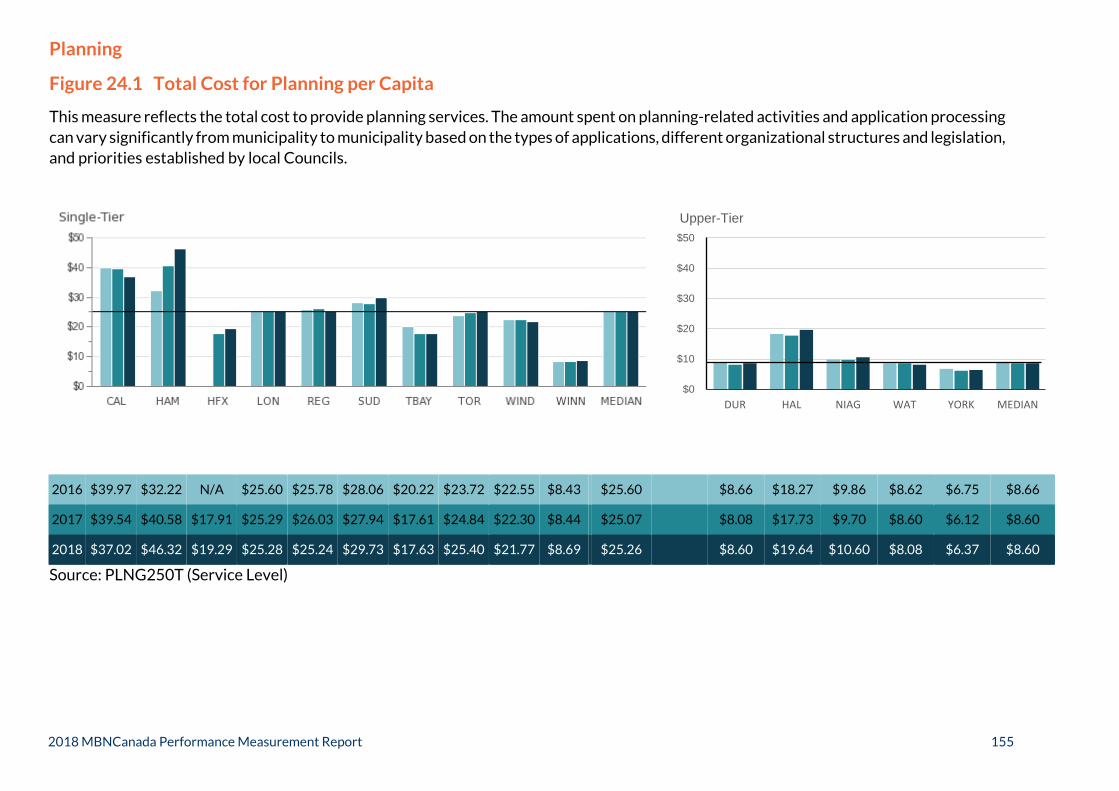
2018 MBNCanada Performance Measurement Report 155
Planning
Figure 24.1 Total Cost for Planning per Capita
This measure reflects the total cost to provide planning services. The amount spent on planning-related activities and application processing can vary significantly from municipality to municipality based on the types of applications, different organizational structures and legislation, and priorities established by local Councils.
2016 $39.97 $32.22 N/A $25.60 $25.78 $28.06 $20.22 $23.72 $22.55 $8.43 $25.60 $8.66 $18.27 $9.86 $8.62 $6.75 $8.66
2017 $39.54 $40.58 $17.91 $25.29 $26.03 $27.94 $17.61 $24.84 $22.30 $8.44 $25.07 $8.08 $17.73 $9.70 $8.60 $6.12 $8.60
2018 $37.02 $46.32 $19.29 $25.28 $25.24 $29.73 $17.63 $25.40 $21.77 $8.69 $25.26 $8.60 $19.64 $10.60 $8.08 $6.37 $8.60
Source: PLNG250T (Service Level)
$0
$10
$20
$30
$40
$50
DUR HAL NIAG WAT YORK MEDIAN
Upper-Tier
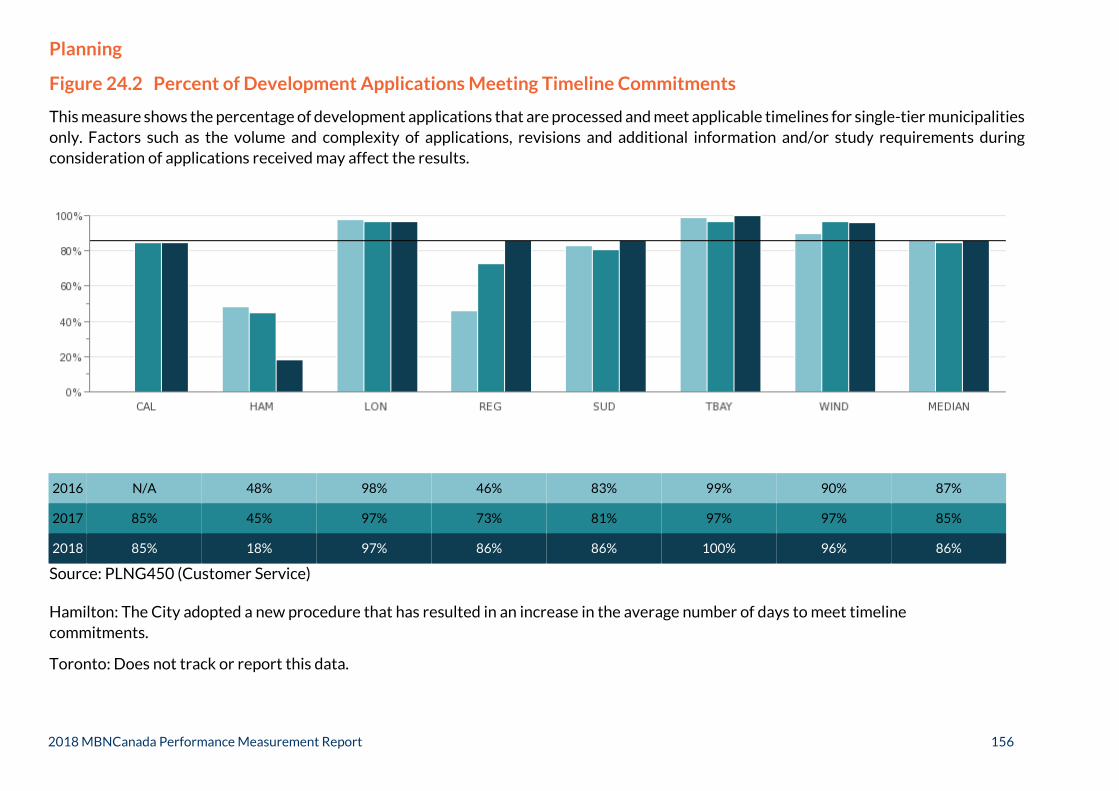
2018 MBNCanada Performance Measurement Report 156
Planning
Figure 24.2 Percent of Development Applications Meeting Timeline Commitments
This measure shows the percentage of development applications that are processed and meet applicable timelines for single-tier municipalities only. Factors such as the volume and complexity of applications, revisions and additional information and/or study requirements during consideration of applications received may affect the results.
2016 N/A 48% 98% 46% 83% 99% 90% 87%
2017 85% 45% 97% 73% 81% 97% 97% 85%
2018 85% 18% 97% 86% 86% 100% 96% 86%
Source: PLNG450 (Customer Service)
Hamilton: The City adopted a new procedure that has resulted in an increase in the average number of days to meet timeline commitments.
Toronto: Does not track or report this data.

2018 MBNCanada Performance Measurement Report 157

2018 MBNCanada Performance Measurement Report 158

2018 MBNCanada Performance Measurement Report 159
MUNICIPALITY2016 2017 2018 2016 2017 2018 2016 2017 2018 2016 2017 2018
DUR 58,629 55,484 48,500 14,061 15,804 14,373 5,747 6,612 5,534 330 275 367
HAM 79,981 75,171 76,173 N/A N/A N/A 3,783 3,800 4,860 54 68 0
LON 36,642 34,953 33,179 62 172 149 4,423 4,475 4,305 51 35 145
NIAG 34,202 29,602 27,315 N/A N/A N/A 4,474 4,196 3,802 N/A N/A N/A
SUD 14,007 11,032 10,318 18,426 23,157 22,391 1,630 1,492 1,258 185 213 175
TBAY 19,948 18,419 15,574 N/A N/A N/A 1,336 1,429 1,505 N/A N/A N/A
TOR 312,785 322,940 314,008 237,444 213,964 429 36,698 34,630 28,813 107 70 123
WAT 54,332 53,772 47,311 N/A N/A N/A 4,877 5,028 4,774 0 0 0
WIND 24,260 22,818 21,089 N/A N/A N/A 4,295 4,369 4,144 N/A N/A N/A
YORK 137,355 145,647 144,849 2,766 3,012 3,316 12,303 11,491 10,911 306 365 313
MEDIAN 45,487 44,363 40,245 51 86 149 4,449 4,422 4,520 81 52 123
Contraventions FiledPart III Charges FiledPart II Charges FiledPart I Charges Filed
Source: PCRT810D (Statistic)Source: PCRT810A (Statistic) Source: PCRT810B (Statistic) Source: PCRT810C (Statistic)
POA – Provincial Offences Act (Court Services) Figure 25.1 Total Number of Charges Filed by Type - Percent Distribution
The following figure and table identifies 4 types of charges filed (Note: N/A means that the municipality does not process these charges):
Part I Charges Filed: Often referred to as a “ticketing” process and is used for less serious offences. The defendant has 3 options: pay the fine, meet with prosecutor/walk-in guiltyplea or request a trial.
Part II Charges Filed: Applies exclusively to parking offences. The defendant has 2 options: pay the fine or request a trial. Part III Charges Filed: Used for more serious offences. The defendant must appear before a Justice of the Peace and has 2 options: resolve the charge(s) or request a trial. The charge
cannot be resolved through the payment of a set fine. Contraventions Filed: Violations of minor federal laws that can be ticketed using provincial ticketing procedures.
Total Charges
68,774
81,033
37,778
31,117
34,142
17,079
343,373
52,085
25,233
159,389

2018 MBNCanada Performance Measurement Report 160
POA – Provincial Offences Act (Court Services)
Figure 25.2 Number of Charges Filed per Court Administration Clerk
2016 6,849 6,985 5,883 4,395 8,562 5,321 5,870 6,579 5,134 8,038 6,231
2017 6,798 6,587 5,662 4,333 8,974 4,962 5,716 6,533 4,855 8,448 6,125
2018 5,980 6,753 5,741 3,989 8,536 4,270 3,334 5,787 4,506 7,590 5,764
Source: PCRT222 (Service Level)
Toronto: Due to the implementation of Administrative Penalty System for parking charges, parking tickets are not adjudicated under Provincial Offences Act (POA). As a result, Part II charges are significantly lower compared to previous years (See Figure 25.1).

2018 MBNCanada Performance Measurement Report 161
POA – Provincial Offences Act (Court Services)
Figure 25.3 Total Cost of POA Services per Charge Filed
This measure reflects the total cost to administer POA Services on a per charge basis.
2016 $80.87 $48.18 $90.34 $104.70 $46.20 $82.24 $80.58 $65.03 $111.72 $95.89 $81.56
2017 $85.75 $63.60 $96.61 $122.71 $44.77 $96.36 $73.40 $68.93 $123.90 $89.91 $87.83
2018 $101.24 $64.32 $96.65 $134.72 $40.38 $108.23 $121.16 $82.99 $135.41 $90.66 $98.95
Source: PCRT305T (Efficiency)
Niagara: Increase can be attributed to capital-related costs of new court facility.
Toronto: Due to the implementation of Administrative Penalty System for parking charges, parking tickets are not adjudicated under Provincial Offences Act (POA). As a result, Part II charges are significantly lower compared to previous years (See Figure 25.1).

2018 MBNCanada Performance Measurement Report 162
POA – Provincial Offences Act (Court Services)
Figure 25.4 Defaulted Collection Rate
This measure tracks how successful Ontario municipalities with POA responsibilities are in collecting defaulted fines using a variety of collection methods, including but not limited to collection agencies, tax rolls, license suspension and plate denial. The Provincial Offences Act (POA) gives defendants charged with offences three options: (1) to pay fine, (2) dispute the charge through early resolution, or (3) request a trial. If a defendant fails to choose one of these 3 options or fails to pay the fine imposed by the court following early resolution or trial, the fine goes into default. POA fines are debts to the Crown and therefore remain in default until paid.
2016 56% 26% 32% 35% 47% 32% 54% 51% 57% 47%
2017 61% 21% 36% 41% 44% 35% 54% 45% 52% 44%
2018 57% 25% 46% 33% 57% 31% 55% 50% 49% 49%
Source: PCRT310 (Efficiency)
London: Collection rate improved in 2018 due to increased efforts by internal collection staff to collect prior to sending to a third party.
Thunder Bay: Does not report - technology restrictions.

2018 MBNCanada Performance Measurement Report 163

2018 MBNCanada Performance Measurement Report 164

2018 MBNCanada Performance Measurement Report 165
Police Services Context For Police Related Crime Statistics in Canada in 2018
Police-reported crime statistics reflect only those incidents that are reported to the police and these are affected by largescale criminal events, social movements and changes in legislation, policies and procedures. Many of the MBNCanada results in this Chapter are derived from the Uniform Crime Reporting (UCR) Survey. Recent changes in the UCR for certain offences highlight how police-reported crime is evolving in Canada. These changes in reporting standards for the UCR Survey need to be considered when examining year to year trends presented in this Report.
In 2017, Statistics Canada, in collaboration with police services, amended the definition of “founded” criminal incidents. The new definition, which represents a commitment to a victim-centred approach for crime, includes incidents where there is no credible evidence to confirm that an incident did not take place and those based on third-party reports. The changes also provided new scoring options for police to explain why an incident was not cleared (meaning solved). The new standards came into effect January 1, 2018. When they were developed, it was acknowledged—and communicated to the policing community and the public—that the changes would have an impact on both clearance rates and on the number of criminal incidents reported to Statistics Canada.
Furthermore, considerable public discussion of issues around sexual violence took place in 2017 and 2018, and this may have had an impact on the willingness of victims to report sexual assault incidents to police for some Municipalities. In 2017, police-reported sexual assault in Canada peaked in October, coinciding with the widespread #MeToo social media movement. The number of police reports made in October and November 2017 were higher than any other calendar month since comparable data became available in 2009. Analysis of police-reported sexual assaults from 2017 and 2018 suggests the original increase continued through 2018. The increase in sexual assault incidents may also play a role in the observed increases in the Violent Crime Severity Index (VCSI), or a significant mitigator for decreases in the VCSI.
All items mentioned above need to be considered when reviewing annual trends reported in the MBNCanada Chapter for Police Services.
Source:
Moreau, Greg. (2019, July 22). Police-reported crime statistics in Canada, 2018. Retrieved from https://www150.statcan.gc.ca/n1/pub/85-002-x/2019001/article/00013-eng.pdf

2018 MBNCanada Performance Measurement Report 166
Police Services
Figure 26.1 Number of Police Staff (Officers and Civilians) per 100,000 Population
Numbers include both unionized and non-unionized police staff. Since staffing costs make up the majority of Policing costs, there is a strong correlation between those jurisdictions with higher levels of police staff reflected in this graph and those with higher police costs.
2016 224 206 N/A 212 275 253 244 277 279 265 267 259 185 176 221 188 193 188
2017 226 200 222 214 272 249 245 277 274 256 265 249 182 175 219 186 190 186
2018 227 196 220 213 280 247 251 271 267 265 254 251 182 172 215 185 187 185
Source: PLCE215 (Service Level)
0
60
120
180
240
300
DUR HAL NIAG WAT YORK MEDIAN
Upper-Tier
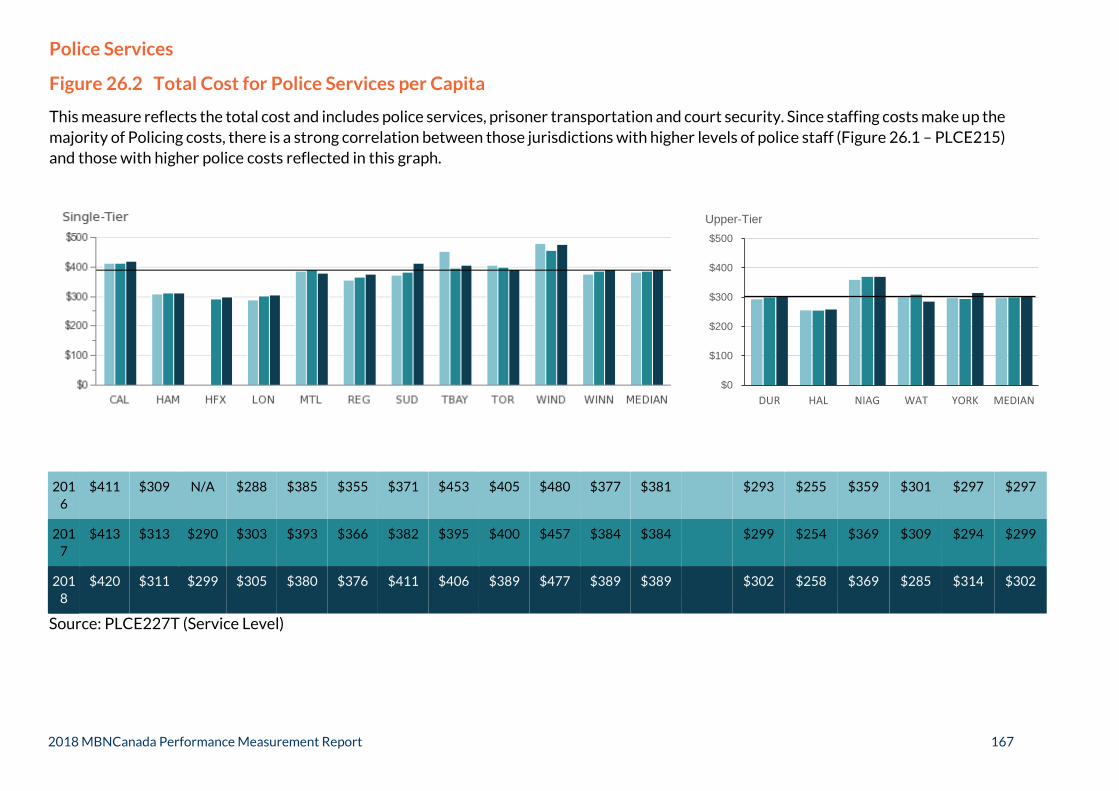
2018 MBNCanada Performance Measurement Report 167
Police Services
Figure 26.2 Total Cost for Police Services per Capita
This measure reflects the total cost and includes police services, prisoner transportation and court security. Since staffing costs make up the majority of Policing costs, there is a strong correlation between those jurisdictions with higher levels of police staff (Figure 26.1 – PLCE215) and those with higher police costs reflected in this graph.
2016
$411 $309 N/A $288 $385 $355 $371 $453 $405 $480 $377 $381 $293 $255 $359 $301 $297 $297
2017
$413 $313 $290 $303 $393 $366 $382 $395 $400 $457 $384 $384 $299 $254 $369 $309 $294 $299
2018
$420 $311 $299 $305 $380 $376 $411 $406 $389 $477 $389 $389 $302 $258 $369 $285 $314 $302
Source: PLCE227T (Service Level)
$0
$100
$200
$300
$400
$500
DUR HAL NIAG WAT YORK MEDIAN
Upper-Tier

2018 MBNCanada Performance Measurement Report 168
Police Services
Figure 26.3 Number of Reported Criminal Code Incidents (Non-Traffic) per Police Officer
Although this measure is an indication of an officer's workload, it is important to note it does not capture all of the active aspects of policing such as traffic or drug enforcement, nor does it incorporate proactive policing activities such as crime prevention initiatives or the provision of assistance to victims of crime. A number of factors can affect these results including the existence of specialized units or the use of different models to organize officers in a community. For example, some jurisdictions have a collective agreement requirement that results in a minimum of two officers per patrol car during certain time periods. In these cases, there could be two officers responding to a criminal incident whereas in another jurisdiction only one officer might respond. Sourced from Statistics Canada Tables.
2016 34 27 N/A 42 18 55 28 34 19 31 36 33 22 16 23 34 16 22
2017 36 31 31 42 18 53 35 33 21 34 39 34 23 18 25 38 17 23
2018 40 32 33 45 18 59 36 33 23 39 46 36 23 17 27 42 18 23
Source: PLCE305 (Efficiency)
0
20
40
60
DUR HAL NIAG WAT YORK MEDIAN
Upper-Tier

2018 MBNCanada Performance Measurement Report 169
Police Services
Figure 26.4 Reported Number of Criminal Code Incidents (Non-Traffic) per 100,000 Population
The total crime rate includes violent crime, property crime and other Criminal Code offences (excluding traffic), as defined by the Canadian Centre for Justice Statistic (CCJS). Actual incidents of reported crime are based on the Uniform Crime Reporting (UCR) Survey. Sourced from Statistics Canada Tables.
*The Statistics Canada National Average is included as a reference only and is not included in the calculation of the MBNCanada median.
*NationalAverage
2016 5,409 4,134 N/A 6,534 4,129 9,602 4,635 6,460 3,724 5,807 6,943 5,608 2,857 1,916 3,502 4,414 2,223 2,857 5,297
2017 5,810 4,515 4,994 6,630 4,092 9,011 5,559 6,239 3,933 6,157 7,274 5,810 2,949 2,132 3,774 4,903 2,352 2,949 5,375
2018 6,454 4,560 5,264 6,929 4,004 10,005 5,910 6,041 4,314 7,406 8,187 6,041 3,028 2,073 3,997 5,272 2,501 3,028 5,488
Source: PLCE120 (Community Impact) Formerly PLCE120M
0
3
6
9
12
DUR HAL NIAG WAT YORK MEDIAN
Upper-Tier (In Thousands)

2018 MBNCanada Performance Measurement Report 170
Police Services
Figure 26.5 Reported Number of Violent Criminal Code Incidents per 100,000 Population
A component of total crime rate (Figure 26.4 – PLCE120), the violent crime rate includes just the category of violent offences which involve the use of force or threat against a person, as defined by the Canadian Centre for Justice Statistic (CCJS). Actual incidents of reported violent crime are based on the Uniform Crime Reporting (UCR) Survey. Sourced from Statistics Canada Tables.
*The Statistics Canada National Average is included as a reference only and is not included in the calculation of the MBNCanada median.
*NationalAverage
2016 782 909 N/A 897 988 1,155 972 1,509 1,031 941 1,320 980 628 395 532 802 514 532 1,076
2017 939 978 1,254 942 999 1,285 1,048 1,557 1,056 930 1,400 1,048 633 406 591 973 549 591 1,113
2018 1,065 937 1,373 1,009 1,033 1,264 1,255 1,612 1,068 1,039 1,427 1,068 671 401 673 1,136 601 671 1,144
Source: PLCE105 (Community Impact) Formerly PLCE105M
0
0.4
0.8
1.2
1.6
2
DUR HAL NIAG WAT YORK MEDIAN
Upper-Tier (In Thousands)

2018 MBNCanada Performance Measurement Report 171
Police Services
Figure 26.6 Total Crime Severity Index
The Crime Severity Index (CSI) includes violent crime, property crime, other Criminal Code offences, as well as traffic, drug violations and all Federal Statutes as defined by the Canadian Centre for Justice Statistic (CCJS). The CSI considers not only the change in volume but the relative seriousness of the crime. Sourced from Statistics Canada Tables.
*The Statistics Canada National Average is included as a reference only and is not included in the calculation of the MBNCanada median.
*NationalAverage
2016 74 63 N/A 77 75 132 67 89 59 88 108 76 40 25 50 61 34 40 72
2017 81 69 66 78 75 117 75 88 61 95 113 78 41 28 56 70 37 41 74
2018 90 68 67 84 75 132 80 96 66 116 125 84 43 27 69 74 40 43 75
Source: PLCE180 (Community Impact)
0
30
60
90
120
150
DUR HAL NIAG WAT YORK MEDIAN
Upper-Tier

2018 MBNCanada Performance Measurement Report 172
Police Services
Figure 26.7 Violent Crime Severity Index
The Violent Crime Severity Index (CSI) includes all violent offences which involve the use of force or threat against a person as defined by the Canadian Centre for Justice Statistic (CCJS). The Violent CSI considers not only the change in volume but the relative seriousness of the crime. Sourced from Statistics Canada Tables. Refer to Figure 25.6 for detailed explanation.
*The Statistics Canada National Average is included as a reference only and is not included in the calculation of the MBNCanada median.
*National Average
2016 62 81 N/A 67 96 133 61 130 104 76 159 89 48 22 38 60 36 38 77
2017 75 91 89 67 95 110 76 146 103 87 164 91 54 29 46 74 44 46 81
2018 83 81 96 72 91 123 88 168 107 103 173 96 54 26 53 79 43 53 82
Source: PLCE170 (Community Impact)
0
40
80
120
160
200
DUR HAL NIAG WAT YORK MEDIAN
Upper-Tier

2018 MBNCanada Performance Measurement Report 173
Police Services
Figure 26.8 Weighted Total Clearance Rate
The weighted clearance rate represents the proportion of criminal incidents solved by the police, with more serious crimes being given a higher statistical "weight". Police can clear an incident by charge or the accused is processed by other means for one of many reasons as defined by the Canadian Centre for Justice Statistic (CCJS). Sourced from Statistics Canada Tables.
*The Statistics Canada National Average is included as a reference only and is not included in the calculation of the MBNCanada median.
*NationalAverage
2016 26.2% 34.9% N/A 37.6% 31.8% 39.1% 41.8% 47.0% 39.4% 35.3% 35.2% 36.5% 43.1% 49.8% 34.1% 42.0% 42.7% 42.7% 39.6 %
2017 25.7% 34.3% 35.1% 37.9% 33.6% 42.6% 41.3% 49.7% 37.9% 34.6% 36.9% 36.9% 44.4% 51.7% 33.2% 39.6% 43.9% 43.9% 39.9%
2018 25.4% 32.5% 36.8% 36.3% 30.5% 37.2% 41.1% 45.0% 35.7% 33.5% 33.0% 35.7% 47.2% 55.6% 28.8% 37.5% 40.7% 40.7% 38.3%
Source: PLCE425 (Customer Service)
0%
20%
40%
60%
CAL HAM HFX LON MTL REG SUD TBAY TOR WIND WINN MEDIAN
Single-Tier

2018 MBNCanada Performance Measurement Report 174
Police Services
Figure 26.9 Weighted Violent Clearance Rate
A component of Weighted Total Clearance Rate (Figure 26.8 – PLCE425), the weighted violence clearance rate represents the proportion of just violent criminal incidents solved by the police, with more serious crimes being given a higher statistical "weight". Police can clear an incident by charge or the accused is processed by other means for one of many reasons as defined by the Canadian Centre for Justice Statistic (CCJS). Sourced from Statistics Canada Tables.
*The Statistics Canada National Average is included as a reference only and is not included in the calculation of the MBNCanada median.
*NationalAverage
2016 47.6% 54.0% N/A 66.2% 55.7% 55.0% 77.0% 68.7% 49.4% 66.8% 51.8% 55.4% 62.0% 75.5% 60.7% 61.4% 65.0% 62.0% 63%
2017 44.9% 47.3% 47.4% 67.2% 57.4% 68.4% 78.9% 67.1% 48.9% 68.5% 52.2% 57.4% 63.2% 73.9% 55.8% 57.2% 61.6% 61.6% 64%
2018 40.6% 47.5% 46.1% 65.3% 55.0% 58.1% 68.8% 58.5% 50.7% 71.9% 48.5% 55.0% 65.0% 76.0% 57.2% 53.6% 66.7% 65.0% 61%
Source: PLCE430 (Customer Service)

2018 MBNCanada Performance Measurement Report 175

2018 MBNCanada Performance Measurement Report 176

2018 MBNCanada Performance Measurement Report 177
Purchasing
Figure 27.1 Percent of Goods and Services Purchased (Operating and Capital) Through a Procurement Process
This measure calculates the value of contracts awarded through the centralized purchasing divisions during the fiscal year and may result in a percentage higher than 100%. Fluctuations in the value of awarded tenders from year to year will affect the results.
2016 46.9% 51.6% 76.8% 107.0% N/A 43.1% 38.6% 52.8% 86.0% 61.9% 62.2% 29.5% 27.6% 59.7% N/A 48.4% 52.2%
2017 37.6% 50.9% 70.9% 70.3% 71.7% 58.5% 36.3% 65.0% 66.8% 105.7% 73.8% 74.7% 46.6% 54.2% N/A 25.7% 65.0%
2018 51.5% 51.4% 45.5% 24.7% 82.4% 38.8% 70.5% 68.3% 72.0% 62.0% 59.6% 78.8% 33.8% 46.6% 38.9% 31.6% 51.5%
Source: FPUR107 (Community Impact)
Halton: Results fluctuate based on procurement awards which reflect budget plans and project values from year to year compared to timing of reporting expenses incurred as required for Financial Information Reporting (FIR) purposes. This result is higher in years where large capital tenders are awarded.
Hamilton: Variance resulting from an exceptionally large dollar value award of 4 Requests For Proposal (RFP) and 3 Requests For Tender (RFT) in 2017.

2018 MBNCanada Performance Measurement Report 178
Purchasing
Figure 27.2 Operating Costs for Centralized Purchasing per $1,000 Municipal Purchases (Operating and Capital) for Goods and Services Through a Procurement Process
This measure reflects the operating cost for providing centralized purchasing services. The results for this measure can be impacted by fluctuations in annual operating purchases, the award and/or completion of contracts for large multi-year capital projects and/or varying procurement requirements from year to year.
2016 $7.16 $7.41 $3.71 $2.08 N/A $4.18 $12.76 $2.01 $6.38 $6.69 $6.57 $6.10 $4.60 $5.55 N/A $4.45 $5.83
2017 $9.40 $8.12 $4.62 $2.14 $5.27 $3.82 $10.18 $3.34 $6.56 $3.10 $5.52 $6.25 $3.32 $5.30 N/A $7.14 $5.30
2018 $5.60 $8.47 $8.81 $5.92 $5.26 $5.87 $3.37 $3.72 $8.31 $5.87 $6.59 $6.81 $3.70 $5.83 $3.76 $6.72 $5.87
Source: FPUR362 (Efficiency) Halton: This measure is largely affected by the total value of procurement awards that fluctuate based on budget plans and project values from year to year. This result is lower in years where large capital tenders are awarded.
Hamilton: Variance resulting from an exceptionally large dollar value award of 4 Request For Proposal (RFPs) and 3 Request For Tender (RFTs) in 2017.
Montreal: An exceptionally high value of contracts awarded in 2018 and a reorganization in the Purchasing Department have driven down the indicator value.

2018 MBNCanada Performance Measurement Report 179
Purchasing
Figure 27.3 Average Number of Bids per Bid Call
The types of tenders issued and general economic conditions can impact the number of bids received.
2016 5.9 3.7 5.1 8.2 N/A 4.0 4.6 N/A 3.7 3.6 3.0 4.7 5.0 4.8 5.5 4.7
2017 5.6 3.7 5.1 4.1 3.5 3.9 4.5 4.0 3.6 3.6 2.6 4.3 4.7 4.7 3.8 4.0
2018 4.7 5.0 5.0 4.8 3.7 4.8 5.1 3.5 2.8 3.6 2.8 3.6 4.6 4.7 5.0 4.7
Source: FPUR415 (Customer Service)
Winnipeg: Is unable to report on this measure at this time.

2018 MBNCanada Performance Measurement Report 180

2018 MBNCanada Performance Measurement Report 181

2018 MBNCanada Performance Measurement Report 182
Roads
Figure 28.1 Vehicle Km Traveled per Lane Km (Class 1, 2, and 3 Only)
The measure indicates the number of times a vehicle travels over each lane Km of major road, demonstrating road congestion.
2016 1,397,240 1,285,501 1,786,814 1,724,731 1,813,929 1,425,839 1,380,678 N/A 1,535,319 1,453,542 2,186,344 1,552,336 1,792,297 1,876,027 1,558,607 1,555,472
2017 1,395,810 1,272,686 1,832,114 1,715,118 1,818,149 1,425,839 1,116,535 N/A 1,477,790 1,453,542 2,315,584 1,591,212 1,779,072 1,894,506 1,571,312 1,581,262
2018 1,424,442 1,292,914 2,025,856 1,711,937 1,827,419 1,425,839 1,180,539 1,322,422 1,476,657 1,453,542 2,340,421 1,619,524 1,884,365 1,912,330 1,635,417 1,619,524
Source: ROAD112 (Community Impact)
Halifax: Does not report - different road classification system.
Montreal: Does not include Class 1 km - jurisdiction of the Province.

2018 MBNCanada Performance Measurement Report 183
Roads
Figure 28.2 Total Cost for Paved Roads per Lane Km (Hard Top)
This measure represents the total cost to maintain hard top (paved) roads. It includes operating costs and amortization associated with capital costs for paved road maintenance. A lane km is defined as a kilometer-long segment of roadway that is a single lane in width. For example, a one km stretch of a standard two lane road represents two lane km.
2016 $5,882 $10,517 N/A $14,061 $27,447 N/A $15,111 $11,746 $10,846 $11,736 $10,777 $11,736 $17,500 $30,479 $9,079 $19,138 $19,127 $19,127
2017 $7,077 $12,187 $17,252 $14,111 $27,577 N/A $15,468 $11,362 $11,491 $11,665 $10,928 $11,926 $18,889 $32,959 $11,681 $19,250 $15,579 $18,889
2018 $7,024 $11,280 $16,852 $18,164 $27,456 $8,100 $13,976 $10,549 $11,809 $12,359 $11,577 $11,809 $18,902 $28,826 $8,237 $21,672 $19,775 $19,775
Source: ROAD307T (Efficiency)
Halton: Some transportation services costs such as master plans; environmental assessments, feasibility studies, land costs and road resurfacing are included as operating costs as opposed to tangible capital assets.
London: Increase in 2018 expenditures due to some project contributions related to non-city owned assets.
Montreal: The higher cost can be attributed to investments in infrastructure and higher amortization costs.
$0
$7
$14
$21
$28
$35
DUR HAL NIAG WAT YORK MEDIAN
Upper-Tier (In Thousands)
$0
$7
$14
$21
$28
$35
CAL HAM HFX LON MTL REG SUD TBAY TOR WIND WINN MEDIAN
Single-Tier (In Thousands)

2018 MBNCanada Performance Measurement Report 184
Roads
Figure 28.3 Total Cost for Roads - All Functions Per Lane Km
This measure represents the total cost of all functions related to road maintenance. This includes operating costs and amortization associated with capital costs for paved and unpaved roads, bridges and culverts, traffic operations, roadside maintenance, and winter control for roadways, sidewalks, and parking lots.
2016 $14,454 $22,507 N/A $22,966 $61,492 N/A $21,698 $18,486 $36,759 $23,014 $28,459 $22,966 $33,808 $45,667 $28,472 $32,568 $33,341 $33,341
2017 $15,607 $23,785 $36,780 $23,250 $65,657 N/A $21,958 $18,983 $37,131 $22,506 $27,128 $23,518 $36,956 $51,644 $29,461 $32,838 $30,538 $32,838
2018 $16,394 $21,722 $36,402 $28,430 $66,366 $17,045 $20,704 $18,560 $39,117 $22,356 $26,953 $22,356 $38,775 $47,542 $30,425 $35,718 $35,441 $35,718
Source: ROAD308T (Efficiency)
Halton: Roads restoration costs, contracted services costs and road and bridges amortization increased due to Halton Region's continuous growth, new construction and roads rationalization.
London: Increase in 2018 expenditures due to some project contributions related to non-City owned assets.
Montreal: The higher cost can be attributed to investments in infrastructure and higher amortization costs.
$0
$20
$40
$60
$80
CAL HAM HFX LON MTL REG SUD TBAY TOR WIND WINN MEDIAN
Single-Tier (In Thousands)
$0
$20
$40
$60
$80
DUR HAL NIAG WAT YORK MEDIAN
Upper-Tier (In Thousands)

2018 MBNCanada Performance Measurement Report 185
Roads
Figure 28.4 Total Cost for Winter Maintenance of Roads per Lane Km Maintained
This measure represents the total cost for winter maintenance of a single lane km. It includes all functions included in clearing and maintaining the roadway, and is not inclusive of sidewalk snow clearing and parking lots.
2016 $2,541 $4,736 N/A $3,406 $15,189 N/A $5,352 $2,464 $5,872 $2,406 $6,147 $4,736 $4,760 $5,148 $3,277 $4,322 $5,600 $4,760
2017 $2,566 $3,725 $5,538 $3,383 $18,167 N/A $5,215 $2,693 $5,553 $2,534 $4,905 $4,315 $4,779 $4,975 $4,108 $4,089 $5,642 $4,779
2018 $3,637 $3,788 $5,946 $3,974 $18,624 $2,496 $5,065 $2,580 $5,665 $2,275 $5,159 $3,974 $5,450 $5,202 $4,459 $4,729 $6,643 $5,202
Source: ROAD309T (Efficiency)
Montreal: The service thresholds for responding to weather incidents and the volume and type of snow removal required due to population density contribute to Montreal’s higher cost.
York: Expenditures for the renovation of Central Maintenance Yard and additional snowplows to maintain new Rapidways.
$0
$4
$8
$12
$16
$20
CAL HAM HFX LON MTL REG SUD TBAY TOR WIND WINN MEDIAN
Single-Tier (In Thousands)
$0
$4
$8
$12
$16
$20
DUR HAL NIAG WAT YORK MEDIAN
Upper-Tier (In Thousands)
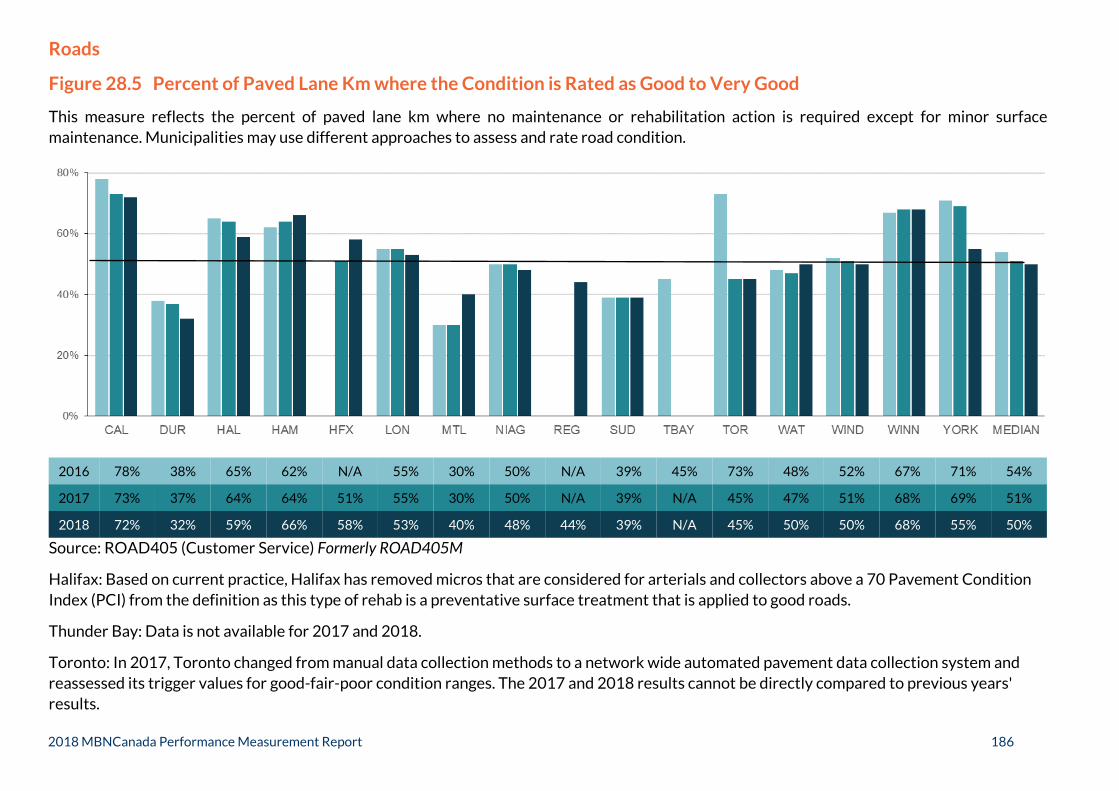
2018 MBNCanada Performance Measurement Report 186
Roads
Figure 28.5 Percent of Paved Lane Km where the Condition is Rated as Good to Very Good
This measure reflects the percent of paved lane km where no maintenance or rehabilitation action is required except for minor surface maintenance. Municipalities may use different approaches to assess and rate road condition.
2016 78% 38% 65% 62% N/A 55% 30% 50% N/A 39% 45% 73% 48% 52% 67% 71% 54%
2017 73% 37% 64% 64% 51% 55% 30% 50% N/A 39% N/A 45% 47% 51% 68% 69% 51%
2018 72% 32% 59% 66% 58% 53% 40% 48% 44% 39% N/A 45% 50% 50% 68% 55% 50%
Source: ROAD405 (Customer Service) Formerly ROAD405M
Halifax: Based on current practice, Halifax has removed micros that are considered for arterials and collectors above a 70 Pavement Condition Index (PCI) from the definition as this type of rehab is a preventative surface treatment that is applied to good roads.
Thunder Bay: Data is not available for 2017 and 2018.
Toronto: In 2017, Toronto changed from manual data collection methods to a network wide automated pavement data collection system and reassessed its trigger values for good-fair-poor condition ranges. The 2017 and 2018 results cannot be directly compared to previous years' results.

2018 MBNCanada Performance Measurement Report 187
Roads
Figure 28.6 Percent of Bridges, Culverts and Viaducts Where the Condition is Rated as Good to Very Good
This measure represents the percent of bridges, culverts and viaducts where the condition of primary components is rated as good to very good, requiring maintenance only. Municipalities may use different approaches to assess and rate the condition of these assets. Ratings are not always related to structural integrity (e.g. there may be some deterioration, but it is not structurally inadequate).
2016 89% 86% 88% 59% N/A 68% 69% 61% 67% 66% 73% 79% 72% 82% 58% 87% 72%
2017 90% 84% 90% 59% 40% 57% 69% 57% 72% 66% 72% 79% 74% 85% 60% 84% 72%
2018 91% 85% 90% 62% 40% 46% 71% 58% 72% 74% 71% 79% 78% 83% 61% 83% 73%
Source: ROAD415 (Customer Service) Formerly ROAD415M

2018 MBNCanada Performance Measurement Report 188

2018 MBNCanada Performance Measurement Report 189

2018 MBNCanada Performance Measurement Report 190
Social Assistance
Figure 29.1 Social Assistance Response Time to Client Eligibility (Days)
This measure provides an indicator of service and accessibility for Ontario Works programs by providing the average number of business days from the day that the application was submitted to the day the application was processed (i.e. approved or denied).
2016 8.6 7.9 7.3 4.0 2.3 2.8 5.1 7.3 7.9 9.3 7.3
2017 8.5 9.3 6.8 4.2 3.0 2.3 2.8 6.1 3.1 8.7 5.2
2018 8.7 11.2 6.8 4.8 2.6 2.3 1.1 5.0 1.2 8.3 4.9
Source: SSIM405 (Customer Service)
Toronto: Decrease is due to an improvement in the application process, which enables eligibility to be established at the applicant’s first point of contact through the centralized application centre.
Windsor: Business process changes since April 2017 have enabled the Employment and Social Services (E&SS) Department to meet the Ministry prescribed response time. The average response time has remained consistently below the Provincial response time average since 2017.

2018 MBNCanada Performance Measurement Report 191
Social Assistance
Figure 29.2 Monthly Social Assistance Case Load per 100,000 Households
This measure provides a metric that allows for accurate comparison of the number of Ontario Works cases in each community, as well as indicating whether Ontario Works usage is increasing or decreasing in a community.
2016 3,810 976 5,721 7,021 5,484 4,676 6,631 4,199 5,594 1,590 5,080
2017 3,690 936 5,626 6,986 5,246 4,605 6,506 4,334 5,263 1,553 4,926
2018 3,660 934 5,065 6,831 5,013 4,610 6,257 4,363 4,946 1,642 4,778
Source: SSIM206 (Service Level)

2018 MBNCanada Performance Measurement Report 192

2018 MBNCanada Performance Measurement Report 193

2018 MBNCanada Performance Measurement Report 194
Social Housing
Figure 30.1 Number of Social Housing Units per 1,000 Households
Units include rent-geared-to-income (RGI) units, market rent units and rent supplement units that were available in the year reported.
2016 30 21 63 40 38 59 77 38 49 17 39
2017 29 19 61 39 37 59 75 36 48 17 38
2018 29 19 57 39 36 58 73 36 46 17 38
Source: SCHG210 (Service Level)

2018 MBNCanada Performance Measurement Report 195
Social Housing
Figure 30.2 Percent of Social Housing Waiting List Placed Annually
Units include rent-geared-to-income (RGI) units, market units and rent supplement units that were available in the year reported.
2016 5.2% 12.0% 11.1% 26.7% 15.6% 32.8% 3.1% 16.6% 21.5% 2.2% 13.8%
2017 3.9% 12.1% 10.7% 17.8% 11.4% 31.0% 3.2% 9.9% 10.7% 2.1% 10.7%
2018 3.7% 12.0% 7.6% 10.5% 9.2% 34.1% 2.9% 10.5% 8.3% 1.9% 8.8%
Source: SCHG110 (Community Impact)
London: In 2018, London’s social housing waitlist continues to experience substantial growth, with an increase of 70% since 2016. With low vacancy rate in the social housing stock, the availability of units to house new and existing applicants has also been reduced. London also continues to experience low vacancy rates within the private rental market, resulting in pressure to increase rents to respond to the high demand. This makes it very difficult for individuals living in social housing to transition into the private rental market. London represents the 5th highest community nationally in Core Housing Need.
Windsor: The number of applicants housed was significantly reduced (36%) in 2017 in addition to a large increase (30%) in active applications on the centralized waiting list.
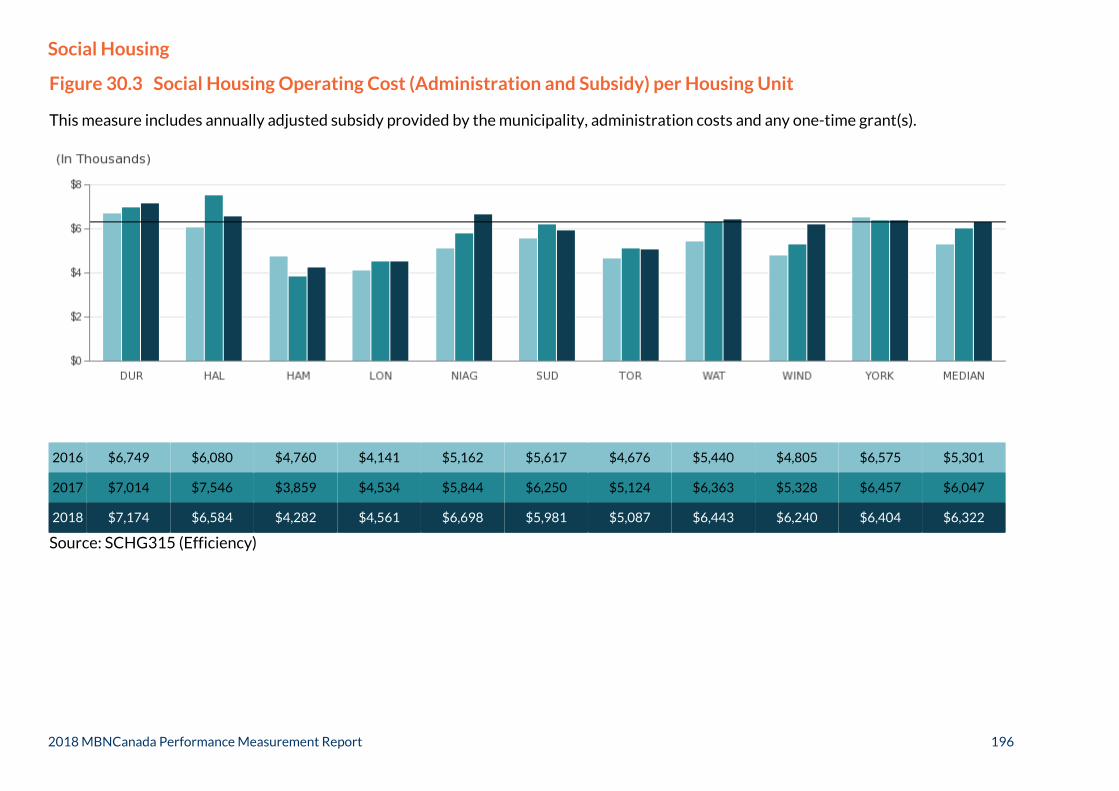
2018 MBNCanada Performance Measurement Report 196
Social Housing
Figure 30.3 Social Housing Operating Cost (Administration and Subsidy) per Housing Unit
This measure includes annually adjusted subsidy provided by the municipality, administration costs and any one-time grant(s).
2016 $6,749 $6,080 $4,760 $4,141 $5,162 $5,617 $4,676 $5,440 $4,805 $6,575 $5,301
2017 $7,014 $7,546 $3,859 $4,534 $5,844 $6,250 $5,124 $6,363 $5,328 $6,457 $6,047
2018 $7,174 $6,584 $4,282 $4,561 $6,698 $5,981 $5,087 $6,443 $6,240 $6,404 $6,322
Source: SCHG315 (Efficiency)

2018 MBNCanada Performance Measurement Report 197

2018 MBNCanada Performance Measurement Report 198

2018 MBNCanada Performance Measurement Report 199
Sports & Recreation
Figure 31.1 Annual Number of Unique Users for Directly Provided Registered Programs as a Percent of Population
Unique Users are classified as individuals who may register for more than one program; however, they are only counted once. The result does not include those who use drop-in, permit based, or programming provided by alternate sports and recreation service providers.
2016 3.8% 5.7% 6.0% N/A 7.9% 13.0% 5.6% 6.0% 4.6% 5.9%
2017 4.6% 5.3% 6.4% 5.6% 7.6% 13.1% 5.4% 6.6% 4.6% 5.6%
2018 3.6% 5.3% 7.8% 5.4% 7.9% 12.1% 5.3% 6.3% 4.7% 5.4%
Source: SREC140 (Community Impact)

2018 MBNCanada Performance Measurement Report 200
Sports & Recreation
Figure 31.2 Number of Participant Visits per Capita (Directly Provided Registered Programs)
This measure includes the number of registered program participant visits to programs directly provided by municipal staff and utilized by the public.
2016 0.5 1.2 1.0 N/A 0.7 1.4 1.7 1.2 0.7 1.1
2017 0.6 1.2 1.1 0.8 0.8 1.4 1.6 1.2 0.7 1.1
2018 0.5 1.1 1.1 0.7 0.9 1.5 1.6 1.3 0.7 1.1
Source: SREC110 (Community Impact)

2018 MBNCanada Performance Measurement Report 201
Sports & Recreation
Figure 31.3 Overall Participant Capacity for Directly Provided Registered Programs
Capacity is defined as the registered program capacity to the public and delivered by municipal staff (directly provided). Results can be influenced by variations in program delivery and partnership models.
2016 0.69 1.58 1.64 N/A 1.11 1.99 2.06 1.72 0.97 1.61
2017 0.65 1.54 1.63 1.01 1.16 2.00 1.92 1.86 0.94 1.54
2018 0.60 1.44 1.53 0.95 1.15 2.07 1.90 1.72 0.93 1.44
Source: SREC210 (Service Level)

2018 MBNCanada Performance Measurement Report 202
Sports & Recreation
Figure 31.4 Utilization Rate for Directly Provided Registered Programs
This measure indicates the level of participation in directly provided recreation programs relative to the program capacity.
2016 78% 78% 64% N/A 66% 70% 82% 68% 75% 73%
2017 86% 74% 67% 80% 71% 71% 85% 64% 76% 74%
2018 83% 76% 73% 78% 75% 70% 83% 76% 78% 76%
Source: SREC410 (Customer Service)
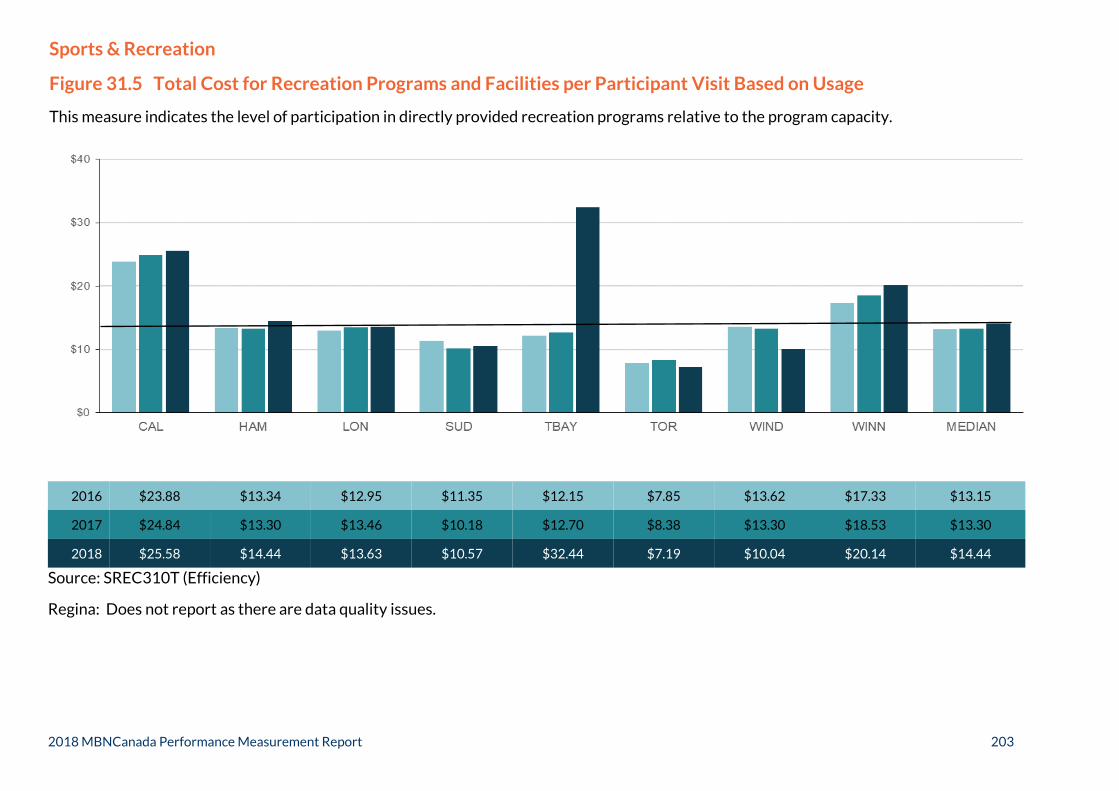
2018 MBNCanada Performance Measurement Report 203
Sports & Recreation
Figure 31.5 Total Cost for Recreation Programs and Facilities per Participant Visit Based on Usage
This measure indicates the level of participation in directly provided recreation programs relative to the program capacity.
2016 $23.88 $13.34 $12.95 $11.35 $12.15 $7.85 $13.62 $17.33 $13.15
2017 $24.84 $13.30 $13.46 $10.18 $12.70 $8.38 $13.30 $18.53 $13.30
2018 $25.58 $14.44 $13.63 $10.57 $32.44 $7.19 $10.04 $20.14 $14.44
Source: SREC310T (Efficiency)
Regina: Does not report as there are data quality issues.

2018 MBNCanada Performance Measurement Report 204
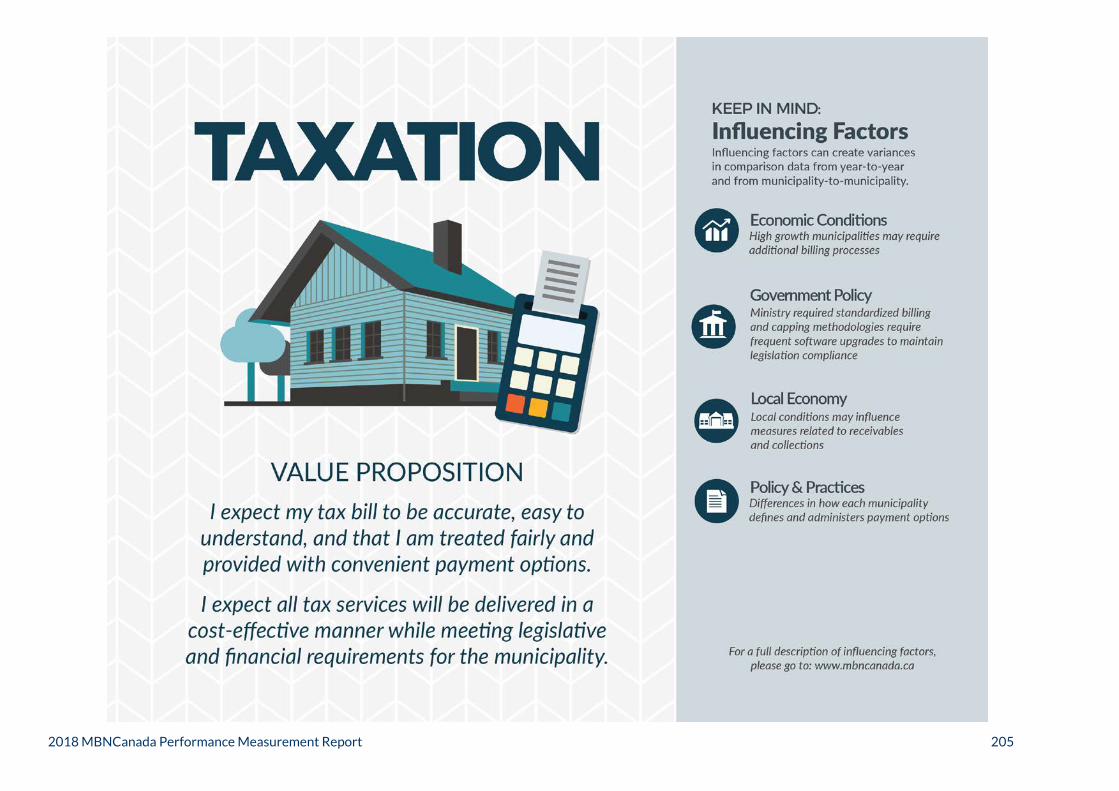
2018 MBNCanada Performance Measurement Report 205

2018 MBNCanada Performance Measurement Report 206
Taxation
Figure 32.1 Current Year's Tax Arrears as a Percent of Current Year Levy
This measure shows the proportion of the current year levy not collected as of the year end. The strength of a local economy, as well as the collection practices in each municipality, may impact tax arrears, collections and penalty and interest charges.
2016 1.1% 4.3% N/A 2.1% 2.2% 1.2% 2.5% 3.9% 2.2% 4.3% 1.7% 2.2%
2017 1.6% 3.9% 3.0% 1.8% 2.0% 1.3% 2.4% 3.2% 2.2% 4.2% 1.9% 2.2%
2018 1.7% 4.1% 2.5% 1.9% 2.3% 1.9% 2.4% 3.2% 2.1% 4.0% 1.7% 2.3%
Source: TXRS135 (Community Impact)
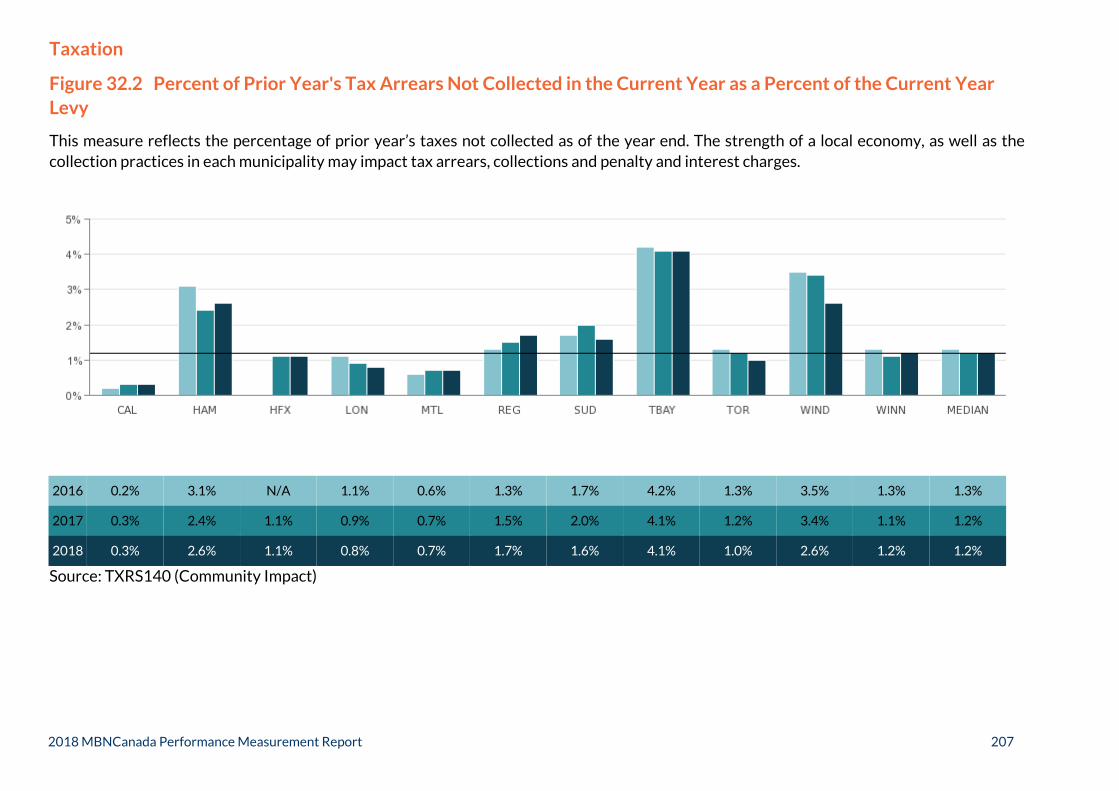
2018 MBNCanada Performance Measurement Report 207
Taxation
Figure 32.2 Percent of Prior Year's Tax Arrears Not Collected in the Current Year as a Percent of the Current Year Levy
This measure reflects the percentage of prior year’s taxes not collected as of the year end. The strength of a local economy, as well as the collection practices in each municipality may impact tax arrears, collections and penalty and interest charges.
2016 0.2% 3.1% N/A 1.1% 0.6% 1.3% 1.7% 4.2% 1.3% 3.5% 1.3% 1.3%
2017 0.3% 2.4% 1.1% 0.9% 0.7% 1.5% 2.0% 4.1% 1.2% 3.4% 1.1% 1.2%
2018 0.3% 2.6% 1.1% 0.8% 0.7% 1.7% 1.6% 4.1% 1.0% 2.6% 1.2% 1.2%
Source: TXRS140 (Community Impact)

2018 MBNCanada Performance Measurement Report 208
Taxation
Figure 32.3 Percent of Accounts (All Classes) Enrolled in a Pre-Authorized Payment Plan
The number of installments and/or due dates offered by a municipality may impact the enrollment in pre-authorized payment plans.
2016 59% 44% N/A 28% 49% 47% 27% 24% 40% 58% 44%
2017 59% 44% 13% 27% 54% 47% 33% 24% 41% 57% 43%
2018 59% 45% 13% 27% 54% 47% 36% 23% 42% 57% 44%
Source: TXRS405 (Customer Service)
Montreal: Does not offer a pre-authorized payment plan to its residents.

2018 MBNCanada Performance Measurement Report 209
Taxation
Figure 32.4 Operating Cost to Maintain Property Tax Accounts per Property Tax Account Serviced
This measure reflects the costs related to the preparation and mailing of all billings, including interim, final and supplementary bills. Payment processing and collection are also included in this calculation. Results may be impacted by the extent to which processes are automated.
2016 $10.98 $14.33 N/A $12.16 $19.89 $12.61 $16.59 $12.13 $13.81 $15.12 $11.55 $13.21
2017 $10.96 $12.86 $14.63 $12.32 $17.65 $13.96 $19.82 $11.30 $13.69 $15.05 $11.05 $13.69
2018 $10.51 $13.03 $16.15 $12.12 $15.76 $13.29 $17.25 $8.39 $13.04 $16.36 $11.57 $13.04
Source: TXRS310 (Efficiency)

2018 MBNCanada Performance Measurement Report 210
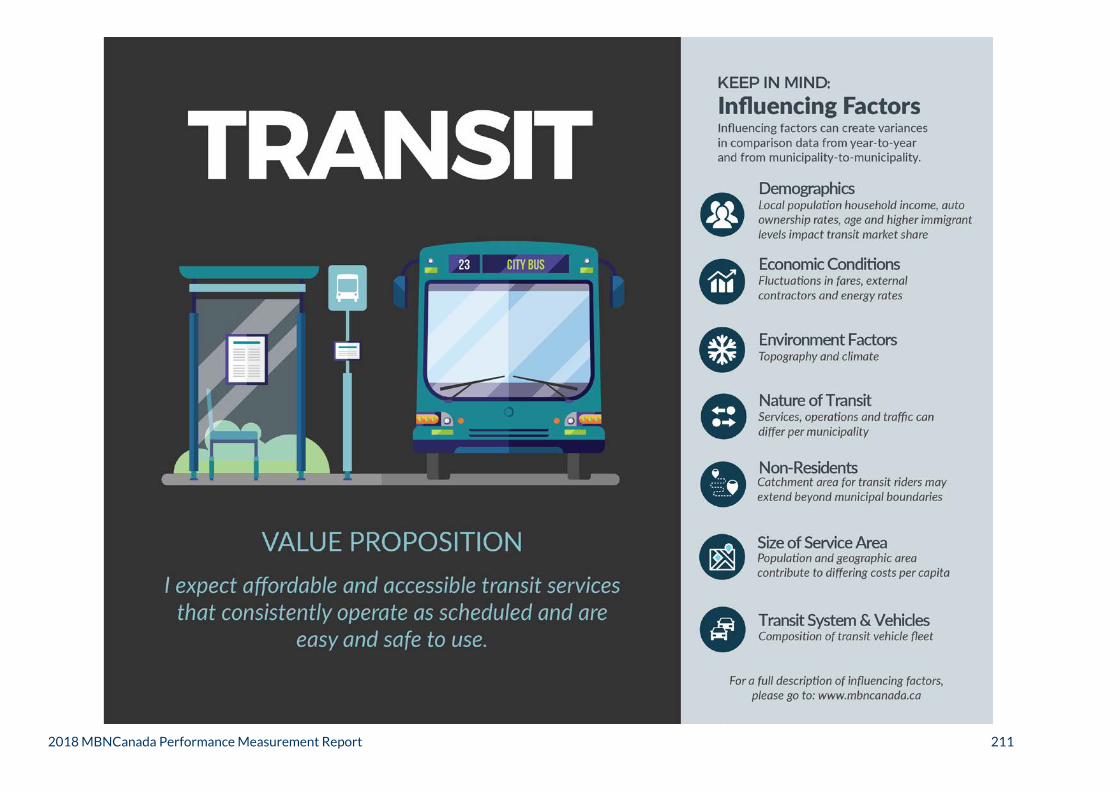
2018 MBNCanada Performance Measurement Report 211

2018 MBNCanada Performance Measurement Report 212
Transit
Figure 33.1 Number of Regular Service Passenger Trips per Capita in Service Area
The population used in this measure is based on the service area population as reported to CUTA (Canadian Urban Transit Association).
The first graph shows the municipalities with bus only; and the second graph shows the municipalities with multiple services including bus, streetcar, light rail (LRT, ALRT, DMU, etc.), heavy rail, commuter rail and ferry.
2016 18.0 43.8 23.2 27.9 33.8 43.5 30.0 69.5 20.7 30.0 83.0 N/A 206.9 190.6 190.6
2017 17.7 42.4 23.1 27.1 35.0 42.9 30.9 69.3 20.8 30.9 81.8 60.5 212.1 185.2 133.5
2018 18.3 41.1 23.4 29.6 37.4 43.1 36.5 69.5 20.0 36.5 83.1 59.8 225.2 176.2 129.7
Source: TRNT106 (Community Impact)
Halifax: Halifax adjusted its methodology for calculating service area population which has resulted in a more accurate and greatly increased population estimate than in previous years. As a result, per capita measures for 2018 are showing a decrease although both passenger trips and revenue vehicle hours have increased. Halifax offers only bus and ferry service and does not offer any street car or rail services.
0
40
80
120
160
200
240
DUR HAM REG SUD TBAY WAT WIND WINN YORK MEDIAN
Bus Only
0
40
80
120
160
200
240
CAL HFX MTL TOR MEDIAN
Multiple Transit Services

2018 MBNCanada Performance Measurement Report 213
Transit
Figure 33.2 Revenue Vehicle Hour per Capita in Service Area
This measure is as the annual vehicle hours operated by active revenue vehicles (buses, trains, etc.) in regular passenger revenue service including scheduled and non-scheduled service. It does not include auxiliary passenger services (e.g. school contracts, charters, cross-boundary services to adjacent municipalities), deadheading, training, road tests, or maintenance. The population used in this measure is based on the service area population as reported to CUTA (Canadian Urban Transit Association).
The first graph shows the municipalities with bus only; and the second graph shows the municipalities with multiple services including bus, streetcar, light rail (LRT, ALRT, DMU, etc.), heavy rail, commuter rail and ferry.
Source: TRNT210 (Service Level)
Halifax: Halifax has adjusted its methodology for calculating service area population which has resulted in a more accurate and greatly increased population estimate than in previous years. As a result, per capita measures for 2018 are showing a decrease although both passenger trips and revenue vehicle hours have increased. Halifax offers only bus and ferry service and does not offer any street car or rail services.
2016 0.88 1.65 1.21 1.12 1.31 1.60 1.09 2.02 1.16 1.21 2.03 N/A 3.36 3.89 3.36
2017 0.88 1.64 1.18 1.12 1.35 1.59 1.09 2.04 1.15 1.18 2.10 2.58 3.47 3.89 3.03
2018 0.90 1.68 1.16 1.12 1.30 1.56 1.15 2.05 1.16 1.16 2.03 2.53 3.58 3.94 3.06
0.00
1.00
2.00
3.00
4.00
5.00
DUR HAM REG SUD TBAY WAT WIND WINN YORK MEDIAN
Bus Only
0.00
1.00
2.00
3.00
4.00
5.00
CAL HFX MTL TOR MEDIAN
Multiple Transit Services

214
Transit
Figure 33.3 Total Cost (Expenses) per Revenue Vehicle Hour
This measure reflects the total cost to operate the conventional transit system over the revenue vehicle hours. Revenue vehicle hour includes revenue passenger service hours and layover hours. Amortization rates and capitalization thresholds are unique to each municipality and the variations partly explains the differences in performance between municipalities.
The first graph shows the municipalities with bus only; and the second graph shows the municipalities with multiple services including bus, streetcar, light rail (LRT, ALRT, DMU, etc.), heavy rail, commuter rail and ferry.
2016 $151 $108 $119 $130 $124 $136 $135 $120 $175 $130 $210 N/A $197 $185 $197
2017 $157 $108 $133 $134 $125 $140 $135 $122 $184 $134 $206 $153 $198 $191 $195
2018 $168 $108 $135 $140 $135 $166 $136 $127 $202 $136 $217 $157 $188 $201 $195
Source: TRNT220T (Efficiency)
Halifax: Halifax offers only bus and ferry service and does not offer any street car or rail services.
Waterloo: In 2018, amortization costs include light rail transit (LRT) costs which resulted in increase. This is a new cost to the Region and was not included in previous years.
2018 MBNCanada Performance Measurement Report
$0
$50
$100
$150
$200
$250
DUR HAM REG SUD TBAY WAT WIND WINN YORK MEDIAN
Bus Only
$0
$50
$100
$150
$200
$250
CAL HFX MTL TOR MEDIAN
Multiple Transit Services

2018 MBNCanada Performance Measurement Report 215

2018 MBNCanada Performance Measurement Report 216

2018 MBNCanada Performance Measurement Report 217
Waste Management
Figure 34.1 Tonnes of All Residential Material Collected per Household
Residential waste includes organics, blue box, leaf and yard, municipal hazardous or special waste, other recyclable materials such as wood, metal and tires, as well as construction and demolition materials.
2016 0.89 0.85 0.92 0.96 N/A 0.80 0.86 0.88 1.11 0.53 0.95 0.80 0.85 0.84 0.86 0.93 0.86
2017 0.83 0.83 0.91 0.94 0.68 0.80 0.86 0.92 1.07 0.54 0.91 0.80 0.78 0.90 0.91 0.92 0.88
2018 0.81 0.81 0.92 0.94 0.67 0.79 0.85 0.90 1.08 0.53 0.92 0.81 0.79 0.90 0.92 0.91 0.88
Source: SWST205 (Service Level)

2018 MBNCanada Performance Measurement Report 218
Waste Management
Figure 34.2 Tonnes of Residential Solid Waste Disposed per Household
This measure indicates the amount of solid waste (or garbage) that is sent to landfills.
2016 0.69 0.48 0.41 0.53 N/A 0.51 0.55 0.43 0.92 0.73 0.41 0.44 0.58 0.59 0.38 0.52
2017 0.56 0.50 0.41 0.56 0.31 0.51 0.53 0.44 0.84 0.69 0.41 0.33 0.61 0.64 0.40 0.51
2018 0.41 0.51 0.42 0.62 0.31 0.53 0.51 0.43 0.81 0.68 0.42 0.29 0.54 0.63 0.39 0.51
Source: SWST220 (Service Level)
Hamilton: The increase in 2018 was primarily due to the temporary shut down of the Central Composting Facility.
Sudbury: Does not report - unable to separate residential tonnage.
Windsor: 2017 results are high due to a catastrophic flooding that occurred in 2017.

2018 MBNCanada Performance Measurement Report 219
Waste Management
Figure 34.3 Tonnes of Residential Solid Waste Diverted per Household
This measure demonstrates the tonnes of residential waste diverted away from landfills and incineration through programs such as organics, blue box, leaf and yard, municipal hazardous or special waste and other recyclable materials.
2016 0.26 0.49 0.53 0.45 N/A 0.41 0.31 0.54 0.25 0.26 0.44 0.49 0.37 0.32 0.61 0.43 2017 0.32 0.47 0.52 0.44 0.47 0.41 0.32 0.57 0.23 0.27 0.46 0.51 0.37 0.27 0.61 0.44 2018 0.45 0.49 0.52 0.35 0.44 0.41 0.34 0.55 0.27 0.28 0.46 0.56 0.36 0.31 0.60 0.44 Source: SWST235 (Service Level)
Calgary: The large increase in diversion was due to the implementation of the Green Cart Program and change to every other week garbage collection, which was completed in the second half of 2017. 2018 was the first full year of program results.
Hamilton: The decrease in 2018 was primarily due to the temporary shut down of the Central Composting Facility.
Sudbury: Does not report - unable to separate residential tonnage.

2018 MBNCanada Performance Measurement Report 220
Waste Management
Figure 34.4 Percent of Residential Solid Waste Diverted
This measure demonstrates the percent of residential waste diverted away from landfills and incineration through programs such as organics, blue box, leaf and yard, municipal hazardous or special waste and other recyclable materials, e.g. wood, metal, tires.
2016 27% 53% 56% 46% N/A 45% 36% 56% 22% 43% 26% 52% 53% 39% 35% 62% 45%
2017 36% 51% 56% 44% 60% 45% 38% 57% 21% 45% 28% 53% 60% 38% 33% 60% 45%
2018 52% 49% 55% 36% 59% 44% 40% 56% 25% 45% 29% 52% 65% 40% 33% 60% 47%
Source: SWST105 (Community Impact). Formerly SWST105M.
Calgary: The large increase in diversion was due to the implementation of the Green Cart Program and change to every other week garbage collection, which was completed in the second half of 2017. 2018 was the first full year of program results.
Hamilton: The decrease in 2018 was primarily due to the temporary shut down of the Central Composting Facility.

2018 MBNCanada Performance Measurement Report 221
Waste Management
Figure 34.5 Total Cost for Garbage Collection per Tonne - All Property Classes
This measure reflects the total cost for garbage collection for all property classes which includes residential, and industrial, commercial and institutional (ICI) locations on a per tonne basis.
2016 $151 $140 $165 $245 N/A $94 $153 $99 $113 $159 $133 $121 $124 $90 $75 $129
2017 $160 $141 $159 $154 $156 $96 $156 $94 $120 $160 $167 $132 $164 $111 $95 $154
2018 $161 $154 $158 $149 $165 $103 $158 $87 $129 $167 $173 $93 $182 $92 $104 $154
Source: SWST311T (Efficiency)
Hamilton: The decrease from 2016 to 2017 was due to the reallocation of costs for the City's recycling collection contract.
Windsor: Cost increase in 2017 due to a storm event that caused catastrophic flooding in the City.
York: Does not report - The Region operates a two-tier system. It is not responsible for curbside collection; however, the Region is responsible for all processing. York reports the total tonnes collected (see Fig 34.1 – SWST205) but is unable to report the total cost.

2018 MBNCanada Performance Measurement Report 222
Waste Management
Figure 34.6 Total Cost for Solid Waste (All Streams) Disposal per Tonne - All Property Classes
This measure reflects the total cost for solid waste disposal for all Property Classes which includes residential, and industrial, commercial and institutional (ICI) locations on a per tonne basis. Additional costs such as transporting waste outside a community, aging infrastructure, capital costs, and the cost associated with the incineration of garbage, service agreements, increase in leachate treatment and fluctuating fuel costs can impact the results. In addition, declining landfill capacities typically result in increased landfill rates. The results can be impacted significantly due to the recording of post-closure landfill liability costs.
2016 $66 $207 $83 $99 N/A $27 $77 $95 $38 $62 $38 $120 $102 $114 $32 $159 $83
2017 $56 $184 $78 $111 $183 $33 $77 $87 $36 $78 $41 $136 $135 $137 $35 $141 $83
2018 $63 $194 $70 $381 $175 $29 $78 $93 $38 $64 $35 $193 $186 $83 $35 $164 $81
Source: SWST325T (Efficiency)
Hamilton: Reported costs increased significantly in 2018 due to an increase in landfill liability resulting from resetting the post period monitoring of closed landfills to 50 years.
Windsor: Cost increase in 2017 due to a storm event that caused catastrophic flooding in the City.

2018 MBNCanada Performance Measurement Report 223
Waste Management
Figure 34.7 Total Cost for Solid Waste Diversion per Tonne - All Property Classes
This measure reflects the total cost for solid waste diversion for all Property Classes which includes residential, and industrial, commercial and institutional (ICI) locations, on a per tonne basis.
2016 $346 $211 $201 $151 N/A $123 $257 $138 $331 $181 $159 $442 $195 $123 $260 $125 $195
2017 $370 $213 $208 $204 $262 $122 $232 $116 $329 $212 $147 $388 $166 $114 $303 $125 $210
2018 $387 $254 $216 $312 $290 $141 $286 $144 $360 $250 $180 $451 $161 $190 $368 $152 $252
Source: SWST330T (Efficiency)
Calgary: The Green Cart program was introduced in 2017. One-time program implementation costs were included in the 2017 results.
Hamilton: The increase in 2017 was due to the reallocation of costs for the City's recycling collection contract. The increase in 2018 was primarily due to the temporary shut down of the Central Composting Facility.
Windsor: Increased costs in this measure are attributable to a new collection contract, additional contracted processing costs, significant repairs to equipment, an LED lighting initiative as well as an increase in the valuation of the City’s post retirement benefits and WSIB liabilities.

2018 MBNCanada Performance Measurement Report 224

2018 MBNCanada Performance Measurement Report 225

2018 MBNCanada Performance Measurement Report 226
Wastewater
Figure 35.1 Percent of Wastewater Estimated to Have Bypassed Treatment
The frequency and severity of weather events can have a significant negative impact on results.
2016 0.00% 0.00% 0.00% 1.27% N/A 0.10% 0.69% 1.10% 0.00% 1.13% 3.21% 0.15% 0.37% 2.21% 2.22% 0.00% 0.37%
2017 0.00% 0.00% 0.01% 4.37% N/A 0.40% 0.55% 4.93% 0.00% 0.67% 0.00% 0.61% 0.00% 2.34% 1.09% 0.03% 0.40%
2018 0.00% 0.05% 0.03% 3.02% N/A 0.67% 0.35% 3.75% 0.00% 0.73% 0.00% 0.49% 0.24% 2.95% 0.41% 0.00% 0.35%
Source: WWTR110 (Community Impact) Formerly WWTR110
Hamilton, London, Niagara and Toronto: High lake levels and increased precipitation impacted 2017 results.
London: The largest section of the largest plant was under construction for most of 2018 which led to reduced wet weather capacity and more bypassed flow.
Windsor: Increase due to heavier than normal storm events in 2018. Some of these storms delivered large volumes to the plants in a short period of time resulting in the increase of volume bypassed.
0%
1%
2%
3%
4%
5%
CAL DUR HAL HAM HFX LON MTL NIAG REG SUD TBAY TOR WAT WIND WINN YORK MEDIAN

2018 MBNCanada Performance Measurement Report 227
Wastewater
Figure 35.2 Megalitres of Treated Wastewater per 100,000 Population
Integrated Systems: The term applies to municipalities that have full responsibility for all wastewater activities including collection, conveyance, treatment and disposal.
Two-Tier System: The term applies to municipalities that have responsibility for components of wastewater activities.
2016 12,022 12,320 15,810 21,525 N/A 18,444 42,575 11,276 20,886 30,384 12,883 30,011 13,751 17,127 17,362 11,431 10,701 11,431
2017 11,885 11,540 16,237 22,784 N/A 18,687 43,134 10,908 21,159 28,237 15,033 30,326 12,006 17,462 19,207 11,430 9,696 11,430
2018 11,638 11,219 15,756 21,302 14,520 19,387 41,516 11,522 17,059 25,006 12,855 33,114 10,621 15,756 19,243 10,939 9,964 10,939
Source: WWTR210 (Service Level)
Niagara, Waterloo and York: Responsible for all components with the exception of collection which is the responsibility of local municipalities within their boundaries.
Windsor: Increase due to heavier than normal storm events in 2018. Some of these storms delivered large volumes to the plants in a short period of time resulting in the increase of volume bypassed.
0
9
18
27
36
45
NIAG WAT YORK MEDIAN
Two-Tier Systems (In Thousands)

2018 MBNCanada Performance Measurement Report 228
Wastewater
Figure 35. 3 Average Age of Wastewater Pipe and Annual Number of Wastewater Main Back-ups per 100 Km of Wastewater Main
Age of Wastewater Pipes: Older wastewater pipes are often in poor condition and contain cracks, leaking joints and broken sections, contributing to increased pipe blockages and/or an inflow of groundwater into the system causing increased flow. These factors result in an increased frequency of wastewater main back-ups relative to newer systems that do not have such deficiencies and result in higher maintenance costs for older systems.
Wastewater Main Back-ups: The annual number of wastewater backups is directly related to the design of the wastewater pipe and the design of the wastewater collection system, i.e. the extent to which storm sewers are connected to or combined with sanitary sewers resulting in increased flow. Design criteria, age and condition of the wastewater collection infrastructure combined with localized major precipitation events can result in flows that exceed system capacity and result in wastewater backups.
Regina and York: Reports average age of wastewater pipe only.
Niagara and Waterloo: Backups are recorded within municipal boundaries only.
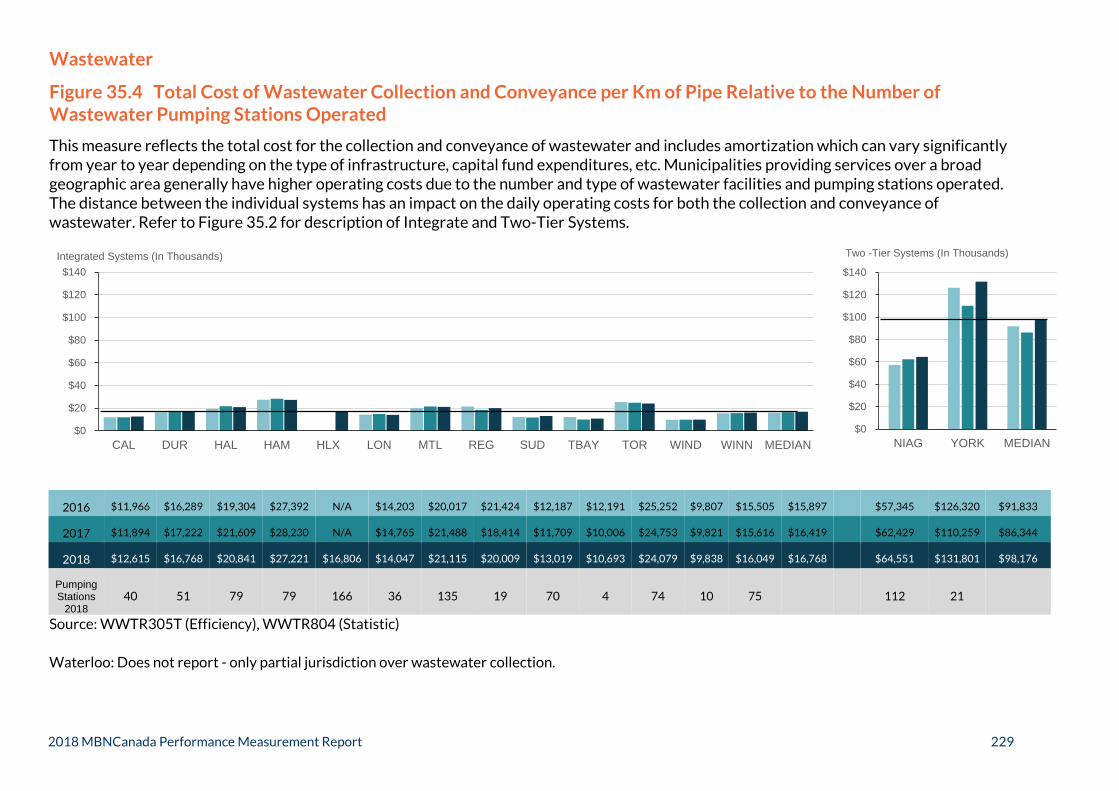
2018 MBNCanada Performance Measurement Report 229
Wastewater
Figure 35.4 Total Cost of Wastewater Collection and Conveyance per Km of Pipe Relative to the Number of Wastewater Pumping Stations Operated
This measure reflects the total cost for the collection and conveyance of wastewater and includes amortization which can vary significantly from year to year depending on the type of infrastructure, capital fund expenditures, etc. Municipalities providing services over a broad geographic area generally have higher operating costs due to the number and type of wastewater facilities and pumping stations operated. The distance between the individual systems has an impact on the daily operating costs for both the collection and conveyance of wastewater. Refer to Figure 35.2 for description of Integrate and Two-Tier Systems.
2016 $11,966 $16,289 $19,304 $27,392 N/A $14,203 $20,017 $21,424 $12,187 $12,191 $25,252 $9,807 $15,505 $15,897 $57,345 $126,320 $91,833
2017 $11,894 $17,222 $21,609 $28,230 N/A $14,765 $21,488 $18,414 $11,709 $10,006 $24,753 $9,821 $15,616 $16,419 $62,429 $110,259 $86,344
2018 $12,615 $16,768 $20,841 $27,221 $16,806 $14,047 $21,115 $20,009 $13,019 $10,693 $24,079 $9,838 $16,049 $16,768 $64,551 $131,801 $98,176
Pumping Stations
2018 40 51 79 79 166 36 135 19 70 4 74 10 75 112 21
Source: WWTR305T (Efficiency), WWTR804 (Statistic)
Waterloo: Does not report - only partial jurisdiction over wastewater collection.
$0
$20
$40
$60
$80
$100
$120
$140
NIAG YORK MEDIAN
Two -Tier Systems (In Thousands)
$0
$20
$40
$60
$80
$100
$120
$140
CAL DUR HAL HAM HLX LON MTL REG SUD TBAY TOR WIND WINN MEDIAN
Integrated Systems (In Thousands)
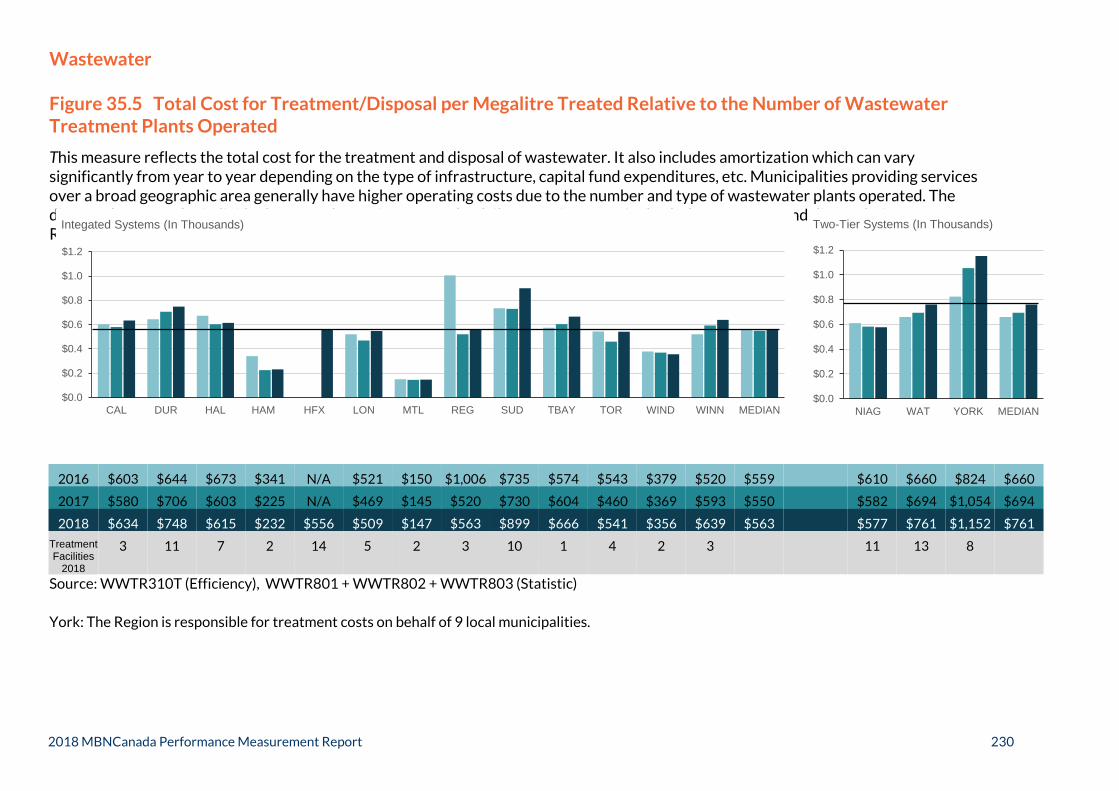
2018 MBNCanada Performance Measurement Report 230
Wastewater
Figure 35.5 Total Cost for Treatment/Disposal per Megalitre Treated Relative to the Number of Wastewater Treatment Plants Operated
This measure reflects the total cost for the treatment and disposal of wastewater. It also includes amortization which can vary significantly from year to year depending on the type of infrastructure, capital fund expenditures, etc. Municipalities providing services over a broad geographic area generally have higher operating costs due to the number and type of wastewater plants operated. The distance between the individual systems has an impact on the daily operating costs for both the treatment and disposal of wastewater. Refer to Figure 35.2 for description of Integrated and Two-Tier Systems.
2016 $603 $644 $673 $341 N/A $521 $150 $1,006 $735 $574 $543 $379 $520 $559 $610 $660 $824 $660 2017 $580 $706 $603 $225 N/A $469 $145 $520 $730 $604 $460 $369 $593 $550 $582 $694 $1,054 $694 2018 $634 $748 $615 $232 $556 $509 $147 $563 $899 $666 $541 $356 $639 $563 $577 $761 $1,152 $761
Treatment Facilities
2018
3 11 7 2 14 5 2 3 10 1 4 2 3 11 13 8
Source: WWTR310T (Efficiency), WWTR801 + WWTR802 + WWTR803 (Statistic)
York: The Region is responsible for treatment costs on behalf of 9 local municipalities.
$0.0
$0.2
$0.4
$0.6
$0.8
$1.0
$1.2
NIAG WAT YORK MEDIAN
Two-Tier Systems (In Thousands)
$0.0
$0.2
$0.4
$0.6
$0.8
$1.0
$1.2
CAL DUR HAL HAM HFX LON MTL REG SUD TBAY TOR WIND WINN MEDIAN
Integated Systems (In Thousands)

2018 MBNCanada Performance Measurement Report 231
Wastewater
Figure 35.6 Total Cost of Wastewater of Collection/Conveyance and Treatment/Disposal per Megalitre Treated
This measure reflects the combined total cost for the collection, conveyance, treatment and disposal of wastewater. Municipalities providing service over a broad geographic area generally have higher operating costs due to the number and type of wastewater pumping stations and treatment plants operated. The distance between the individual system has an impact on the daily operating costs for wastewater treatment/disposal and collection/conveyance. Amortization can vary significantly from year to year depending on the type of infrastructure, capital fund expenditures, etc. Refer to Figure 35.2 for description of Integrate and Two-Tier Systems.
2016 $941 $1,110 $1,103 $791 N/A $789 $260 $1,778 $1,084 $779 $933 $514 $920 $927 $877 $1,174 $1,026
2017 $916 $1,226 $1,068 $625 N/A $751 $261 $1,204 $1,062 $785 $781 $501 $1,048 $851 $829 $1,415 $1,122
2018 $993 $1,274 $1,071 $642 $939 $785 $265 $1,265 $1,357 $885 $897 $476 $1,172 $939 $832 $1,567 $1,200
Source: WWTR315T (Efficiency)
Waterloo: Does not report - responsible for treatment and disposal only. See Figure 35.5.
$0.0
$0.4
$0.8
$1.2
$1.6
$2.0
NIAG YORK MEDIAN
Two-Tier Systems (In Thousands)
$0.0
$0.4
$0.8
$1.2
$1.6
$2.0
CAL DUR HAL HAM HFX LON MTL REG SUD TBAY TOR WIND WINN MEDIAN
Integrated Systems (In Thousands)

2018 MBNCanada Performance Measurement Report 232

2018 MBNCanada Performance Measurement Report 233

2018 MBNCanada Performance Measurement Report 234
Water
Figure 36.1 Megalitres of Treated Water per 100,000 Population
Integrated Systems: The term applies to municipalities that have full responsibility for all water activities including treatment, transmission, storage and local distribution.
Two-Tier Systems: The term applies to municipalities that have responsibility for components of water activities such as treatment, transmission and major water storage facilities, whereas local municipalities are responsible for local distribution and/or storage facilities.
2016 12,552 10,626 12,258 15,096 N/A 12,527 29,812 11,943 12,906 13,208 13,256 16,081 9,458 12,729 14,358 9,634 10,734 10,734
2017 13,397 9,843 11,251 13,434 N/A 12,540 28,540 13,510 12,613 12,819 12,609 14,964 8,962 12,716 13,526 9,167 9,662 9,662
2018 12,991 10,212 11,230 14,387 10,531 12,455 29,565 13,036 13,794 13,609 12,480 14,430 9,464 12,991 13,884 9,343 9,855 9,855
Source: WATR210 (Service Level)
Montreal: The City must produce significant volumes of water to meet the needs of the ICI (Industrial, Commercial and Institutional) sectors which is a large proportion of the clientele served. In addition, the aging infrastructure causes a high rate of water loss, which has a significant impact on the volume of water produced by the City.
0
6
12
18
24
30
NIAG WAT YORK MEDIAN
Two-Tier Systems (In Thousands)

2018 MBNCanada Performance Measurement Report 235
Water
Figure 36.2 Average Age of Water Pipe and Number of Water Main Breaks per 100 Km of Water Distribution Pipe
Age of Water Distribution Pipe: Old pipes are usually in poor condition as a result of pipe corrosion, pipe materials (susceptible to fractures), and leakage at pipe joints and service connections which contributes to an increased frequency of water main breaks relative to newer systems that do not have such deficiencies. The practice of relining pipes has caused inconsistent reporting on the age of the pipe.
Number of Water Main Breaks: Excludes service connections and hydrant leads.

2018 MBNCanada Performance Measurement Report 236
Water Figure 36.3 Total Cost for the Treatment of Drinking Water per Megalitre of Drinking Water Treated Relative to the Number Water Treatment Plants This measure reflects the total cost for the treatment of drinking water. Costs include operation and maintenance of treatment plants as well as quality assurance and laboratory testing to ensure compliance with regulations, and amortization which can vary from year to year depending on the type of infrastructure, capital fund expenditures, etc. Municipalities providing service over a broad geographic area generally have higher operating costs due to the number and type of water treatment facilities and wells operated. The distance between the individual systems has an impact on the daily operating costs for the treatment of drinking water. Refer to Figure 36.1 for description of Integrated and Two-Tier systems.
Source: WATR310T (Efficiency), WATR801 (Statistic)
Waterloo: The Region's treatment and transmission infrastructure are fully integrated and cost components cannot be separated. See Figure 36.5 for total cost.
2016 $303 $446 $468 $299 N/A $272 $132 $408 $646 $546 $206 $359 $558 $384 $345 $618
2017 $288 $479 $514 $428 N/A $265 $143 $445 $716 $571 $243 $371 $620 $437 $399 $832
2018 $285 $462 $468 $343 $511 $295 $132 $578 $700 $497 $266 $386 $561 $462 $361 $750
Treatment Facilities
20182 28 12 5 9 0 6 1 21 1 4 1 2 6 42
$482
$616
$556
$0
$150
$300
$450
$600
$750
$900
CAL DUR HAL HAM HFX LON MTL REG SUD TBAY TOR WIND WINN MEDIAN
Integated Systems

2018 MBNCanada Performance Measurement Report 237
Water
Figure 36.4 Total Cost for the Distribution/Transmission of Drinking Water per Km of Water Distribution Pipe Relative to the Number of Water Pumping Stations Operated
This measure reflects the total cost for the distribution and transmission of drinking water. Amortization is also included and can vary from year to year to year depending on the type of infrastructure, capital fund expenditures, etc. Municipalities providing service over a broad geographic area generally have higher operating costs due to the number and type of water treatment facilities and water pumping stations operated. The distance between the individual systems has an impact on the daily operating costs for both the distribution and transmission of drinking water. Refer to Figure 36.1 for description of Integrated and Two-Tier systems.
Source: WATR305T (Efficiency), WATR808 (Statistic)
Waterloo: The Region's treatment and transmission infrastructure are fully integrated and the cost components cannot be separated. See Figure 36.5 for total cost.
$0
$20
$40
$60
$80
$100
$120
$140
NIAG YORK MEDIAN
Two-Tier Systems (In Thousands)
$0
$20
$40
$60
$80
$100
$120
$140
CAL DUR HAL HAM HFX LON MTL REG SUD TBAY TOR WIND WINN MEDIAN
Integated Systems in Thousands
2016 $18,328 $18,592 $23,748 $23,347 N/A $25,458 $36,226 $20,445 $15,530 $17,410 $28,732 $12,919 $14,697 $19,519 $26,460 $124,405
2017 $17,269 $19,736 $22,565 $22,930 N/A $29,088 $38,057 $22,197 $16,164 $17,665 $27,116 $14,737 $15,068 $20,967 $27,719 $125,681
2018 $16,825 $19,673 $23,262 $23,820 $15,360 $28,676 $38,949 $23,245 $15,600 $17,816 $27,833 $14,892 $13,972 $19,673 $27,014 $119,390
Pumping Stations
201842 18 15 22 20 8 19 3 15 8 18 3 5 11 22
$75,433
$76,700
$73,202
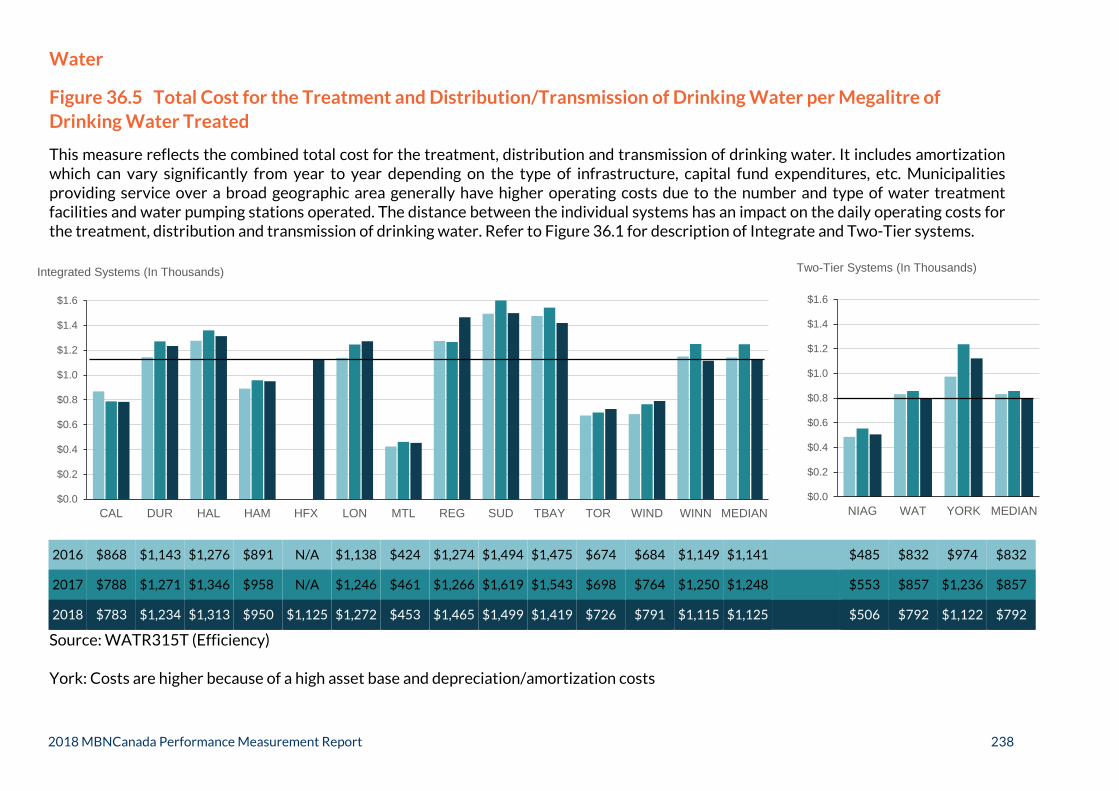
2018 MBNCanada Performance Measurement Report 238
Water
Figure 36.5 Total Cost for the Treatment and Distribution/Transmission of Drinking Water per Megalitre of Drinking Water Treated
This measure reflects the combined total cost for the treatment, distribution and transmission of drinking water. It includes amortization which can vary significantly from year to year depending on the type of infrastructure, capital fund expenditures, etc. Municipalities providing service over a broad geographic area generally have higher operating costs due to the number and type of water treatment facilities and water pumping stations operated. The distance between the individual systems has an impact on the daily operating costs for the treatment, distribution and transmission of drinking water. Refer to Figure 36.1 for description of Integrate and Two-Tier systems.
2016 $868 $1,143 $1,276 $891 N/A $1,138 $424 $1,274 $1,494 $1,475 $674 $684 $1,149 $1,141 $485 $832 $974 $832
2017 $788 $1,271 $1,346 $958 N/A $1,246 $461 $1,266 $1,619 $1,543 $698 $764 $1,250 $1,248 $553 $857 $1,236 $857
2018 $783 $1,234 $1,313 $950 $1,125 $1,272 $453 $1,465 $1,499 $1,419 $726 $791 $1,115 $1,125 $506 $792 $1,122 $792
Source: WATR315T (Efficiency)
York: Costs are higher because of a high asset base and depreciation/amortization costs
$0.0
$0.2
$0.4
$0.6
$0.8
$1.0
$1.2
$1.4
$1.6
NIAG WAT YORK MEDIAN
Two-Tier Systems (In Thousands)
$0.0
$0.2
$0.4
$0.6
$0.8
$1.0
$1.2
$1.4
$1.6
CAL DUR HAL HAM HFX LON MTL REG SUD TBAY TOR WIND WINN MEDIAN
Integrated Systems (In Thousands)

2018 MBNCanada Performance Measurement Report 239
.

2018 MBNCanada Performance Measurement Report 240