2018 prime benchmarking report
TRANSCRIPT

2018 PRIME Benchmarking report
KPI & Benchmarking Subgroup PRIME
LEGAL NOTICE
This report has been financed by the European Commission however it reflects
the views only of the authors, and the Commission cannot be held responsible
for any use which may be made of the information contained therein.

Page: 2
Contents
Contents 2
Foreword by PRIME co-chairs 4
1 Introduction 6
2 PRIME KPI & benchmarking 10
3 Key influencing factors of participating infrastructure managers 17
4 Trends and developments 24
4.1 Overview of main rail industry characteristics and trends 24
4.1.1 Rail industry characteristics in the EU 25
4.1.2 Development and benchmark 26
4.2 Financial 37
4.2.1 Rail financing in the EU 38
4.2.2 Costs 40
4.2.3 Development and benchmark 40
4.2.4 Revenues 46
4.2.5 Development and benchmark 46
4.3 Safety 53
4.3.1 Rail safety in the EU 53
4.3.2 Development and benchmark 54
4.4 Environment 61
4.4.1 Ecological footprint in the EU 62
4.4.2 Development and benchmark 62
4.5 Performance and delivery 67
4.5.1 Rail performance and delivery in the EU 68

Page: 3
4.5.2 Punctuality 69
4.5.3 Reliability 79
4.5.4 Availability 85
4.6 ERTMS deployment 88
4.6.1 ERTMS deployment in the EU 88
4.6.2 ERTMS indicators 89
5 Outlook 91
6 Annex 93
6.1 Fact sheets of the infrastructure managers 93
6.2 PRIME KPI-definitions 102
6.3 Financial data 109
7 Glossary 110
Page: 4
Foreword by PRIME co-chairs
With the European Green Deal, the European Commission has set out to be-
come carbon neutral by 2050. To meet this challenge, rail will have to take up a
bigger share of the transport system. The recent COVID pandemic has shown
that rail is an essential backbone for supply chains and very resilient, making it
an even more attractive alternative to other modes. PRIME members work to
provide safe, reliable and efficient railway infrastructure for the transport of peo-
ple and goods.
The KPI subgroup was set up in 2014 with two main objectives: to monitor com-
mon trends at the EU level; and to benchmark performance and by doing so to
strive for better results. We are pleased that we can share with you the third
benchmarking report prepared by the PRIME KPI subgroup, covering the years
2012-2018. For the infrastructure managers, benchmarking helps to understand
where each organisation stands and where there is potential for improvement.
For the European Commission, there is an invaluable opportunity to identify best
practice and to monitor the progress with respect to EU policy priorities. For all
stakeholders, it is an opportunity to observe trends as they evolve, to identify
strengths and weaknesses of the system.
Compared to the first two reports, this edition includes a number of new indica-
tors, a more complete dataset and four new participants (in total 18). Five infra-
structure managers are in the transitional phase to join. Taking into account its
wider reach, this year’s report offers, for the first time, more detailed explanations
and contextual information to make the wealth of data more accessible.
We would like to thank the PRIME KPI subgroup chair Rui Coutinho from IP Por-
tugal - as well as the members of this group from 23 organisations, the Commis-
sion and the European Union Agency for Railways for this outstanding achieve-
ment.
PRIME members have jointly agreed on the key performance indicators that are
relevant for their business. The progress on common data definitions and KPIs
is documented in the catalogue, which is continuously refined and publicly avail-
able on the PRIME website. We will continue to work on making PRIME KPIs
more robust, comparable for benchmarking purposes and more complete, by
covering additional aspects.
We believe that PRIME data and definitions can serve the needs of a large range
of rail experts and policy makers. By measuring and sharing the results, we aim

Page: 5
to demonstrate to the wider public that the rail sector is committed to improving
its service provision.
Finally, we invite remaining PRIME members to join the benchmarking frame-
work so that our report can gradually offer a complete picture of infrastructure
management in the EU!
PRIME co-chairs
Elisabeth Werner European Commission, DG MOVE Director of Land Transport
Alain Quinet SNCF Réseau Deputy Director General

Page: 6
1 Introduction
Rail is one of the greenest, safest and most energy efficient transport modes.
Employing more than one million people in Europe1 and generating turnover of
over eight billion Euros2 per year, it connects millions of citizens across Europe
every day.
Transport is central to the European economy and daily life, and demand for it
continues to rise. Estimates suggest increases in European passenger and
freight transport by 42% and 60% by 2050 respectively. However, transport
generates around a quarter of all EU greenhouse gas emissions3 – which has
serious health and environmental consequences. As public awareness about
climate change increases, demand for sustainable forms of transport does too –
be it for cross-border travel, or for everyday commutes. Transporting more freight
by rail, instead of by road, is another essential element of making transport more
sustainable. Having an attractive rail system with sufficient capacity and
modernised infrastructure will be key to accelerating sustainable transport across
Europe. The COVID-19 pandemic has even increased the urgency of achieving
this goal. Under these circumstances, rail can ensure an adequate level of
services to respond to the essential needs of mobility.
Promoting rail as a green choice for transport and mobility
With the European Green Deal, the European Commission has set out to cut
CO2 emissions by at least 50% by 2030, and to achieve net-zero CO2 emissions
by 2050, which requires reducing the carbon footprint of the transport system by
90%. To meet this challenge, rail will have to take up a bigger share of the
transport system. Through its policies and legislation, the EU aims to make rail
more efficient, affordable and innovative. EU policies focus on aspects that are
crucial for developing a strong and competitive rail industry, and a green and
sustainable transport system overall:
1 European Commission (2019): Sixth report on monitoring development of the rail market.
(https://ec.europa.eu/transport/sites/transport/files/staff_working_document_-_6th_rmms_report.pdf.)
2 DG MOVE (2019): EU transport in figures. The values are estimated by DG MOVE including EU-28 countries: 24, 26
3 European Environment Agency (2019): Greenhouse gas emissions from transport in Europe. https://www.eea.europa.eu/data-and-maps/indicators/transport-emissions-of-greenhouse-gases/transport-emissions-of-greenhouse-gases-12
Page: 7
• Facilitating a strong and competitive rail sector.
Establishing a Single European Rail Area where railway companies can op-
erate in a single and competitive EU-wide market – in which the same rail
operator could offer services anywhere in Europe, without national borders –
will bring down costs, and make rail more attractive for passengers.
• Removing barriers to seamless rail transport.
EU legislation harmonises diverging safety, administrative and operational re-
quirements across the EU. That way, the same train is able to run on networks
all over Europe, following the same rules. The European Union Agency for
Railways (ERA) has a mandate to issue single safety certificates and vehicle
authorisations which are valid in multiple European countries.
• Developing a modern rail infrastructure network.
Capacity constraints and ageing infrastructure are hampering rail traffic. That
is why public and private investment in Europe’s infrastructure is needed both
in national operations and at cross-border links.
• Stimulating innovation.
Tackling challenges and opportunities such as rising transport demand and
digitalisation requires innovative solutions. The Shift2Rail Joint Undertaking is
a public-private partnership in the rail sector, providing a platform for EU re-
search and innovation.
Rail policy consequences for infrastructure managers
In order to fulfil its role in the European Green Deal as an attractive and perfor-
mant alternative to more polluting modes of transport, rail has to be safe, punc-
tual, reliable, affordable and inclusive and able to adapt to the changing needs
of passengers and industries.
This depends on the performance of both rail operators and infrastructure man-
agers. The latter are responsible for developing, maintaining and managing the
rail infrastructure.
• Safety is a top priority. Although safety risks cannot be completely eliminated,
safety levels can be significantly improved by good asset condition and
adopted safety policies. Investing in state-of-the-art technology (e.g. ERTMS),
rethinking networks, stations, level-crossings, training of track workers and
awareness-raising campaigns for the public are available tools for infrastruc-
ture managers.

Page: 8
• Providing good value for money is important, as infrastructure managers
are largely funded by the public and State budgets are constrained. This is
done, for example, by developing high asset management standards and bal-
ancing costs, risk and performance as a tool for investment decisions. Gov-
ernments have a part to play here too. In accordance with EU law4, Member
States have to ensure that the accounts of infrastructure managers are bal-
anced. Low levels of investment over an extended period of time can nega-
tively impact operational costs, safety and overall performance.
• Rail is already one of the most environmentally friendly and energy-efficient
transport modes. But environmental sustainability is not only about more
people using rail, but also about rail itself becoming greener. Rail is mostly
electrified, with 4 out of 5 trains running on electricity, and represents only
0.5% of CO2 emissions from all transport modes.5 Rail has the potential to
become completely carbon neutral well before the rest of the economy by
2050.
• Efficient and foresighted maintenance and construction increases reliability
and availability. Reducing the number of asset failures through proactive
maintenance reduces delays and cancellations. Conversely, tracks in bad
condition, and therefore subject to permanent or temporary speed limitations,
lead to longer travel times and in some cases lower utilisation, as the route
becomes unattractive.
• Ensuring the optimal use of rail infrastructure based on the needs of cus-
tomers is essential and can be promoted through adequate instruments such
as economic incentives and/or charging and performance schemes, in line
with EU law6. As capacity is limited, and new construction is very costly and
time intensive, getting maximum capacity out of the existing infrastructure net-
work is paramount. This depends on efficient capacity allocation and traffic
management, as well as on systems like the European Rail Traffic Manage-
ment System ERTMS, which allows for shorter head times between trains.
• Strong cooperation between all actors across borders is vital to enabling
smooth operation between countries, overcome fragmented national struc-
tures and create a truly open and interoperable railway market. It paves the
4 Directive 2012/34/EU of the European Parliament and of the Council of 21 November 2012
establishing a single European railway area. http://data.europa.eu/eli/dir/2012/34/oj 5 European Environment Agency (2019): Greenhouse gas emissions from transport in Europe.
https://www.eea.europa.eu/data-and-maps/indicators/transport-emissions-of-greenhouse-gases/transport-emissions-of-greenhouse-gases-12
6 Directive 2012/34/EU of the European Parliament and of the Council of 21 November 2012 establishing a single European railway area http://data.europa.eu/eli/dir/2012/34/oj

Page: 9
way for major international projects and services linking European cities and
citizens with each other. The Platform for Infrastructure Managers in Europe
(PRIME) is a central element of this cooperation.

Page: 10
2 PRIME KPI & benchmarking
Platform of Rail Infrastructure Managers in Europe (PRIME)
The Platform of Rail Infrastructure Managers in Europe (PRIME) was established
between the European Commission’s transport and mobility directorate general
(DG MOVE), and rail infrastructure managers in 2013. Its main objective is to
improve the cooperation between rail infrastructure managers across Europe.
Furthermore, the platform supports and facilitates the implementation of Euro-
pean rail policy and develops performance benchmarking for the exchange of
best practices.
The establishment of a network of rail infrastructure managers was one of the
actions proposed by the Fourth Railway Package.7 PRIME has grown
significantly since its inception, both in terms of membership and the scope of
activities. Alongside the European Commission and the European Union Agency
for Railways (ERA), PRIME now has 39 industry members including all main in-
frastructure managers of EU Member States and of the EFTA members Switzer-
land and Norway. Four industry associations of European rail infrastructure man-
agers participate as observers8. The participation of the main infrastructure man-
agers per country in PRIME is mandatory. Working groups have been set up to
address the major topics: safety, KPIs and benchmarking, digitalisation, charging
and financing.
KPI & Benchmarking Subgroup
A central idea behind PRIME is to give infrastructure managers, who are natural
monopolies, an opportunity to learn from each other. The performance bench-
marking currently covers several dimensions of rail infrastructure management:
punctuality, costs, resilience, sustainable development, safety. The core of the
benchmarking is the catalogue, which contains a clear and concise documenta-
tion of the PRIME key performance indicators (KPIs). The KPIs have been de-
veloped over a three-year period, in a consultative manner with all of the partici-
pant Infrastructure Managers and tested in 3 pilot exercises. The KPI & Bench-
marking Subgroup is open to development and continues to expand the scope
of the regular benchmarking study to adapt to the changing requirements and
7 Article 7f of Directive 2012/34/EU of the European Parliament and of the Council of 21
November 2012. http://data.europa.eu/eli/dir/2012/34/2019-01-01 8 PRIME members: https://webgate.ec.europa.eu/multisite/primeinfrastructure/about-
prime/members_en

Page: 11
interests of the infrastructure managers. The number of infrastructure managers
participating in the sub-group has steadily increased. The first pilot benchmarking
started in 2015 with 9 infrastructure managers collecting data predating to 2012.
In this year’s benchmarking, based on 2018 data, 23 infrastructure managers
have contributed to the report, of which 18 are involved in this external report
presented in the table below.
Infrastructure managers participating in the report
Infrastructure manager Abbreviation Country
Adif Adif Spain
Bane NOR Bane NOR Norway
Banedanmark BDK Denmark
DB Netz AG DB Germany
Finnish Transport
Infrastructure Agency FTIA Finland
HŽ Infrastruktura d.o.o. HŽI Croatia
Infraestruturas de Portugal
S.A. IP Portugal
Latvijas dzelzceļš LDZ Latvia
Lietuvos geležinkeliai LG Lithuania
LISEA LISEA France
Network Rail NR Great Britain
PKP PLK PKP PLK Poland
ProRail ProRail Netherlands
RFI RFI Italy
SBB SBB Switzerland

Page: 12
Infrastructure manager Abbreviation Country
SNCF Réseau SNCF R. France
Správa železnic, státní
organizace SŽCZ Czechia
Trafikverket TRV Sweden

Page: 13
Figure 1: Dimensions of the infrastructure managers participating in the report9
Purpose and empirical methodological approach of the report
The purpose of this report is to illustrate the current performance of infrastructure
managers, to identify areas for further analysis and to provide relevant data to
the railway industry and related sectors, politicians, researchers, economists and
other interested stakeholders. Above all, the general objective for the report is to
deliver insight and inspiration for better decisions on developing a sustainable
and competitive infrastructure management which provides high quality services.
9 EU-Data Source: RMMS Report 2018 (Data of 2016). PRIME-Data in the figure refers to all 18
participants of this report.
Page: 14
The current report has been produced based on 2012-2018 data accompanied
by assessment of data completeness and robustness of 41 selected indicators.
A significant improvement of the dataset has been achieved compared to the
PRIME Benchmarking Report published last year with 2017 data, especially in
terms of completeness.
The 18 infrastructure managers contributing their data to the present report
represent over 70% of the European railway network. The data provided passed
three quality checks including a check against data available from other sources,
including representatives of the Commission and rail experts. Furthermore, the
completeness of the indicators has improved over the years. At the beginning the
completeness for the most relevant indicators was only 38%. Today it is nearly
75%.
In this report, the key indicators will each be shown in a time series and a
benchmarking chart, presenting key trends and a cross-comparison of
infrastructure managers. The time series chart is complemented with the
compound annual growth rate (CAGR) to increase the visibility of the overall
development. To ensure clarity and comparability only complete time series or
time series with a maximum of one missing data point are shown. The same
applies for the CAGR.
The benchmarking charts show the latest available annual data and the average
of the available years for every individual infrastructure manager, plus the peer
group’s average weighted by denominator. The accuracy level of the data is
indicated in each case. In order to facilitate the interpretation of the figures and
the quantitative results, background information on the specific contexts of the
infrastructure managers and rail infrastructure is provided for each indicator.
Selected indicators and report structure
The indicators presented in this report are selected from the data pool of the
PRIME KPI & Benchmarking Subgroup. They aim to display a status quo along-
side the European objectives, covering the fields of finance, safety, environment,
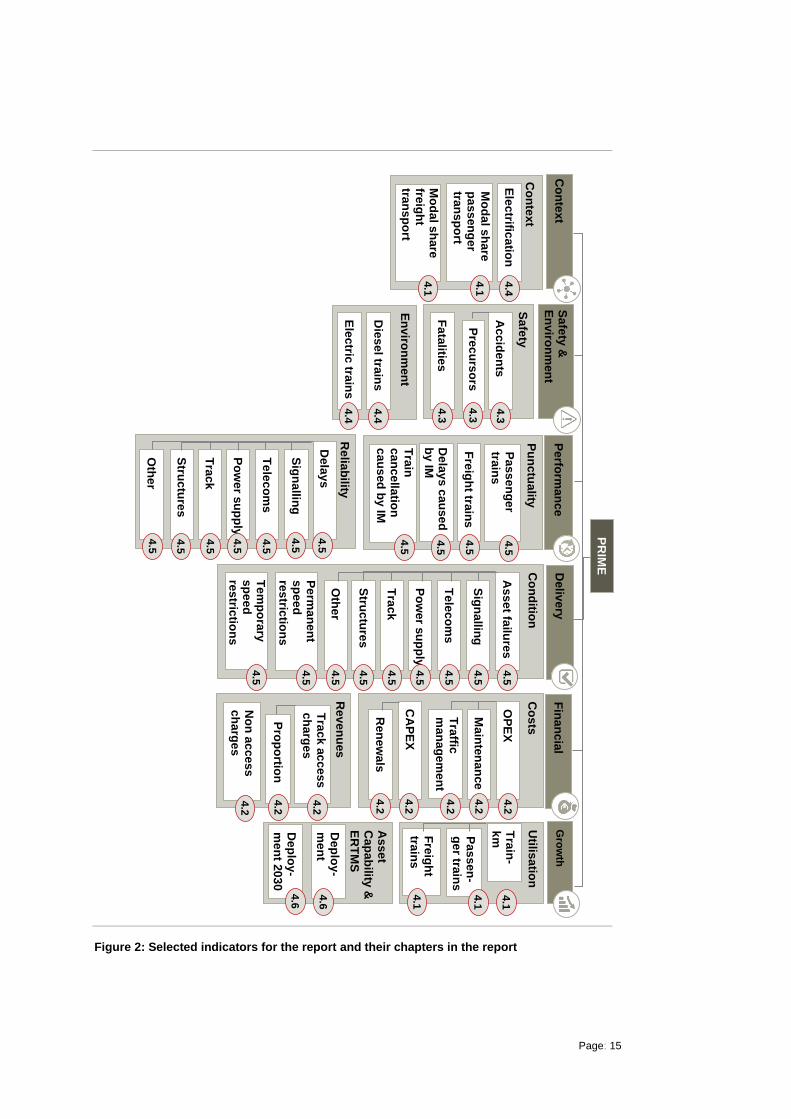
performance and delivery. Figure 2 shows these groups as well as the selected
indicators that are analysed in the report. The numbers beside the KPI point to
the chapter in which they are treated. When considering the following com-
parative presentations of the indicators it should be taken into account that
the data and indicators reflect very different situations, both in terms of the
infrastructure stock and in terms of use and investment.
Page: 15
Figure 2: Selected indicators for the report and their chapters in the report
En
viro
nm
en
t
Co
nte
xt
Ele
ctrific
atio
n
Mo
da
l sh
are
p
as
sen
ge
r tra
ns
po
rt
Mo
da
l sh
are
fre
igh
t tra
ns
po
rt
Sa
fety
Fa
talitie
s
Die
se
l train
s
Ele
ctric
train
s
Co
nd
ition
Ass
et fa
ilure
s
Sig
na
lling
Te
lec
om
s
Po
we
r su
pp
ly
Tra
ck
Stru
ctu
res
Oth
er
Pe
rma
ne
nt
sp
ee
d
res
trictio
ns
Te
mp
ora
ry
sp
ee
d
res
trictio
ns
Co
sts
OP
EX
Ma
inte
na
nce
Tra
ffic
ma
na
ge
me
nt
CA
PE
X
Ren
ew
als
Rev
en
ues
Utilis
atio
n
Tra
in-
km
Pa
ss
en
-g
er tra
ins
Fre
igh
t
train
s
As
se
t C
ap
ab
ility &
E
RT
MS
Dep
loy
-m
en
t to
da
y
De
plo
y-
me
nt 2
03
0
Co
nte
xt
Sa
fety
&
En
viro
nm
en
t D
eliv
ery
F
ina
nc
ial
Gro
wth
Pu
nc
tua
lity
P
as
se
ng
er
train
s
Fre
igh
t train
s
Dela
ys
ca
use
d
by
IM
Tra
in
ca
nc
ella
tion
c
au
sed
by
IM
Relia
bility
Dela
ys
Sig
na
lling
Te
lec
om
s
Po
we
r su
pp
ly
Tra
ck
Stru
ctu
res
Oth
er
Pe
rform
an
ce
No
n a
cce
ss
c
ha
rge
s
Tra
ck
ac
ce
ss
ch
arg
es
Pro
po
rtion
4.5
4.5
4.5
4.5
4.5
4.5
4.5
4.5
4.5
4.2
4.2
4.2
4.2
4.2
4.2
4.2
4.2
4.5
4.5
4.5
4.5
4.5
4.5
4.5
4.5
4.5
4.5
4.5
4.4
4.4
4.3
4.1
Ac
cid
en
ts
4.3
4.1
4.1
4.6
4.6
4.4
4.1
4.1
Pre
cu
rso
rs
4.3
PR
IME

Page: 16
Chapter 3 provides a general overview of the main factors influencing the infra-
structure managers' performance. The quantitative results can only be inter-
preted meaningfully if the main influencing factors are taken into account.
Without considering the different characteristics of the infrastructure man-
agers and their structural peculiarities, meaningful comparisons cannot be
achieved. Chapter 4 explains the indicators in detail and presents the infrastruc-
ture managers’ figures and results.

Page: 17
3 Key influencing factors of participating infrastructure managers
Operating context
Contextualising the indicators is essential for the correct interpretation of the val-
ues. Infrastructure managers are operating in different countries under different
geographic and political circumstances. Rail infrastructure is developed over
decades and such long-term infrastructure decisions determine the shape of the
network over a very long time. The selected focus of railway infrastructure invest-
ments also has long-term consequences. For example, a focus on increasing
capacity by expanding the network leads to different results than a focus on punc-
tuality and reliability. Other relevant factors include rules and regulation in oper-
ational and technical areas. The list is long and the circumstances are not the
same for two infrastructure managers.
Influencing factors can be grouped in the following seven categories, which are
illustrated below. Geographic, climate, socio-demographic, historical and politi-
cal, economic, technical factors and services provided by the infrastructure man-
ager. The impacts of these factors on the performance of infrastructure managers
are very different: some lead to increasing costs, some have an impact on punc-
tuality or safety.
Figure 3: Factors influencing the outcome of rail infrastructure

Page: 18
Geographic
The geography and topography of a country determines its rail network from the
moment of its construction, to its maintenance and renewals. The size of the
country, its population density and distribution, and the locations of its economic
and cultural centres are all influencing factors, above all for the length of the
network. The range of sizes of the countries included in this report lies between
41,000 and 633,000 km² for Switzerland and France respectively (overseas ter-
ritories included). The topography determines the shape and complexity of the
network: mountainous regions hinder long, straight lines and generally require
more sophisticated rail structures such as bridges and tunnels. The expansion of
the network is technically more complex and therefore entails higher investment
costs. Furthermore, maintenance costs are higher in mountainous regions as
wear and tear is more frequent and repairs are carried out under more difficult
conditions. Countries with highly complex topographical conditions include Swit-
zerland, Spain, Norway and Italy.
That higher complexity requires more expensive network investments is itself
compounded by the fact that higher complexity increases the possibility of asset
failures (due to that complexity). However, complexity is only one factor driving
asset failure rate: levels of operation and maintenance also have a significant
influence.
Rail infrastructure in regions of seismic activity is highly exposed to damage
caused by earthquakes and seismic waves. Landslides and floods have a similar
impact, causing damage running into billions of euros. The topographic condi-
tions are particularly challenging in Italy, where floods and landslides are rela-
tively common, and approximately 40% of its territory is under seismic risk.
Coastal rail networks are affected by an acceleration of rusting and a reduction
in electrical insulation performance caused by salty air. Accordingly, specific
higher maintenance costs are a consequence in countries where a large number
of tracks are built close to the coast.
Climatic
Conditions of climate are also important and influence specific results. In coun-
tries with very hard winters such as those in Scandinavian and the Baltic, very
low temperatures might cause broken rails, switch malfunction, and snowdrifts.
Besides normal latitude-related climate conditions, extreme weather events as a
result of climate change also have an impact on rail infrastructure. Increased

Page: 19
global temperature is leading to hotter and drier summers. High temperatures
cause buckling in railway tracks and increase the risk of forest fires. Sweden and
Norway especially were affected by extreme weather events in 2018.
In 2018 a number of very heavy storms damaged the rail infrastructure in several
European countries. Strong winds damage tall infrastructure (mileposts, signals),
and overturned trees cause delays, failures and speed restrictions10. In countries
such as Latvia and in the northern European coniferous forest region (Finland,
Sweden, Norway), such weather effects are naturally even more impactful.
Extreme weather events might also reduce safety performances: Accidents
caused by fallen trees as well as by heat and cold damaged asset failures are
likely consequences.
In addition to the effects of weather phenomena on reliability, asset failures and
accidents in infrastructure operation, weather-induced damage to infrastructure
naturally increases maintenance and renewal costs.
Socio-demographic
Population size, population density and population distribution within a country
shape rail infrastructure. In small countries with a high population density the rail
utilisation is consequently higher, allowing for higher economies of scale than in
sparsely populated areas.
The population density of a country might also vary between regions. The net-
work infrastructures of such countries then show parallels with both densely pop-
ulated and with sparsely populated other countries but without being fully com-
parable. Spain, for example, has a mix of densely populated metropolitan centres
and large areas that are sparsely populated. The same applies to the Scandina-
vian countries, with metropolitan centres in the south and sparsely populated
northern regions, especially in Norway. The Netherlands on the other hand has
a polycentric urban network.
Moreover, usage of rail infrastructure should not only be considered on a national
level. In transit countries such as Germany and Switzerland, for example, transit
also accounts for a considerable proportion of network usage. Six of the eleven
Rail Freight Corridors run through Germany. In Switzerland, transit traffic has
10 UIC, 2017: Rail Adapt - Adapting the railway for the future.

Page: 20
been a major support factor for a railway-friendly policy among the population
and politicians.
Urban density, journey characteristics, car ownership, and environmental aware-
ness of citizens are additional parameters that are influencing the share of rail in
the modal split – with consequences on funding and extension plans. All these
factors are very different among the infrastructure managers considered, which
also makes direct comparison difficult.
Influencing factors such as the awareness and demand for safety in a younger
or older society as well as the general social acceptance of (un)punctuality also
influence the railway policy of a country via expectations and voting behavior.
However different results of infrastructure managers cannot easily be explained
by socio-demographic and political factors.
Historical and political
Historical factors, such as the onset of industrialisation in any given country, and
the historical status and organisation of the railway also have an impact on to-
day’s infrastructure. A rail network might also reflect national characteristics: For
example France’s Paris-centric nature is projected on the spiderweb-like struc-
ture of the rail network in France, as it was designed during the mid-19th century.
The industrial structure of a country is another major factor influencing the share
of freight transport. Heavy industry with heavy and bulky transport goods such
as coal, sand, steel and wood also explains the high share of rail freight in today’s
Eastern European EU Member States. But again, there is no single influencing
factor for all infrastructure managers. Switzerland, for example, has almost no
heavy industry but shows a relatively high rail freight share. One explanation
could be the Swiss ban on night-time trucking, and its general rail-friendly
transport policy.
The historical, political and economic conditions of a country also contribute to
explain the modal split between rail and road transport.
As a consequence of many years of environmentally conscious government pol-
icy, a railway-friendly financing policy is usually expected to increase funds for
infrastructure managers. However, a dense and high-quality motorway network
also has a significant impact on the split between these two modes of transport.
E.g. Portugal, Spain, Croatia and also Germany have, inter alia, such road

Page: 21
networks. Finally, the overall economic importance of a country's automotive in-
dustry might be another possible influencing factor.
National railway infrastructure is to a large part State funded. Even though infra-
structure managers are independent entities, output parameters of rail infrastruc-
ture, like rail transport volumes, are partly politically influenced and investment
decisions heavily depend on the availability and regularity of State funding.
Services
The main services offered by railway undertakings on the infrastructure man-
ager’s networks are conventional passenger trains over different distances,
freight trains and high-speed connections. As explained, the service portfolio has
grown historically and is politically and socio-politically determined.
The services offered on an infrastructure manager’s network can have different
effects on performance. A high share of freight transport causes higher wear and
tear due to the weight of the freight and requires higher maintenance costs.
The nature of high-speed train services is not uniform among infrastructure man-
agers, differing significantly between countries. In Germany, for example, high
speed connections mostly run on the same routes as lower speed passenger
transport and even freight traffic. France, Spain and Italy have dedicated or par-
tially dedicated infrastructures. A manager whose network consists exclusively
of high-speed lines between metropolitan areas naturally has other OPEX and
CAPEX values and also has other punctuality and reliability values than an op-
erator of a mixed transport network.
Technological
The technical and technological level and state of development of railway net-
work infrastructures varies considerably throughout the EU. For example, the
networks in the newer EU Member States in Eastern Europe often still have a
relatively high proportion of single tracked lines (Croatia, Lithuania). Also Finland
shows a high portion of single tracked lines and due to its sparsely populated
area outside the capital region, this infrastructure is also economically rational.
Czechia for example has two gauges and four systems of electricity within one
network - a circumstance of increased complexity and a driver of transaction cost.
Modern technology helps railways to achieve higher safety performance, mini-
mize their impact on the environment and also become more cost efficient. It is

Page: 22
therefore in the interest of every infrastructure manager to be equipped with
state-of-the-art rail technologies. EU rail policy promotes the incorporation of
such technologies to contribute to the achievement of EU rail policy objectives,
including facilitating cross-border transport. The introduction of ERTMS is a
prominent example. Greater cost efficiency through investment in new technolo-
gies is achieved by eliminating specifically higher operating costs associated with
the overuse of worn, error-prone assets. In addition, newer technologies are as-
sociated with specifically lower resource consumption especially in energy and
personnel.
When comparing modernisation and roll-out of technological innovations, differ-
ent starting points and investment cycles have to be considered. Furthermore,
the effects that technological network investments might have on results in the
areas of safety, reliability, punctuality and OPEX can only be observed after-
wards. In the snapshot of the present report, such correlations of effects of tech-
nology investments and corresponding comparisons between managers are not
apparent. One good example for how modern technology can help to improve
the performance of rail are ATP systems. Automatic protection systems (ATP),
such as ERTMS, are continually supervising the speed of the train and its com-
pliance with the permitted speed, providing warning and automatic stop functions
at certain signals or situations. High ATP-coverage across the network can make
a positive contribution to the reduction of accidents and an improvement in over-
all safety. The EU aims to deploy ERTMS on the main corridors by 2030 to allow
trains to seamlessly operate across different networks using the same system,
and improve performance and safety (for example through wider coverage of
ATP).
Economic
Economic circumstances within a country are influencing the operation of infra-
structure managers both directly and indirectly. A country’s GDP, its economic
power and connectivity all have a positive impact on passenger and freight
transport demand11. The market structure and the combination of public funding,
track access charges and commercial funding of infrastructure determine the fi-
nancing pool available to infrastructure managers.
11 Passenger and freight transport demand in the EU: https://www.eea.europa.eu/data-and-
maps/indicators/passenger-and-freight-transport-demand/assessment-1

Page: 23
The precise combination in a given country typically reflects historical precedent,
the intensity with which the rail network is used, the legacy of asset management,
the need for new capacity and the user’s and the state’s willingness to pay.
The amount of available revenues for an infrastructure manager determines its
investment possibilities and maintenance performance. The status of the railway
in a country is partly reflected by the budget allocated for that railway. Also, the
time span for which funds are granted and approved is crucial. In Switzerland for
example rail projects are decided for several decades and are independent of
politically influenced budgets of a current government.
In the economic situation of an infrastructure manager, all other previously men-
tioned factors, namely geographic, climatic, socio-demographic, political, etc., ul-
timately merge together. The general economic situation of an infrastructure
manager or his country on its own cannot meaningfully explain differences in
individual performance indicators. A positive correlation between high GNP val-
ues, high revenues from track access charges and funding, with above-average
performance in terms of network size and usage, safety, environment, and per-
formance and delivery can of course be seen. However, such correlation is to be
expected and should be self-evident.

Page: 24
4 Trends and developments
The chapter “Trends and Developments” is the core of the report showing se-
lected indicators regarding finance, safety, environment, performance and deliv-
ery, and ERTMS deployment. It aims to give an overview of the development and
status quo of the performance of the infrastructure managers.
Before analysing the more specific indicators, however, it is important to under-
stand the major characteristics and trends of the rail industry in the participating
Member States. For this reason, we will briefly outline the development of the
modal share, network size and utilisation in Chapter 4.1 and work through the
different categories from Chapter 4.2 onwards.
4.1 Overview of main rail industry characteristics and trends
Summary of industry characteristics
EU-wide objectives
• In order to fulfil its role in driving decarbonisation, rail needs to be an at-
tractive alternative to more polluting modes of transport, both for passen-
gers and freight.
• The Fourth Railway Package aims to make cross-border traffic flows eas-
ier by harmonising operations and technologies and by reducing redun-
dant national rules.
• By 2030 the TEN-T core network should be completed.
Peer group’s performance
• The peer group’s network size remained almost unchanged between
2012 and 2018.
• The average annual growth rate of the peer group for modal share is
0.3% for passenger rail and -1.2% in freight rail.
• The individual modal share of rail of the peer group has a range between
0.9% and 17% in passengers and 5% and 74% in freight transport.
• The peer group’s average annual growth rate of utilisation is 0.2% for
passenger trains and -1% for freight trains.
• The degree of utilisation ranges between 7 and 74 passenger trains and
3 and 11 freight trains per main track-kilometre a day.

Page: 25
4.1.1 Rail industry characteristics in the EU
The modal share is one of the most relevant indicators of a country’s transporta-
tion and mobility. In order to increase the share of rail services in the transport
market infrastructure managers are working to develop a more competitive and
attractive rail service. Better utilisation of existing infrastructure as well as the
expansion of capacity of the European rail network are essential elements of
improvement.
Investing in rail network electrification is also in the forefront of future mobility
sustainability, as part of European Green Deal, leading the world in transport
carbon neutrality. Large infrastructure investments are mainly carried out on
TEN-T corridors, allocating almost two thirds of the Connecting Europe Facility’s
funds to projects in rail transport. The ERTMS deployment plan has been estab-
lished to replace legacy signalling systems on corridors, harmonizing the land-
scape of signalling and traffic management technology and generating additional
positive effects with regards to capacity, safety and cost efficiency.
Rail characteristics indicators:
PRIME members are reporting seven indicators on rail characteristics:
• National modal share of rail in passenger transport
• National modal share of rail in freight transport
• Total track-kilometres
• Total main track-kilometres
• Degree of network utilisation of passenger trains
• Degree of network utilisation of freight trains
• Degree of network utilisation of all trains
In order to increase comparability of these values across infrastructure manag-
ers, utilisation is measured in train-kilometres and tonne-kilometres per main
track-kilometre.

Page: 26
4.1.2 Development and benchmark
Modal share of rail transport
Figures 4 and 6 show the national trends in the modal share of rail in passenger
and freight transport on land in the Member States, based on data of the Euro-
pean Commission. Figures 5 and 7 present the benchmark between the infra-
structure managers. For passenger transport the modal share compares the
share of passenger cars, buses/coaches, aviation and railways. The modal share
of rail in freight transport shows the national rail tonne-kilometres compared to
total tonne-kilometres carried on road, inland waterways and rail freight.
Figure 4: National modal share of rail in passenger transport in 2012-2018 (% of passen-ger-km)12
Between 2012 and 2018 the peer group’s average in the modal share of passen-
ger rail transport remained relatively stable, showing only a slight annual increase
of 0.3%. Looking at the individual States the picture is more differentiated: in
Lithuania, Spain, France and Poland the share of rail increased by over 2% on
an annual average. In two thirds of the countries the development was positive.
12 Source: European Commission, Statistical Pocket book. Data is estimated (except FI and LV).
Only complete time series or time series with only one missing data point are shown. Missing data points were complemented by extrapolation. The CAGRs are then calculated on this basis for the period 2012-2018.

Page: 27
Data accuracy: No entry = Normal E = Estimate D = Deviating from definition P = Preliminary
Figure 5: National modal share of rail in passenger transport (% of passenger-km)13
Figure 5 shows the cross-comparison of the Member States. The range of modal
share of rail in passenger transport varies widely across the peer group. The
highest modal share can be found in Switzerland (17%), while it varies between
0.9% and 11.4% in the other countries.
The modal share in passenger transport in a country highly depends on a number
of geographic and socio-demographic factors as well as the network size, den-
sity, and utilisation. The main parameters effecting the mobility choice are travel
distances, availability and reliability, supply of alternative transportation means,
comfort and cost factors. Switzerland is a good example for having relatively
good conditions in most of them. As the country has a relatively small territory,
the travel distances are comparatively low. Due to the high network density and
utilisation, most of the cities can be reached in a relatively short time. Additionally,
its performance in punctuality and reliability is high and the travel comfort and
quality of service are among the best.
13 Source: European Commission, Statistical Pocket book. Data for FI and LV have not been
marked as “Estimate” in the data collection.
Page: 28
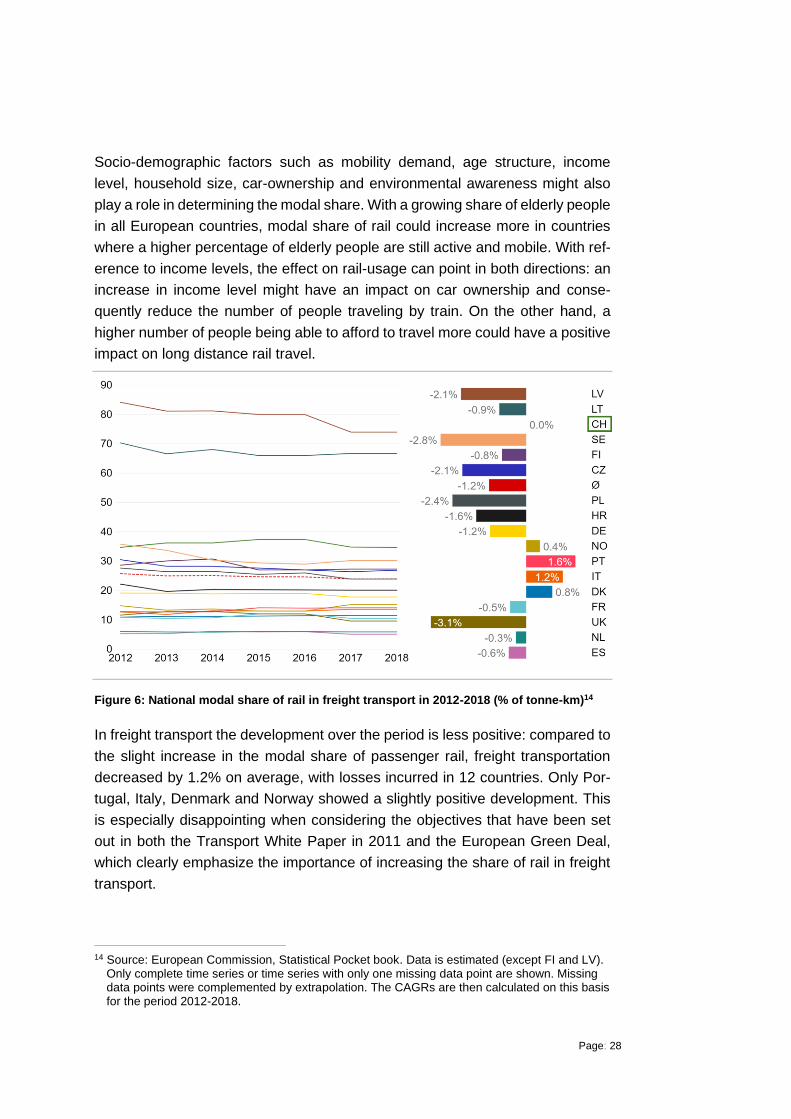
Socio-demographic factors such as mobility demand, age structure, income
level, household size, car-ownership and environmental awareness might also
play a role in determining the modal share. With a growing share of elderly people
in all European countries, modal share of rail could increase more in countries
where a higher percentage of elderly people are still active and mobile. With ref-
erence to income levels, the effect on rail-usage can point in both directions: an
increase in income level might have an impact on car ownership and conse-
quently reduce the number of people traveling by train. On the other hand, a
higher number of people being able to afford to travel more could have a positive
impact on long distance rail travel.
Figure 6: National modal share of rail in freight transport in 2012-2018 (% of tonne-km)14
In freight transport the development over the period is less positive: compared to
the slight increase in the modal share of passenger rail, freight transportation
decreased by 1.2% on average, with losses incurred in 12 countries. Only Por-
tugal, Italy, Denmark and Norway showed a slightly positive development. This
is especially disappointing when considering the objectives that have been set
out in both the Transport White Paper in 2011 and the European Green Deal,
which clearly emphasize the importance of increasing the share of rail in freight
transport.
14 Source: European Commission, Statistical Pocket book. Data is estimated (except FI and LV).
Only complete time series or time series with only one missing data point are shown. Missing data points were complemented by extrapolation. The CAGRs are then calculated on this basis for the period 2012-2018.

Page: 29
Data accuracy: No entry = Normal E = Estimate D = Deviating from definition P = Preliminary
Figure 7: National modal share of rail in freight transport (% of tonne-km)15
The bandwidth of individual results for freight is similar to passenger transport.
However, the pattern is clearer: the share of rail freight in the Baltic countries is
significantly higher than in the rest of the EU. In Latvia rail accounts for 74%, and
in Lithuania for 66.7% of the total freight transport. In other countries it varies
between 5% and 34.7%.
The high share of rail freight in the Baltic countries can be linked to the transport
of Russian energy products but might also have its roots in the history of these
countries.16 In the post-war period the extension of freight rail transport became
an important pillar of the industrialisation of Eastern European countries. Routes
between important industrial centres were extended, but many side tracks were
closed. Czechia and Poland are also among the countries with higher levels of
freight activity.
15 Source: European Commission, Statistical Pocket book.
Only complete time series or time series with only one missing data point are shown. Missing data points were complemented by extrapolation. The CAGRs are then calculated on this basis
for the period 2012-2018. 16 DG MOVE (2015): Study on the Cost and Contribution of the Rail Sector.

Page: 30
Macro-economic aspects, such as trade relations and the organisation of the lo-
gistics sector of a country, have an impact on the freight sector and therefore
also on rail freight traffic. Network density and transport corridors between eco-
nomic centres, as well as transhipment points such as ports and airports, are
equally important.
Network size
Figures 8 and 10 show the development of the rail network of the infrastructure
managers measured in total track-kilometres and total main track-kilometres.
Figure 10 presents the benchmark of these two indicators and the total main line
kilometres to give a better overview of the network size operated.
Figure 8: Total track km in 2012-2018 (Total track-km)17
17 Only complete time series or time series with only one missing data point are shown. Missing
data points were complemented by extrapolation. The CAGRs are then calculated on this basis for the period 2012-2018.

Page: 31
Figure 9: Total main track-km in 2012-2018 (Total main track-km)18
Rail infrastructure consists of long-lasting assets, with lifetimes often reaching
several decades. Hence, the analysis over a period of seven years can only be
of limited value. However, slight annual average increases in total main track
kilometres can be observed at ProRail and SBB.
18 Only complete time series or time series with only one missing data point are shown. Missing
data points were complemented by extrapolation. The CAGRs are then calculated on this basis for the period 2012-2018.

Page: 32
Figure 10: Total main line-km, Total main track-km and Total track-km19
Regarding total track-kilometres SNCF R. and DB are managing the largest net-
works with more than 60,000 kilometres of track. The smallest networks consid-
ering track size are operated by LISEA, LG, LDZ and HŽI. The length of railway
lines operated and used for running trains is also the highest for DB and SNCF
R. It is important to note that these figures do not represent the entire national
railway network but only the part that is managed by the peer group’s infrastruc-
ture manager.
As illustrated, rail networks mostly remained unchanged over the years. They
have slowly been extended over decades and were shaped by geographic con-
ditions and the evolution of regions and cities. It is not surprising that the size of
a network is strongly correlated with the size of the country and its population.
However, the distribution of the population is an important aspect too, as it might
lead to a concentration of significant parts of the network in a few urban areas or
along corridors.
Current network extension programs are highly dependent on the status of rail
within the country, funding agreements and budgets available. These factors in
turn are closely linked to a country’s economic power.
19 Data of 2016 (NR)

Page: 33
Eligibility for EU-funds is another important factor, especially with regards to the
extension of high-speed lines, as EU cohesion policy-related financing is one of
the major sources of rail funding. Nearly all network extensions were fully-fi-
nanced or at least co-financed by the EU in Eastern and Central European coun-
tries and Portugal.
Network utilisation
Figures 11 and 13 show the development of the degree of network utilisation by
passenger and freight trains. Figures 12 and 14 present the benchmark of these
indicators between the infrastructure managers and are supplemented by figure
15, showing the utilisation of both passenger and freight trains.
Figure 11: Degree of network utilisation – passenger trains in 2012-2018 (Daily passenger train-km per main track-km)20
Regarding passenger train utilisation, a marginal annual growth rate of 0.2% can
be seen across all networks. The individual growth rates range between -2.6%
and +3.7% per year, with TRV showing the highest increase in passenger train
activity on its network.
20 Only complete time series or time series with only one missing data point are shown. Missing
data points were complemented by extrapolation. The CAGRs are then calculated on this basis for the period 2012-2018.

Page: 34
Data accuracy: No entry = Normal E = Estimate D = Deviating from definition P = Preliminary
1) Data of 2016
Figure 12: Degree of network utilisation – passenger trains (Daily passenger train-km per main track-km)
Figure 12 shows the individual degrees of network utilisation by passenger trains.
The intensity of network use ranges from 7 to 74 trains a day. ProRail’s and
SBB’s networks are utilised more than twice the average. LG and LDZ are show-
ing the lowest degrees of utilisation regarding passenger trains.
It is visible that – with the exception of DB – passenger train utilisation is higher
in smaller countries with high population density and a wider rail network, e.g.
The Netherlands, Switzerland and Denmark. Similarly to the parameters influ-
encing the share of passenger rail in a country’s modal share, utilisation is driven
by the prosperity of a country and its citizens, and the status of the rail sector in
a country. Utilisation is particularly important for infrastructure managers when it
comes to finance. It is decisive both for revenues and expenditures as public
funding decisions are largely based on train activity, while on the other hand wear
and tear is accelerated by more intensive use.

Page: 35
Figure 13: Degree of network utilisation – freight trains in 2012-2018 (Daily freight train-km per main track-km)21
The volatility of the degree of network utilisation with reference to freight trains is
slightly higher than for passenger trains. The average annual growth rate across
all networks is -1%. Almost half of the peer group faces a declining trend, which
is most significant for LDZ and SNCF R. ProRail increased the degree of utilisa-
tion of freight trains by an annual average of 6.9%.
21 Only complete time series or time series with only one missing data point are shown. Missing
data points were complemented by extrapolation. The CAGRs are then calculated on this basis for the period 2012-2018.

Page: 36
Data accuracy: No entry = Normal E = Estimate D = Deviating from definition P = Preliminary
1) Data of 2016
Figure 14: Degree of network utilisation – freight trains (Daily freight train-km per main track-km)
The degree of freight train utilisation also reflects the results seen in the modal
share for freight transport in the Baltic countries. With more than 11 freight trains
per day running on each km of main track of LDZ’s and LG’s network, the inten-
sity of use in the two Baltic networks is among the highest in the peer group. With
reference to non-freight train activity LISEA is a special case, as its network is
100% high-speed.
Similarly to the modal share in freight transport, the degree of utilisation by freight
trains highly depends on economic circumstances, more precisely the conditions
for logistics within a country. Connectivity between trans-shipment centres such
as airport and ports is just as decisive as smooth interconnections with other
transport modes. Punctuality and plannability are decisive factors for freight cli-
ents. Improving performance in freight train punctuality might also increase the
willingness of companies to shift their goods to rail.

Page: 37
Figure 15: Degree of network utilisation –all trains (Daily train-km per main track-km)
Figure 15 illustrates the network utilisation of both passenger and freight trains.
As utilisation itself has an impact on a range of other indicators it is important to
analyse it as a whole: on average each of the peer group's railway tracks is fre-
quented by 38 passenger and freight trains per day. The individual railway tracks
are frequented between 19 to 83 times per day. When talking about the impact
of utilisation in the following chapters, this concerns the utilisation of all trains.
4.2 Financial
Summary of finance
EU-wide objectives
• Railway infrastructure requires substantial amounts of funding to cover
capital and operating expenditures. Providing value for money is para-
mount as funding is constrained, and infrastructure managers are con-
stantly improving their asset management activities to achieve this objec-
tive.

Page: 38
EU-wide objectives
• The European infrastructure managers apply different financing and fund-
ing structures and rely on combinations of public funding, access charges
and commercial revenues.
• EU legislation aims at increasing the transparency of funding arrange-
ments and developing appropriate incentives to ensure the best available
use of existing assets and capacity.
Peer group’s performance
• Operational expenditures remain relatively stable over the years, showing
a slight annual increase of 0.9%.
• The level of operational expenditures varies between €40,000 - 217,000
per main track-kilometre per year.
• Capital expenditures show higher fluctuation. The individual compound
average growth rates of the infrastructure managers range from -24% to
13%.
• The range of capital expenditures varies between €15,000 - 237,000 per
main track-kilometre per year.
• The share of track access charges in total revenues from charges is on a
fairly constant level. The average annual share oscillates between 70%
and 73% in 2012-2018.
4.2.1 Rail financing in the EU
Rail infrastructure requires a substantial amount of funding which is dedicated to
building new infrastructure, replacing existing assets as well as maintaining and
operating the asset base. Infrastructure managers are largely funded by public
and state budgets which are constrained. Hence, providing good value for soci-
ety is one of the most important objectives, requiring a constant balancing of
costs, risks and performance. Infrastructure managers undertake a wide range
of activities to ensure that funds available are spent in an appropriate way, in-
cluding optimal decision making on where and when to spend budgets, state-of-
the-art maintenance processes, digitalisation and the introduction of new tech-
nology.
Page: 39
In addition to funding provided by public sources, infrastructure managers gen-
erate revenues through track access charges and charges for other related ser-
vices, paid by the railway undertakings. Apart from covering direct costs, infra-
structure managers apply these charges to incentivise users to achieve the best
utilisation of the network. As capacity is limited and investments into new infra-
structure are costly, getting maximum capacity out of the existing infrastructure
is paramount.
Successive packages of EU rail legislation have substantially increased the
transparency of funding arrangements for European Rail infrastructure manag-
ers. Directive 2012/34/EU establishing a single European railway area22 restates
the need for rail undertakings and infrastructure managers to maintain separate
accounts, and also requires that, under normal business conditions and over a
period not exceeding five years, infrastructure manager income from different
sources (including access charges and state funding) balances expenditure. It
also sets out a framework for determining charges, establishing the principle that
the charges paid to operate a train service must cover the direct cost incurred as
a result of such operation while allowing for additional mark-ups and charges to
recover fixed costs and address externalities.
However, the legal framework provides for considerable flexibility in the way in
which the costs of infrastructure management are recovered. Subject to the re-
quirement to set charges at least equal to the direct, or variable, costs of accom-
modating train services, infrastructure managers are free to defray the overall
costs of the network through additional mark-ups, State funding, other commer-
cial revenues or a combination of these.
Rail financing indicators
PRIME members report seven indicators measuring railway financing:
• Operational expenditures
• Capital expenditures
• Maintenance expenditures
• Renewal expenditures
• Track access charges
22 Directive 2012/34/EU of the European Parliament and of the Council of 21 November 2012
establishing a single European railway area Text with EEA relevance. http://data.europa.eu/eli/dir/2012/34/oj

Page: 40
• Non-access charges
• Proportion of TAC in total revenue
In order to increase comparability of these values among infrastructure manag-
ers, the expenditure-figures are related to main track-kilometres, and the reve-
nues from track access charges to the monetary value.
4.2.2 Costs
The costs category includes relevant costs incurred by the infrastructure man-
ager, broken down into useful and comparable sub-categories. It includes all op-
erating, capital and investment costs. For purposes of comparison, costs are ad-
justed to reflect local costs using purchasing power parities (PPPs). The costs
incurred by an infrastructure manager are dependent on a number of factors:
some lie within and some outside the responsibility of an infrastructure manager.
4.2.3 Development and benchmark
Figures 16 to 20 show the operational and capital expenditures of the PRIME
members over the time period 2012-2018 and the latest benchmark of these in-
dicators between the infrastructure managers.

Page: 41
Operational expenditure
1) Results are normalised for purchasing power parity.
Figure 16: Operational expenditures in relation to network size in 2012-2018 (1,000 Euro per main track-km)23
According to the PRIME KPI & Benchmarking subgroup definition, operating ex-
penditures are incurred through a business’s normal operations. Operating ex-
penditures include inter alia maintenance costs, traffic management, rent, equip-
ment, inventory costs, payroll, insurance and funds allocated toward research
and development. LDZ values for OPEX deviate from definition as they include
expenditures in stations, signalling and industrial buildings as well. As can be
seen in figure 16, the average expenditure across the peer group remained rel-
atively stable over the period, showing only a slight increase in 2018. However,
some infrastructure managers like SNCF R., Bane NOR, PKP PLK, and SBB
experienced more or less constant annual increases. In contrast, Adif’s and Pro-
Rail’s operational expenditures decreased over the period.
23 Results are normalised for purchasing power parity.
Only complete time series or time series with only one missing data point are shown. Missing data points were complemented by extrapolation. The CAGRs are then calculated on this basis for the period 2012-2018.

Page: 42
1) Results are normalised for purchasing power parity.
2) Traffic Management not available, therefore included in residual OPEX. 3) Disaggregation not available (LDZ, PKP PLK). Deviating from definition (LDZ).
Figure 17: Composition of operational expenditure in relation to network size (1,000 Euro per main track-km)
Figure 17 shows the composition and the level of operational expenditures in
2018. The level of operational expenditures varies between €40,000 – €217,000
per main track-kilometre per year. SBB spent more than twice the amount com-
pared to the peer group average, but this is due to the high residual OPEX which
is generated by activities related to other income, i.e. providing goods and ser-
vices to other infrastructure managers in Switzerland (See fig. 26 as counterpart:
total revenues from non-access charges.). LDZ values for OPEX deviate from
definition as they include expenditures in stations, signalling and industrial build-
ings as well. On average, infrastructure managers’ annual operational expendi-
tures amount to €91,000 per main track-kilometre.
Operational costs are driven by a range of different factors. The size and com-
plexity of the networks are just as relevant as train utilisation. For example, a
network with a relatively large number of switches and a high degree of electrifi-
cation and level crossings is more prone to failures and requires more interven-
tions. Tunnels and bridges must not only be checked more regularly, but also
Page: 43
entail more costly and sophisticated replacements and repairs. Busy tracks are
subject to higher wear and tear. Condition and age of the assets are also rele-
vant: investments that have been made in the past pay off and reduce operational
costs later. Besides maintenance, operational expenditures also include func-
tions of traffic management. The services provided by the infrastructure manager
vary significantly, too. Different technologies, degrees of centralisation and the
amount of human resources needed determine the level of expenditures.
Capital expenditures
Data accuracy: No entry = Normal E = Estimate D = Deviating from definition P = Preliminary
1) Results are normalised for purchasing power parity.
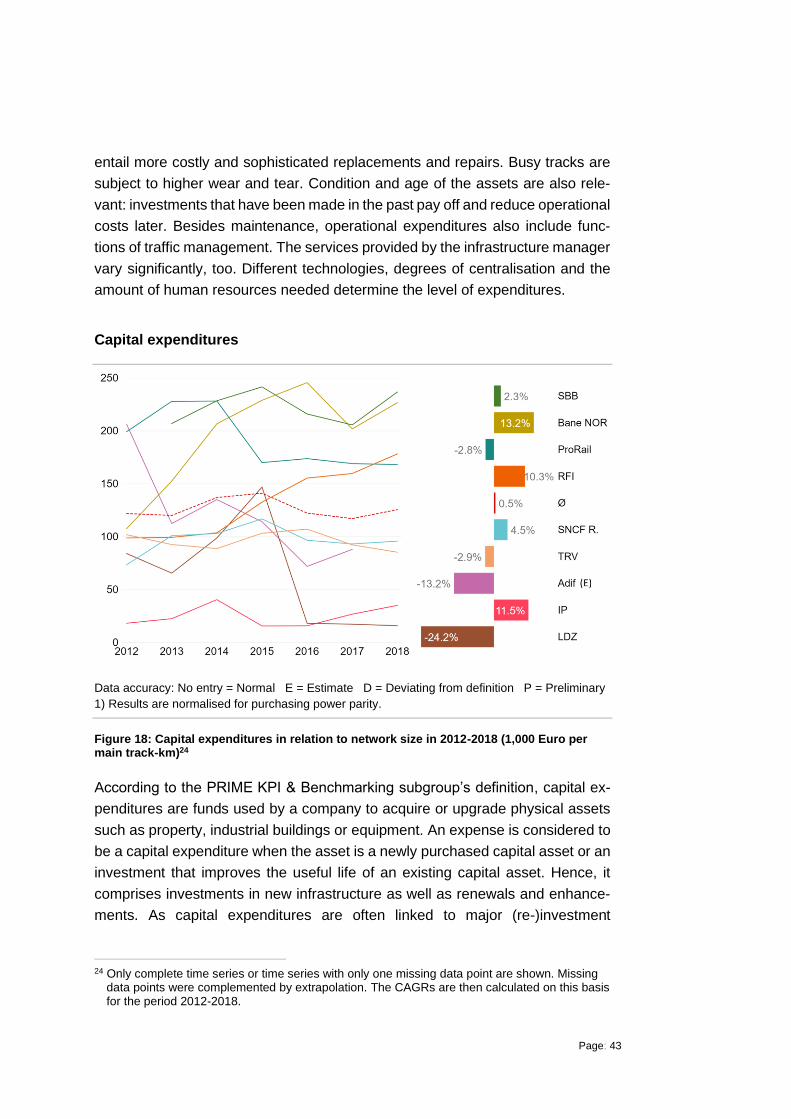
Figure 18: Capital expenditures in relation to network size in 2012-2018 (1,000 Euro per main track-km)24
According to the PRIME KPI & Benchmarking subgroup’s definition, capital ex-
penditures are funds used by a company to acquire or upgrade physical assets
such as property, industrial buildings or equipment. An expense is considered to
be a capital expenditure when the asset is a newly purchased capital asset or an
investment that improves the useful life of an existing capital asset. Hence, it
comprises investments in new infrastructure as well as renewals and enhance-
ments. As capital expenditures are often linked to major (re-)investment
24 Only complete time series or time series with only one missing data point are shown. Missing
data points were complemented by extrapolation. The CAGRs are then calculated on this basis for the period 2012-2018.
Page: 44
programs it is not surprising that expenditure levels fluctuate over time. The indi-
vidual annual growth rates of the infrastructure managers range from -24.2% to
13.2%. The highest increase in investment related expenditure has been rec-
orded at Bane NOR, IP and RFI, with Bane NOR spending almost twice as much
in 2018 as in 2012. However, the peer group’s annual average growth rate is
rather low at 0.5%.
Data accuracy: No entry = Normal E = Estimate D = Deviating from definition P = Preliminary 1) Results are normalised for purchasing power parity.
2) Data of 2017 (Adif) 2016 (NR).
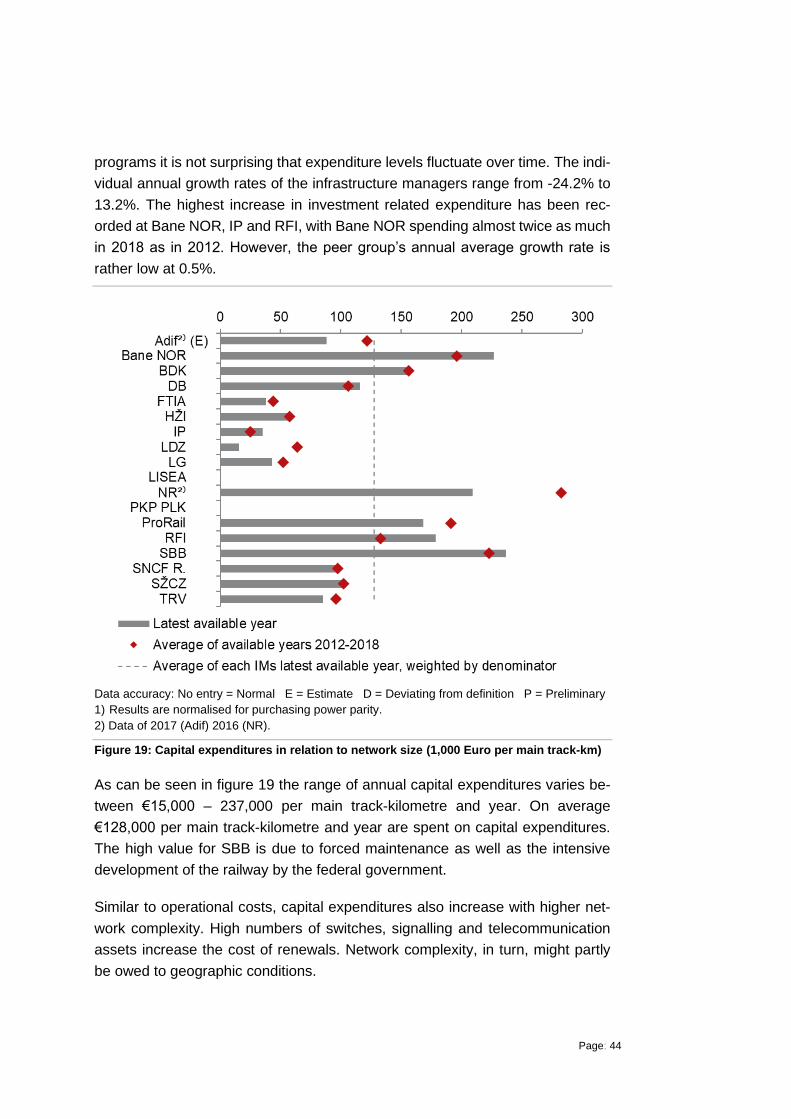
Figure 19: Capital expenditures in relation to network size (1,000 Euro per main track-km)
As can be seen in figure 19 the range of annual capital expenditures varies be-
tween €15,000 – 237,000 per main track-kilometre and year. On average
€128,000 per main track-kilometre and year are spent on capital expenditures.
The high value for SBB is due to forced maintenance as well as the intensive
development of the railway by the federal government.
Similar to operational costs, capital expenditures also increase with higher net-
work complexity. High numbers of switches, signalling and telecommunication
assets increase the cost of renewals. Network complexity, in turn, might partly
be owed to geographic conditions.

Page: 45
The level of capital expenditures is highly dependent on the budget and funding
agreements between infrastructure managers and national governments. In par-
ticular, renewals of rail infrastructure require long term planning, reflecting the
long-lived nature of the assets and the need for a whole-life approach to asset
management. Longer funding settlements provide more stability regarding fi-
nance issues, and enable larger investments projects. In terms of public funding
the eligibility for the EU Cohesion Fund is particularly important for Central and
Eastern European countries, as EU cohesion policy-related financing is one of
the major sources of funding, especially modernisation projects such as ERTMS,
railway electrification etc. The condition and age of the asset also influences the
need for renewals and asset improvement. The supplier market, prices and re-
sources determine the level of activities achievable with the budgets provided.
Maintenance and renewals
1) Results are normalised for purchasing power parity.
2) Renewal not available 3) Maintenance not available
Figure 20: Maintenance (component of OPEX) and renewal expenditures (component of CAPEX) in relation to network size (1,000 Euro per main track-km)

Page: 46
Figure 20 aims to provide a snapshot of current maintenance and renewal ex-
penditures. Maintenance expenditures are dedicated to the infrastructure man-
ager’s activities needed to maintain the condition and capability of the existing
infrastructure or to optimise asset lifetimes. Renewals represent capital expend-
itures needed to replace existing infrastructure with new assets of the same or
similar type. On average infrastructure managers spend €100,000 per main
track-kilometre per year. Only four infrastructure managers are significantly
spending more than average, namely SBB, ProRail, NR and SNCF R.
Similar to operational and capital expenditures, maintenance and renewal costs
are driven by the following factors: network complexity/asset densities (e.g.
switches, bridges, tunnels…), network utilisation and the condition of assets.
4.2.4 Revenues
This category provides an overview of track access charges which are paid by
railway undertakings using the railway network and its service facilities. Further-
more, it measures and compares non-track access related revenues ‘earned’ by
an infrastructure manager, excluding subsidies and property development.
To achieve meaningful comparability, the indicators for charging have been sim-
plified, and PRIME is using fundamental KPIs that all infrastructure managers
find common and easy to collect. Together with cost related indicators, they pro-
vide an indication to what extent infrastructure managers are capable of covering
their costs, respective to what extent they rely on subsides.
4.2.5 Development and benchmark
Figures 21 and 23 show the development of the revenue indicators of the PRIME
members over the time period 2012-2018, and the latest benchmark between the
infrastructure managers is shown in figures 22 and 24.

Page: 47
TAC - Track access charges
Data accuracy: No entry = Normal E = Estimate D = Deviating from definition P = Preliminary
Figure 21: Proportion of TAC in total revenue in 2012-2018 (% of monetary value)25
The share of track access charges in total revenues from charges is on a fairly
constant level. The average annual share oscillates between 70% and 73%. The
individual proportion of TAC in total revenues changed annually between -5.1%
and +11.0% in the period. Total revenues exclude grants and subsidies.
25 Only complete time series or time series with only one missing data point are shown. Missing
data points were complemented by extrapolation. The CAGRs are then calculated on this basis for the period 2012-2018.

Page: 48
Data accuracy: No entry = Normal E = Estimate D = Deviating from definition P = Preliminary 1) Data of 2017 (Adif) 2016 (FTIA)
Figure 22: Proportion of TAC in total revenue (% of monetary value)
At seven infrastructure managers the share of track access charges of total rev-
enues is above 80%. The peer group’s average is 73%, however for Bane NOR
and SŽCZ the relevant share is only 21% and 12%.

Page: 49
Figure 23: TAC revenue in relation to network size in 2012-2018 (1,000 Euro per main track-km)26
Figure 23 illustrates the revenues per track-kilometre generated by infrastructure
managers to cover the cost of the network. Between 2012 and 2018 the majority
of the peer group members increased their TAC revenues. The average income
of the peer group from TAC was €35,800 per main track-kilometre in 2012 and
€43,100 in 2018, representing an annual rise of 3.2%. The highest increase can
be seen at Adif (21.7%), however this development is the result of a change of
the TAC system in 2017.
26 Only complete time series or time series with only one missing data point are shown. Missing
data points were complemented by extrapolation. The CAGRs are then calculated on this basis for the period 2012-2018.

Page: 50
Data accuracy: No entry = Normal E = Estimate D = Deviating from definition P = Preliminary
1) Results are normalised for purchasing power parity.
Figure 24: TAC revenue in relation to network size in 2012-2018 (1,000 Euro per main track-km)
The range of TAC revenues across the peer group varies between €5,000 –
€320,000 per main track-kilometre per year. The average is €64,000 per main
track-kilometre. LDZ and LG show the highest values, generating almost twice
the amount of revenues compared to the group’s average.

Page: 51
Non-access charges
1) Results are normalised for purchasing power parity.
Figure 25: Total revenues from non-access charges in relation to network size in 2012-2018 (1,000 Euro per main track-km) 27
Revenues from non-access charges may include revenues from service facilities
and other services for operators, commercial letting, advertising, and telecom-
munication services, but exclude grants and subsidies. The growing importance
of third-party financing in the transportation sector is also reflected by the devel-
opment of the PRIME members. Although the peer group’s average remained
relatively stable over the period, the individual growth rates were high. Except for
SBB all the infrastructure managers exhibit a positive trend: PKP PLK, Bane
NOR, SNCF R. and TRV realised annual growth rates of over 10%.
27 Results are normalised for purchasing power parity.
Only complete time series or time series with only one missing data point are shown. Missing data points were complemented by extrapolation. The CAGRs are then calculated on this basis for the period 2012-2018.

Page: 52
Data accuracy: No entry = Normal E = Estimate D = Deviating from definition P = Preliminary
1) Results are normalised for purchasing power parity.
Figure 26: Total revenues from non-access charges in relation to network size (1,000 Euro per main track-km)
As seen in figure 25, the trend of non-access charges is positive, however, the
annual level of revenues is relatively low. The annual peer group’s average is
€14,000 per main track-kilometre. The €80,000 generated by SBB are far above
the average and stem from providing goods (e.g. traction current, switches) and
services (e.g. use of IT tools, project management) to other infrastructure man-
agers in Switzerland (See fig. 17 for the comparatively high financial importance
of activities related to residual OPEX.).
The figures above demonstrate the different levels of revenues generated by in-
frastructure managers based on track access-related and non-track access-re-
lated sources. One of the main reasons is the difference in combining public
funding, access charging and commercial funding. The precise combination in a
given country typically reflects historical precedent, the intensity with which the
rail network is used, the legacy of asset management (which determines the ex-
tent to which maintenance and renewal costs can be forecast with confidence),
the need for new capacity (which can prompt a search for alternative forms of
funding) and the willingness of users to pay.

Page: 53
4.3 Safety
Summary on safety
EU-wide objectives
• Safety is a top priority for every infrastructure manager and all infrastruc-
ture managers aim at providing safe railway transport.
• The objective of the EU is to maintain and further develop the high stand-
ards of rail safety and to harmonise safety requirements EU-wide.
Peer group’s performance
• The peer group average of significant accidents and persons seriously in-
jured and killed per train-kilometre remained stable between 2012 and
2018.
• On average there have been 0.5 significant accidents and 0.5 people se-
riously injured and killed per million train-kilometres each year.
• Infrastructure manager related precursors to accidents varied between
2.5 and 2.9 per million train-kilometres between 2012-2018 on the peer
group’s average.
4.3.1 Rail safety in the EU
In multi-modal comparison railway appears as the safest mode of land transpor-
tation and is particularly outstanding in the EU, being among the safest in the
world.
For infrastructure managers safety is of outstanding importance and is manda-
tory in any framework of key performance indicators. It is the most important el-
ement in the performance of an infrastructure manager, and affects customers,
stakeholders, the reputation of the infrastructure manager, the railway and soci-
ety at large. Infrastructure managers constantly invest in their assets and new
technology to provide good safety levels, and they develop their safety policies
to achieve maximum awareness.
In order to maintain and continuously improve railway safety EU-wide, the Euro-
pean Union has developed a legal framework for a harmonized approach to rail

Page: 54
safety. The European legislation lays down the requirements for placing rail prod-
ucts on the market and the conditions for a single safety certificate for railway
undertakings operating on the Union network. Common Safety Methods (CSMs)
and Common Safety Targets (CSTs) have been introduced to maintain rail safety
at a high-level - and where reasonably practicable, improve rail safety. CSMs
ensure common rules for managing and monitoring rail safety. Achievement of
CSTs is monitored by Common Safety Indicators (CSIs). EU Member States are
obliged to set up National Safety Authorities (NSAs) and independent accident
investigation bodies. Since 16 June 2019, the EU Railway Agency has become
the authorization and certification entity for vehicles and railway undertakings,
working in cooperation with NSAs as regards the remaining national specifici-
ties.28
Rail safety indicators
PRIME members are reporting three indicators measuring railway safety perfor-
mance:
• Significant accidents
• Persons seriously injured and killed
• Infrastructure manager related precursors to accidents
In order to increase comparability of these values among infrastructure manag-
ers, these values are related to million train-kilometres.
4.3.2 Development and benchmark
Figures 27 to 32 show the safety performance of the PRIME members over the
time period 2012-2018 and the benchmark of these indicators.
28 EC (2004): Directive 2004/49/EC — Safety on the EU’s railways

Page: 55
Figure 27: Significant accidents on infrastructure manager’s network in 2012-2018 (Num-ber per million train-km)29
As shown in figure 27 on average 0.5 significant accidents have been recorded
per million train-kilometres each year. Both the overall trend and individual de-
velopments over time are very stable. Only a few infrastructure managers like IP,
LDZ and PKP PLK have fluctuating values. PKP PLK shows a relatively positive
trend, cutting the number of accidents from 1.6 to 1 accident per million train-
kilometres. Bane NOR’s CAGR was affected by extreme weather in 2018.
29 Only complete time series or time series with only one missing data point are shown. Missing
data points were complemented by extrapolation. The CAGRs are then calculated on this basis for the period 2012-2018.

Page: 56
Data accuracy: No entry = Normal E = Estimate D = Deviating from definition P = Preliminary
1) Data of 2017
Figure 28: Significant accidents in 2012-2018 (Number per million train-km)30
The KPI values vary notably between the infrastructure managers, some show-
ing significant accident numbers of below 0.2 per million train-kilometres while
others reach more than 2 per million train-kilometres. Both in recent years and
on average over available years, NR and SBB operate their railways at the lowest
accident levels.
30 DB is deviating from the definition as the value refers to all infrastructure managers in
Germany.

Page: 57
Figure 29: Persons seriously injured and killed in 2012-2018 (Number per million train-km)31
The number of persons seriously injured and killed was 0.6 per million train-kilo-
metres among the infrastructure managers in 2012 and decreased to 0.4 in 2018
(figure 29). This positive development is mainly due to the reduction of accidents
by IP and PKP PLK (annually 7.4% and 10.3%). The average includes a total of
12 infrastructure managers.
31 Only complete time series or time series with only one missing data point are shown. Missing
data points were complemented by extrapolation. The CAGRs are then calculated on this basis for the period 2012-2018.

Page: 58
Data accuracy: No entry = Normal E = Estimate D = Deviating from definition P = Preliminary
1) Data of 2017
Figure 30: Persons seriously injured or killed (Number per million train-km)32
The indicator for persons seriously injured and killed varies between 0 and 2.8
per million train-kilometres and strongly correlates with the number of significant
accidents per million train-kilometres (figure 28). The weighted average of safety
related injuries and fatalities in the peer group's railway network is 0.3 per million
train-kilometres.
32 DB is deviating from definition as the value refers to all infrastructure managers in Germany.

Page: 59
Figure 31: Infrastructure manager related precursors in 2012-2018 (Number per million train-km)33
Precursors are a good indicator to understand and mitigate root causes for sig-
nificant accidents and include broken rails, track buckle and track misalignment,
as well as wrong-side signalling failures. Figure 31 depicts a high fluctuation in
infrastructure manager related precursors to accidents. The peer group’s aver-
age increases from 2.5 precursors per million train-kilometres in 2012 and to 2.9
precursors per million train-kilometres in 2018. The level of the infrastructure
managers’ fluctuation is similar. The extreme weather events in 2018 had a visi-
ble impact on Bane NOR’s data, which is also reflected in its CAGR.
33 Only complete time series or time series with only one missing data point are shown. Missing
data points were complemented by extrapolation. The CAGRs are then calculated on this basis for the period 2012-2018.

Page: 60
Data accuracy: No entry = Normal E = Estimate D = Deviating from definition P = Preliminary
1) Data of 2017 (DB, FTIA) 2016 (NR)
Figure 32: Infrastructure manager related precursors in 2012-2018 (Number per million train-km)
The number of precursors of the peer group varies widely, some showing levels
well below the peer group’s weighted average of 1.9, while others have signifi-
cantly higher values. However, it is interesting to see that the two infrastructure
managers of the Baltic countries show a relatively high number of accidents,
while the infrastructure related precursors to accidents are among the lowest in
the peer group.
Rail safety is influenced by a wide array of factors. Safety policies should be
preventive and reactive at the same time. Providing assets in good condition by
ensuring appropriate activity levels of maintenance and renewal is a precondition
for reliable and safe operations. Additionally, safety figures are also influenced
by unauthorised persons entering the rails, which incidents are independent from
the infrastructure manager. Many infrastructure managers have launched cam-
paigns to reduce the number of level crossings and to introduce modern signal-
ling and communication systems. Increased awareness among employees and
track workers, as well as the public, is another main pillar of rail safety. Raising

Page: 61
awareness for safety measures contributes to reducing the influence of the hu-
man factor.
As infrastructure managers in the EU are working under different circumstances
it is very important to put the data in context. The infrastructure managers from
newer EU countries in Eastern Europe are still in a phase of modernizing and
upgrading their railway networks. The initial conditions were different not only
regarding asset conditions and technical safety equipment, but also safety poli-
cies.
4.4 Environment
Summary on environment
EU-wide objectives
• The European Green Deal aims to make Europe the first climate-neutral
continent by 2050.
• Increasing the share of environmentally-friendly transport modes is a ma-
jor goal of the deal.
• It is important that rail itself continues to become greener, for example by
further electrifying the track or using greener alternatives to Diesel where
electrification is not possible.
Peer group’s performance
• The network of the peer group is mostly electrified and the degree of
electrification remained stable over the period.
• The average rate is 74%. However, the individual degree of electrification
varies strongly from 5% to 100%.
• While the degree of electrification strongly correlates with the share of
electricity-powered trains, the electrified networks are not 100% exploited
by all infrastructure managers.
• The share of electricity-powered trains across the peer groups is around
75% on average.

Page: 62
4.4.1 Ecological footprint in the EU
Decarbonising transport is a key challenge. Besides encouraging more people
and companies to use rail, it is important that rail itself continues to become
greener. The biggest overall impact will come from electrification and the use of
greener alternatives to diesel where electrification is not possible. Additionally,
infrastructure managers can limit their impact on the environment in their operat-
ing business by using electric rolling stock for maintenance, boosting digitaliza-
tion and automatization, wastewater, waste, sustainable use of materials, recy-
cling, etc.
However, environmental aspects and the impact of railways require a whole sys-
tem perspective and should include the performance of railway undertakings and
other actors as well.
Rail environment indicators
PRIME members are reporting three indicators measuring railway environmental
performance:
• Degree of electrification
• Share of electricity-powered trains
• Share of diesel-powered trains
In order to increase comparability of these values among infrastructure manag-
ers, these values are related to main track-kilometres and train-kilometres.
4.4.2 Development and benchmark
Figures 33 to 37 show the relevant environment indicators of the PRIME mem-
bers over the time period 2012-2018 and the latest benchmark between the in-
frastructure managers.

Page: 63
Data accuracy: No entry = Normal E = Estimate D = Deviating from definition P = Preliminary
Figure 33: Degree of electrification of total main track in 2012-2018 (% of main track-km) 34
As can be seen in the figure above, the degree of electrification remained rela-
tively constant over the period. SNCF R. increased the share of electrified main
tracks by 1.2% per year. In absolute terms this growth corresponds to an addi-
tional 1200 kilometres of electrified main tracks in 2018 as compared to 2012.
The decrease at LDZ from 23.1% in 2012 to 22.6% in 2018 is due to network
extensions without electrification.
34 Only complete time series or time series with only one missing data point are shown. Missing
data points were complemented by extrapolation. The CAGRs are then calculated on this basis for the period 2012-2018.
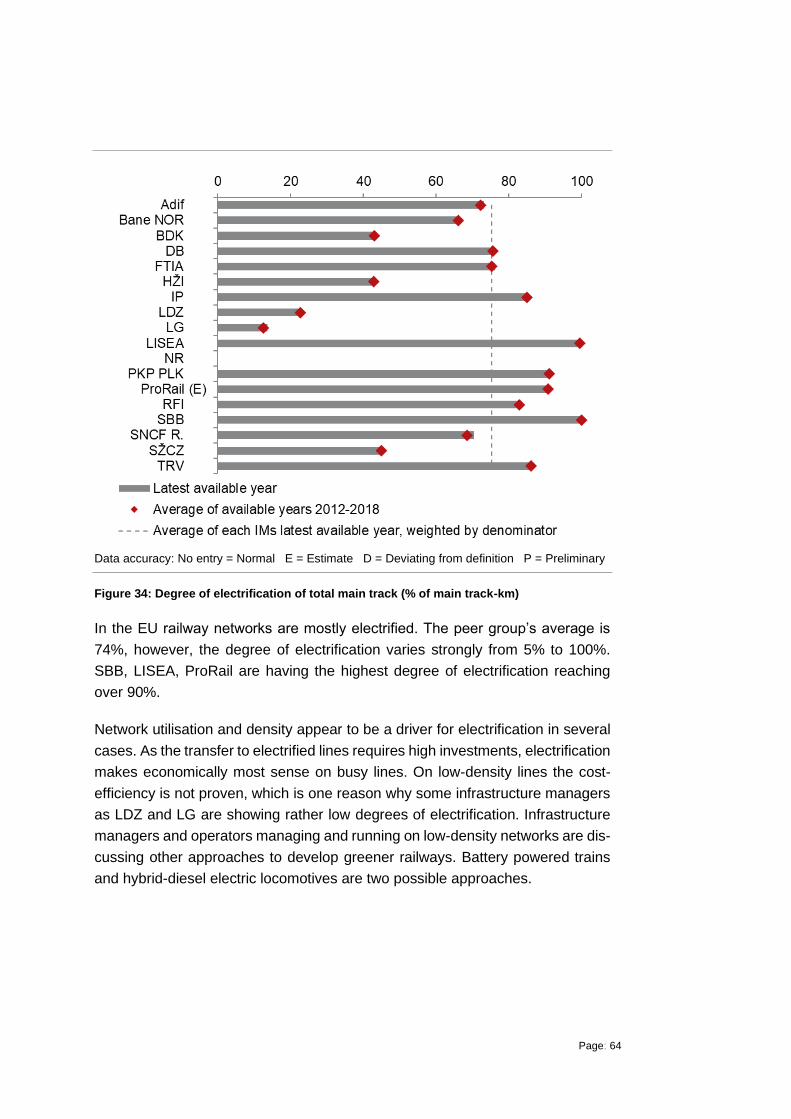
Page: 64
Data accuracy: No entry = Normal E = Estimate D = Deviating from definition P = Preliminary
Figure 34: Degree of electrification of total main track (% of main track-km)
In the EU railway networks are mostly electrified. The peer group’s average is
74%, however, the degree of electrification varies strongly from 5% to 100%.
SBB, LISEA, ProRail are having the highest degree of electrification reaching
over 90%.
Network utilisation and density appear to be a driver for electrification in several
cases. As the transfer to electrified lines requires high investments, electrification
makes economically most sense on busy lines. On low-density lines the cost-
efficiency is not proven, which is one reason why some infrastructure managers
as LDZ and LG are showing rather low degrees of electrification. Infrastructure
managers and operators managing and running on low-density networks are dis-
cussing other approaches to develop greener railways. Battery powered trains
and hybrid-diesel electric locomotives are two possible approaches.

Page: 65
Figure 35: Share of electricity-powered trains in 2012-2018 (% of total train-km)35
Figure 35 shows the average and individual development of electricity-powered
trains between 2012 and 2018. The aggregated value remains relatively stable
at 75%-76% for electricity-powered trains.
35 Only complete time series or time series with only one missing data point are shown. Missing
data points were complemented by extrapolation. The CAGRs are then calculated on this basis for the period 2012-2018.

Page: 66
Figure 36: Share of train types (% of total train-km)
As shown in figure 36 most of the train-kilometres in the peer group are produced
by electricity-powered trains. This reflects the degree of electrification of the
network which for most organisations reaches 70% or more.
Figure 37: Share of electricity-powered trains (% of train-km) / Electrification (% of main track-km)

Page: 67
As expected, there is a strong correlation between the degree of network electri-
fication and share of electric trains. However, it is noticeable that similar degrees
of electrification do not lead to similar shares of electrically produced train ser-
vices. The decision to operate electricity-powered trains lies mainly with the op-
erator, which may decide to run diesel-powered trains or alternative engines on
electrified lines. Historic trains or trains that also run on non-electrified lines are
two examples.
4.5 Performance and delivery
Summary of performance and delivery
EU-wide objectives
• Improving performance and increasing punctuality of passenger and
freight rail services is an objective of every infrastructure manager.
• Infrastructure managers establish targets and monitor them closely to de-
velop appropriate activities and measure their effectiveness.
• The EU’s legislation has established basic principles to minimise disrup-
tions and agree on performance schemes.
Peer group’s performance
• PRIME has developed common definitions to increase the comparability
of performance measures, which is limited due to different thresholds and
measuring methods.
• Delay measurement thresholds have a span between 2:29 and 5:59
minutes for passenger trains and 2:59 and almost 60 minutes for freight
trains.
• Punctuality performance shows a slightly negative development for al-
most all infrastructure managers. Nevertheless, some railway networks
deliver high levels of punctuality, reaching up to 97% for passenger
transport.
• Punctuality of rail freight is significantly lower, showing a wide span of
punctuality values between 40% and 86%.

Page: 68
4.5.1 Rail performance and delivery in the EU
The mobility demand of societies is constantly increasing. Not only has the num-
ber of rail passengers increased, but longer and more complex production chains
have led to increased demands on freight transport. In addition, consumers are
becoming more used to fast digital structures in other sectors. Purchasing goods
24 hours a day and getting them delivered the next day rises the expectation
regarding all services, including rail.
Increased customer demands are particularly visible regarding punctuality and
reliability. More frequent and complex journeys require coordinated schedules
and punctual trains. Current trends in logistics, such as just-in-time manufactur-
ing and customized deliveries, call for more plannability, traceability and speed
in transportation.
In order to continuously improve their performance, infrastructure managers set
punctuality targets as part of their strategy and monitor and steer them on the
basis of their management systems. They aim at minimizing infrastructure related
causes that lead to reduced reliability and availability of assets, which in turn
have a negative impact on the performance of train operations.
EU legislation has established basic principles regarding performance and deliv-
ery. Under EU law, infrastructure charging schemes will encourage railway un-
dertakings and the infrastructure manager to minimise disruption and improve
the performance of the railway network through a performance scheme.
Rail punctuality and reliability indicators
PRIME members are reporting five indicators measuring railway punctuality and
reliability:
• Passenger trains’ punctuality
• Freight trains’ punctuality
• Delay minutes caused by the infrastructure manager
• Asset failures in relation to network size
• Average delay in minutes per asset failure
In order to increase comparability of these values among infrastructure manag-
ers, the train punctuality indicators are illustrated as a percentage of all trains

Page: 69
scheduled, the delay minutes are related to train-kilometres and the number of
asset failures is related to main track-kilometres.
4.5.2 Punctuality
Train punctuality is the primary measure of overall railway performance and a
key measure of quality of service, driven not only by the infrastructure manager
but also operators, customers and other external parties. It is a complex output
that needs to be understood as the result of a system where many internal and
external factors, different technologies, a large number of actors and stakehold-
ers come together and interact to produce a good service for passenger and
freight customers.
Reaching good punctuality rates is a priority of all countries, although it is meas-
ured and managed in very different ways. In particular, measurement concepts
are quite diverse, as performance schemes are not yet sufficiently coordinated
between infrastructure managers. The density of measurement points in net-
works can be as low as measuring at the final destination only, or as high as
measuring at arrivals, destinations and additional points. The following table
shows the different concepts with regards to measuring points in each infrastruc-
ture manager’s network.
Infrastructure
manager Measurement points in the network
Adif For statistical purposes at final destination only. For traffic
regulation and management also at every station, in blocks
and at some other strategic points like switches.
BDK Passenger trains (commuter): 84 strategic measurement
points
Passenger trains (regional and long distance): 47 strategic
measurement points
Freight trains: 16 strategic measurement points
DB For statistical purposes:
Punctuality of passenger trains is measured taking into ac-
count all stations.

Page: 70
Infrastructure
manager Measurement points in the network
Punctuality of freight trains is measured at the final station
(arrival) within Germany.
FTIA For commuter trains the measurement is done both at the
first and at last station; for all other trains only at arrival.
Delays are measured at block signals on line (but not used
to calculate punctuality).
IP Exclusively at the destination (all systems are prepared for
the measurement to be performed on more stations. To
this end, the stations to be selected will be all those that
enhance commercial service or have technical characteris-
tics for services requested by the operator).
LDZ Departure, subdivision border station and arrival.
LG Measured at strategic points.
NR Key stations, junctions or other critical points on the net-
work such as terminus stations.
PKP PLK For statistical purposes, time measured at the destination
(final relation station, or transfer to neighbouring infrastruc-
ture manager). The possibility of measurement exists at
any point where the arrival / departure time of the train is
described.
ProRail Strategic measurement points.
RFI Final destination for punctuality purpose.
SBB Passenger trains: 53 strategic measurement points.
Freight trains: 52 strategic measurement points.
SNCF R. Stations and strategic measurement points across the net-
work.
TRV Official performance measures measured at final destina-
tion only.
Many more measuring points exist, but the data is not
readily available to use.

Page: 71
The span of thresholds set to classify a passenger train as delayed can be as
low as 2:29 or as high as 15:59 minutes36. In the majority of the sample the
thresholds are between 2:59 and 5:59. Figure 38 depicts the different practices.
Figure 38: Delay measurement thresholds (in minutes:seconds)37
A greater heterogeneity can be found with measuring punctuality of freight trains.
Here thresholds vary widely between 2:59 and almost 60 minutes. Figure 39
gives an overview of delay measurement thresholds for freight trains.
Figure 39: Delay measurement thresholds (in minutes:seconds)
In order to promote good quality benchmarking, PRIME has established a com-
mon definition including an agreed threshold for each passenger and freight ser-
vices. For passenger trains, punctuality indicators represent the percentage of
actually operating national and international passenger trains which arrive at
each strategic measuring point with a delay of less than or equal to 5:29 minutes.
For freight trains the threshold has been set to 15:29 minutes. Several but not all
infrastructure managers report their punctuality figures according to this defini-
tion.
36 Long distance thresholds: RFI 15:29 37 Long distance thresholds: NR: 9:59, RFI: 15:29

Page: 72
Development and Benchmark
Passenger train punctuality
Figures 40 to 41 show the punctuality of passenger trains for operators using the
network of PRIME members over the time period 2012-2018 and the latest
benchmark of these indicators between the infrastructure managers. It is im-
portant to note that punctuality figures presented here are not solely the result of
the infrastructure manager’s performance but also include delays caused by op-
erators and other parties as well as external causes, hence representing full sys-
tem-punctuality.
Data accuracy: No entry = Normal E = Estimate D = Deviating from definition P = Preliminary
1) Bane NOR data for 2018 is preliminary.
Figure 40: Passenger trains punctuality in 2012-2018 (% of trains)38
As mentioned before, a comparison between different railway systems is only
possible to a limited extent. In figure 40 all infrastructure managers are compa-
rable, except Adif, RFI and SNCF R. as they deviate from PRIME’s definition. In
these cases, the analysis of time series should be limited to identify individual
developments over time.
Overall, the peer group’s average of passenger train punctuality has slightly de-
creased since 2012, with the majority of the infrastructure managers showing a
38 Only complete time series or time series with only one missing data point are shown. Missing
data points were complemented by extrapolation. The CAGRs are then calculated on this basis for the period 2012-2018.

Page: 73
slightly negative trend. In terms of volatility some infrastructure managers show
rather stable performance levels (ProRail, SNCF R.) while others have more vol-
atile performance data.
Data accuracy: No entry = Normal E = Estimate D = Deviating from definition P = Preliminary
Figure 41: Passenger trains punctuality (% of trains)
Figure 41 shows the passenger train punctuality data of the latest available year.
The lighter grey colour highlights the infrastructure managers which deviate from
the PRIME definition. The figures vary between 80% and 97%, which is again
partly a result of different measuring methodologies.
Besides different measuring concepts, there are other factors impacting punctu-
ality. Some of them are outside the infrastructure manager’s control. The com-
plexity of a network and its utilisation are among the most important factors. For
example, a network with a high density of assets such as switches and level
crossings, or a high degree of electrification, is more prone to failures and re-
quires more interventions, e.g. maintenance and renewal activities. Construction
works can have a relevant impact on the punctuality as they can reduce the per-
formance of the lines in the short term during the construction phase. The risk of
delays due to failures increases with higher complexity.

Page: 74
The same principle applies with respect to the degree of utilisation. A network
with a high degree of utilisation (expressed as train-kilometres per track-kilome-
tre) experiences more wear and tear, operational conflicts and train-affecting per-
turbations. Knock-on effects on punctuality increase with the level of utilisation.
Poor asset condition might also lead to a higher number of failures and increased
repair time. Response times to failures and time needed to repair determine the
infrastructure managers’ capability to recover the assets availability and return to
normal traffic operation. Condition of the rolling stock, which is a responsibility of
the operator, as well as weather conditions, are factors that are perfectly inde-
pendent from the infrastructure manager, but still do influence punctuality to a
significant degree.
Freight punctuality
Figures 42 to 43 show the punctuality of freight trains of PRIME members over
the time period 2012-2018 and the latest benchmark of this indicator between
the infrastructure managers.
Data accuracy: No entry = Normal E = Estimate D = Deviating from definition P = Preliminary
1) Bane NOR data for 2018 is preliminary.
Figure 42: Freight trains punctuality in 2012-2018 (% of trains)39
39 Only complete time series or time series with only one missing data point are shown. Missing
data points were complemented by extrapolation. The CAGRs are then calculated on this basis for the period 2012-2018.

Page: 75
As with the results for passenger train punctuality, most infrastructure managers
face a decline in the punctuality of freight trains. At -1.3%, the average decline
for freight trains is greater than for passenger trains. Except for Bane NOR, all
the peer group members show a negative trend.
Here as well a comparison between different railway systems is only possible to
a limited extent. In figure 42 all infrastructure managers are comparable, except
RFI and SNCF R as they deviate from PRIME’s definition. In these cases the
analysis of time series should be limited to identify individual developments over
time.
Data accuracy: No entry = Normal E = Estimate D = Deviating from definition P = Preliminary
1) Data of 2017
Figure 43: Freight trains punctuality in 2012-2018 (% of trains)
Compared to passenger train services, the percentage of freight trains on time is
lower and ranges between 40% and 86%. In total six infrastructure managers
deviate from the definition: these are marked in a lighter grey in the graph. Espe-
cially with regard to the European Union’s objective to boost freight transporta-
tion, these numbers are rather sobering.

Page: 76
Factors influencing punctuality of freight trains are similar to the ones described
for passenger train services.
Delays caused by infrastructure managers
As illustrated before, punctuality depends on a wide array of different factors and
has to be interpreted as a systemic result. Hence, the number of delay minutes
accrued should be distinguished between those caused by the infrastructure
managers and others.
Delay minutes caused by infrastructure manager
According to the PRIME KPI & Benchmarking subgroup delays caused by infra-
structure managers can be allocated to one of these four categories: operational
planning, infrastructure installations, civil engineering causes, causes of other
infrastructure managers.
Data accuracy: No entry = Normal E = Estimate D = Deviating from definition P = Preliminary
Figure 44: Delay minutes per train-km caused by the infrastructure manager in 2012-2018 (Minutes per thousand train-km)40
Regarding the delay minutes caused by infrastructure managers, the time series
shows a similarly negative trend as for punctuality. The number of delay minutes
40 Only complete time series or time series with only one missing data point are shown. Missing
data points were complemented by extrapolation. The CAGRs are then calculated on this basis for the period 2012-2018.

Page: 77
per train-kilometre caused by the infrastructure manager increased for 7 out of
10 infrastructure managers. The average growth rate is 2.2% and the individual
figures vary between -11.3% and +11.9%. PKP PLK, however, has considerably
reduced delays in 2018.
Data accuracy: No entry = Normal E = Estimate D = Deviating from definition P = Preliminary
1) Data of 2017
Figure 45: Delay minutes per train-km caused by the infrastructure manager (Minutes per thousand train-km)
On average infrastructure managers caused 11 delay minutes per thousand
train-kilometres, and their results vary between 1 and 36 minutes per thousand
train-kilometres.

Page: 78
Figure 46: Passenger train cancellations caused by the infrastructure manager (Minutes per thousand train-km) 41
The rate of cancellations related to infrastructure managers is calculated on the
basis of trains cancelled versus the total number of trains planned to be operated.
Over the years, PKP PLK, Bane NOR and ProRail developed a positive trend
and reduced cancellations. However, IP is showing a rather high annual increase
although the number of cancelations is still the lowest in the peer group.
41 Only complete time series or time series with only one missing data point are shown. Missing
data points were complemented by extrapolation. The CAGRs are then calculated on this basis for the period 2012-2018.

Page: 79
Data accuracy: No entry = Normal E = Estimate D = Deviating from definition P = Preliminary
1) Data of 2017
Figure 47: Passenger train cancellations caused by the infrastructure manager in 2012-2018 (% of scheduled and cancelled passenger trains)
As illustrated in figure 47 the percentage of train cancellations caused by infra-
structure managers varies widely, some showing levels well below the weighted
average while others have significantly higher values.
Besides different measuring concepts, cancellation policies vary between the in-
frastructure managers. Infrastructure managers apply different practices with re-
gards to the number of trains cancelled and the way they are treated in perfor-
mance statistics. Some infrastructure managers consider long delays above a
fixed threshold as a cancellation (NR) while others do not have a fixed threshold
and cancel trains according to the timetable reprogramming (RFI). Following a
restrictive cancellation policy could make it more difficult to achieve punctuality
goals.
4.5.3 Reliability
Reliability reflects the probability that railway systems or components will perform
a required function for a given time when used under stated operating conditions.

Page: 80
It is measured by counting failures which are actually affecting train operations.
Many elements of the infrastructure manager’s asset management system are
geared to improve asset reliability, including regular condition monitoring of as-
sets, renewal programmes as well as predictive and preventive maintenance
concepts.
Development and benchmark
Figures 48 to 49 show the number of train-affecting asset failures over the time
period 2012-2018 and the latest benchmark between the infrastructure manag-
ers.
Figure 48: Asset failures in relation to network size in 2012-2018 (Number per thousand main track-km)42
As can be seen in figure 48 the overall average number of failures per main track-
kilometre has slightly increased over the period. The individual development
shows the same picture: only ProRail is showing an annual average reduction of
1.6%. Bane NOR’s CAGR was affected by extreme weather in 2018.
42 Only complete time series or time series with only one missing data point are shown. Missing
data points were complemented by extrapolation. The CAGRs are then calculated on this basis for the period 2012-2018.

Page: 81
Figure 49: Asset failures in relation to network size (Number per thousand main track km)
Figure 49 shows the level and the composition of asset failures that caused de-
lays. On average 885 assets fail per thousand main track-kilometres per year.
The failure frequency in the peer group varies between 36 and 1,443 failures per
thousand main track-kilometres. Signalling accounts for the majority of all asset
failures. SBB's high level of signalling errors stems at least partially from a high
block and therefore signal density and the pioneering use of ETCS. The track
system is the second highest failing asset group. Failures of power supply and
telecommunication assets are less common and, considering the overall number,
the frequency of structural failures is negligible in most of the countries.
While asset failures have an impact on almost all performance indicators, such
as finance, safety, punctuality and reliability, there are several factors which de-
termine the frequency and dimension of asset failures. While complexity (electri-
fication, switch density and signalling) naturally increases the chances of failures,
high utilisation accelerates wear and tear. The condition, age and renewal rate
of assets is also decisive. However, asset failure also depends on a number of
factors such as stage of development, historic elements and the budget of the
infrastructure manager and the Member State concerned. Prevention policies,
good maintenance/renewal management, as well as failure recording
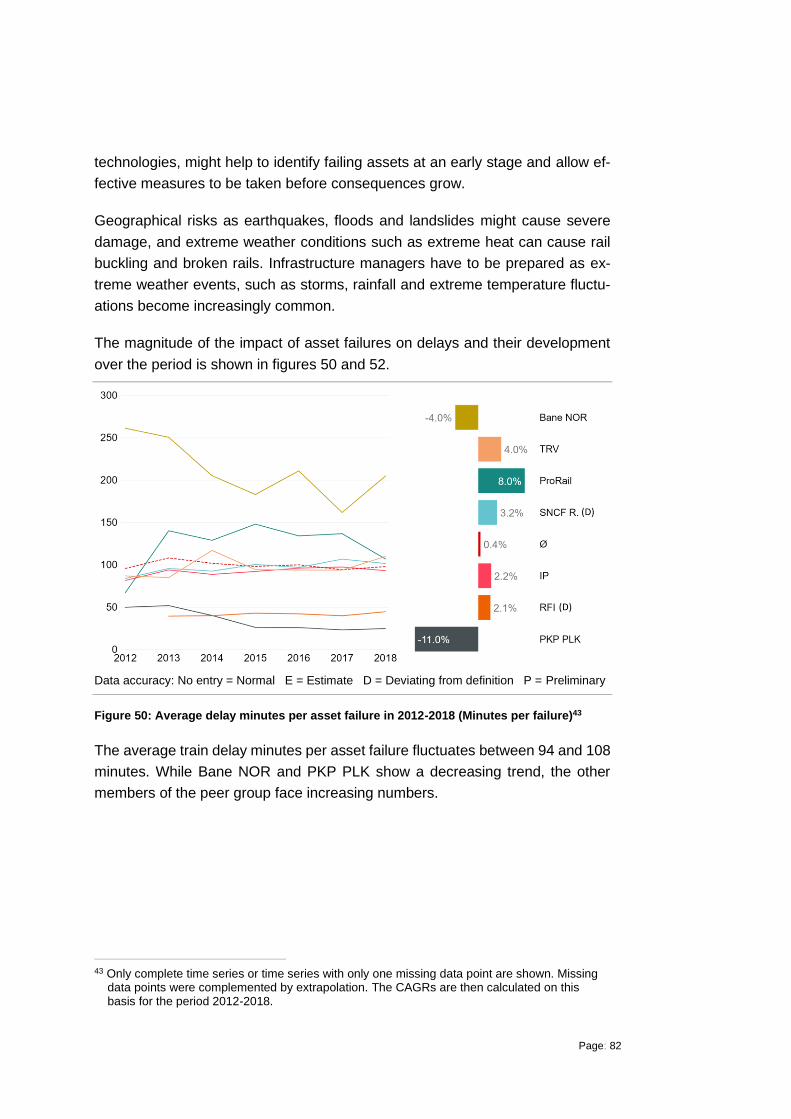
Page: 82
technologies, might help to identify failing assets at an early stage and allow ef-
fective measures to be taken before consequences grow.
Geographical risks as earthquakes, floods and landslides might cause severe
damage, and extreme weather conditions such as extreme heat can cause rail
buckling and broken rails. Infrastructure managers have to be prepared as ex-
treme weather events, such as storms, rainfall and extreme temperature fluctu-
ations become increasingly common.
The magnitude of the impact of asset failures on delays and their development
over the period is shown in figures 50 and 52.
Data accuracy: No entry = Normal E = Estimate D = Deviating from definition P = Preliminary
Figure 50: Average delay minutes per asset failure in 2012-2018 (Minutes per failure)43
The average train delay minutes per asset failure fluctuates between 94 and 108
minutes. While Bane NOR and PKP PLK show a decreasing trend, the other
members of the peer group face increasing numbers.
43 Only complete time series or time series with only one missing data point are shown. Missing
data points were complemented by extrapolation. The CAGRs are then calculated on this basis for the period 2012-2018.

Page: 83
Data accuracy: No entry = Normal E = Estimate D = Deviating from definition P = Preliminary
Figure 51: Average delay minutes per asset failure (Minutes per failure)
On average asset failures cause a delay of 76 minutes. Average delays vary
widely between 18 and 230 minutes per asset failure.
The magnitude of delays caused by asset failures highly depends on the type of
asset being involved. By relating the frequency of individual asset failures to the
delay minutes caused, the impact on punctuality becomes visible. Figure 52
shows this relationship.

Page: 84
Figure 52: Delay per asset failure (Minutes per failure) / Asset failures (Number per thou-sand main track-km)
Structural assets such as bridges and tunnels cause the highest number of delay
minutes, followed by power supply failures with 175 minutes per failure. However,
failures of structures have the lowest occurrence. These are followed by average
delay minutes per track failure (95 minutes), which is the second most common
failure. The average impact of signalling failures, telecommunication failure and
other failures is comparatively low, however signalling failures are the most fre-
quent by far.
However, the type of asset failures is not the only driving factor. High utilisation
increases knock-on effects. Particularly on very busy routes, one single disrup-
tion can cause several knock-on delays. The knock-on might affect the traffic on
the route where the disruption happened, plus on any connecting tracks, result-
ing in secondary delays.
Having well-organised maintenance planning and good response times are im-
portant when it comes to managing failures. Efficient contingency plans, good
communication with operators, and the ability to quickly alter timetables are es-
sential for minimizing delays.
12
10
01
07
_P
RIM
E_
Be
nch
ma
rkin
g_
Re
po
rt_
20
18
_fin
al.p
ptx
© c
ivity 2
02
0//
/
Confidential

Page: 85
4.5.4 Availability
Availability of the infrastructure reflects the state of an asset and its usability for
its intended purpose. As well as managing its assets in such a way as to minimise
the effect of failures on the railway, availability indicators also measure the effec-
tiveness and timeliness of the infrastructure manager in responding to these fail-
ures, and returning the network to normal function.
Temporary and permanent speed restrictions have an overall impact on the avail-
ability of railway infrastructure, and can lead to delays, breakdowns and longer
travel times. Speed restrictions are imposed on the railway to ensure safe use of
the infrastructure and are applied when track renewals or regular maintenance
work are carried out. However, it is often important to relieve the infrastructure
by reducing speed limits even before maintenance work is started.
PRIME members are reporting two indicators for measuring railway delivery per-
formance:
• Tracks with permanent speed restrictions
• Tracks with temporary speed restrictions
In order to increase comparability of these values among infrastructure manag-
ers, these values are related to main track-km.
Development and benchmark
Figures 53 to 54 show to what degree a network was affected by permanent or
temporary speed restrictions. Due to incomplete time series, no trend line can be
shown for these two indicators.

Page: 86
Data accuracy: No entry = Normal E = Estimate D = Deviating from definition P = Preliminary
1) Data of 2017 (ProRail) 2015 (FTIA)
Figure 53: Tracks with permanent speed restrictions (% of main track-km)44
Based on the definition, restrictions are defined as permanent if they are incor-
porated within the yearly timetable. Some infrastructure managers do not count
permanent speed restrictions at all, as they are included in the working timetable.
44 Axis for HŽI shortened for better readability.

Page: 87
Data accuracy: No entry = Normal E = Estimate D = Deviating from definition P = Preliminary
1) Data of 2017 (ProRail) 2016 (SBB)
Figure 54: Tracks with temporary speed restrictions (% of main track-km)45
Other than permanent speed restrictions, restrictions that occur during the year
and are not included in the annual timetable are considered temporary. On aver-
age, 2.1% of the main track is unavailable due to temporary speed restrictions,
which are typically caused by deteriorating conditions or necessary track works.
While some infrastructure managers have hardly any temporary speed re-
strictions, HŽI and Bane NOR restrict speed on more than 4% of their network.
Speed restrictions are usually set by the infrastructure manager in consultation
with train operators. How long speed restrictions last and whether the temporary
ones become permanent depends on the funding agreements and budget of the
infrastructure managers for maintenance and investments. It is also relevant how
utilised the affected routes are, and whether there are branch lines that can be
used during the maintenance works. Reducing speed in order to extend the ser-
vice life is sometimes the better option than interrupting a very active route for a
longer period of time.
45 Axis for HŽI shortened due to readability.

Page: 88
4.6 ERTMS deployment
Summary of ERTMS deployment
EU-wide objectives
• The main objectives of ERTMS are to increase interoperability, harmo-
nise automatic train control and communication systems throughout the
European rail network, and act as the building block for digitalisation of
the rail network.
• Technical details of ERTMS are laid down in the CCS TSI (Control-Com-
mand and Signalling Technical Specification for Interoperability). The Eu-
ropean Union Agency for Railways (ERA) is the ERTMS System Authority
responsible for ensuring interoperable deployment as defined in the
Fourth Railway Package.
• According to the ERTMS European Deployment Plan (EDP) the Core
Network Corridors shall be equipped by 2030.
Peer group’s performance
• ERTMS deployment is highly heterogonous in the peer group.
• Across the peer group ERTMS is expected to be implemented in about
29% of the railway network by 2030.
4.6.1 ERTMS deployment in the EU
ERTMS and the deployment of ERTMS is a complex but major topic for the rail
sector. Increasing interoperability, harmonising the automatic train control and
communication systems throughout the European rail network, and acting as the
building block for digitalisation of the rail network are the major objectives of the
industrial programme.
While deployment of ERTMS is costly, it is also often not solely the responsibility
of infrastructure managers to choose rolling out ERTMS on their networks. How-
ever, ERTMS is crucial for infrastructure managers, as expected benefits of
ERTMS deployment are significant, including increased safety, capacity, availa-
bility, and interoperability.
The technical details of the system are laid down in the CCS TSI (Control-Com-
mand and Signalling Technical Specification for Interoperability). The Fourth

Page: 89
Railway Package enhances the role of the European Union Agency for Railways
(ERA) as the ERTMS system authority.
4.6.2 ERTMS indicators
Figures 55 and 56 show the level of ERTMS track-side deployment and the
planned extent of ERTMS deployment by 2030.
Data accuracy: No entry = Normal E = Estimate D = Deviating from definition P = Preliminary
1) Data of 2016 (FTIA) 2015 (NR)
Figure 55: ERTMS track-side deployment (% of main track-km)46
ERTMS is deployed on about 6% of all tracks of the peer group's railway network.
The infrastructure managers’ implementation strategies are heterogeneous,
which is reflected by there being no ERTMS deployment in some countries vs. a
high share in others of more than 80%.
46 Axis shortened due to readability (LISEA, SBB).

Page: 90
Data accuracy: No entry = Normal E = Estimate D = Deviating from definition P = Preliminary
1) Planning is based on 2018 for all infrastructure managers except ProRail (2017) and FTIA
(2016).
Figure 56: Planned extent of ERTMS deployment by 2030 (% of current main track-km)
By 2030 ERTMS are expected to cover about 29% of the peer group's railway
network. For SBB the value is higher than 100%, as the future network will be
larger than the current network and both are or will be entirely equipped with
ETRMS. For BDK the value is not quite 100% since the Copenhagen S-bane will
be equipped with a similar system called CBTC instead of ERTMS.
Despite the fact that the European vison of the deployment of ERTMS is clearly
formulated, the speed and commitment of uptake depend on a variety of factors.
The stage of a railway’s development, past and present priorities, funding agree-
ments and the level of the budget for investment are some of them. Network size
and complexity (number of stations and hubs), adaptability to the existing infra-
structure, technical equipment and asset condition are other aspects that might
influence the timeline for deployment of ERTMS. Difficulties in coordinating with
operators who have to equip their fleet with ERTMS on-board systems increase
the burden of deployment.

Page: 91
5 Outlook
Clearly a benchmarking report involving such a heterogeneous group of partici-
pants, operating in different environments and under diverse framework condi-
tions cannot produce simple results or even a ranking of infrastructure managers.
But it does provide a good starting point to raise questions and explore the dif-
ferences. Furthermore, this report leads to the question of how benchmarking of
European rail infrastructure can be developed and improved further.
While this benchmarking report does already cover over 70% of the European
railway network, a steady increase of the number of infrastructure managers par-
ticipating, in order to reflect the full European picture and to establish an even
more solid basis for benchmarking, is the declared objective of this subgroup. In
combination with longer time series, a larger number of participants will foster a
more comprehensive dataset, allowing for better and more meaningful compari-
sons for the benefit of each individual infrastructure manager, the European
Commission, national authorities and policy makers.
Eventually, annual PRIME reports can be supplemented with in-depth best prac-
tice descriptions of individual infrastructure manager, serving as a means to fa-
cilitate and enhance mutual inspiration and learning from each other. In this con-
text, different and specific conditions the infrastructure managers are working in
can be made more transparent. As a result, this can take benchmarking to the
next level and contribute to deeper insights and, for example, more targeted rail
policy measures.
Already today, the annual PRIME report is flanked by additional thematic reports,
so called “deep dives” into certain focus areas, providing more detailed and con-
centrated investigation. Such a regular compilation of thematic reports supports
the development of a better understanding of infrastructure managers’ charac-
teristics, helps to identify fields of action as well as opportunities to achieve the
entrepreneurial and socio-political goals set for the railways. Topics for future
thematic reports can be suggested by both infrastructure managers and DG
Move. Funding and charging of railway infrastructure will be the focus of the next
report planned.
In addition to a growing peer group and deeper analysis, it remains an ongoing
task of the subgroup to refine the existing indicators by further increasing their
definitional accuracy and comparability, and by ensuring a higher level of com-
pleteness and robustness of all data. New indicators are being discussed to

Page: 92
create more transparency related to the different aspects. And of course the dy-
namics of the technological, environmental and political conditions urge the col-
lection of additional data and the development of more indicators. The recent
development of the Green Deal is one of the most obvious drivers for new indi-
cators.

Page: 93
6 Annex
6.1 Fact sheets of the infrastructure managers
Figure 57: Fact sheet: Adif
Figure 58: Fact sheet: Bane NOR

Page: 94
Figure 59: Fact sheet: Banedanmark
Figure 60: Fact sheet: DB Netz AG

Page: 95
Figure 61: Fact sheet: Finnish Transport Infrastructure Agency
Figure 62: Fact sheet: HŽ Infrastruktura d.o.o.

Page: 96
Figure 63: Fact sheet: Infraestruturas de Portugal S.A.
Figure 64: Fact sheet: Latvijas dzelzceļš

Page: 97
Figure 65: Fact sheet: Lietuvos geležinkeliai
Figure 66: Fact sheet: LISEA

Page: 98
Figure 67: Fact sheet: Network Rail
Figure 68: Fact sheet: PKP PLK

Page: 99
Figure 69: Fact sheet: ProRail
Figure 70: Fact sheet: RFI

Page: 100
Figure 71: Fact sheet: SBB
Figure 72: Fact sheet: SNCF Réseau

Page: 101
Figure 73: Správa železnic, státní organizace
Figure 74: Fact sheet: Trafikverket
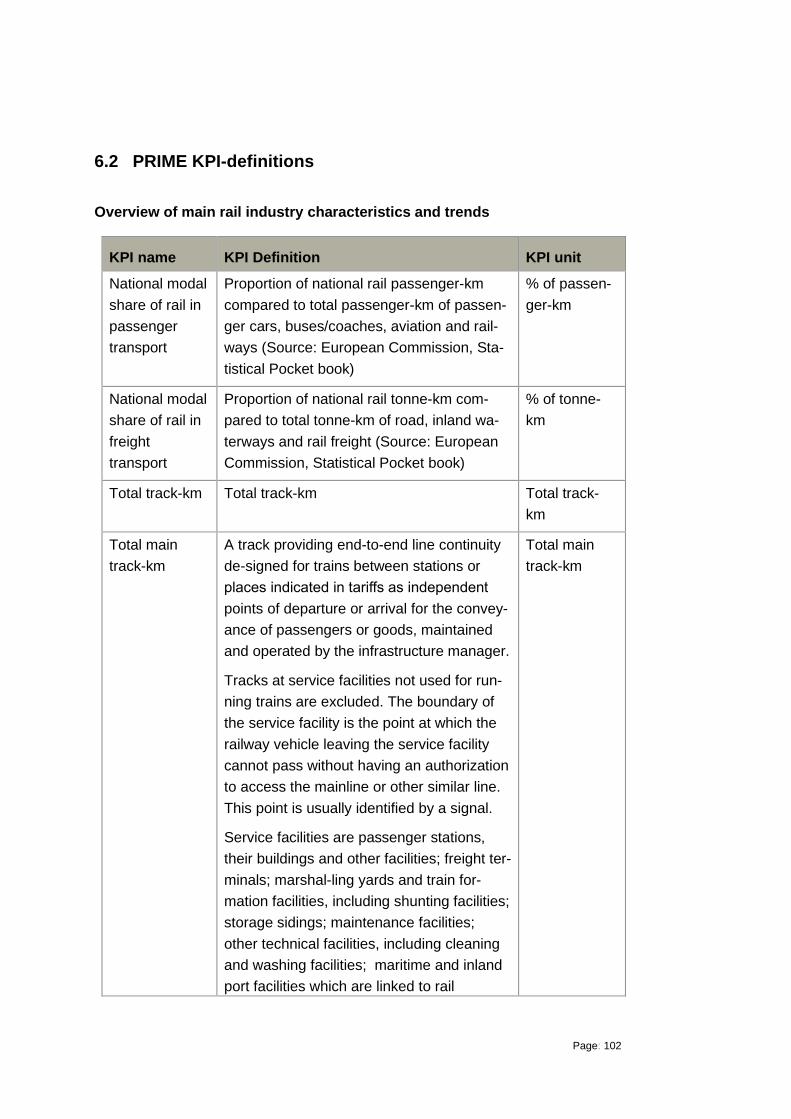
Page: 102
6.2 PRIME KPI-definitions
Overview of main rail industry characteristics and trends
KPI name KPI Definition KPI unit
National modal
share of rail in
passenger
transport
Proportion of national rail passenger-km
compared to total passenger-km of passen-
ger cars, buses/coaches, aviation and rail-
ways (Source: European Commission, Sta-
tistical Pocket book)
% of passen-
ger-km
National modal
share of rail in
freight
transport
Proportion of national rail tonne-km com-
pared to total tonne-km of road, inland wa-
terways and rail freight (Source: European
Commission, Statistical Pocket book)
% of tonne-
km
Total track-km Total track-km Total track-
km
Total main
track-km
A track providing end-to-end line continuity
de-signed for trains between stations or
places indicated in tariffs as independent
points of departure or arrival for the convey-
ance of passengers or goods, maintained
and operated by the infrastructure manager.
Tracks at service facilities not used for run-
ning trains are excluded. The boundary of
the service facility is the point at which the
railway vehicle leaving the service facility
cannot pass without having an authorization
to access the mainline or other similar line.
This point is usually identified by a signal.
Service facilities are passenger stations,
their buildings and other facilities; freight ter-
minals; marshal-ling yards and train for-
mation facilities, including shunting facilities;
storage sidings; maintenance facilities;
other technical facilities, including cleaning
and washing facilities; maritime and inland
port facilities which are linked to rail
Total main
track-km

Page: 103
KPI name KPI Definition KPI unit
activities; relief facilities; refuelling facilities
and supply of fuel in these facilities.
Degree of net-
work utilisation
– passenger
trains
Average daily passenger train-km on main
track (revenue service only, no shunting, no
work trains) related to main track-km
Daily passen-
ger train–km
per main
track-km
Degree of net-
work utilisation
– freight trains
Average daily freight train-km on main track
(revenue service only, no shunting, no work
trains) related to main track-km
Daily freight
train–km per
main track-km
Finance
KPI name KPI Definition KPI unit
OPEX – opera-
tional expendi-
tures in relation
to network size
Total infrastructure managers annual opera-
tional expenditures per main track-km
Euro per main
track-km
CAPEX – capi-
tal expendi-
tures in relation
to net-work
size
Total infrastructure managers annual capital
expenditures per main track-km
Euro per main
track-km
Maintenance
expenditures in
relation to net-
work size
Total infrastructure managers annual
maintenance expenditures per main track-
km
Euro per main
track-km
Renewal ex-
penditures in
relation to net-
work size
Total infrastructure managers annual re-
newal expenditures per main track-km
Euro per main
track-km
TAC revenue
in relation to
network size
Total infrastructure managers annual TAC
revenues (including freight, passenger and
touristic trains) compared to total main
track-km
Euro per main
track-km

Page: 104
KPI name KPI Definition KPI unit
Total revenues
from non-ac-
cess charges
in relation to
network size
Total infrastructure managers annual reve-
nues from non-access charges (e.g. com-
mercial letting, advertising, telecoms but ex-
cluding grants or subsidies) related to total
main track-km
Euro per main
track-km
Proportion of
TAC in total
revenue
Percentage of infrastructure managers an-
nual TAC revenues (including freight, pas-
senger and touristic trains) compared to to-
tal revenues
% of mone-
tary value
Safety
KPI name KPI Definition KPI unit
Significant ac-
cidents
Relative number of significant accidents in-
cluding sidings, excluding accidents in work-
shops, warehouses and depots, based on
the following types of accidents (primary ac-
cidents):
• Collision of train with rail vehicle,
• Collision of train with obstacle within the
clearance gauge,
• Derailment of train,
• Level crossing accident, including acci-
dent involving pedestrians at level cross-
ing,
• Accident to persons involving rolling
stock in motion, with the exception of sui-
cides and attempted suicides,
• Fire on rolling stock,
• Other accident
The boundary is the point at which the rail-
way vehicle leaving the workshop / ware-
house / depot / sidings cannot pass without
having an authorization to access the
Number per
mil-lion train-
km

Page: 105
KPI name KPI Definition KPI unit
mainline or other similar line. This point is
usually identified by a signal. For further
guidance, please see ERA Implementation
Guidance on CSIs.
Persons seri-
ously injured
and killed
Relative number of persons seriously in-
jured (i.e. hospitalised for more than 24
hours, excluding any attempted suicide) and
killed (i.e. killed immediately or dying within
30 days, excluding any suicide) by acci-
dents based upon following categories:
• Passenger,
• Employee or contractor,
• Level crossing user,
• Trespasser,
• Other person at a platform,
• Other person not at a platform
In number per
million train-
km
Infrastructure
manager re-
lated precursor
to accidents
Relative number of the following types of
precursors:
• broken rail,
• track buckle and track misalignment,
• wrong-side signalling failure
In number per
million train-
km
Environment
KPI name KPI Definition KPI unit
Degree of elec-
trification of to-
tal main track
Percentage of main track-km which are
electrified
% of main
track-km
Share of elec-
tricity-powered
trains
Train-kilometres of electricity-powered trains
compared to total train-kilometres (both for
passenger and freight trains)
% of train-km

Page: 106
KPI name KPI Definition KPI unit
Share of die-
sel-powered
trains
Train-kilometres of diesel-powered trains
compared to total train-kilometres (both for
passenger and freight trains)
% of train-km
Performance and delivery
KPI name KPI Definition KPI unit
Passenger
trains punctual-
ity
Percentage of actually operating (i.e. not
cancelled) national and international pas-
senger trains (excluding work trains) which
arrive at each strategic measuring point with
a delay of less than or equal to 5:29 minutes
% of trains
Freight trains
punctuality
Percentage of actually operating (i.e. not
cancelled) national and international freight
trains (excluding work trains) which arrive at
each strategic measuring point with a delay
of less than or equal to 15:29 minutes
% of trains
Delay minutes
per train-km
caused by the
infrastructure
manager
Delay minutes caused by incidents that are
regarded as infrastructure managers re-
sponsibility divided by total train-km oper-
ated (revenue service + shunting operations
to and from depots + infrastructure man-
ager’s work traffic); Delay minutes accord-
ing to UIC leaflet 450-2. Delay minutes will
be measured at all available measuring
points. Of those measured delay minutes
that exceed a threshold of 5:29 minutes for
passenger services and 15:29 minutes for
freight services the maximum number is
counted. No delay minutes are counted if
these thresholds are not exceeded at any
measuring point
Minutes per
train-km
Assets failures
in relation to
network size
Average number of all asset failures on
main track according to UIC leaflet 450-2.
An asset failure is counted one time and
one time only if any train is affected by it. A
Number per
thousand
main track-km

Page: 107
KPI name KPI Definition KPI unit
train is affected if the asset failure causes
the train to exceed a delay minutes thresh-
old of 5:29 minutes for passenger services
or 15:29 minutes for freight services at any
available measuring point. An asset failure
is not counted if these thresholds are not
exceeded for any train at any available
measuring point (i.e. if no train is affected)
Average delay
minutes per
asset failure
Average delay minutes per asset failure
caused by all asset failures on main track
according to UIC leaflet 450-2. An asset fail-
ure is counted one time and one time only if
any train is affected by it. A train is affected
if the asset failure causes the train to ex-
ceed a delay minutes threshold of 5:29
minutes for passenger services or 15:29
minutes for freight services at any available
measuring point. Delay minutes will be
measured at all available measuring points.
Of those measured delay minutes the maxi-
mum number is counted. No delay minutes
are counted if these thresholds are not ex-
ceeded at any measuring point. An asset
failure is not counted if these thresholds are
not exceeded for any train at any available
measuring point (i.e. if no train is affected)
Minutes per
failure
Availability
KPI name KPI Definition KPI unit
Tracks with
permanent
speed re-
strictions
Percentage of tracks with permanent speed
restriction due to deteriorating asset condi-
tion weighted by the time the restrictions are
in place (included in the yearly timetable) re-
lated to total main track-km; restrictions are
counted whenever criterion is met regard-
less of whether infrastructure manager
% of main
track-km

Page: 108
KPI name KPI Definition KPI unit
reports permanent speed restrictions as
such or if they are included in the timetable
Tracks with
temporary
speed re-
strictions
Percentage of tracks with temporary speed
restriction due to deteriorating asset condi-
tion weighted by the time the restrictions are
in place (not included in the yearly timeta-
ble) related to total main track-km
% of main
track-km
ERMTS deployment
KPI name KPI Definition KPI unit
ERTMS track-
side deploy-
ment
Main tracks with ERTMS in operation in pro-
portion to total main tracks (measured in
track-km)
% of main
track-km
Planned extent
of ERTMS de-
ployment by
2030
In 2030, the percentage of main track-km
planned to have been deployed with
ERTMS, i.e. main tracks equipped with both
- ETCS (European train control system; any
baseline or level) and GSM-R (Global Sys-
tem for Mobile Communications); and where
ETCS and GSM-R are used in service
% of current
main track-km

Page: 109
6.3 Financial data
Figure 75: Purchasing power parity (Index, EU-28=1)
Figure 76: Average annual exchange rate (Local currency unit/Euro)

Page: 110
7 Glossary
Name Description Source
Affected train (by an as-
set failure)
A train is affected if the asset failure causes the train to exceed a
delay minutes threshold of 5:29 minutes for passenger services
or 15:29 minutes for freight services at any available measuring
point.
Asset Capability Asset capability is a quality or function as a property or natural
part of an asset. A capability is a characteristic of an asset ena-
bling achievement of its desired function.
Asset failure An asset failure is counted one time and one time only if any train
is affected by it. A train is affected if the asset failure causes the
train to exceed a delay minutes threshold of 5:29 minutes for pas-
senger services or 15:29 minutes for freight services at any avail-
able measuring point. An asset failure is not counted if these
thresholds are not exceeded for any train at any available meas-
uring point (i.e. if no train is affected)
Asset Management Coordinated activity of an organisation to realise value from as-
sets.
ISO 55000:2014
Assets LICB defines the Railway Infrastructures as consisting of the fol-
lowing items, assuming they form part the permanent way, includ-
ing sidings, but excluding lines situated within railway repair work-
shops, depots or locomotive sheds and private branch lines or
sidings:
- Ground area
- Track and track bed etc.
- Engineering structures: Bridges culverts and other overpasses,
tunnels etc.
- Level crossings, including appliances to ensure safety of road traf-
fic;
- Superstructure, in particular: rails, grooved rails; sleepers, small
fittings for the permanent way, ballast, points, crossings.
- Access way for passengers and goods, including access by road;
- Safety, signalling and telecommunications installations on the
open track, in stations and in marshalling yards etc.
- Lightning installations for traffic and safety purposes
- Plant for transforming and carrying electric power for train haulage:
substations, Supply cables between sub-stations and contact
wires, catenaries.
EC Directives, European Com-
mission 5th Framework Pro-
gramme Improve rail, Delivera-
ble D3, “Benchmarking exercise
in railway infrastructure man-
agement” as referred in the UIC
Lasting Infrastructure Cost
Benchmarking (LICB) project.
ATP (Automatic train
protection)
A system that enforces obedience to signals and speed re-
strictions by speed supervision, including automatic stop at sig-
nals.
Recommendations to revise
Annex 1 to Directive 2004/49
Bottleneck A physical, technical or functional barrier which leads to a system
break affecting the continuity of long-distance or cross-border
flows and which can be surmounted by creating new infrastruc-
ture or substantially upgrading existing infrastructure that could
bring significant improvements which will solve the bottleneck
constraints
Regulation (EU) No 1315/2013
(TEN-T), Article (3)(q)
Broken rail Any rail which is separated in two or more pieces, or any rail from
which a piece of metal becomes detached, causing a gap of more
than 50 mm in length and more than 10 mm in depth on the run-
ning surface.
Directive (EU) 2016/798 on rail-
way safety, Annex I, Appendix
4.1

Page: 111
Name Description Source
Cancelled train If a planned service is not running (i.e. train cancelled in the oper-
ations phase). The codes described in UIC CODE, 450 – 2, OR,
5th edition, June 2009, Appendix A page 9 should be used to de-
scribe the cause of cancellation on the whole or just a part of the
route.
Cancelled trains can be split into four types. These are:
•full cancellation (cancelled at origin)
•part cancellation en route
•part cancellation changed origin
•part cancellation diverted (any train that diverts and does not
stop at all of its scheduled locations will be classed as a part can-
cellation even if it reaches its end destination).
UIC CODE, 450 – 2, OR, 5th
edition, June 2009, 6 – Can-
celled services, combined with
adopting the types of cancella-
tions described by Network
Rail.
Capacity (infrastruc-
ture)
Capacity means the potential to schedule train paths requested
for an element of infrastructure for a certain period;
2012/34/EU (SERA), Article 3
(24)
CAPEX, Capital ex-
penditures
Capital expenditure are funds used by a company to acquire or
upgrade physical assets such as property, industrial buildings or
equipment. An expense is considered to be a capital expenditure
when the asset is a newly purchased capital asset or an invest-
ment that improves the useful life of an existing capital asset.
Hence, it comprises investments in new infrastructure as well as
renewals and enhancements.
PRIME KPI subgroup
Charges for service fa-
cilities
Revenues generated by providing access to service facilities.
Services facilities include:
(a) passenger stations, their buildings and other facilities, includ-
ing travel information display and suitable location for ticketing
services;
(b) freight terminals;
(c) marshalling yards and train formation facilities, including
shunting facilities;
(d) storage sidings;
(e) maintenance facilities, with the exception of heavy mainte-
nance facilities dedicated to high-speed trains or to other types of
rolling stock requiring specific facilities;
(f) other technical facilities, including cleaning and washing facili-
ties;
(g) maritime and inland port facilities which are linked to rail activ-
ities;
(h) relief facilities;
(i) refuelling facilities and supply of fuel in these facilities, charges
for which shall be shown on the invoices separately
Directive 2012/32/EU, Annex II
Conventional train Train, composed of vehicles designed to operate at speeds below
250 km/h.
Decision No. 1692/96/EC (TEN-
T), Art.10(1)
Delay The time difference between the time the train was scheduled to
arrive in accordance with the published timetable and the time of
its actual arrival.
Adapted from ERA, Glossary of
railway terminology
Delay minutes Delay minutes will be measured at all available measuring points.
Of those measured delay minutes that exceed a threshold of 5:29
minutes for passenger services and 15:29 minutes for freight ser-
vices the maximum number is counted. No delay minutes are
counted if these thresholds are not exceeded at any measuring
point
Deployment The deployment of a mechanical device, electrical system, com-
puter program, etc., is its assembly or transformation from a
packaged form to an operational working state. Deployment im-
plies moving a product from a temporary or development state to
a permanent or desired state.

Page: 112
Name Description Source
Derailment of train Any case in which at least one wheel of a train leaves the rails. Glossary for Transport Statis-
tics, A.VI-14
Directive (EU) 2016/798 on rail-
way safety, Annex I, Appendix
1.7
Direct Cost in the
meaning of Regulation
(EU)2015/909
Direct cost in this context means “the cost that is directly incurred
as a result of operating the train service” and which is used for
setting charges for the minimum access package and for access
to infrastructure connecting service facilities. The modalities for
the calculation of the cost that is directly incurred as a result of
operating the train are set out in Commission Implementing Reg-
ulation (EU) 2015/909 and can in principle be established on the
basis of:
(a) a network-wide approach as the difference between, on the
one hand, the costs for providing the services of the minimum ac-
cess package and for the access to the infrastructure connecting
service facilities and, on the other hand, the non-eligible costs re-
ferred to in Article 4 of this regulation, or
(b) econometric or engineering cost modelling.
PRIME KPI subgroup on the
basis of Implementing Regula-
tion (EU) 2015/909
Expenditure on en-
hancements of existing
infrastructure
Enhancements (or 'upgrades’) means capital expenditure on a
major modification work of the existing infrastructure which im-
proves its overall performance. Enhancements can be triggered
by changed functional requirements (and not triggered by life-
time) or "forced" investments when acting on regulations.
The purpose of enhancements is to change the functional re-
quirements such as electrification of a non-electrified line, build-
ing a second track parallel to a single tracked line, increase of
line speed or capacity. Enhancements include planning (incl.
portfolio prioritization, i.e. which enhancements projects are real-
ized when and where), tendering dismantling (disposal of old
equipment), construction, testing and commissioning (when track
is opened to full-speed operation). Enhancements are generally
looked on at the level of annual spending from a cash-flow per-
spective, i.e. no depreciation or other imputed costs are taken
into account. It includes its proportion of overhead (such as finan-
cials, controlling, IT, human resources, purchasing, legal and
planning), labour (operative, personnel), material, (used/con-
sumed goods), internal services (machinery, tools, equipment in-
cluding transport and logistics) and contractors (entrepreneurial
production) as well as investment subsidies.
PRIME KPI subgroup on the
basis of Regulation (EU)
2015/1100 (RMMS), Article 2
ERA European Union Agency for Railways Regulation (EU) 2016/796
(ERA)
ERTMS 'European Rail Traffic Management System' (ERTMS) means the
system defined in Commission Decision 2006/679/EC and Com-
mission Decision 2006/860/EC
European Rail Traffic Management System (ERTMS) is the Euro-
pean signalling system consisting the European Train Control
System (ETCS), a standard for in-cab train control, and GSM-R,
the GSM mobile communications standard for railway operations.
ERTMS in operations refers to main tracks equipped with both -
ETCS (European train control system; any baseline or level) and
GSM-R (Global System for Mobile Communications); and where
ETCS and GSM-R are used in service
Commission Decision
2006/679/EC
Commission Decision
2006/860/EC
Failure Termination of an item to perform a given service.
Also see -> Asset failure
SIS-EN 13306:2010

Page: 113
Name Description Source
Financial expenditures Financial expenditures are the ones accounted for in the annual
profit and loss statement. It includes interests and similar charges
which correspond to the remuneration of certain financial assets
(deposits, bills, bonds and credits).
PRIME KPI subgroup on the
basis of Eurostat concepts and
definitions on financial surplus
Freight train Freight (good) train: train for the carriage of goods composed of
one or more wagons and, possibly, vans moving either empty or
under load.
Glossary for Transport Statis-
tics, A.IV-06
Freight train-km Unit of measure representing the movement of all freight trains
over one kilometre. From an IM’s point of view it is important to
include all freight train movements as they all influence the deteri-
oration of the rail infrastructure assets. Empty freight train move-
ments are therefore included in the number of freight train move-
ments.
Glossary for Transport Statis-tics, A.IV-07 LICB Web Glossary, p.19
Funding An amount of money used for a specific purpose, in our case to
finance the IM expenditures.
Longman, Dictionary of contem-
porary English
Grant A direct financial contribution given by the federal, state or local
government or provided from EU funds to an eligible grantee.
Grants are not expected to be repaid and do not include financial
assistance, such as a loan or loan guarantee, an interest rate
subsidy, direct appropriation, or revenue sharing.
PRIME KPI subgroup
Gross tonne km Unit of measure representing the movement over a distance of
one kilometre of one tonne of rail vehicle including the weight of
tractive vehicle.
Glossary for Transport Statis-
tics, A.IV-14
High speed train Train, composed of vehicles designed to operate:
- either at speeds of at least 250 km/h on lines specially built for
high speeds, while enabling operation at speeds exceeding 300
km/h in appropriate circumstances,
- or at speeds of the order of 200 km/h on the lines of section 2.1,
where compatible with the performance levels of these lines.
Glossary for Transport Statis-
tics, A.I-02
Directive (EU) 2016/797 on the
rail interoperability, Annex I, Ar-
ticle 1
High speed track Track (line) whole or part of line, approved for Vmax ≥ 250 km/h
— specially built high-speed lines equipped for speeds generally
equal to or greater than 250 km/h,
— specially upgraded high-speed lines equipped for speeds of
the order of 200 km/h,
— specially upgraded high-speed lines which have special fea-
tures as a result of topographical, relief or town-planning con-
straints, on which the speed must be adapted to each case
The last category also includes interconnecting lines between the
high-speed and conventional networks, lines through stations, ac-
cesses to terminals, depots, etc. travelled at conventional speed
by ‘high-speed’ rolling stock.
Glossary for Transport Statis-
tics, A.I-04
Directive (EU) 2016/797 on the
rail interoperability, Annex I, Ar-
ticle 1
Infrastructure Manager
(IM)
Any firm or body responsible, in particular, for establishing, man-
aging and maintaining railway infrastructure, including traffic man-
agement and control-command and signalling.
An infrastructure manager can delegate to another enterprise the
following tasks: maintaining railway infrastructure and operating
the control and safety system.
'infrastructure manager' means any body or firm responsible in
particular for establishing, managing and maintaining railway in-
frastructure, including traffic management and control-command
and signalling; the functions of the infrastructure manager on a
network or part of a network may be allocated to different bodies
or firms;
Glossary for Transport Statis-
tics. A.III-03
Directive 2012/34/EU (SERA),
Article 3(2)

Page: 114
Name Description Source
Infrastructure Man-
ager’s responsibility for
delay minutes
Table, column 1-, 2-, 3- (Operational and planning management,
Infrastructure installations, Civil Engineering causes). Plus: Delay
minutes caused by weather incidents that have affected the rail-
way infrastructure.
The relevant causes are described in Appendix 2.
UIC CODE, 450 – 2, OR, 5th
edition, June 2009, Appendix A
Interoperability The ability of a rail system to allow the safe and uninterrupted
movement of trains which accomplish the required levels of per-
formance.
Directive (EU) 2016/797 on the
rail interoperability, Article 2(2)
Investments in new in-
frastructure
Investment in new infrastructure means capital expenditure on
the projects for construction of new infrastructure installations for
new lines.
It includes planning (incl. portfolio prioritization, i.e. which invest-
ment projects are realized when and where), tendering disman-
tling (disposal of old equipment), construction, testing and com-
missioning (when track is opened to full-speed operation). Invest-
ments are generally looked on at the level of annual spending
from a cash-flow perspective, i.e. no depreciation or other im-
puted costs are taken into account. It also includes its proportion
of overhead (such as financials, controlling, IT, human resources,
purchasing, legal and planning), labour (operative, personnel),
material, (used/consumed goods), internal services (machinery,
tools, equipment including transport and logistics) and contractors
(entrepreneurial production) as well as investment subsidies.
PRIME KPI subgroup on the
basis of Regulation (EU)
2015/1100 (RMMS), Article 2
Killed (Death (killed
person))
Any person killed immediately or dying within 30 days as a result
of an accident, excluding any suicide.
Glossary for Transport Statis-
tics, A.VI-09
Directive (EU) 2016/798 on rail-
way safety, Annex I, Appendix
1.18
Level crossing Any level intersection between a road or passage and a railway,
as recognised by the infrastructure manager and open to public
or private users. Passages between platforms within stations are
excluded, as well as passages over tracks for the sole use of em-
ployees.
Glossary for Transport Statis-
tics, A. I-14
Directive (EU) 2016/798 on rail-
way safety, Annex I, Appendix
6.3
Level crossing accident Any accident at level crossings involving at least one railway ve-
hicle and one or more crossing vehicles, other crossing users
such as pedestrians or other objects temporarily present on or
near the track if lost by a crossing vehicle or user.
Glossary for Transport Statis-
tics, A. I-15
Directive (EU) 2016/798 on rail-
way safety, Annex I, Appendix
1.8
Line km A cumulative length of all lines maintained by infrastructure man-
agers.
PRIME KPI subgroup based on
Glossary for transport statistics
Main Lines (Principle
railway lines)
Railway lines maintained and operated for running trains. Glossary for transport statistics,
A.I-02.1
Main lines (Principle
railway lines), length of
Cumulative length of railway lines operated and used for running
trains by the end of reporting year.
Excluded are:
- Lines solely used for operating touristic trains and heritage
trains;
- Lines constructed solely to serve mines, forests or other indus-
trial or agricultural installations and which are not open to public
traffic;
- Private lines closed to public traffic and functionally separated
(i.e. stand-alone) networks;
- Private lines used for own freight transport activities or for non-
commercial passenger services and light rail tracks occasionally
used by heavy rail vehicles for connectivity or transit purposes.
Glossary for transport statistics,
A.I-02.1 and A.I-01

Page: 115
Name Description Source
Maintenance cost Costs of function: Maintenance means non-capital expenditure
that the infrastructure manager carries out in order to maintain
the condition and capability of the existing infrastructure or to op-
timise asset lifetimes. Preventive maintenance activities cover in-
spections, measuring or failure prevention. Corrective mainte-
nance activities are repairs (but not replacement), routine over-
hauls or small-scale replacement work excluded from the defini-
tions of renewals. It forms part of annual operating costs. Mainte-
nance expenditure relates to activities that counter the wear, deg-
radation or ageing of the existing infrastructure so that the re-
quired standard of performance is achieved.
Types of costs: Maintenance cost include planning, its proportion
of overhead (such as financials, controlling, IT, human resources,
purchasing, legal and planning), labour (operative, personnel),
material, (used/consumed goods), internal services (machinery,
tools, equipment including transport and logistics) and contractors
(entrepreneurial production).
PRIME KPI subgroup on the
basis of LICB and Regulation
(EU) 2015/1100 (RMMS), Arti-
cle 2
Main track A track providing end-to-end line continuity designed for running
trains between stations or places indicated in timetables, network
statements, rosters or other indications/publications as independ-
ent points of departure or arrival for the conveyance of passen-
gers or goods.
Glossary for Transport Statis-
tics, A.I-01.1
Main track (main track
km), length of
A cumulative length of all running/main tracks
Excluded are:
- Lines solely used for operating touristic trains and heritage
trains;
- Lines constructed solely to serve mines, forests or other indus-
trial or agricultural installations and which are not open to public
traffic;
- Private lines closed to public traffic and functionally separated
(i.e. stand-alone) networks;
- Private lines used for own freight transport activities or for non-
commercial passenger services and light rail tracks occasionally
used by heavy rail vehicles for connectivity or transit purposes
Glossary for Transport Statis-
tics, A.I-02.1 and A.I.01
Main track, electrified Main running tracks provided with an overhead catenary or with
conductor rail (3rd rail) to permit electric traction.
Glossary for transport statistics,
A.I-01.1 and A.I.15
LICB Web Glossary, p.16
Minimum access pack-
age charges
Revenues generated by charging railway undertakings for ena-
bling them to provide their services.
The minimum access package comprises:
(a) handling of requests for railway infrastructure capacity;
(b) the right to utilise capacity which is granted;
(c) use of the railway infrastructure, including track points and
junctions;
(d) train control including signalling, regulation, dispatching and
the communication and provision of information on train move-
ment;
(e) use of electrical supply equipment for traction current, where
available;
(f) all other information required to implement or operate the ser-
vice for which capacity has been granted.
Directive 2012/32/EU, Annex II
Multimodal rail freight
terminals
Multimodal Freight Terminals (IFT) or transfer points are places
equipped for the transhipment and storage of Intermodal
Transport Units (ITU). They connect at least two transport modes,
where at least one of the modes of transport is rail. The other is
usually road, although waterborne (sea and inland waterways)
and air transport can also be integrated.
PRIME KPI subgroup on the
basis of Regulation (EU)
2015/1100 (RMMS), Article 2

Page: 116
Name Description Source
Multimodal transport The carriage of passengers or freight, or both, using two or more
modes of transport;
Regulation (EU) No 1315/2013
(TEN-T), Art.3(n)
Network Principal railway lines managed by the infrastructure manager. Glossary for Transport Statis-
tics, A.I-02.1
Operations Operations excluding maintenance: SS-EN 13306:2010 defines
operation as: Combination of all technical, administrative and
managerial actions, other than maintenance actions that results
in the item being in use.
Total annual expenditures for the IM on operations. Includes op-
erations proportion of the IM overhead (such as financials, con-
trolling, IT, human resources, purchasing, legal and planning), la-
bour (operative, personnel), material (used/consumed goods), in-
ternal services (machinery, tools, equipment including transport
and logistics) and if some parts are handled by contractors it´s to
be included.
(Central or holding overheads are to be allocated proportionally.)
OPEX, operating ex-
penditures
An operating expense is an expense a business incurs through
its normal business operations. Operating expenses include inter
alia maintenance cost, rent, equipment, inventory costs, payroll,
insurance and funds allocated toward research and development.
PRIME KPI subgroup
Other accident Any accident other than a collision of train with rail vehicle, colli-
sion of train with obstacle within the clearance gauge, derailment
of train, level crossing accident, an accident to person involving
rolling stock in motion or a fire in rolling stock.
Example: Accidents caused by rocks, landslides, trees, lost parts
of railway vehicles, lost or displaced loads, vehicles and ma-
chines or equipment for track maintenance
Directive (EU) 2016/798 on rail-
way safety, Annex I, Appendix
1.11
Other track All other tracks than main/running ones:
- tracks maintained, but not operated by the infrastructure man-
ager;
- tracks at service facilities not used for running trains.
Tracks at service facilities not used for running trains are ex-
cluded. The boundary of the service facility is the point at which
the railway vehicle leaving the service facility cannot pass without
having an authorization to access the mainline or other similar
line. This point is usually identified by a signal.
Service facilities are passenger stations, their buildings and other
facilities; freight terminals; marshalling yards and train formation
facilities, including shunting facilities; storage sidings; mainte-
nance facilities; other technical facilities, including cleaning and
washing facilities; maritime and inland port facilities which are
linked to rail activities; relief facilities; refuelling facilities and sup-
ply of fuel in these facilities
Glossary for Transport Statis-
tics A.I-01.2
Passenger Any person, excluding a member of the train crew, who makes a
trip by rail, including a passenger trying to embark onto or disem-
bark from a moving train for accident statistics only
Glossary for Transport Statis-
tics, A.VI-18
Directive (EU) 2016/798 on rail-
way safety, Annex I, Appendix
1.12
Passenger-km Unit of measurement representing the transport of one passenger
by rail over a distance of one kilometre. The distance to be taken
into consideration should be the distance actually travelled by the
passenger on the network. To avoid double counting each coun-
try should count only the pkm performed on its territory. If this is
not available, then the distance charged or estimated should be
used.
Glossary for Transport Statis-
tics, A.V-06

Page: 117
Name Description Source
Passenger train-km Unit of measure representing the movement of all passenger
trains over a distance of one kilometre. From an IM’s point of
view it is important to include all passenger train movements as
they all influence the deterioration of the rail infrastructure assets.
Empty passenger train movements are therefore included in the
number of passenger train movements.
Glossary for Transport Statis-
tics, A.IV-07
LICB Web Glossary, p.18
Passenger trains Train for the carriage of passengers composed of one or more
passenger railway vehicles and, possibly, vans moving either
empty or under load.
Glossary for Transport Statis-
tics, A.IV-06 and A.IV-05
Permanent restrictions Restrictions are defined as permanent if they are incorporated
within the yearly timetable.
PRIME KPI subgroup
Punctuality “Punctuality of a train is measured on the base of comparisons
between the time planned in the timetable of a train identified by
its train number and the actual running time at certain measuring
point. A measuring point is a specific location on route where the
trains running data are captured. One can choose to measure the
departure, arrival or run through time”.
“Punctuality are measured by setting up a threshold up to which
trains are considered as punctual and building a percentage.”
When measuring punctuality following are to be included all in
service trains, i.e. Freight and passenger but excluding Empty
Coaching Stock movements and engineering trains.
UIC CODE, 450 – 2, OR, 5th
edition, June 2009, 4 Measure-
ment of punctuality
Railway line Line of transportation made up by rail exclusively for the use of
railway vehicles and maintained for running trains. A line is made
up of one or more tracks and the corresponding exclusion criteria.
Glossary for Transport Statis-
tics, A.I-02
Recycling Reprocessing by means of a manufacturing process, of a used
product material into a product, a component incorporated into a
product, or a secondary (recycled) raw material; excluding, en-
ergy recovery and the use of the product as a fuel.
Recycling of waste is any activity that includes the collection and
processing of used or unused items that would otherwise be con-
sidered waste. Recycling involves sorting and processing the re-
cyclable products into raw material and then using the recycled
raw materials to make new products.
ISO 18604:2013, 3.3

Page: 118
Name Description Source
Renewal expenditure Renewals mean capital expenditure on a major substitution work
on the existing infrastructure which does not change its overall
original performance. Renewals are projects where existing infra-
structure is replaced with new assets of the same or similar type.
Usually it is a replacement of complete systems or a systematic
replacement of components at the end of their lifetimes. The bor-
derline to maintenance differs among the railways. Usually it de-
pends on minimum cost levels or minimum scope (e.g. km). It is
capitalised at the time it is carried out, and then depreciated. Re-
newals include planning (incl. portfolio prioritisation, i.e. which re-
newal projects are realised when and where), tendering, disman-
tling/disposal of old equipment, construction, testing and commis-
sioning (when track is opened to full-speed operation). Renewals
are generally looked at on the level of annual spending from a
cash-flow perspective, i.e. no depreciation or other imputed costs
are taken into account.
Excluded are definitely construction of new lines (new systems)
or measures to raise the standard of existing infrastructure trig-
gered by changed functional requirements (and not triggered by
lifetime!) or "forced" investments when acting on regulations.
It includes its proportion of overhead (such as financials, control-
ling, IT, human resources, purchasing, legal and planning), labour
(operative, personnel), material, (used/consumed goods), internal
services (machinery, tools, equipment including transport and lo-
gistics) and contractors (entrepreneurial production) as well as in-
vestment subsidies.
PRIME KPI subgroup on the
basis of Regulation (EU)
2015/1100 (RMMS), Article 2
Serious injury (seriously
injured person)
Any person injured who was hospitalised for more than 24 hours
as a result of an accident, excluding any attempted suicide.
Glossary for Transport Statis-
tics, A. VII-10
Directive (EU) 2016/798 on rail-
way safety, Annex I, Appendix
1.19
Significant accident Any accident involving at least one rail vehicle in motion, resulting
in at least one killed or seriously injured person, or in significant
damage to stock, track, other installations or environment, or ex-
tensive disruptions to traffic, excluding accidents in workshops,
warehouses and depots.
Glossary for Transport Statis-
tics, A.VII-04
Directive (EU) 2016/798 on rail-
way safety, Annex I, Appendix
1.1
Significant damage Damage that is equivalent to EUR 150 000 or more. Glossary for Transport Statis-
tics, A.VI-04
Directive (EU) 2016/798 on rail-
way safety, Annex I, Appendix
1.2
TAC Total Includes charges for minimum Track Access Charges for the pas-
senger, freight and service train path. Mark-ups. No other charg-
ing components is included.
Temporary restrictions Restrictions that occur during the year, not included in the yearly
timetable.
TEN-T requirements Infrastructure requirements as set in Article 39 of the Regulation
(EU) No 1315/2013 on Union guidelines for the development of
the trans-European transport network.
http://publications.europa.eu/resource/cellar/f277232a-699e-
11e3-8e4e-01aa75ed71a1.0006.01/DOC_1
Regulation (EU) No 1315/2013
(TEN-T)

Page: 119
Name Description Source
Track A pair of rails over which rail borne vehicles can run maintained
by an infrastructure manager. Metro, Tram and Light rail urban
lines are excluded.
Excluded are:
- Lines solely used for operating touristic trains and heritage
trains;
- Lines constructed solely to serve mines, forests or other indus-
trial or agricultural installations and which are not open to public
traffic;
- Private lines closed to public traffic and functionally separated
(i.e. stand-alone) networks;
- Private lines used for own freight transport activities or for non-
commercial passenger services and light rail tracks occasionally
used by heavy rail vehicles for connectivity or transit purposes.
Glossary for Transport Statis-
tics, A.I-01
Track buckle or other
track misalignment
Any fault related to the continuum and the geometry of track, re-
quiring track to be placed out of service or immediate restriction
of permitted speed.
Directive (EU) 2016/798 on rail-
way safety, Annex I, Appendix
4.2
Track km A cumulative length of all tracks maintained by the infrastructure
manager; each track of a multiple-track railway line is to be
counted
PRIME subgroup, based on
Glossary for Transport Statis-
tics
Trackside Area adjacent to a railway track such as embankments, level
crossings, platforms, shunting yards.
Workshops, warehouses and depots are excluded.
PRIME KPI subgroup
Train One or more railway vehicles hauled by one or more locomotives
or railcars, or one railcar travelling alone, running under a given
number or specific designation from an initial fixed point to a ter-
minal fixed point, including a light engine, i.e. a locomotive travel-
ling on its own.
In this document we define trains as the sum of passenger’s
trains and freight trains.
Glossary for Transport Statis-
tics, A.IV-05 and A.IV-06
Train-km The unit of measure representing the movement of a train over
one kilometre.
The distance used is the distance actually run, if available, other-
wise the standard network distance between the origin and desti-
nation shall be used. Only the distance on the national territory of
the reporting country shall be taken into account.
Glossary for Transport Statis-
tics, A.IV-05
Directive (EU) 2016/798 on rail-
way safety, Annex I, Appendix
7.1
Traffic Management
Cost
Costs of functions: Traffic management comprises the control of
signal installations and traffic, planning as well as path allocation.
Types of costs: Traffic management includes planning, its propor-
tion of overhead (such as financials, controlling, IT, human re-
sources, purchasing, legal and planning), labour (operative, per-
sonnel), material, (used/consumed goods), internal services (ma-
chinery, tools, equipment including transport and logistics) and
contractors (entrepreneurial production).
PRIME KPI subgroup on the
basis of UIC studies (CENOS
and OMC)
Working timetable The data defining all planned train and rolling-stock movements which will take place on the relevant infrastructure during the pe-riod for which it is in force
Directive 2012/34/EU (SERA),
Article .3(28)