2018 ruffed grouse and american woodcock status in michigan · ruffed grouse and american woodcock...
TRANSCRIPT

1
Michigan Department of Natural Resources Wildlife Report No. 3658 September 2018
Printed by Authority of: P.A. 451 of 1994 Total Number of Copies Printed: 207 Cost per Copy:................................$0.84 Total Cost: ................................... $174.00 Michigan Department of Natural Resources
RUFFED GROUSE AND AMERICAN WOODCOCK STATUS IN MICHIGAN, 2018
C. Alan Stewart and Lori Sargent
ABSTRACT
Hunter cooperator surveys, spring breeding surveys, and mail harvest surveys are conducted each year to monitor Ruffed grouse (Bonasa umbellus) and American woodcock (Scolopax minor) populations. Annual data comparisons are described for hunter cooperator survey (2016–2017), American woodcock spring breeding surveys (2017-2018), and mail harvest survey (2010-2011). Ruffed grouse cooperators hunting the first 4 days of ruffed grouse season reported an average 1.83 grouse per hour in 2017 compared to 1.93 grouse per hour in 2016. The usual spring drumming grouse surveys were not conducted this year because of concerns over past open records requests from a hunter whose activities jeopardized the validity of the survey. There was a decrease detected in Michigan’s woodcock index based on the singing-ground survey from 2017-2018 and during the ten-year trend from 2008-2018. Significant long-term (1968-2018) declines were detected regionally and statewide, respectively. Woodcock banders in Michigan spent 1,669 hours afield in 2018 and banded 561 chicks. There were about 45 chicks observed and 34 chicks banded per 100 hours of search time, compared to 67 chicks observed and 48 banded in 2017. There were 112 ruffed grouse drumming routes surveyed in 2015 and 105 in 2014. An estimated 260,741 grouse were harvested in Michigan during the 2011 season which was not significantly different then the number harvested in 2010 (260,207).
A contribution of Federal Aid in Wildlife Restoration, Michigan Project W-147-R.
IC 2578-1 (09/15/2016)
Equal Rights for Natural Resource Users The Michigan Department of Natural Resources (MDNR) provides equal opportunities for employment and access to Michigan’s natural resources. Both State and Federal laws prohibit discrimination on the basis of race, color, national origin, religion, disability, age, sex, height, weight or marital status under the Civil Rights Acts of 1964, as amended (MI PA 453 and MI PA 220, Title V of the Rehabilitation Act of 1973 as amended, and the Americans with Disabilities Act). If you believe that you have been discriminated against in any program, activity, or facility, or if you desire additional information, please write the MDNR, HUMAN RESOURCES, PO BOX 30028, LANSING MI 48909-7528, or the MICHIGAN DEPARTMENT OF CIVIL RIGHTS, STATE OF MICHIGAN PLAZA BUILDING, 1200 6TH STREET, DETROIT MI 48226, or the OFFICE FOR DIVERSITY AND CIVIL RIGHTS, US FISH AND WILDLIFE SERVICE, 4040 NORTH FAIRFAX DRIVE, ARLINGTON VA 22203. For information or assistance on this publication, contact: MDNR, WILDLIFE DIVISION, P.O. BOX 30444, LANSING, MI 48909-7944, -or- through the internet at “ http://www.michigan.gov/dnr.” This publication is available in alternative formats upon request. TTY/TTD (teletype): 711 (Michigan Relay Center).
2
Introduction Ruffed grouse and American woodcock are forested game birds that are pursued and appreciated from many people. In 2011, about 77,283 hunters pursued grouse and 32,254 pursued woodcock in the State of Michigan (Frawley 2014). In 2015, about 26,000 hunters pursued woodcock (Cooper & RAU 2015).
In addition, the federal Harvest Information Program indicates that Michigan leads the nation in the number of active woodcock hunters and harvest (Cooper & Rau 2016). Non-hunters also value ruffed grouse and American woodcock. Bird watchers, hikers, bikers, campers, and others familiar with Michigan’s woods know ruffed grouse well for the soft beat of a drumming male and the surprising start of an explosive grouse flush. Bird watchers explore open areas on spring mornings and evenings to observe the woodcock’s unique and entertaining courtship display. For these and many other reasons, ruffed grouse and American woodcock are valuable Michigan wildlife resources. The Department of Natural Resources (DNR) uses several surveys to monitor ruffed grouse and woodcock populations. Hunter cooperator surveys, spring breeding surveys, and harvest surveys contribute valuable management information each year. Ruffed grouse and woodcock spring surveys are conducted by DNR staff, biologists from other agencies, and volunteers. The hunter cooperator survey is made possible through data collected by volunteer hunters and shared with the DNR. Harvest information is collected from a random sample of license buyers after the end of each hunting season. The results from the most current hunting seasons and breeding seasons are described in this report.
Methods 2010 – 2011 Harvest Survey Questionnaires are sent to a randomly selected set of people who had purchased a small game hunting license during the previous hunting seasons. Detailed methods and results from the 2011 small game harvest survey are compiled in a separate report (Frawley 2014). Findings pertaining to ruffed grouse and woodcock have been summarized in the results section of this report. 2016 – 2017 Comparisons Hunter Cooperator Surveys Hunter Cooperator surveys rely on volunteer hunters that record numbers of hours hunted and ruffed grouse and woodcock flushed each day of hunting. Data obtained from cooperating hunters are summarized by county and by two-week intervals as the average number of grouse or woodcock flushed per hour of hunting. Hunting data were excluded from analyses when effort was <20 hours. Flush rates reported by cooperators provide an early indicator of harvest, but the final estimates of hunting effort and harvest come from a post-season mail survey of randomly selected hunters (Frawley, et al. 2010). Full season data from 2016 and 2017 were available for analyses.
3
2016 – 2017 Comparisons Spring Breeding Surveys Department of Natural Resources personnel and volunteers conduct spring breeding surveys of ruffed grouse and woodcock along roadside routes. Each route has ten listening stops that are consistent from year to year. The number of ruffed grouse drums or woodcock heard during a fixed time interval (four and two minutes, respectively) is recorded at each stop. Because timing of breeding and habitat preferences differ for the two species, separate surveys are conducted. The woodcock singing-ground survey is coordinated by the United States Fish and Wildlife Service (USFWS) in cooperation with the DNR. The grouse drumming survey is coordinated by the DNR. Ruffed grouse survey routes were established in locations of known grouse populations. Similarly, before 1968, woodcock routes were established in locations of known woodcock populations. However, beginning in 1968, the USFWS established woodcock routes within randomly-chosen 10-minute blocks (Seamans and Rau 2017). Data for both surveys are summarized as the number of woodcock or grouse heard per survey route. In addition, volunteers band woodcock each spring to monitor recruitment and trends in survival. The data are summarized as the number of woodcock chicks observed and banded per 100 hours of effort.
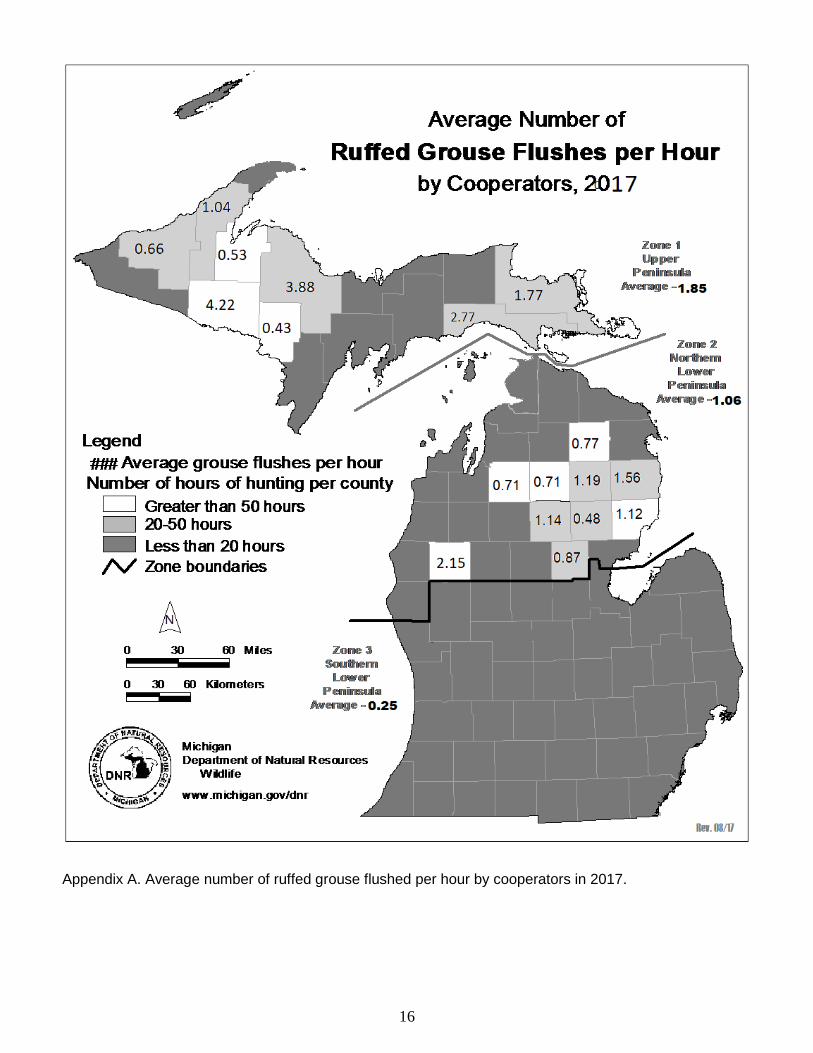
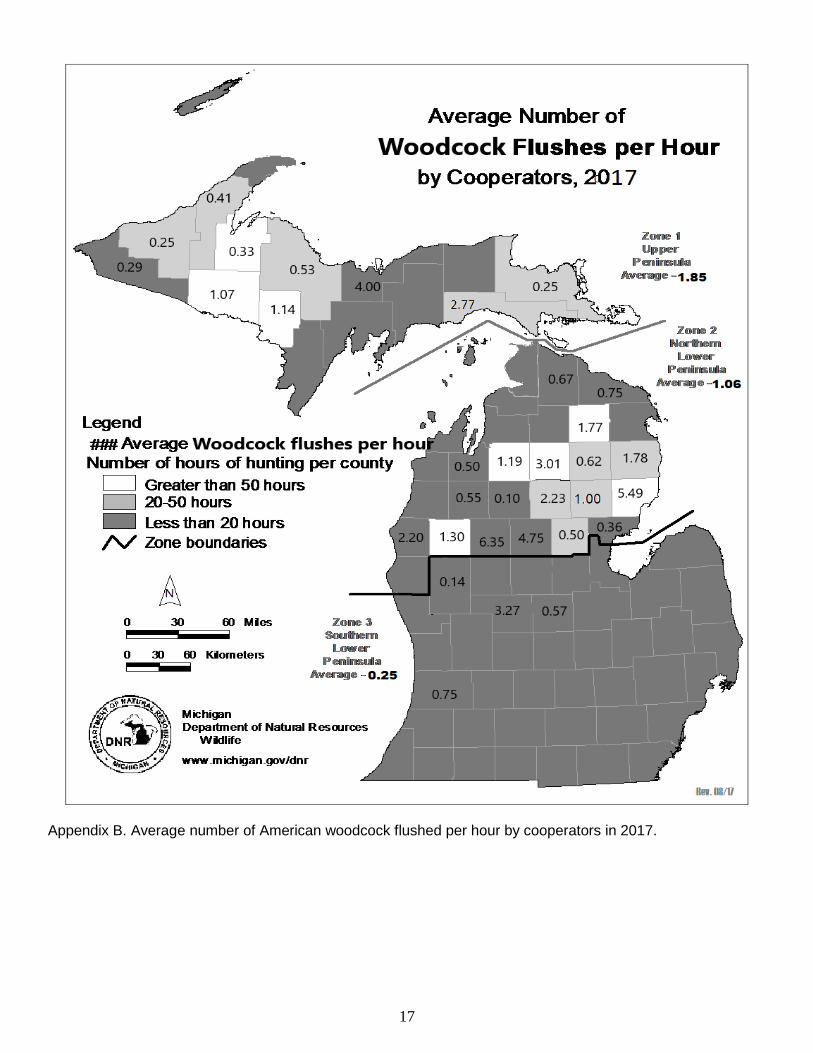
Results 2010 – 2011 Comparisons Harvest Surveys An estimated 260,741 grouse were harvested in Michigan during 2011 which was not significantly different that 260,207 harvested in 2010 (Frawley 2014) (Figure 6). Approximately 77,283 grouse hunters spent nearly 579,171 days afield hunting grouse in Michigan during 2011 hunting season (Figure 6). Approximately 32,254 hunters harvested about 94,657 woodcock and spent 207,295 days afield in 2011 (Frawley 2014). The number of woodcock hunters in 2011 was not statistically significant from 2010. The 2011 harvest was approximately 75% lower than the record harvest of 390,000 woodcock in 1976. However, there also were more hunters (126,000) spending more days afield (908,000) in 1976 than in 2011 (Figure 1). The average number of woodcock harvested per hunter day was higher in 2011 than in 1976, respectively (Figure 2). 2016 – 2017 Comparisons Hunter Cooperator Surveys Hunter records were available from 121 cooperators who spent 1,445 hours afield in 2017 and 104 cooperators who spent 5,940 hours afield in 2016. The average number of ruffed grouse flushed per hour by cooperators in 2017 (1.40) was slightly lower than the number of ruffed grouse flushed per hour in 2016 (1.63). Ruffed grouse flush rates were the highest in Zone 1 (Upper Peninsula; 1.85), followed by Zone 2 (Northern Lower Peninsula; 1.06) and Zone 3 (Southern Lower Peninsula; 0.25) (Figure 3 and appendix A). The highest average flush rate was during November 1st-14th in Zone 1 (table 1). The average number of American woodcock flushed per hour statewide by cooperators was significantly higher in 2017 (1.46) than 2016 (1.08). American woodcock flush rates were highest in
4
Zone 2 (2.07), followed by Zone 3 (1.02) and Zone 1 (0.83) (Figure 4 and appendix B). Average flush rates peaked during October 1st – 15th in Zone 3 and Zone 2. 2016 – 2017 Comparisons Spring Breeding Surveys Ruffed Grouse Drumming Survey Due to unforeseen external affairs, the 2017 grouse drumming survey was not conducted. Currently, the division is evaluating the future of conducting the survey annually. Therefore, previous year’s survey results are provided within this report. Ruffed grouse drumming counts were conducted statewide from 112 survey routes during April and May 2015. There was an average of 14.21 drums heard per routes statewide, a 14% increase from 2014 (12.43) average (Figure 8). Highest drumming counts were in Zone 1 (Upper Peninsula; 16.59), following Zone 2 (Northern Lower Peninsula; 13.42) and Zone 3 (Southern Lower Peninsula; 7.78) (Figure 7). In 2014, 110 survey routes were conducted statewide and paired t-test were performed to statistically compare data from 103 identical routes run in both 2014 and 2015. Statewide there was a 14% increase (n=103; t=-1.68, P=0.09) in the average number of drums heard per route between 2014 (12.52) and 2015 (14.24). Analysis at the regional scale indicated there was no significant difference (n=42; t=-1.13, P=0.27) in the number of drums heard per route in Zone 1 (Upper Peninsula) between 2014 (14.51) and 2015 (16.33). There was no significant difference in the average number of drums heard per route in Zone 2 (Northern Lower Peninsula) between 2014 (12.02) and 2015 (13.58; n=53; t=-1.05, P=0.30). In Zone 3, there were 6 routes conducted in both 2013 and 2014. Due to the low sample size, statistical analysis at the Zone 3 regional scale is not appropriate. 2017 – 2018 Comparisons Woodcock Singing-ground Survey Results of Michigan Woodcock Singing-ground survey were based on preliminary analysis of data from 112 routes (Seamans and Rau 2018). There were no significant changes detected in the woodcock index for Michigan in 2017 and 2018. An average of 5.16 and 3.87 singing males were heard per route in 2017 and 2018, respectively. The 2018 central region index, consisting of information from Illinois, Indiana, Manitoba, Michigan, Minnesota, Ohio, Ontario and Wisconsin, was not significantly different from 2017 (n=460, P>0.05). In Central Region, there was an average of 2.91 and 2.41 singing males heard per route in 2017 and 2018, respectively (Seamans and Rau 2018). A significant trend in the number of singing males was detected in Michigan and Central Region during the 10-year trend (2008-2018). Michigan and the Central Region have experienced an average long-term decline of 1.31% and 0.96% per year, respectively, since 1968 (P<0.05; Seamans and Rau 2018). Woodcock Banding Program For 2018, 69 woodcock banders spent 1,669 hours afield, located and banded 589 birds. Average brood size for 2018 was 3.0 chicks. The number of chicks banded per 100 hours afield was 33.6 and the number of chicks observed per 100 hours afield was 45.1. In 2017, 77 woodcock banders spent 1,941 hours afield, located 421 broods and banded 968 birds. Average brood size for 2017 was 3.1. The number of chicks banded per 100 hours afield was 47.9 and the number of chicks observed per 100 hours afield was 67.2 in 2017.

5
Discussion 2018 Grouse Population Status Ruffed grouse are early successional forest specialists that thrive in landscapes with even distribution of habitat types and interspersion among even-aged habitats. Even in areas with quality habitat, ruffed grouse populations exhibit ten-year cycles in abundance over much of Canada, Alaska and the Great Lake States of Wisconsin, Minnesota and Michigan (Rusch et al. 1999). This cycle is evident throughout the Midwestern states such as Michigan, Minnesota and Wisconsin (Figure 5). Over the years, many theories have been proposed to explain these cycles including diseases, weather, forest fires, sunspots, starvation, crowding, predators, genetic changes, and chance (Rusch 1989). Another possible contributing factor of population fluctuations may involve food options. Quaking aspen (Populus tremuloides) is an important food source for grouse, especially during the winter and early spring (Svoboda and Gullion 1972). Aspen trees produce a compound called coniferyl benzoate (CB) that acts as a natural feeding deterrent for grouse and other birds, and this level can vary between years and between trees (Jakubas and Gullion 1991). Grouse have tendencies to use specific clones of aspen due to their history of having low concentrations of the deterrent (Jakubas and Mason 1991). Lack of suitable aspen in the winter may cause grouse to expend more energy and to be more susceptible to predation when feeding on other food sources (Jakubus and Gullion 1991). With the snowshoe hare and ruffed grouse having synchronized cycles, Donald Rusch found predation mortality on ruffed grouse climbed when large fluxes of raptors migrate south into the northern United States during a decline in snowshoe hares in their Canadian home range (Rusch 1982). The most recent high in grouse abundance occurred during 2010 for most of Michigan (Figure 3 and 7). Historically, this projects the low in grouse abundance to occur in 2015. Flush rates will be down slightly or about the same as last year. Spring weather conditions may have impacted grouse production again this year. In Wisconsin, statewide ruffed grouse drumming activity decreased 34% between 2017 and 2018, based on the roadside survey to monitor breeding grouse activity. In Minnesota, mean ruffed grouse drums per stop were 1.5 statewide and decreased 29% from the previous year. An increase was expected given that the ruffed grouse population is in the increasing phase of the 10-year cycle. The recent winter weather showed above average adverse conditions with early summerlike conditions with pockets of variability throughout the state. The spring got off to a late start with low temperatures lingering in the early months and above average temperatures towards the end. Precipitation was prominent later in the spring, which will give way to favorable conditions for spring breeding. Summer is projected to bring above average temperatures, with drier conditions scattered throughout the state. Based on current survey data and conditions, hunters may expect a hunting season similar or slightly up following the low in the ten-year cycle. Hunters should note, that the abundance at the regional scale does not reflect the same trend locally. The ruffed grouse season begins on September 15, statewide. Areas of good habitat will continue to provide the best grouse hunting opportunities. Grouse are most abundant in areas where dense young forest habitats (5-15 years old) are common (Association of Fish and Wildlife Agencies Resident Game Bird Working Group 2006). The best grouse cover is usually provided by dense aspen stands 6 to 15 years old or older stands with dense understories of alder or hazel (Thompson and Dessecker 1997). With the help from hunters and partners, the Department of Natural Resources continues to expand a series of intensively managed, walk-in access ruffed grouse hunting areas across the Northern Lower and Upper Peninsulas. These Grouse Enhanced Management Sites (GEMS) provide an amazing and adventurous opportunity for a variety of hunter types – youth, adults new to the sport and seniors all have the capability of being more comfortable with easily marked trails and maps currently at 19
6
GEMS. With 19 locations and still growing throughout Michigan, this new management system promotes hunter recruitment and retention while expanding local economies and timber harvest opportunities. Efforts to expand publicly accessible lands by developing GEMs provides significant economic and recreational impacts towards Michigan’s communities. An estimated annual economic benefit from publically accessible hunting land from the average ruffed grouse hunter is $235.74, which is 285% and 265% greater than the annual economic benefits from the average firearm deer hunter and archery hunter, respectively (Knoche and Lupi 2013). The three types of publicly accessible hunting lands (state, federal and commercial) in Michigan together generate about $20.8 million in economic benefits annually for ruffed grouse hunters (Knoche and Lupi 2013). Michigan is one of the top three states in the country for ruffed grouse hunting and we are a destination state for out-of-state hunters, especially in the Upper Peninsula. To learns about GEMS please visit, www.michigan.gov/gems. We encourage hunters in Michigan to use the DNR’s online mapping application, MI-Hunt, to search for habitat types on public hunting lands. There are multiple layers of information that can be turned on or off, depending on your needs. For example, you can view the different forest types, topography, satellite imagery, and road layers to help plan your trip. See www.michigan.gov/mihunt for more details about this interactive mapping application. 2018 Woodcock Population Status The long-term decline in the woodcock population index raises questions and concerns about available habitat and the effects of hunting. The declining availability of quality habitat is believed to be a primary cause for the decline in the population (Dessecker and Pursglove 2000). Also, the declines in young forest habitats and the isolation of these habitats in some landscapes may be limiting ruffed grouse and woodcock recruitment and therefore population densities (Dessecker & McAuley 2001). Game population surveys have indicated woodcock populations are currently among their lowest recorded levels since the 1960s. Although many game species are not as abundant today as during previous decades, the mean number of animals taken per hunting effort has not paralleled changes in the populations in Michigan, respectively (Frawley 2014). Federal surveys show that Michigan is still the number one state in the country for American woodcock harvest and one of the top production state (Cooper & Rau 2015). A North American Woodcock Conservation Plan was written to help guide woodcock management in each region of the continent within woodcock range. The document is available online at www.michigan.gov/dnr or www.timberdoodle.org. Professionals are also working on developing habitat initiatives where the plan will be used to guide the creation of quality habitat that will benefit woodcock as well as other species that have similar habitat requirements. More woodcock are banded in Michigan than in any other state or Canada. In fact, since 1981, Michigan banders have banded over 20,000 woodcock more than the next largest banding state (Maine)(Mayhew and Luukkonen 2010). Woodcock survival estimates based on Michigan woodcock banding data analyses are reported by Krementz et al. (2003) and Mayhew and Luukkonen (2010). Hunters can promote sound woodcock management by promptly reporting all banded birds harvested, including date and location taken. To report bands, visit www.reportband.gov, call 800-327-BAND or write USGS Patuxent Wildlife Research Center, Bird Banding Laboratory, 12100 Beach Forest Road, Laurel, MD 20708-4037. The USFWS has adjusted woodcock hunting season dates and reduced bag limits four times since 1968 in response to the general status of woodcock. In 2018, the opening date for woodcock hunting will be September 22nd. The USFWS framework for Michigan allows for the woodcock hunting season to open no earlier than the Saturday closest to September 22nd and to run for no more than
7
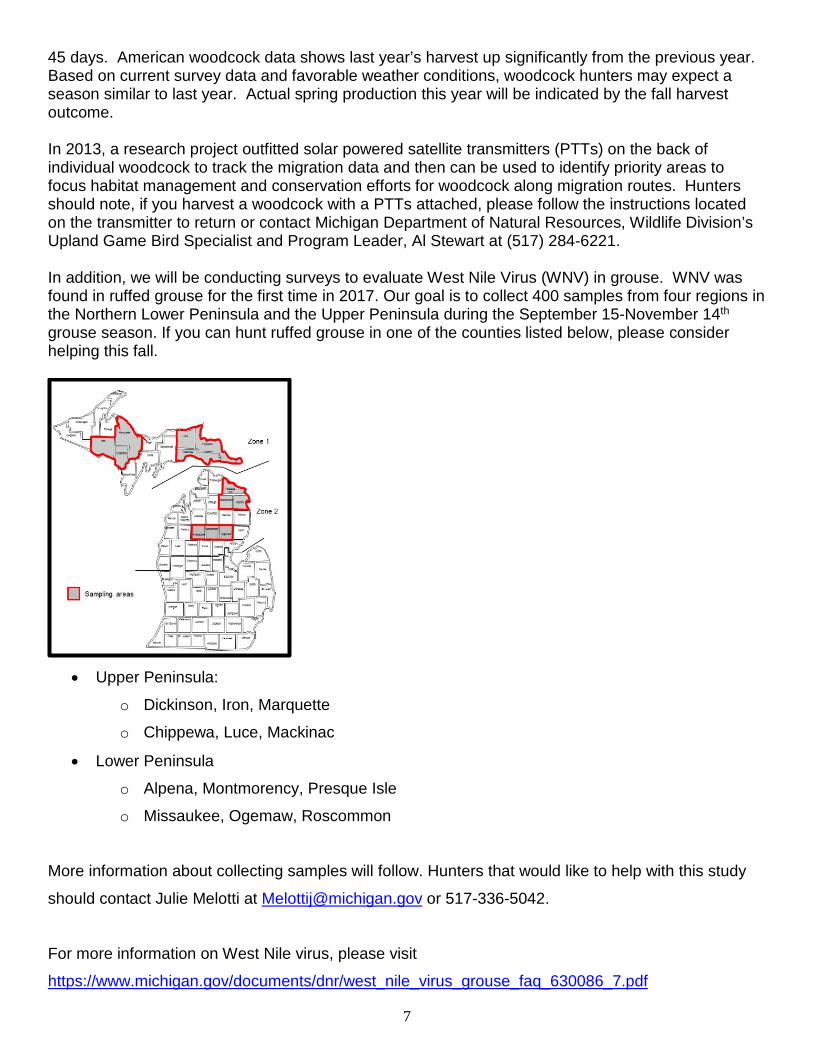
45 days. American woodcock data shows last year’s harvest up significantly from the previous year. Based on current survey data and favorable weather conditions, woodcock hunters may expect a season similar to last year. Actual spring production this year will be indicated by the fall harvest outcome. In 2013, a research project outfitted solar powered satellite transmitters (PTTs) on the back of individual woodcock to track the migration data and then can be used to identify priority areas to focus habitat management and conservation efforts for woodcock along migration routes. Hunters should note, if you harvest a woodcock with a PTTs attached, please follow the instructions located on the transmitter to return or contact Michigan Department of Natural Resources, Wildlife Division’s Upland Game Bird Specialist and Program Leader, Al Stewart at (517) 284-6221. In addition, we will be conducting surveys to evaluate West Nile Virus (WNV) in grouse. WNV was found in ruffed grouse for the first time in 2017. Our goal is to collect 400 samples from four regions in the Northern Lower Peninsula and the Upper Peninsula during the September 15-November 14th grouse season. If you can hunt ruffed grouse in one of the counties listed below, please consider helping this fall.
• Upper Peninsula:
o Dickinson, Iron, Marquette
o Chippewa, Luce, Mackinac
• Lower Peninsula
o Alpena, Montmorency, Presque Isle
o Missaukee, Ogemaw, Roscommon
More information about collecting samples will follow. Hunters that would like to help with this study
should contact Julie Melotti at [email protected] or 517-336-5042.
For more information on West Nile virus, please visit
https://www.michigan.gov/documents/dnr/west_nile_virus_grouse_faq_630086_7.pdf

8
ACKNOWLEDGMENTS We thank all the cooperators who provided grouse and woodcock hunting records and participated in banding woodcock. Many DNR employees and volunteers conducted spring breeding surveys and assisted in data entry. Artwork was drawn by Jennifer Kleitch. Al Stewart reviewed an earlier version of this report. Portions of this report were copied in part from previous status reports. Similar reports may be found at www.michigan.gov/dnr.

9
LITERATURE CITED Association of Fish & Wildlife Agencies Resident Game Bird Working Group. 2006. Ruffed grouse
conservation plan. Edited by D.R. Dessecker, G.W. Norman, and S.J. Williamson. Washington, D.C., USA.
Dessecker, Daniel R. McAuley, Daniel G. Importance of Early Successional Habitat to Ruffed Grouse
and American Woodcock. Wildlife Society Bulletin 2011, 29(2): 456-465. Dessecker, D. R., and S. R. Pursglove, Jr. 2000. Current population status and likely future Trends
for American woodcock. Proceedings of the American Woodcock Symposium 9:3-8. Dexter, M. H., compiler. 1999. Status of wildlife populations, fall 1999. Unpublished Report, Section
of Wildlife, Minnesota Department of Natural Resources, St. Paul, Minnesota, USA. Dhuey, Brian. 2016. Ruffed Grouse Drumming survey, 2015. Bureau of Science Services,
Wisconsin Department of Natural Resources, Madison, Wisconsin, USA Dhuey, Brian. 2014. Small Game Harvest Report, 2013 – 2014. Bureau of Science Services,
Wisconsin Department of Natural Resources, Madison Wisconsin, USA. Frawley, B. 2012. 2010 Small Game Harvest Survey. Wildlife Division Report 3542. Michigan
Department of Natural Resources, Lansing, Michigan, USA. Frawley, B. 2014. 2011 Small Game Harvest Survey. Wildlife Division Report 2011. Michigan
Department of Natural Resources, Lansing, Michigan, USA. Jakubas, W. J., and G. W. Gullion. 1991. Use of quaking aspen flower buds by ruffed grouse: its
relationship to grouse densities and bud chemical composition. The Condor 93(3):473-485. Jakubas, W. J., and J. R. Mason. 1991. Role of Avian Trigeminal Sensory System in Detecting
Coniferyl Benzoate, a Plant Allelochemical. Journal of Chemical Ecology, 17:2213-2221. Knoche, S. and Lupi, Frank. 2013. Economic Benefits of Publicly Accessible Land for Ruffed Grouse
Hunters. The Journal of Wildlife Management 77(7): 1294-1300. Krementz, D. G., J. E. Hines, and D. R. Luukkonen. 2003. Survival and recovery rates of American woodcock banded in Michigan. Journal of Wildlife Management 67:398-407. Mayhew, S. L, and D. R. Luukkonen. 2010. Survival and Recovery of Woodcock Banded in
Michigan, 1981-2004. Proceedings of the American Woodcock Symposium 10:169-174 Roy, Charlotte. 2016. Minnesota Spring Grouse Surveys, 2015. Forest Wildlife Populations and
Research Group, Minnesota Department of Natural Resources, Grand Rapids, Minnesota. Rusch, D. H. 1989. The grouse cycle. Pages 210-226 in S. Atwater and J. Schnell editors. Ruffed
Grouse. Stackpole Books. Harrisburg, Pennsylvania, USA. Rusch, D. H., J. R. Cary, and L. B. Keith. 1999. Pattern and process in ruffed grouse cycles.
Midwest Fish and Wildlife Conference 61:238.

10
Seamans, M.E. and R. Rau, 2018. American woodcock population status, 2017. U.S. Fish and
Wildlife Service, Laurel, Maryland, USA. Svoboda, F. J., and G. W. Gullion. 1972. Preferential use of aspen by ruffed grouse in northern
Minnesota. Journal of Wildlife Management 36(4):1166-1180. Thompson, F. R., III, and D. R. Dessecker. 1997. Management of early-successional
communities in central hardwood forests. U.S. Department of Agriculture Forest Service, General Technical Report NC-195.

11
Table 1. Average ruffed grouse and American woodcock flushes per houra, by two-week intervals, as reported by cooperating hunters in 2017. Species and Dates Zone 1 Zone 2 Zone 3 Ruffed Grouse September 15-30 0.72 1.18 0.00 Ruffed Grouse October 1-15 1.40 1.08 0.00 Ruffed Grouse October 16-31 2.32 0.95 0.19 Ruffed Grouse November 1-14 2.57 0.86 0.16 Ruffed Grouse December 1-15 N/A 2.04 N/A Ruffed Grouse December 16-January 1 N/A 0.27 0.89 Woodcock September 15-30 0.30 2.46 1.52 Woodcock October 1-15 0.90 2.50 2.50 Woodcock October 16-31 1.18 1.56 1.29 Woodcock November 1-14 N/A 0.46 1.94 Woodcock December 1-15 N/A 0.00 0.70 Woodcock December 16-January 1 N/A 0.00 0.00
Figure 1. Mail survey estimates of the number of American woodcock hunters, hunter days, and harvest in Michigan, 1960-2011 (estimates not available for 1984).
0
100,000
200,000
300,000
400,000
500,000
600,000
700,000
800,000
900,000
1,000,000
1960
1962
1964
1966
1968
1970
1972
1974
1976
1978
1980
1982
1984
1986
1988
1990
1992
1994
1996
1998
2000
2002
2004
2006
2008
2010
Estim
ated
Tot
als
Year
Hunters
Hunter Days
Harvest

12
Figure 2. Mail survey estimates of woodcock harvest per hunter day in Michigan, 1960-2011 (estimates are not available for 1984).
Figure 3. Ruffed grouse flush rates reported by cooperating hunters, 1957-2017.
0
0.1
0.2
0.3
0.4
0.5
0.6
1960
1962
1964
1966
1968
1970
1972
1974
1976
1978
1980
1982
1984
1986
1988
1990
1992
1994
1996
1998
2000
2002
2004
2006
2008
2010
Harv
est p
er H
unte
r Day
Year
0.00
0.50
1.00
1.50
2.00
2.50
3.00
3.50
1957
1959
1961
1963
1965
1967
1969
1971
1973
1975
1977
1979
1981
1983
1985
1987
1989
1991
1993
1995
1997
1999
2001
2003
2005
2007
2009
2011
2013
2015
2017
Ruffe
d G
rous
e Fl
ush
Rate
s/Ho
ur
Year
Ruffed Grouse Flush Rates per Hour by Year
Zone 1
Zone 2
Zone 3

13
Figure 4. American Woodcock flush rates reported by cooperating hunters, 1957-2017.
Figure 5. Ruffed grouse breeding population indices from Michigan (drums per route), Minnesota and Wisconsin (drums per stop), 1990-2016. Michigan statewide data is not available for 1996, 1997, 2007, 2009, 2016, 2017 and 2018.
0.00
0.50
1.00
1.50
2.00
2.50
3.00
3.50
1957
1959
1961
1963
1965
1967
1969
1971
1973
1975
1977
1979
1981
1983
1985
1987
1989
1991
1993
1995
1997
1999
2001
2003
2005
2007
2009
2011
2013
2015
2017
Flus
h Ra
tes/
Hour
Year
Woodcock Flush Rates per Hour by Year
Zone 1
Zone 2
Zone 3
0.0
2.0
4.0
6.0
8.0
10.0
12.0
14.0
16.0
0
0.5
1
1.5
2
2.5
Dru
ms
Per R
oute
Dru
ms
Per S
top
Year
State Comparisons
WIMNMI

14
Figure 6. Mail Survey estimates of the number of small game hunters and estimates of ruffed grouse hunters, harvest, and hunter days in Michigan, 1960-2011 (estimates are not available for 1984).
Figure 7. Ruffed grouse breeding population index (average number of drums per route by Zone) in Michigan, 1990-2015. Drumming surveys were not conducted statewide in 1996, 1997 (Zone 2 & 3), 2007 and 2009 (Zone 1), 2016, 2017 or 2018.
0
250,000
500,000
750,000
1,000,000
1,250,000
1,500,000
1,750,000
2,000,000
1960
1962
1964
1966
1968
1970
1972
1974
1976
1978
1980
1982
1984
1986
1988
1990
1992
1994
1996
1998
2000
2002
2004
2006
2008
2010
Estim
ated
Tota
ls
Year
Small Game Hunters
Ruffed Grouse Hunters
Hunter Days (grouse)
Harvest (grouse)
0
5
10
15
20
25
Ruf
fed
Gro
use
Dru
ms
Per R
oute
Year
Zone 1
Zone 2
Zone 3

15
Figure 8. Ruffed grouse breeding index (average number of drums per route statewide) in Michigan, 1990-2015. Drumming survey were not conducted statewide in 1996, 1997, 2016, 2017, or 2018. Only Zone 1 & 2 in 2007 and 2009 were conducted.
0
2
4
6
8
10
12
14
16
18
20
1990
1991
1992
1993
1994
1995
1996
1997
1998
1999
2000
2001
2002
2003
2004
2005
2006
2007
2008
2009
2010
2011
2012
2013
2014
2015
Dru
ms
per R
oute
Year
16
Appendix A. Average number of ruffed grouse flushed per hour by cooperators in 2017.
17
Appendix B. Average number of American woodcock flushed per hour by cooperators in 2017.