2018 year in review · this report contains market information on log, lumber and veneer...
TRANSCRIPT

Chris Gonso Hardwood Economic Development Indiana State Department of Agriculture
Jeff Settle Forest Products Specialist Jackson-Washington State Forest
The Indiana Hardwood Report 2018 Year in Review

Introduction
Indiana’s hardwood industry has an annual economic impact of more than $10 billion and
supports 70,000 jobs—44,000 in primary and secondary manufacturing, and 26,000 in
ancillary sectors. A total of 4.1 of Indiana’s 4.9 million forest acres are privately owned, and
statewide timber growth exceeds removals for harvest and natural tree mortality by 2.3
times.i Indiana is renowned for producing high-quality hardwood timber for products, such as
grade lumber and veneer, as well as substantial amounts of industrial wood for shipping and
construction purposes. This diversity of products is made possible by Indiana’s diverse and
productive hardwood forest resource. According to the assessment conducted, Indiana has a
substantial and sustainable forest resource base, providing materials for a variety of wood-using
industries, as well as recreation, wildlife habitat, environmental services, and quality-of-life
benefits. Forest area, volume of wood, and percentage of sawtimber trees have all been on the
increase. Indiana is well known for its ability to produce some of the highest quality forest
products in the world. The Hoosier state ranks:
• 1st nationally in the production of wood office furniture and hardwood veneer.
• 2nd in wood kitchen cabinets and countertops for manufactured homes.
• 3rd in engineered wood products.
• 4th in pre-fabricated wood buildings.
• 5th in upholstered household furniture.
The wood-using industry relies on one of Indiana's most valuable renewable natural resources.
Proper management of Indiana's timber helps guarantee primary wood-using firms a supply of
quality wood fiber. These sawmills and veneer plants, in turn, provide top-quality materials for
secondary industries to produce paneling, fine furniture, cabinets and similar finished products.
This report contains market information on log, lumber and veneer manufacturing sectors. The
report contains data regarding green lumber prices per species as well as pallet cants and ties.
Also included are comments and graphs depicting a variety of data related to the export of
Indiana wood products. We hope you find this paper both informative and helpful.
The Department of Natural Resources (DNR) is committed to sound forest management
practices on all state forests and to being SFI and FSC certified.

Domestic Market Comments
Ash
Throughout much of 2018, mills that could afford to buy ash logs often resold them as quickly as
they purchased them, with large volumes being exported. Other mills ceased buying ash logs due
the rising price and thus the inability to profit from processing them. In early to mid-2018, ash
was among many mills’ hot and best species. Finding lumber was difficult due to the increasing
mortality associated with emerald ash borer and rising log exports. Kiln dried (KD) lumber
prices rose steadily and peaked in the late spring. Mills continue to export logs but due to
phytosanitary rules, they are debarking them prior to shipping. Lumber market comments have
been a mixed bag with some reporting their lumber is moving easily, and others saying demand
was just OK. Availability and log quality prevented overproduction and restricted price declines.
The average price for green 4/4 ash lumber across all grades declined about 3% for 2018.
Cherry
The first few months of 2018 saw a crazy demand for cherry lumber driven almost
exclusively by China. American producers were told to ship all they could. Sawmills
searched high and low for additional supplies, which became harder to get as log
exports reached record levels in the spring. Lumber prices rose to record levels and
some moulding and furniture manufacturers were forced to stop buying because of the
higher prices. To demonstrate just how fast the markets can change, most are now
reporting cherry to be a problem. Sawmills that reported no price pushbacks early in
2018 saw prices fall as much as $200/MBF in a two-week period. Fortunately later in
2018 lumber exports rose and log exports steadied, but those positives did not offset
the 10.5% price decline in 4/4 green lumber prices across all grades from QRT1 to
QRT4.
Hickory
With the species hickory, both domestic and international markets are narrow compared to
those of other hardwood species. Residential flooring accounts for the lion’s share of the
domestic production, and 86% of the lumber exports were to either Mexico or China.
Demand was good in early 2018 for all of these markets. Throughout 2018, lumber pricing
was virtually unchanged with overpricing being up less than 1%.
Hard Maple
At the beginning of 2018, common grade hard maple was a much easier sell than the upper
grades, as cabinet manufacturers and flooring plants purchased steady volumes. KD 4/4 #1C
were $55/MBF higher in May than April. Demand remains relatively unchanged with the
common grades moving better than the uppers. One reason for the consistent demand may be
that hard maple accounts for only 2% of total U.S. hardwood exports, so it is not affected as
significantly as other species with regard to tariffs. Green hard maple lumber prices rose 6.5%
throughout 2018.
Soft Maple
Early 2018 saw a mixed bag of comments regarding the soft maple markets. Some producers
commented that soft maple was moving in all grades and thicknesses while others reported
demand as just OK, and yet another commented that their paint grade material had lost
ground to European beech. As we moved through 2018, #2C pricing held up better than
#1/Btr primarily to the strong low-grade markets. Similar to hard maple, soft maple doesn’t
account for a large percentage of export volume but what little export activity there was
trended lower since July. Producers report upper-grade soft maple will move but it is a
“tough sell.” Upper grade soft maple has been in a downward spiral for two years, and
throughout 2018, green 4/4 lumber prices declined 8%.
Red Oak
Red oak moved well early in 2018 with not much change in pricing. There was not
much concern about China being oversupplied, exports were peaking in April as
just under 2017 record volumes and a strong domestic market gave producers some
extra leverage with foreign buyers. Flooring plants were buying large volumes of
#2/3A lumber, and all was well with the red oak world until … downward price
pressure began to increase in May, bringing concerns that China was oversupplied.
Lower lumber prices became the norm as well as splitting tariffs between
buyer/seller. Exports were off by 24% between Q2 and Q3. Mills, for the most part,
did not overproduce red oak lumber, in part due to poor logging conditions.
Lumber prices across all grades leveled off but in the end, were off almost 9% from
Q1 to Q4.
White Oak
Early 2018 saw positive white oak comments on the markets. Most noted steady to strong
demand and some producers commented, “White Oak was just crazy.” All grades and
thicknesses moved easily. Exports rose steadily, reaching a record 30MMBF in May. A few
European buyers complained about price but they continued to buy. As we continued
throughout 2018, white oak pricing held up much better than red oak. Although white oak
pricing did decline, it did not crash. Exports to Vietnam rose almost 50% in Q3. This helped
offset the 42% decline to China. Mills did a good job of not overproducing lumber, and pricing
rebounded with an almost 6% increase in lumber prices from Q1 to Q4.
Poplar
For most of 2018, poplar was been the steadiest of all hardwood species. Producers commonly
refer to poplar as the “steady eddy” of the market. Supply and demand were in balance for the
entire year. As with other hardwood species, the common grades moved better than the uppers.
As we continued through 2018, domestic demand was good for almost all grades and
thicknesses. The moulding/millwork sector provided the most stable and demanding market for
poplar. Export markets were trending up as well, especially to Vietnam. This helped to offset a
slower China market. Overall lumber pricing throughout 2018 was up 7%.
Walnut
Walnut lumber exports rebounded in early 2018 from slower exports in the fall/winter of 2017
with pricing correspondingly higher. Log pricing was higher as well but mills were still able to
sustain some profit margins. Common grades were moving better than the uppers, and many
producers noted their walnut was selling within two days of hitting the kilns. Lumber prices
peaked in June. Availability increased in July, inventories began to grow, and lumber was hard
to move. Added together, these factors led to lower pricing. Walnut lumber exports were
relatively steady throughout 2018, while log exports declined slightly. Lumber pricing fell almost
5% from Q1 to Q4
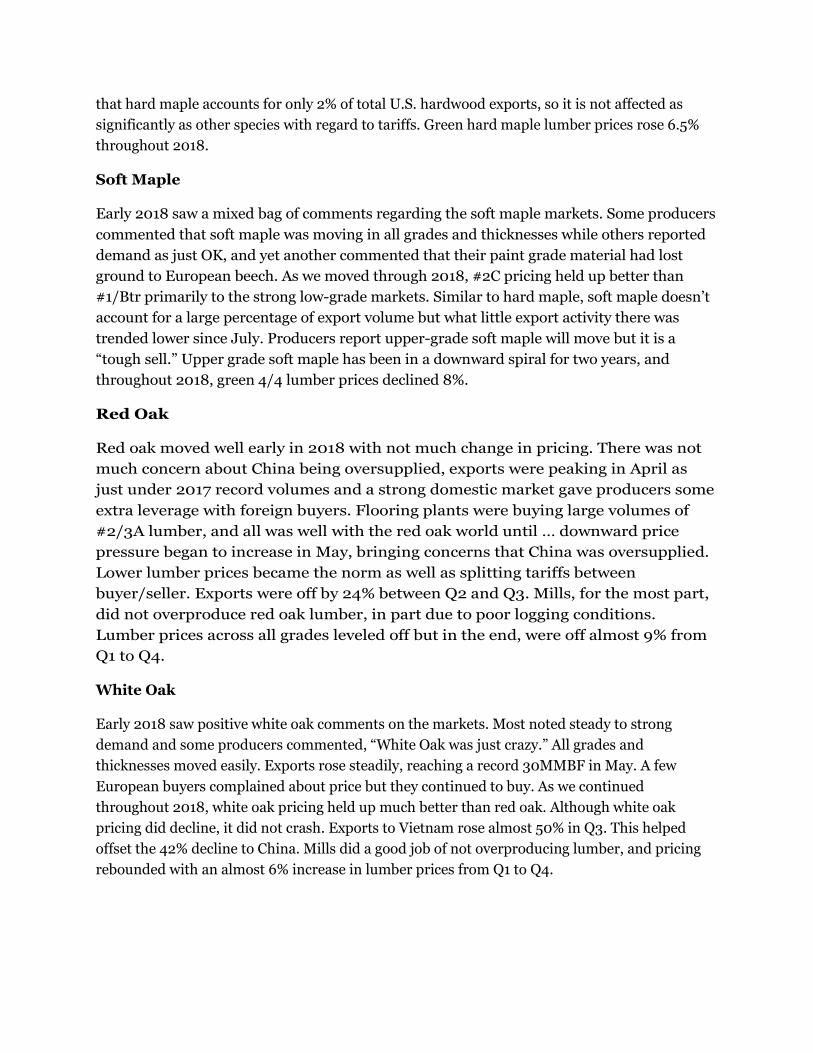
Green Hardwood Lumber Prices (Dec-2018)
Dollars per one thousand board feet (MBF), 4/4 (1-inch-thick) Appalachian Market Area
FAS #1C #2A #3A
Ash 1085 825 505
Cherry 1270 835 435
Hickory 890 595 460
Hard Maple 1180 965 635 435
Soft Maple 1080 750 380
Red Oak 925 705 690 625
White Oak 1745 1045 665 635
Poplar 865 485 390
Walnut 2670 1635 975
Source: Hardwood Review P.O. Box 471307, Charlotte, N.C. 28247-1307

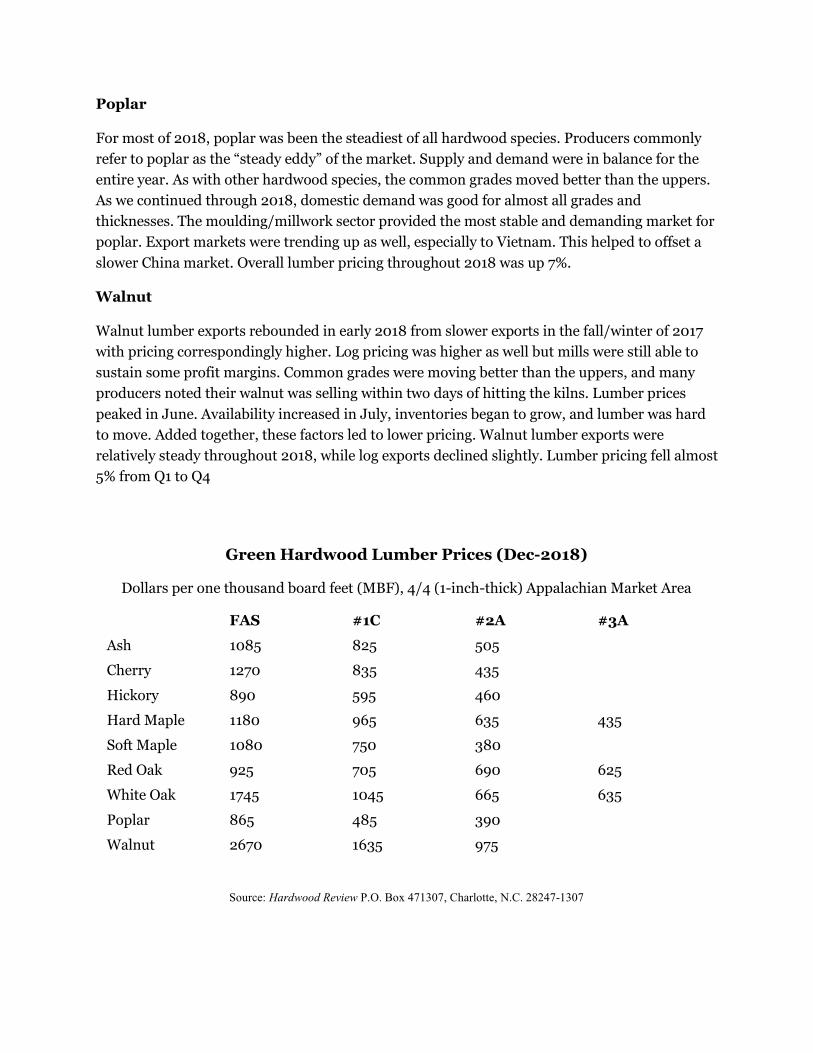
The following graphs compare green 4/4 lumber prices per species across all grades for each quarter of 2018. Also included are comparisons for pallet cants and ties.
Data were obtained from weekly reports from the Hardwood Review Weekly.
4/4 Green Ash (all grades)
4/4 Green Cherry (all grades)
$777
$834 $838
$756
$700
$750
$800
$850
Q1 Q2 Q3 Q4
$1,028$1,144 $1,116
$921
$0
$500
$1,000
$1,500
Q1 Q2 Q3 Q4
4/4 Green Hickory (all grades)
4/4 Green Hard Maple (all grades)
$645
$685$675
$648
$620
$640
$660
$680
$700
Q1 Q2 Q3 Q4
$844
$902$911
$902
$800$820$840$860$880$900$920
Q1 Q2 Q3 Q4

4/4 Green Soft Maple (all grades)
4/4 Green Red Oak (all grades)
$850 $843
$813
$778
$740$760$780$800$820$840$860
Q1 Q2 Q3 Q4
$799$850
$789
$729
$650
$700
$750
$800
$850
$900
Q1 Q2 Q3 Q4

4/4 Green White Oak (all grades)
4/4 Green Poplar (all grades)
$971
$1,014
$1,063$1,029
$900
$950
$1,000
$1,050
$1,100
Q1 Q2 Q3 Q4
$519 $523
$543$560
$480
$500
$520
$540
$560
$580
Q1 Q2 Q3 Q4

4/4 Green Walnut (all grades)
Pallet Cants
$1,863
$2,040$1,948
$1,777
$1,600
$1,700
$1,800
$1,900
$2,000
$2,100
Q1 Q2 Q3 Q4
$394
$437 $442$463
$340$360$380$400$420$440$460$480
Q1 Q2 Q3 Q4

Ties
$632
$673$704 $736
$550
$600
$650
$700
$750
Q1 Q2 Q3 Q4

Exports
Indiana’s export of hardwood products continues to be an important part of overall hardwood
sales. According to data from the U.S. Census Bureau, log exports declined, primarily to Asia and
China specifically. The decline was likely due to tariffs imposed as part of the U.S.-China trade
dispute and imposed tariffs. Lumber exports increased slightly, and there was a modest increase
in veneer exports by comparison. In 2018, Indiana exported just over $30 million of logs, $60
million of lumber and almost $70 million of veneer.
Figure 1: Indiana Export of Logs, Lumber & Veneer – Last 5 years
Data from the U.S. Census Bureau. (1)
Logs
As stated above, Indiana log exports declined in 2018, the first time that had happened in five
years. The decline was about 17% from 2017 levels. Indiana log exports totaled $30,932,951 in
2018. The destination of logs exported remained dominated by Asia (China) at 84% in 2018 but
that is down from 89% in 2017. Europe increased 2% to 13% of log exports in 2018. This does not
reflect an increase in sales to Europe, which were mostly flat from last year, but is an impact of
the total value in log shipments to Asia, which fell by 21%. By country, the top five markets were:
China (60%), Vietnam (7%), United Kingdom (6%), Taiwan (4%), and Japan (4%). Indiana
shipped logs to 29 different countries in 2018.
$-
$10,000,000
$20,000,000
$30,000,000
$40,000,000
$50,000,000
$60,000,000
$70,000,000
$80,000,000
2014 2015 2016 2017 2018
Logs Lumber Veneer

Figure 2: Indiana log exports to world by region, 2018
Data from the U.S. Census Bureau.
Lumber
In 2018, Indiana lumber exports increased from 2017 by about 6% to $60,777,280. Regionally,
Indiana exports of lumber to Europe declined by 24% and increased to Asia by 13%. By country,
China (49%), Canada (17%), Japan (14%), Vietnam (8%), and United Kingdom (3%) were the top
markets for the year. Indiana shipped lumber to 29 countries in 2018.
Figure 3: Indiana lumber exports to world by region, 2018
Data from the U.S. Census Bureau
1%
84%
2%13%
0%0%
Africa
Asia
Australia & Oceania
Europe
North America
South & Central America
4%
15%
1%
40%
38%
2%
Africa
Asia
Australia & Oceania
Europe
North America
South & Central America

Veneer
Indiana exports of veneer were up 14% in 2018 to $69,115,689. Veneer exports are not as
dominated by one region as lumber and log sectors are. Regionally, Indiana veneer sales to North
America increased by about $5 million from last year. Also significant, there was a $1.6 million
increase in sales to Asia. The other regions remained relatively flat but for a significant increase
in exports to South & Central America, but the dollar value here is relatively small as that region
only purchases about 2% of Indiana’s veneer exports. By country, top markets were: Canada
(35%), Spain (9%), Germany (7%), Portugal (6%), and Belgium (4%). Indiana shipped veneer to
42 different countries in 2018.
Figure 4: Indiana veneer exports to world by region, 2018
Data from the U.S. Census Bureau.
Notes:
(1) Data from U.S. Census Bureau, Economic Indicators Division. State Exports by HS
Commodities for logs (4403), lumber (4407) and veneer (4408).
i Indiana Hardwood Strategy - 2018
4%
15%
1%
40%
38%
2%
Africa
Asia
Australia & Oceania
Europe
North America
South & Central America