2019 & 2023 draft lcr study results la basin and san diego ... · • limiting component: el...
TRANSCRIPT

ISO PublicISO Public
2019 & 2023 Draft LCR Study Results LA
Basin and San Diego-Imperial Valley Areas
David Le
Senior Advisor - Regional Transmission Engineer
Stakeholder Meeting
April 9, 2018

ISO Public
Major Transmission & Generation Assumptions
Page 2
• San Onofre synchronous condenser
• Encina generation retirement
• Carlsbad Energy Center in-service by Q4 2018 (CPUC LTPP resource)
• Alamitos, Huntington Beach and Redondo Beach generation retirement (for a total of 3,818 MW)
by the end of 2020 timeframe to comply with the State Water Board’s OTC Policy
• Alamitos and Huntington Beach repowering (1284 MW) (CPUC LTPP resource)
• Stanton Energy Center (98 MW) with 10 MW battery energy storage system (CPUC LTPP
resource)
• Long-term procurement for preferred resources (i.e., energy efficiency, battery energy storage,
behind-the-meter solar PV, demand response) that were approved by the CPUC for the LA Basin
as well as San Diego area are fully implemented by the end of 2020 or prior to summer 2021
• Imperial Valley phase shifting transformers (230/230kV 2x400 MVA)
• Sycamore – Penasquitos 230 kV transmission line
• Mesa Loop-In project (anticipated March 2022 in-service date at this time)
• Existing 20-minute demand response resources in the LA Basin
• Battery energy storage projects in San Diego area
• Bypassing series capacitors on the Imperial Valley-North Gila 500kV line, as well as the Sunrise
and Southwest Powerlinks
ISO Public
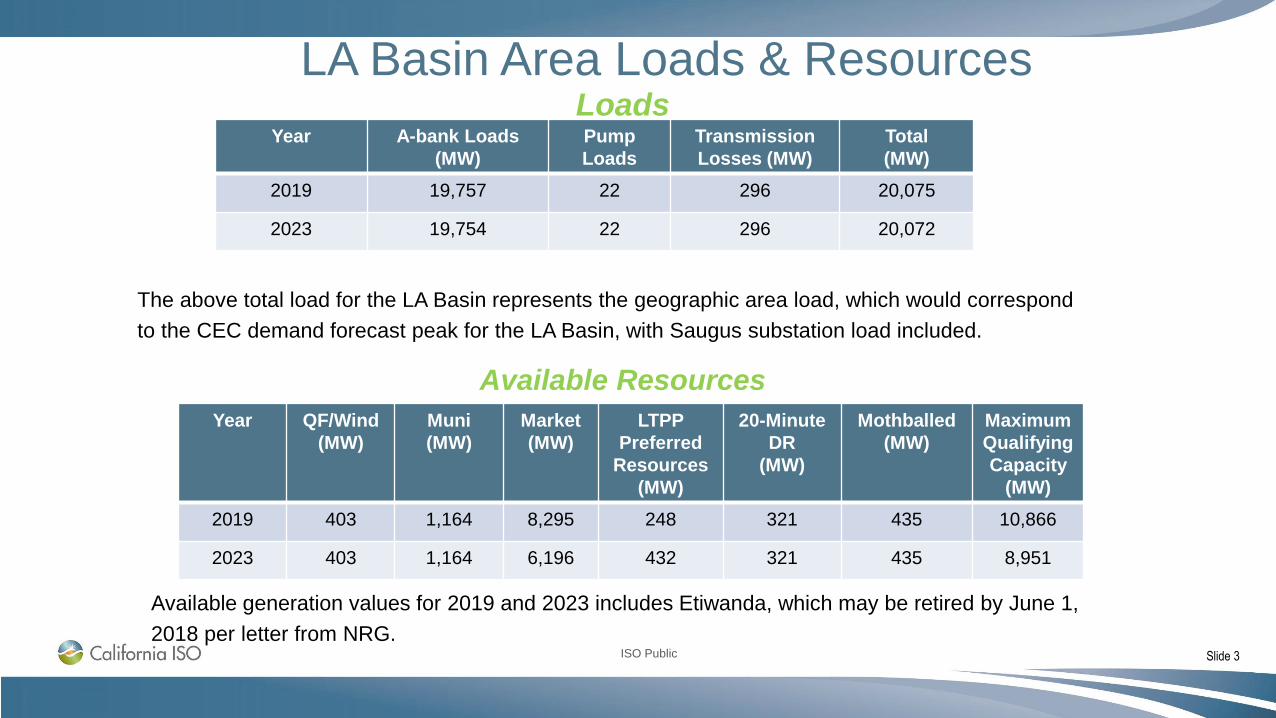
LA Basin Area Loads & ResourcesLoads
Slide 3
The above total load for the LA Basin represents the geographic area load, which would correspond
to the CEC demand forecast peak for the LA Basin, with Saugus substation load included.
Year A-bank Loads
(MW)
Pump
Loads
Transmission
Losses (MW)
Total
(MW)
2019 19,757 22 296 20,075
2023 19,754 22 296 20,072
Year QF/Wind
(MW)
Muni
(MW)
Market
(MW)
LTPP
Preferred
Resources
(MW)
20-Minute
DR
(MW)
Mothballed
(MW)
Maximum
Qualifying
Capacity
(MW)
2019 403 1,164 8,295 248 321 435 10,866
2023 403 1,164 6,196 432 321 435 8,951
Available Resources
Available generation values for 2019 and 2023 includes Etiwanda, which may be retired by June 1,
2018 per letter from NRG.

ISO Public
San Diego-Imperial Valley
Area Load and Resources (MW)
Slide 4
Year Managed
Peak Load
(MW)
Pump Loads Transmission
Losses (MW)
Total
(MW)
2019 4,295 0 117 4,412
2023 4,420 0 115 4,535
Year QF/Self-
gen
(MW)
Wind
(MW)
Market
(MW)
Battery
Storage
(MW)
20-Minute
DR
(MW)
Maximum
Qualifying
Capacity
(MW)
2019 106 175 3,989 77 19 4,366
2023 106 190 3,989 77 19 4,381
Available Resources
Loads

ISO Public Page 5
Hourly demand forecast for SCE service area on the peak day in 2019
(projected 1-in-10 load based on 1-in-2 load forecast profile)

ISO Public Page 6
Hourly demand forecast for SDG&E service area on the peak day in 2019
(projected 1-in-10 load based on 1-in-2 load forecast profile)

ISO Public Page 7
Estimated derated factors to calculate simultaneous loads between SCE
and SDG&E at each other’s respective peak load hours
SCE peak demand SDG&E @ SCE peak demand SDG&E peak demand SCE @ SDG&E peak demand
YearDate/time
(PDT)*
Hourly
Managed
Peak
Demand
(MW) from
hourly plot
LSE/BA Table
peak demand
forecast (MW)**
Date/time
(PDT)*
Hourly
Managed
Demand
(MW) from
hourly plot
% of own
peak demand
(from hourly
managed
demand plot)
Date/time
(PDT)*
Hourly
Managed
Peak Demand
(MW) from
hourly plot
(MW)
LSE/BA Table
peak demand
forecast
(MW)**
Date/time
(PDT)*
Hourly
Managed
Demand
from hourly
plot (MW)
% of own
peak demand
(from hourly
managed
demand plot)
20199/5/2019
17:00 hr.25340 25410
9/2/2019
17:00 hr.4412 98.07%
9/5/2019
16:00 hr.4499 4415
9/5/2019
16:00 hr.25076 98.96%
20238/31/2023
17:00 hr.25359 25368
8/31/2023
17:00 hr.4400 96.30%
8/31/2023
20:00 hr.4569 4554
8/31/2023
20:00 hr.23548 92.86%
20288/31/2028
17:00 hr.24813 24716
8/31/2023
17:00 hr.4278 91.51%
8/31/2023
20:00 hr.4675 4681
8/31/2028
20:00 hr.24127 97.24%
Notes:
* All hour expressed in PDT hour ending (HE)
**Peak demand from the CEC posted 2017 CED Revised Forecast for LSE/BA Table for Mid Demand Level (1-in-10) with Low AAEE and AAPV
ISO Public
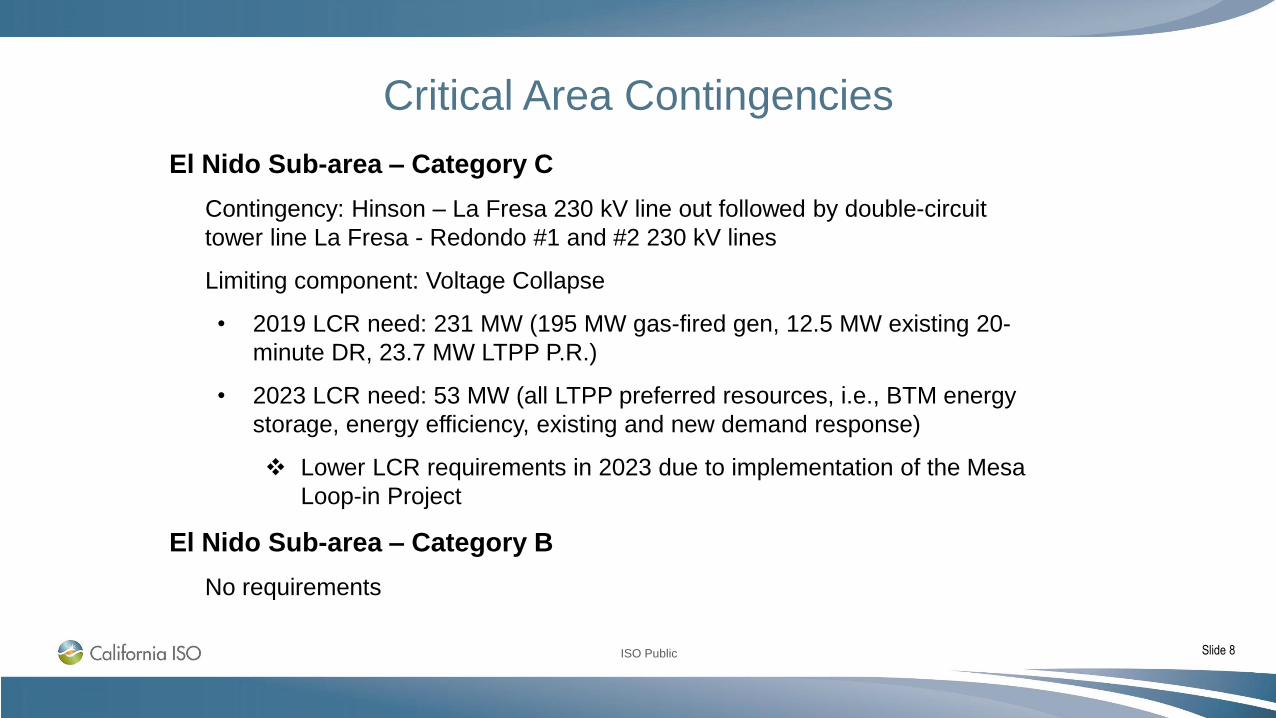
Critical Area Contingencies
Slide 8
El Nido Sub-area – Category C
Contingency: Hinson – La Fresa 230 kV line out followed by double-circuit
tower line La Fresa - Redondo #1 and #2 230 kV lines
Limiting component: Voltage Collapse
• 2019 LCR need: 231 MW (195 MW gas-fired gen, 12.5 MW existing 20-
minute DR, 23.7 MW LTPP P.R.)
• 2023 LCR need: 53 MW (all LTPP preferred resources, i.e., BTM energy
storage, energy efficiency, existing and new demand response)
Lower LCR requirements in 2023 due to implementation of the Mesa
Loop-in Project
El Nido Sub-area – Category B
No requirements

ISO Public Slide 9
Critical Area Contingencies
Western LA Basin Sub-area – Category C
Contingency (2019): Serrano – Villa Park #2 230 kV line, followed by Serrano – Lewis #1
or #2 230 kV line, or vice versa
• Limiting component (2019): Serrano – Villa Park #1 230 kV line
• 2019 LCR need: 3993 MW (this includes 162 MW of existing DR and 248 MW of
LTPP preferred resources)
Contingency (2023): Mesa – Redondo #1 230 kV line, followed by Mesa - Lighthipe 230
kV line, or vice versa
• Limiting component (2023): thermal loading on the Mesa-Laguna Bell #1 230kV line
• 2023 LCR need: 3970 MW (this includes 162 MW of existing DR and 432 MW of
LTPP preferred resources)
Western LA Basin Sub-area – Category B
Non binding – multiple combinations possible.
ISO Public Slide 10
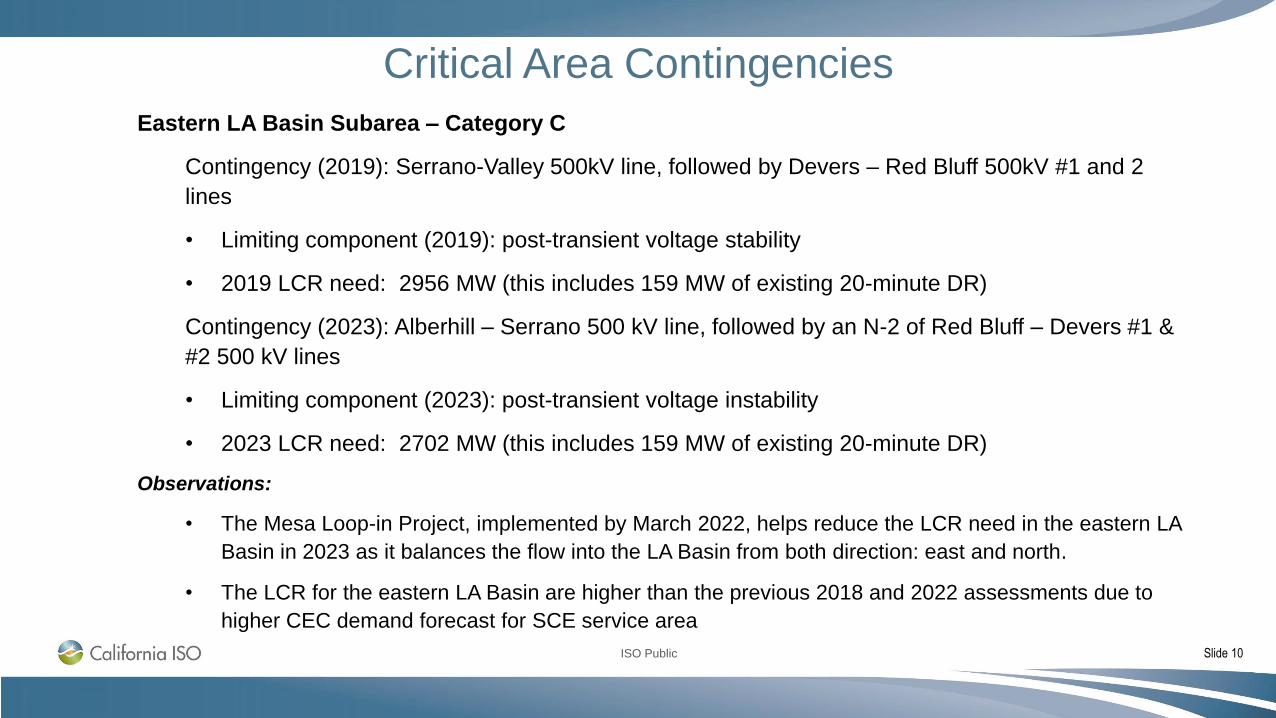
Critical Area Contingencies
Eastern LA Basin Subarea – Category C
Contingency (2019): Serrano-Valley 500kV line, followed by Devers – Red Bluff 500kV #1 and 2
lines
• Limiting component (2019): post-transient voltage stability
• 2019 LCR need: 2956 MW (this includes 159 MW of existing 20-minute DR)
Contingency (2023): Alberhill – Serrano 500 kV line, followed by an N-2 of Red Bluff – Devers #1 &
#2 500 kV lines
• Limiting component (2023): post-transient voltage instability
• 2023 LCR need: 2702 MW (this includes 159 MW of existing 20-minute DR)
Observations:
• The Mesa Loop-in Project, implemented by March 2022, helps reduce the LCR need in the eastern LA
Basin in 2023 as it balances the flow into the LA Basin from both direction: east and north.
• The LCR for the eastern LA Basin are higher than the previous 2018 and 2022 assessments due to
higher CEC demand forecast for SCE service area
ISO Public Slide 11
Combined Overall LA Basin and San
Diego-Imperial Valley LCR Assessment
ISO Public Slide 12
Combined Overall LA Basin and San
Diego-Imperial Valley LCR Assessment• Due to electrical interdependency, the overall LA Basin and San Diego – Imperial
Valley area studies are closely coordinated in the LCR study.
• The San Diego-Imperial Valley area is evaluated first due to its position as the
southernmost area and power flow typically flows in the north to south direction with
the outages that isolate SDG&E system from major import tie lines connecting to the
WECC system that lie east of San Diego. The San Diego-Imperial Valley LCR need
will be determined based on the outages that affect this area.
• Once the preliminary LCR need is determined for the San Diego – Imperial Valley
area, the LA Basin LCR need will be evaluated next based on the contingencies that
would most affect the LA Basin.
• The ISO then checks for the San Diego – Imperial Valley area again to check for
adequacy and to optimize its LCR need if possible.
• This effort goes back and forth several times until further LCR reduction can no longer
be achieved for these two areas.
ISO Public Slide 13
Illustration of the interdependency of the LA Basin and
San Diego-Imperial Valley LCR needs
ISO Public
Overall San Diego-Imperial Valley
Critical Contingencies
Slide 14
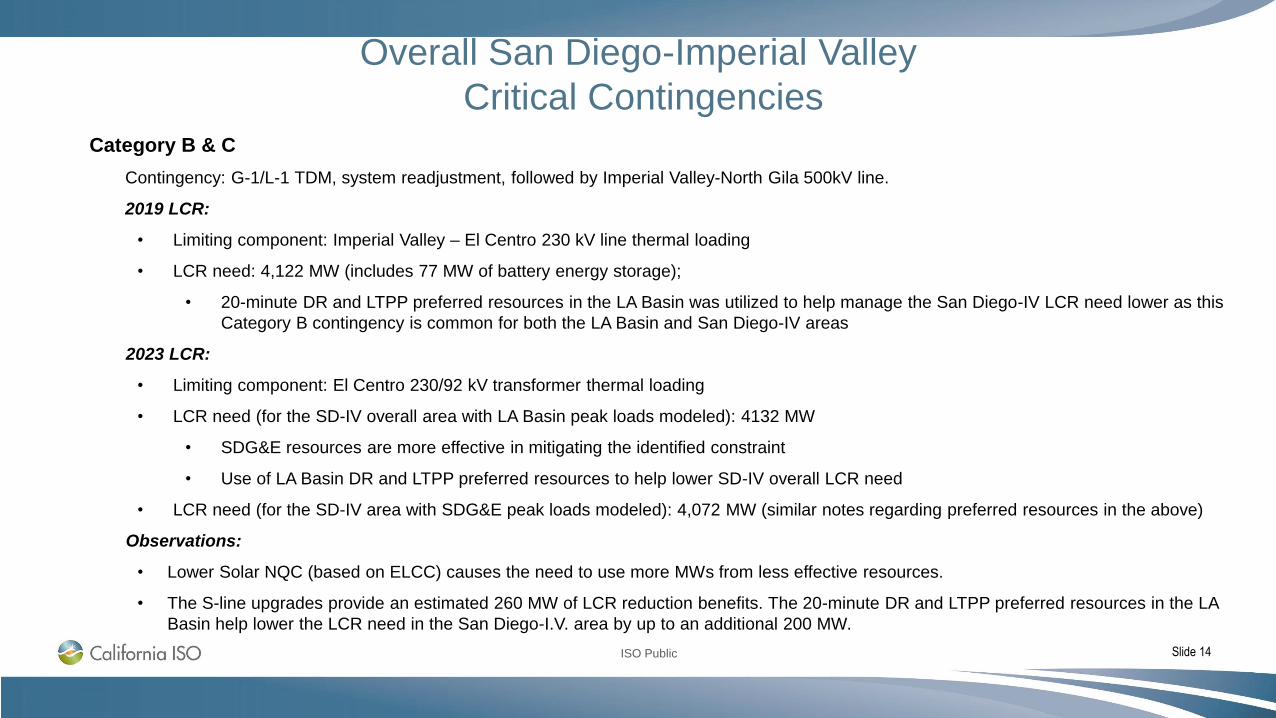
Category B & C
Contingency: G-1/L-1 TDM, system readjustment, followed by Imperial Valley-North Gila 500kV line.
2019 LCR:
• Limiting component: Imperial Valley – El Centro 230 kV line thermal loading
• LCR need: 4,122 MW (includes 77 MW of battery energy storage);
• 20-minute DR and LTPP preferred resources in the LA Basin was utilized to help manage the San Diego-IV LCR need lower as this
Category B contingency is common for both the LA Basin and San Diego-IV areas
2023 LCR:
• Limiting component: El Centro 230/92 kV transformer thermal loading
• LCR need (for the SD-IV overall area with LA Basin peak loads modeled): 4132 MW
• SDG&E resources are more effective in mitigating the identified constraint
• Use of LA Basin DR and LTPP preferred resources to help lower SD-IV overall LCR need
• LCR need (for the SD-IV area with SDG&E peak loads modeled): 4,072 MW (similar notes regarding preferred resources in the above)
Observations:
• Lower Solar NQC (based on ELCC) causes the need to use more MWs from less effective resources.
• The S-line upgrades provide an estimated 260 MW of LCR reduction benefits. The 20-minute DR and LTPP preferred resources in the LA
Basin help lower the LCR need in the San Diego-I.V. area by up to an additional 200 MW.
ISO Public Slide 15
San Diego Sub-area Critical Contingencies
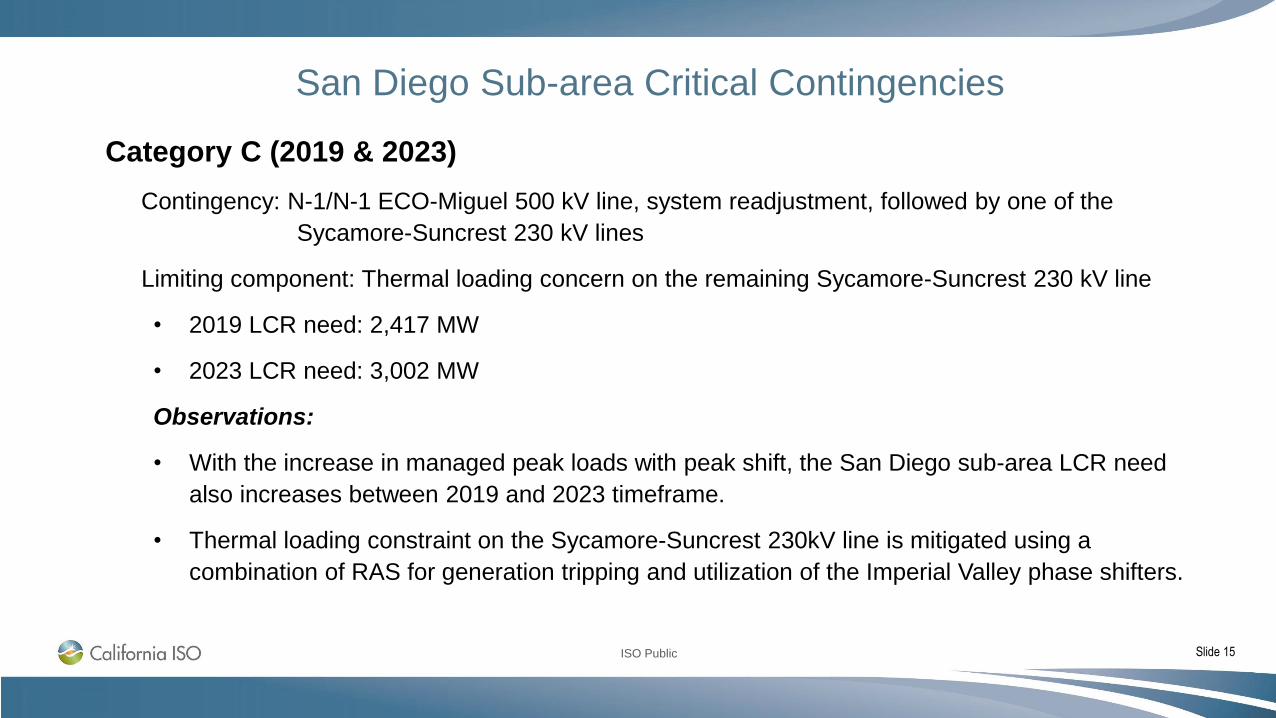
Category C (2019 & 2023)
Contingency: N-1/N-1 ECO-Miguel 500 kV line, system readjustment, followed by one of the
Sycamore-Suncrest 230 kV lines
Limiting component: Thermal loading concern on the remaining Sycamore-Suncrest 230 kV line
• 2019 LCR need: 2,417 MW
• 2023 LCR need: 3,002 MW
Observations:
• With the increase in managed peak loads with peak shift, the San Diego sub-area LCR need
also increases between 2019 and 2023 timeframe.
• Thermal loading constraint on the Sycamore-Suncrest 230kV line is mitigated using a
combination of RAS for generation tripping and utilization of the Imperial Valley phase shifters.
ISO Public Slide 16
Overall LA Basin Critical Contingency
(Category C for 2019)
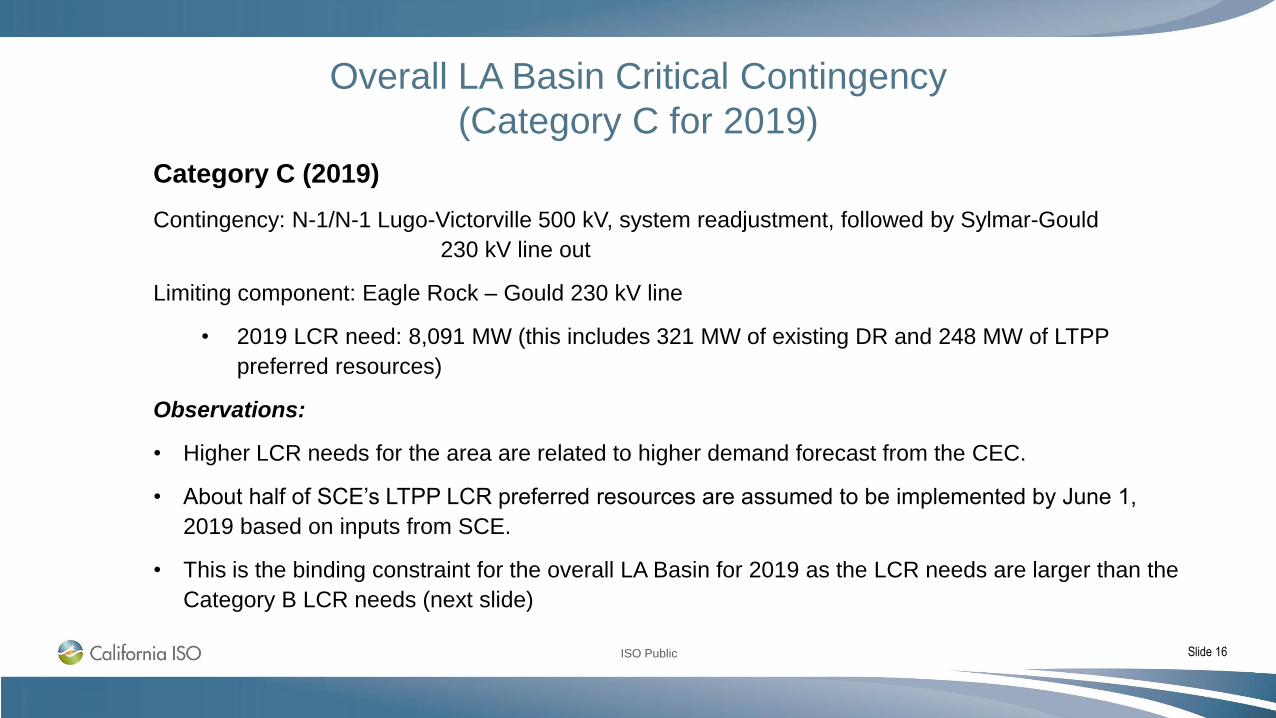
Category C (2019)
Contingency: N-1/N-1 Lugo-Victorville 500 kV, system readjustment, followed by Sylmar-Gould
230 kV line out
Limiting component: Eagle Rock – Gould 230 kV line
• 2019 LCR need: 8,091 MW (this includes 321 MW of existing DR and 248 MW of LTPP
preferred resources)
Observations:
• Higher LCR needs for the area are related to higher demand forecast from the CEC.
• About half of SCE’s LTPP LCR preferred resources are assumed to be implemented by June 1,
2019 based on inputs from SCE.
• This is the binding constraint for the overall LA Basin for 2019 as the LCR needs are larger than the
Category B LCR needs (next slide)

ISO Public Slide 17
Overall LA Basin Critical Contingency
(Category B for 2019)
Category B (2019)
Contingency: G-1/N-1 of TDM power plant, system readjustment, followed by an outage of
the Imperial Valley – North Gila 500kV line
Limiting component: Imperial Valley – El Centro 230kV line (the S-line) thermal loading
• 2019 LCR need: 7,968 MW (321 MW of 20-minute DR and 248 MW of LTPP preferred
resources were included in this total)
Observations:
• The Category B LCR needs identified above are for informational purpose and are non-binding
constraint for the overall LA Basin as the needs are lower than the Category C LCR needs.
ISO Public Slide 18
Overall LA Basin Critical Contingency
(Category B and C for 2023)
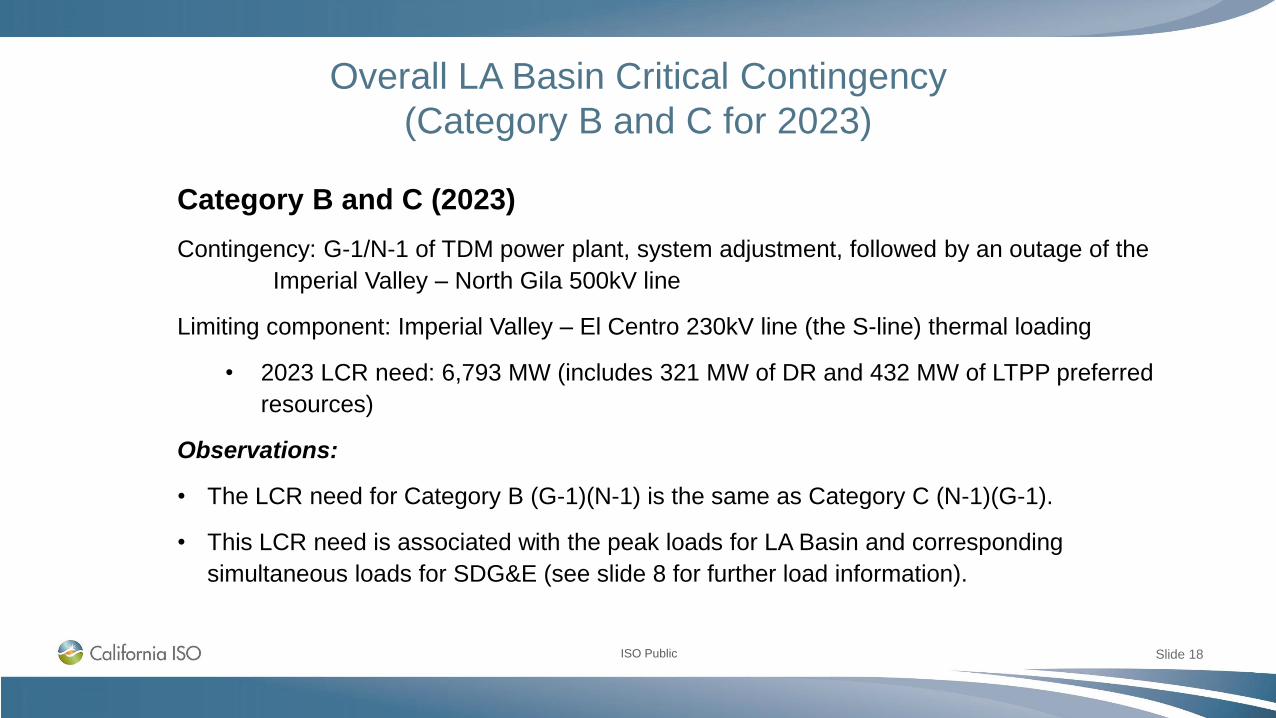
Category B and C (2023)
Contingency: G-1/N-1 of TDM power plant, system adjustment, followed by an outage of the
Imperial Valley – North Gila 500kV line
Limiting component: Imperial Valley – El Centro 230kV line (the S-line) thermal loading
• 2023 LCR need: 6,793 MW (includes 321 MW of DR and 432 MW of LTPP preferred
resources)
Observations:
• The LCR need for Category B (G-1)(N-1) is the same as Category C (N-1)(G-1).
• This LCR need is associated with the peak loads for LA Basin and corresponding
simultaneous loads for SDG&E (see slide 8 for further load information).
ISO Public Slide 19
Overall LA Basin Critical Contingency
(Secondary Category C for 2023)
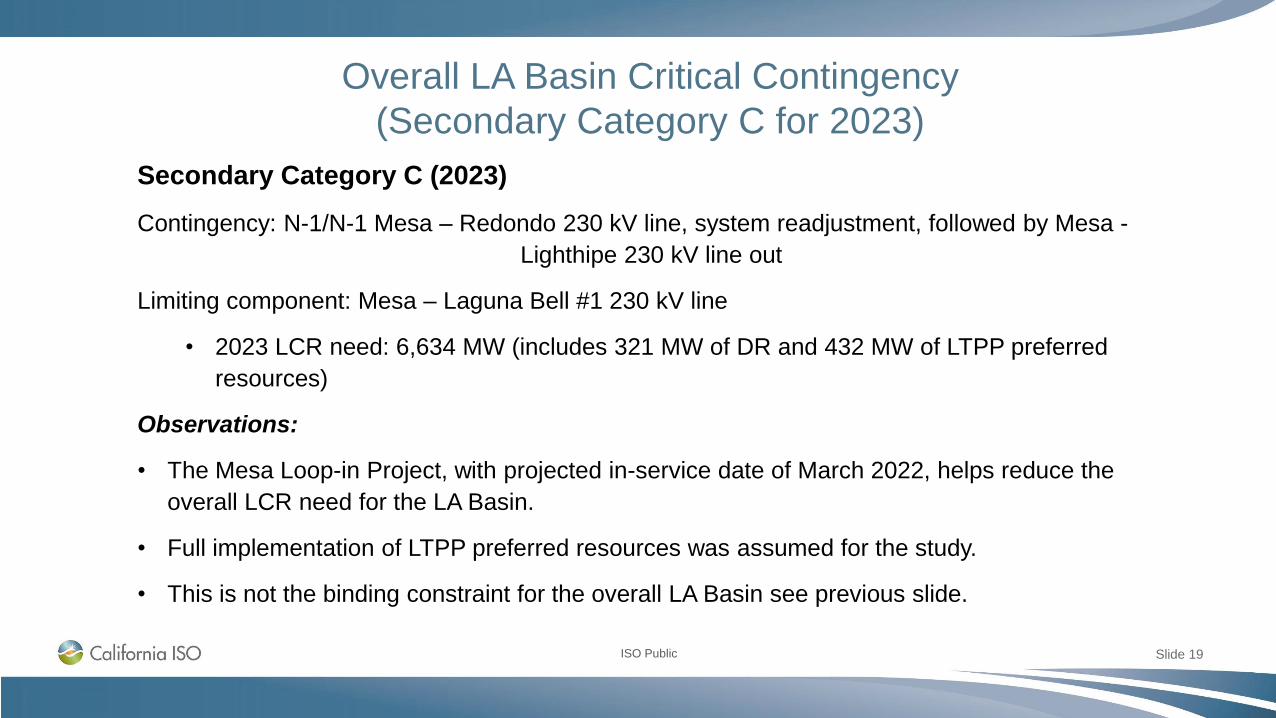
Secondary Category C (2023)
Contingency: N-1/N-1 Mesa – Redondo 230 kV line, system readjustment, followed by Mesa -
Lighthipe 230 kV line out
Limiting component: Mesa – Laguna Bell #1 230 kV line
• 2023 LCR need: 6,634 MW (includes 321 MW of DR and 432 MW of LTPP preferred
resources)
Observations:
• The Mesa Loop-in Project, with projected in-service date of March 2022, helps reduce the
overall LCR need for the LA Basin.
• Full implementation of LTPP preferred resources was assumed for the study.
• This is not the binding constraint for the overall LA Basin see previous slide.

ISO Public Slide 20
Changes
Since last year:
1. The CEC’s 2017 IEPR Revised Forecast’s 2019 managed peak demand, which includes peak
shift, for the LA Basin area is increased by 812 MW compared to the 2018 demand forecast used
for the 2018 LCR study.
• The overall LA Basin LCR need for 2019 has increased by 566 MW compared to the 2018
LCR need primarily due to higher demand forecast.
2. The 2023 adjusted managed peak demand, with peak shift, for the LA Basin area is increased by
952 MW compared to the previous year’s demand forecast for the 2022 LCR study.
• The overall LA Basin LCR need for 2023 has increased by 771 MW compared to the 2022
LCR need primarily due to higher demand forecast.

ISO Public Slide 21
Since last year:
1) The CEC’s 2017 IEPR Revised Forecast’s 2019 managed peak demand, which includes peak
shift, for the San Diego area is decreased by 509 MW compared to the 2018 demand forecast
used for the 2018 LCR study.
• The overall San Diego-Imperial Valley LCR need for 2019 has increased by 90 MW
compared to the 2018 LCR need.
• The increase in the LCR need is attributed to the following factors:
• Primarily due to lower net qualifying capacity (NQC) at peak loads for solar generating
units that are located in the most effective locations for mitigating the overall area
constraint;
• As well as generation retirement in the Big Creek/Ventura area.
2) The 2023 adjusted managed peak demand, with peak shift, for the San Diego area is decreased
by 565 MW compared to the previous year’s demand forecast for the 2022 LCR study.
• The overall San Diego-Imperial Valley LCR need for 2023 has decreased by 511 MW
compared to the 2022 LCR need due to a combination of implementation of the IID’s S-line
upgrades as well as lower demand forecast for the San Diego area.
Changes (cont’d)

ISO Public
Stay connected
Sign up for the Daily Briefing
at www.caiso.comDownload ISO Today
mobile app
@California_ISO
THANK YOUYour comments and questions are welcome.
For written comments, please send to: [email protected]
Slide 22