2019 accountability plan progress report
TRANSCRIPT

2018-19 ACCOUNTABILITY PLAN PROGRESS REPORT
Excellence Girls Charter School
2018-19 ACCOUNTABILITY PLAN PROGRESS REPORT
Submitted to the SUNY Charter Schools Institute on:
September 27, 2019
By Brian Thomas, Ashanti Herndon, Amy McDermott
794 Monroe Street, 3rd Floor Brooklyn, NY 11221
718-638-1875

2018-19 ACCOUNTABILITY PLAN PROGRESS REPORT
Brian Thomas, Director of Operations; Ashanti Herndon, Director of Operations; and Amy McDermott, Director of Operations prepared this 2018-2019 Accountability Progress Report on behalf of the school’s Board of Trustees:
Trustee Name Position on the Board
Linton Mann III Chair
Tony Pasquariello Vice Chair
John Greenstein Trustee
Michael Hall Trustee
Shakima Jones Trustee
John Kim Trustee
Ekwutozia U. Nwabuzor Secretary
Brett Peiser Trustee
Joseph F. Wayland Treasurer
Chrystal Stokes Williams Trustee
Ann Mathews Trustee
Nikki Bowen has served as the Principal of the elementary school since 2014. Sofia Mohammed has served as the Principal of the middle school since 2017. Thomas O’Brien has served as the Principal of the high school since 2014.

2018-19 ACCOUNTABILITY PLAN PROGRESS REPORT
Excellence Girls Charter School (Excellence Girls) is an all-girls charter public school, whose mission is to prepare its students to enter, succeed in and graduate from college preparatory high schools and colleges. Excellence Girls was founded in Bedford Stuyvesant, Brooklyn, in August 2009, and had grades K- 12 during the 2018-2019 school year. Excellence Girls Charter School’s school design includes seven core components. Focus on Literacy. Many of our students beginning their school career reading substantially below grade level. If a school does not address this dramatic and central issue immediately, students will be at a huge disadvantage in all subjects in high school and college. The ultimate academic success of EGCS students, therefore, is tied to mastering this fundamental skill. In 2018-19, EGCS provided explicit instruction in literacy skills and inculcated the reading habit through:
● Two hours and a half of daily literacy instruction; ● Requiring students to read reading level-appropriate books during the summer; ● Requiring graded, written work in every class, including math; ● Requiring students to carry an independent reading book, checked out from our Library,
to make better use of transition time in the hallways and other periods of downtime throughout the school day.
● Using Accelerated Reader to test every student 3 times during the year to monitor progress and ensure that students were being challenged by independent reading books on their reading level
● In the early grades, scholars have nearly 3 hours of reading instruction each day, which includes a systematic decoding program (Reading Mastery), a teacher-designed reading comprehension curriculum, and daily read alouds.
● In the key literacy-building years of K-4th grade, classrooms are staffed with two teachers in order to ensure that the student-to-teacher ratio never exceeds 15:1;
● Students are expected to read for at least 15-20 minutes at home each night in Kindergarten, 1st, and 2nd grade, and for at least 30 minutes each night starting in 3rd grade;
● Students write in every class, and use the Writer’s Workshop method to cultivate creativity and voice.
Target Curriculum Focused on Basic Skills. EGCS does not use an off-the-shelf curriculum. Rather, EGCS uses curriculum developed by our Curriculum Assessment Team (CAT) and Lead Lesson Planners (LLP). Our CAT and LLP develop curriculum directly from the New York State Learning Standards that ensures students master a core set of basic academic skills before they can master higher-level, abstract material. Our Curriculum Assessment Team (CAT) and Lead Lesson Planners (LLP) pay particularly close attention to the topics, sequence, and performance standards outlined in the New York State standards. This ensures that students are mastering the same material as their peers throughout New York State. At the same time, both teams adapt the subject topics and performance standards according to their professional expertise and from data-driven feedback from our teachers. CAT and our LLP create a comprehensive curriculum for their subject, saved on our network’s share drive, with a

2018-19 ACCOUNTABILITY PLAN PROGRESS REPORT
year-long scope and sequence, individual unit plans, daily lesson plans, and assessment materials. EGCS teachers will then save their lessons to our school’s shared drive with any edits they have adapted for their classroom. Not only does this provide the school with a record of individual course instruction but this also serves as a valuable curricular planning resource for returning and future teachers. Assess Early and Often to Drive the Instructional Program. The most effective schools use assessment to diagnose student needs, measure instructional impact, and build a culture of continuous reflection and improvement. In addition to the New York State Social Studies, Mathematics, English Language Arts, and Science exams, EGCS administered three internally-aligned Interim Assessments (4 in Math & ELA) and one Final Exam in Math, English Language Arts, Science and History. These tests assessed ongoing student mastery of Math, Reading/Writing, Science and History skills and standards throughout the year and provided immediate data on individual student and class growth. EGCS teachers, with the support of the Principal, used this data to identify standards mastered and standards in need of re-teaching so that lesson plans could be continuously adjusted. EGCS also utilized the information to target content- and skills-driven tutoring and small-group instruction. Our CAT team this year also began the use of weekly data collection through small assessments in both ELA and math. The data from these assessments was used by CAT and our LLPs to address gaps in content or skill that they could see trend across our Brooklyn Schools. Make More Time. In order to provide students with a comprehensive, college preparatory education, Excellence Girls Charter School has an extended school day and school year. For most students, the regular school day began at 7:15 AM and ended at 4:00 PM With hour-long periods four days a week and 45 minute periods on Fridays to allow for significant staff meeting and professional development time, all students at Excellence Girls Charter School received the following weekly:
● 5 extended periods of Mathematics ● 10 periods of English Language Arts (Reading and Writing) ● 3 periods of Independent Reading ● 5 periods of Social Studies ● 5 periods of Science ● 3 periods of Dance (5th-8th grades) ● 5 periods of electives with choice of Art, Theater, Advanced Theater Speech and Debate,
Advanced Speech, Advanced Debate, Entrepreneurship, Physical Education (9th-12th grades)
● 2 periods of Co-Curricular offered through HS 2.0 program. Offerings include: Jazz Band, Dance, Drumline, Robotics, African American Film Club, Mentoring in Medicine, Fencing, Digital Music Production, Creative Writing, Journalism, Extemp Speech, Chess, Photography, Community Service, and Futbol Club.
Excellence Girls Charter School students extend their learning beyond the school day by completing, on average, one-and-a-half to two hours of homework every night.
2018-19 ACCOUNTABILITY PLAN PROGRESS REPORT
Emphasis on College. For too many at-risk students, college only exists in the abstract. For Excellence Girls Charter School students, freshman year of college will be a natural extension of their educational experience at EGCS. Excellence Girls Charter School students began talking about college on the first day of school as their advisories are named after the alma maters of their teachers. Through informal conversations in advisory and in classes, students learned about the college application process, financial aid, dorm-life, selecting a major, and other important aspects of college survival. We know that academic excellence is not enough. To achieve our mission here at Excellence Girls, it is imperative that we instill in them the character traits that will allow them to persevere along the road to college. We therefore explicitly teach our scholars about key character traits and community involvement. At the elementary level, we provide daily instruction in our Creed Values (optimism, respect, honesty, curiosity, love, justice, hope, courage, and sisterhood). Two mornings a week, we begin the day with Morning Motivation, a 15-minute school assembly anchored around these Creed Values in which scholars participate in songs, cheers, and discussions with their fellow classmates. Each week ends with a Friday Community Meeting where we celebrate the academic successes of the week through reinforcement and celebration of our Creed Values. Classroom teachers present awards to the scholar in their class who best demonstrated the designated Creed Value of the week at each Community Meeting. At the middle level, we emphasize our SOAR values of Sisterhood, Optimism, Achievement, Responsibility, and Respect. Students attend a whole grade level Circle once per week where we emphasize these core values through interactive mini-lesson led by our principal. Excellence Girls Charter School students are expected to consistently demonstrate these values wherever they find themselves and are rewarded with merits when they model these values well or go above and beyond. Students earning merits receive the opportunity to represent the school on merit trips and trade their merits at Merit Auctions for tangible rewards. Every other month, by participating in merit-earned trips either with a group of the top merit earners or one-on-one/two-on-one with staff members, merit winners develop the more abstract skills necessary for true college preparation (trying new activities, demonstrating leadership and professionalism, and participating in community service). Provide Structure and Order. Students need a safe and orderly environment to be productive. In 2018-19, EGCS created a calm, composed, and disciplined environment to maximize the amount of time on-task. Strategies included:
● Strictly enforced school dress code; ● Merit system that defined clear expectations and immediate responses to positive
behavior; ● Demerit and detention system that defined clear expectations and immediate responses
to negative or inappropriate behavior ● Rubric system that provided immediate feedback to classes at the end of each class each
day.

2018-19 ACCOUNTABILITY PLAN PROGRESS REPORT
Insist on Family Involvement. EGCS’s educational program is structured so that families must be involved in their child’s academic pursuits. In 2018-19, EGCS families:
● picked up their child’s report card in person at the school three times; ● met with teachers and staff on multiple occasions to formally and informally discuss their
child’s academic and behavioral performance; ● maintained an open line of communication with their child’s teachers through in-person
meetings, weekly dashboards, semi-monthly progress reports, advisory calls and emails; ● were notified at home or at work each day if their child earned a detention; ● were asked to offer input on the school on mid-year and year-end surveys, grading the
school; ● were offered the opportunity to participate in a potluck and watch their children perform
in their chosen Enrichment activity at three public performances during the course of the year
● were invited to multiple social events with scholars, teachers and families focused on strengthening the involvement of parents in the school community
School Enrollment by Grade Level and School Year
School Year
K 1 2 3 4 5 6 7 8 9 10 11 12 Total
2014-15 84 87 86 86 75 86 83 587
2015-16 88 90 85 89 83 86 86 75 N/A 141 138 96 80 1137
2016-17 90 90 88 90 89 88 88 89 92 161 126 124 88 1179
2017-18 89 90 86 90 87 90 91 90 92 229 149 104 118 1404
2018-19 76 83 93 90 92 51 88 82 83 247 209 128 89 1411
HIGH SCHOOL COHORTS
ACCOUNTABILITY COHORT
The state’s Accountability Cohort consists specifically of students who are in their fourth year of high school after entering the 9th grade. For example, the 2015 state Accountability Cohort consists of students who entered the 9th grade anywhere sometime during the 2015-16 school year, were enrolled in the school on the state’s annual enrollment-determination day (i.e., BEDS day) in the 2018-19 school year, and either remained in the school for the rest of the year or left for an acceptable reason. (See New York State Education Department’s SIRS Manual for more details about cohort eligibility and acceptable exit reasons: http://www.p12.nysed.gov/irs/sirs/ht)
The following table indicates the number of students in the Accountability Cohorts who are in their fourth year of high school and were enrolled at the school on BEDS Day in October and remained in the school until June 30th of that year.

2018-19 ACCOUNTABILITY PLAN PROGRESS REPORT
Fourth-Year High School Accountability Cohorts
Fourth Year
Cohort
Year Entered 9th Grade Anywhere
Cohort Designatio
n
Number of Students Enrolled on BEDS Day in October of the Cohort’s
Fourth Year
Number Leaving
During the School Year
Number in Accountability Cohort as of
June 30th
2016-17 2013-14 2013 92 1 92
2017-18 2014-15 2014 108 0 108
2018-19 2015-16 2015 93 2 93
TOTAL COHORT FOR GRADUATION
Students are also included in the Total Cohort for Graduation (referred to as the Graduation Cohort, Total Graduation Cohort, or Total Cohort interchangeably throughout this report) based on the year they first enter the 9th grade. Students enrolled for at least one day in the school after entering the 9th grade are part of the school’s Graduation Cohort. The school may remove students from the Graduation Cohort if the school has discharged those students for an acceptable reason listed in the SIRS manual, including the following: if they transfer to another public or private diploma-granting program with documentation, transfer to homeschooling by a parent or guardian, transfer to another district or school, transfer by court order, leave the U.S., or are deceased.
Fourth Year Total Cohort for Graduation
Fourth Year
Cohort
Year Entered
9th Grade Anywhere
Cohort Designatio
n
Number of Students Graduated or
Enrolled on June 30th of the Cohort’s
Fourth Year (a)
Number of Students No Longer at the School Who Had Been Enrolled for at Least One Day
Prior to Leaving the School and Who Were Not Discharged for
an Acceptable Reason (b)
Total Graduation
Cohort (a) + (b)
2016-17
2013-14 2013 91 0 91
2017-18
2014-15 2014 108 0 108
2018-19
2015-16 2015 91 0 91

2018-19 ACCOUNTABILITY PLAN PROGRESS REPORT
Fifth Year Total Cohort for Graduation
Fifth Year
Cohort
Year Entered
9th Grade Anywhere
Cohort Designation
Number of Students
Graduated or Enrolled on June
30th of the Cohort’s Fifth Year
(a)
Number of Students No Longer at the School Who Had Been Enrolled for at Least One Day
Prior to Leaving the School and Who Were Not Discharged for
an Acceptable Reason (b)
Total Graduation
Cohort (a) + (b)
2016-17
2012-13 2012 82 0 82
2017-18
2013-14 2013 92 0 92
2018-19
2014-15 2014 112 0 112
GOAL 1: HIGH SCHOOL GRADUATION
GOAL 1: HIGH SCHOOL GRADUATION
Uncommon New York City high school students will be on track to graduate from high school.
Goal 1: Leading Indicator
Each year, 75 percent of students in first and second year high school Total Graduation Cohorts will earn at least ten credits (if 44 needed for graduation) or five credits (if 22 needed for graduation) each year.
METHOD
This measure serves as a leading indicator of the performance of the high school cohort and examines students’ progress toward graduation based on annual credit accumulation. The measure requires that, based on the school’s promotion requirements, 75 percent of the first and second year high school Total Graduation Cohorts will earn the required number of credits.
Students who receive a final failing grade (below a 70) for a class do not receive credit for the class. The final grade is based on individual quarter grades and a comprehensive subject-area test.
In subjects that earn 2.0 credits per year (English, Math, Science and History), a student who fails will be required to take an additional class to recover the lost credits. There are two ways this occurs, depending on how many classes a student is failing that academic year. If students fail one class, the student can recover credit by taking an intensive summer school class in this subject at his/her expense and/or at the school if offered. To recover credit, the class must be approved by the school. If a student fails two or more classes, that student is required to repeat the grade.
In subjects that require less than four years of credits (Foreign Language, Physical Education, Health and Electives), a student must make up the class in a subsequent school year after the school day, during the summer or another time the school deems appropriate (at his/her expense).

2018-19 ACCOUNTABILITY PLAN PROGRESS REPORT
Seniors who fail a class but need the credit to graduate must take an intensive summer school class and cannot partake in commencement activities.
Given that Excellence Girls Charter School has provided tiers of student support throughout the school year – among which are Weekly Progress Reports, Office Hours, and Weekly Check-in Meetings with their Advisor – summer coursework for all subjects is the responsibility of the family, both financially and logistically. Subject-area teachers will supply the directions and expectations for summer research projects.
Students who need summer remediation and do not fulfill all requirements will automatically be retained.
Graduation Credit Requirements:
● English: 4 years (8 credits) ● Math: 3-4 years (6-8 credits) ● Science: 4 years (8 credits) ● History: 4 years (8 credits) ● Language: 3 years (6 credits) ● Electives: 3 years (6 credits) ● Physical Education: 2 years (4 credits)
RESULTS AND EVALUATION
Uncommon Charter High School met this measure, promoting above 75% of students within each cohort. We promoted 91% of students within our 2017 cohort and 90% of our 2018 cohort.
Percent of Students in First and Second Year Cohorts
Earning the Required Number of Credits in 2018-19
Cohort Designation
Number in Cohort during
2018-19
Percent promoted
2017 197 91%
2018 228 90%
ADDITIONAL EVIDENCE
Our school continues to meet and exceed this measure year over year. For the past three years we had over 75% promotion in our first- and second-year cohorts.
Goal 1: Leading Indicator
Each year, 75 percent of students in the second year high school Total Graduation Cohort will score at or above proficient on at least three different New York State Regents exams required for graduation.

2018-19 ACCOUNTABILITY PLAN PROGRESS REPORT
METHOD
This measure serves as a leading indicator of the performance of high school cohorts and examines their progress towards graduation based on Regents exam passage. The measure requires that 75 percent of students in each Graduation Cohort have passed at least three Regents exams by their second year in the cohort. In August of 2019, the 2017 cohort will have completed its second year.
RESULTS AND EVALUATION
As evidenced by looking at 2015, 2016, and 2017 cohorts in their second year, we are exceeding the measure of 75% of students passing at least three different New York State Regents Exams required for graduation. At the end of their second year, 79% of the 2015 cohort had passed 3 or more Regents exams, and 71% of the 2016 cohort and 79% of the 2017 cohort had done the same. Looking at future data, we expect to continue to meet and exceed this goal. Most of our students take and pass two Regents exams in the 8th grade (Living Environment and Algebra I). Those who do not pass those exams, will be required to re-take the exam a second time in their 9th grade year. When students are enrolled in 9th grade, all students take the ELA Regents Exam, and about 50% take the Geometry Regents Exam. By prioritizing Regents exams in the 8th and 9th grades, we are able to ensure that at least 75% of students meet and exceed our goal of 3 passing Regents exams by the end of the 10th grade.
Percent of Students in their Second Year Passing Three Regents Exams by Cohort
Cohort Designation
School Year
Number in Cohort
Percent Passing Three
Regents
2015 2016-17 126 79%
2016 2017-18 280 71%
2017 2018-19 208 79%
Goal 1: Absolute Measures
Each year, 75 percent of students in the fourth year high school Total Graduation Cohort and 95 percent of students in the fifth year high school Total Graduation Cohort will graduate.
METHOD
This measure examines students in two high school Graduation Cohorts: those who entered the 9th grade as members of the 2015 cohort and graduated four years later and those who entered as members of the 2014 cohort and graduated five years later. These data reflect August graduation rates. At a minimum, these students have passed five Regents exams required for high school graduation in ELA, mathematics, science, U.S. History, and Global History or met the requirements for the 4+1 pathway to graduation.1
1 The state’s guidance for the 4+1 graduation pathway can be found here:
http://www.p12.nysed.gov/ciai/multiple-pathways/.
2018-19 ACCOUNTABILITY PLAN PROGRESS REPORT
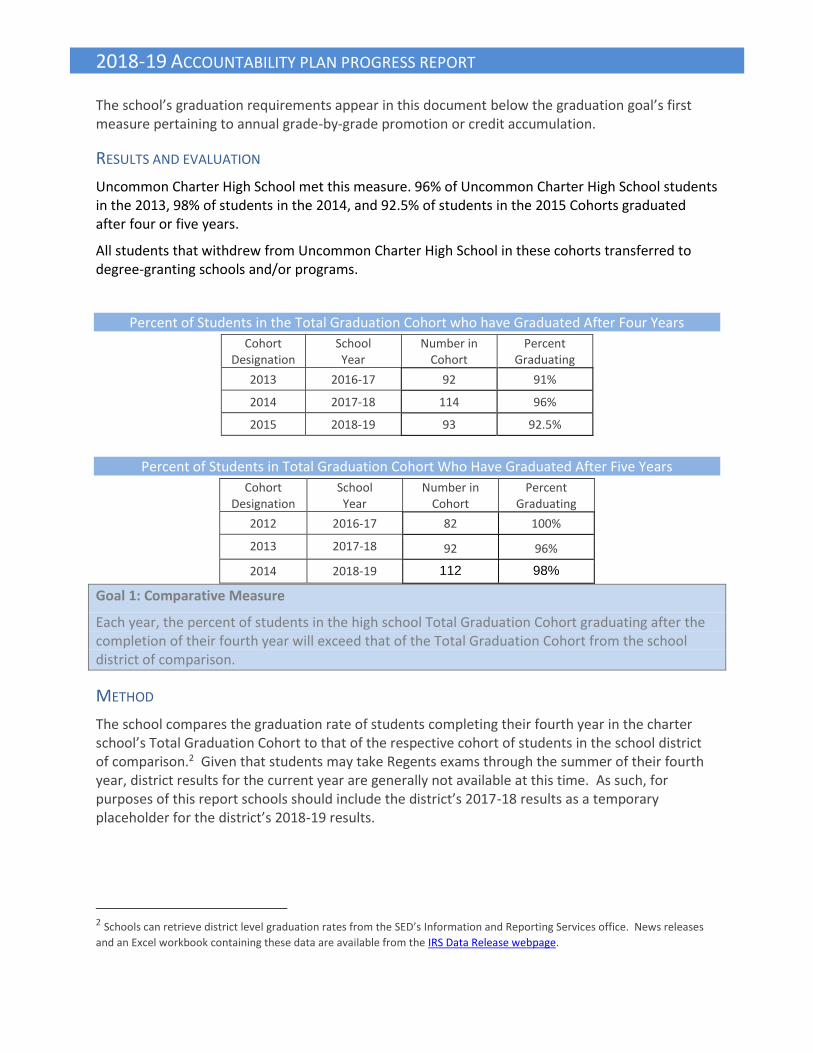
The school’s graduation requirements appear in this document below the graduation goal’s first measure pertaining to annual grade-by-grade promotion or credit accumulation.
RESULTS AND EVALUATION
Uncommon Charter High School met this measure. 96% of Uncommon Charter High School students in the 2013, 98% of students in the 2014, and 92.5% of students in the 2015 Cohorts graduated after four or five years.
All students that withdrew from Uncommon Charter High School in these cohorts transferred to degree-granting schools and/or programs.
Percent of Students in the Total Graduation Cohort who have Graduated After Four Years
Cohort Designation
School Year
Number in Cohort
Percent Graduating
2013 2016-17 92 91%
2014 2017-18 114 96%
2015 2018-19 93 92.5%
Percent of Students in Total Graduation Cohort Who Have Graduated After Five Years
Cohort Designation
School Year
Number in Cohort
Percent Graduating
2012 2016-17 82 100%
2013 2017-18 92 96%
2014 2018-19 112 98%
Goal 1: Comparative Measure
Each year, the percent of students in the high school Total Graduation Cohort graduating after the completion of their fourth year will exceed that of the Total Graduation Cohort from the school district of comparison.
METHOD
The school compares the graduation rate of students completing their fourth year in the charter school’s Total Graduation Cohort to that of the respective cohort of students in the school district of comparison.2 Given that students may take Regents exams through the summer of their fourth year, district results for the current year are generally not available at this time. As such, for purposes of this report schools should include the district’s 2017-18 results as a temporary placeholder for the district’s 2018-19 results.
2 Schools can retrieve district level graduation rates from the SED’s Information and Reporting Services office. News releases
and an Excel workbook containing these data are available from the IRS Data Release webpage.

2018-19 ACCOUNTABILITY PLAN PROGRESS REPORT
RESULTS AND EVALUATION
At the time of this report, comparative graduation data has not yet been released. Uncommon Charter High School will update when the data becomes available. Given our current data regarding graduation cohorts, we are confident that we have exceeded the % of students graduating after their fourth year compared to the school district of comparison.
Percent of Students in the Total Graduation Cohort who Graduate in Four Years Compared to the District
Cohort Designation
School Year
Charter School School District
Number in Cohort
Percent Graduating
Number in Cohort
Percent Graduating
2013 2016-17
92 91% Data Not Available
Data Not Available
2014 2017-18 114 96%
Data Not Available
Data Not Available
2015 2018-19 93 92.5%
Data Not Available
Data Not Available
ADDITIONAL EVIDENCE
Comparative data has not yet been released for the district of comparison at this time.
Goal 1: Absolute Measure
Each year, 75 percent of students in the high school Total Cohort pursuing an alternative graduation pathway (commonly referred to as the 4+1 pathway) will achieve a Regents equivalency score and pass an approved pathway assessment required for graduation by the end of their fourth year in the cohort.
METHOD
The New York State Board of Regents approved regulations establishing alternative pathways to graduation for all students. Students may replace one of the required Social Studies Regents exams with an approved alternative assessment. For more information about requirements and approved assessments refer to the NYSED resource online: http://www.p12.nysed.gov/ciai/multiple-pathways/. The school will document the names of the alternative assessments administered and success rate for students in the templates bellow.
RESULTS AND EVALUATION
At this time, Uncommon Charter High School did not have 2015 cohort students in an alternative graduation pathway program.
Percentage of the 2015 Graduation Cohort Pathway Students Demonstrating Success by Exam Type
Exam
Number of Graduation Cohort Members Tested
(a)
Number Passing or Achieving Regents Equivalency
(b)
Percentage Passing
=[(b)/(a)]*100

2018-19 ACCOUNTABILITY PLAN PROGRESS REPORT
English CC 91 90 99%
Living Environment 90 85 94%
Global History 24 22 92%
US History 67 67 100%
Algebra 1 51 36 71%
Geometry 38 20 53%
Overall 361 320 89%
Pathway Exam Passing Rate
by Fourth Year Accountability Cohort
Cohort Designation
School Year Number in
Cohort Percent Passing a Pathway
Exam
2013 2016-17 N/A N/A
2014 2017-18 N/A N/A
2015 2018-19 N/A N/A
ADDITIONAL EVIDENCE
SUMMARY OF THE HIGH SCHOOL GRADUATION GOAL
In our 7th year with a graduating cohort, Uncommon Charter High School achieved its High School Graduation goals.
Type Measure Outcome
Leading Indicator
Each year, 75 percent of students in first- and second-year high school Total Graduation Cohorts will earn at least ten credits (if 44 needed for graduation) or five credits (if 22 needed for graduation) each year.
Achieved
Leading Indicator
Each year, 75 percent of students in the high school Total Graduation Cohort will score at least 65 on at least three different New York State Regents exams required for graduation by the completion of their second year in the cohort.
Achieved
Absolute
Each year, 75 percent of students in the fourth-year high school Total Graduation Cohort will graduate.
Achieved
Absolute Each year, 95 percent of students in the fifth-year high school Total Graduation Cohort will graduate.
Achieved
Comparative
Each year, the percent of students in the high school Total Graduation Cohort graduating after the completion of their fourth year will exceed that of the Total Graduation Cohort from the school district of comparison.
N/A
Absolute
Each year, 75 percent of students in the high school Total Cohort pursuing an alternative graduation pathway will achieve a Regents equivalency score and pass an approved pathway assessment required for graduation by the end of their fourth year.
N/A

2018-19 ACCOUNTABILITY PLAN PROGRESS REPORT
ACTION PLAN
● Uncommon Charter High School will continue to use an academic model that is largely similar to that of grades K-8, utilizing practices and approaches that have proven effective in producing significant academic gains at the highest-performing urban public schools in the country. Specifically, the high school will focus around:
● A College Preparatory Mission ● High Standards for Academics and Character ● A Highly Structured Learning Environment ● A Longer School Day and A Longer School Year ● A Focus on Accountability and Data-Driven Instruction ● A Faculty of Committed and Talented Leaders and Teachers
The school has developed a rigorous high school curriculum based on the New York State Learning Standards with a special emphasis on preparing students for admission into and success in college. The school is structured so that students will meet the criteria for a Regents or Advanced Regents degree and will be accepted to at least one 4-year college.
● Quarterly Exams will continue to serve as a critical driver of classroom instruction and lesson planning for grades 9-12. The results will provide teachers with ongoing feedback on students’ progress in meeting state standards so they know, at any moment, which students have mastered which skills and which students have not. Armed with this information, teachers will be better prepared to target instruction and make significant content adjustments throughout the year, without waiting for an end-of-year assessment that shows a student in need.
● Uncommon Charter High School will continue to administer Interim Assessments/Quarterly Exams on a quarterly basis in all five major subjects. Uncommon Charter High School will continue to modify Interim Assessments/Quarterly Exams, ensuring that they measure student progress with respect to the NY Learning Standards.
● The high school instructional leadership team will continue to review teacher lesson plans, observe classroom instruction and provide feedback on instruction. The school’s leadership team will be responsible for identifying areas for growth and providing an extensive professional development program that meets the needs of both the school and individual teachers.
● The school’s leadership team will continue to review the effectiveness of the school’s curriculum and making necessary revisions to increase student achievement.
● School leaders will continue to work with master teachers at the school to research and develop curriculum modifications that will ensure increased levels of student achievement and will continuously monitor the effectiveness of those modifications.
● Uncommon Charter High School will continue to offer Regents/AP/SAT preparation classes on Saturdays beginning in the 9th grade.

2018-19 ACCOUNTABILITY PLAN PROGRESS REPORT
GOAL 2: COLLEGE PREPARATION
GOAL 2: COLLEGE PREPARATION
Students will be prepared to succeed in college.
Goal 2: Absolute Measure
Each year, 75 percent of graduating students will demonstrate their preparation for college by at least one or some combination of the following indicators:
● Passing an Advanced Placement (“AP”) exam with a score of 3 or higher;
● Earning a score of 4 or higher on an International Baccalaureate (“IB”) exam;
● Passing a College Level Examination Program (“CLEP”) exam;
● Passing a college level course offered at a college or university or through a school partnership with a college or university;
● Achieving the college and career readiness benchmark on the SAT; or,
● Earning a Regents diploma with advanced designation.
METHOD
Schools use any method listed here, or any combination thereof, to demonstrate that at least 75 percent of graduates are prepared to engage in rigorous college level coursework. The school should select only those methods listed here that it uses to demonstrate the college readiness of its students and eliminate those that it will not. For instance, high schools that do not deliver an IB Program as part of their high school design do not report on the IB option. The school reports on the number of students who attempted to achieve each indicator, the number who succeeded, and the corresponding percentage. Additionally, the school should report on the overall number of students who graduated after four years, the number of those graduates who achieved any of the relevant measures, and the overall percentage achieving the measure.
RESULTS AND EVALUATION
56% of students in the 2015 Cohort, passed an Advanced Placement exam with a score of 3 or higher. This percentage does not exceed the absolute measure of 75% of graduating students. This is a decrease on the performance of the 2014 Cohort, in which 91% earned a score of 3 or higher on an AP exam.
In addition, 69% of students in the 2015 Cohort also met or exceeded the “college and career readiness benchmark.” Although this number falls below the stated absolute measure, many of these students were also among the 56% earning a score of 3 or higher on an AP exam.
Uncommon Charter High School does not offer courses in partnership with a college or university, nor does Uncommon Charter High School offer the required foreign language instruction required to pass a foreign language Regents exam. Rather than adhere to the Advanced Regents program,

2018-19 ACCOUNTABILITY PLAN PROGRESS REPORT
Uncommon Charter High School students take AP-aligned classes outside the scope of the Regents curriculum. 91%t of students earn a Regents diploma, but do not take additional tests.
Percentage of the 2015 Total Cohort Graduates Demonstrating College Preparation by Indicator
Indicator
Number of Graduates who Attempted the
Indicator
Number who
Achieved Indicator
Percentage of
Graduates who Achieved Indicator
Passing an Advanced Placement exam with a score of 3 or
higher 87 49 56%
Passing a college level course offered at a college or
university or through a school partnership with a college or
university
0 0 0
Achieving the college and career readiness benchmark on
the SAT 86 47 55%
Earning a Regents diploma with advanced designation
87 10 0
Overall
87 60 69
ADDITIONAL EVIDENCE
The percentage of students in the 2015 cohort did not exceed the indicators compared to the 2014 cohort, except on the college and career readiness benchmark on the SAT, which was only 37% for the 2014 cohort.
Goal 2: Absolute Measure
Each year, the College, Career, and Civic Readiness Index (“CCCRI”) for the school’s Total Cohort will exceed the Measure of Interim Progress (“MIP”) set forth in the state’s ESSA accountability system.
METHOD
The state’s finalized ESSA plan includes a College, Career, and Civic Readiness Index that measures the rate of completion among the Total Cohort of a variety of indicators of readiness for the next step after high school. Indicators that are more rigorous and that are therefore more difficult to attain receive greater weight in the new CCCRI (e.g., attaining an Advanced Regents diploma and a score of 4 or higher on an IB exam). Conversely, some less rigorous indicators that were not

2018-19 ACCOUNTABILITY PLAN PROGRESS REPORT
included in the College and Career Readiness Index under the state’s NCLB accountability system are included in the CCCRI (e.g., completion of a high school equivalency program).3
To achieve this measure, the school must have a CCCRI value that equals or exceeds the 2018-19 CCCRI MIP of 130 for all students. The CCCRI is calculated by multiplying the number of students in the cohort demonstrating college, career, and civic readiness by the weighting for the method by which the student demonstrated college, career, and civic readiness, divided by the number of students in the Total Cohort. The highest possible CCCRI is 200.
RESULTS AND EVALUATION
Students in our 2014 and 2015 cohort met the CCCRI measure compared to the MIP set forth by NY State. We attribute this to our focus on the indicators listed above and our college readiness curriculum.
CCCRI Performance by Cohort Year
Graduation Year
Cohort Number of Students in
Cohort
MIP
School CCCRI
2016-17 2013 N/A N/A N/A
2017-18 2014 117 128 217
2018-19 2015 92 130 152.17
ADDITIONAL EVIDENCE
Last year was the first year that Uncommon Charter High School received a CCCRI value. We intend to compare our program over the past two years to determine how we can continue to meet and exceed this measure in the future.
Goal 2: Comparative Measure
Each year, the school’s CCCRI for the Total Cohort will exceed that of the district of comparison’s Total Cohort.
METHOD
The school compares the CCCRI of students from the fourth year in the charter school Total Cohort to that of the respective cohort of students in the school district of comparison.
3 For more detail about the weighting of college readiness methods for calculation of the CCCRI, see pages 64-65 of
the state’s finalized ESSA plan here.

2018-19 ACCOUNTABILITY PLAN PROGRESS REPORT
RESULTS AND EVALUATION
With respect to our district of comparison Uncommon Charter High School district data is not currently available. Our CCCRI value for the 2014 cohort is 217. Our CCCRI value for the 2015 cohort is 152.17.
CCRI of Fourth-Year Total Cohort by Charter School and School District
Cohort
Charter School School District
2013 N/A N/A
2014 217 Data Not Available
2015 152.17 Data Not Available
Goal 2: Absolute Measure
Each year, 75 percent of graduating students will matriculate into a college or university in the year after graduation.
METHOD
The ultimate measure of whether a college prep high school has lived up to its mission is whether students actually enroll and succeed in college. Schools track and report the percentage of fourth-year Total Cohort graduates who matriculate into a two or four-year college program in the school year following graduation.
RESULTS AND EVALUATION
Uncommon Charter High School has a matriculation rate of 99%, far exceeding the goal of 75%. This is due to our robust college counseling team and extremely low counselor to student ratio (approximately 20:1 compared to most high schools in New York City with a ratio of closer to 150:1). Beyond this, we also have a dedicated Alumni Coordinator whose sole responsibility is to stay in contact with all our alumni and visit them on college campuses regularly throughout their time in college.
Matriculation Rate of Graduates by Year
Cohort
Graduation Year
Number of Graduates
(a)
Number Enrolled in 2 or 4-year
Program in Following Year
(b)
Matriculation Rate
=[(b)/(a)]*100
2013 2016-17 86 99% 86
2014 2017-18 106 98% 106
2015 2018-19 89 99% 89

2018-19 ACCOUNTABILITY PLAN PROGRESS REPORT
SUMMARY OF THE COLLEGE PREPARATION GOAL
Uncommon Charter High School achieved the High School Graduation goals, graduating 100% of students during the 2018-19 school year that met 4 of indicators. Furthermore, the school exceeded the New York State benchmark of 75% matriculating in a two- or four-year college.
Type Measure (Accountability Plan from 2012-13 or later) Outcome
Absolute Each year, 75 percent of graduating students will demonstrate their preparation for college by one or more possible indicators of college readiness.
Did Not Achieve
Absolute Each year, the CCCRI for the school’s Total Cohort will exceed that year’s state MIP set forth in the state’s ESSA accountability system.
N/A
Comparative Each year, the school’s CCCRI for the Total Cohort will exceed that of the district’s Total Cohort.
Achieved
Absolute Each year, 75 percent of graduating students will matriculate into a college or university in the year after graduation.
Achieved
ACTION PLAN
● Uncommon Charter High School will continue to use an academic model that is largely similar to that of grades K-8, utilizing practices and approaches that have proven effective in producing significant academic gains at the highest-performing urban public schools in the country. Specifically, the high school will focus around:
● A College Preparatory Mission ● High Standards for Academics and Character ● A Highly Structured Learning Environment ● A Longer School Day and A Longer School Year ● A Focus on Accountability and Data-Driven Instruction ● A Faculty of Committed and Talented Leaders and Teachers
The school has developed a rigorous high school curriculum based on the New York State Learning Standards with a special emphasis on preparing students for admission into and success in college. The school is structured so that students will meet the criteria for a Regents or Advanced Regents degree and will be accepted to at least one 4-year college.
● Quarterly Exams will continue to serve as a critical driver of classroom instruction and lesson planning for grades 9-12. The results will provide teachers with ongoing feedback on students’ progress in meeting state standards so they know, at any moment, which students have mastered which skills and which students have not. Armed with this information, teachers will be better prepared to target instruction and make significant content adjustments throughout the year, without waiting for an end-of-year assessment that shows a student in need.
● Uncommon Charter High School will continue to administer Interim Assessments/Quarterly Exams on a quarterly basis in all five major subjects. Uncommon Charter High School will continue to modify Interim Assessments/Quarterly Exams, ensuring that they measure student progress with respect to the NY Learning Standards.
● The high school instructional leadership team will continue to review teacher lesson plans, observe classroom instruction and provide feedback on instruction. The school’s leadership

2018-19 ACCOUNTABILITY PLAN PROGRESS REPORT
team will be responsible for identifying areas for growth and providing an extensive professional development program that meets the needs of both the school and individual teachers.
● The school’s leadership team will continue to review the effectiveness of the school’s curriculum and making necessary revisions to increase student achievement.
● School leaders will continue to work with master teachers at the school to research and develop curriculum modifications that will ensure increased levels of student achievement and will continuously monitor the effectiveness of those modifications.
● Uncommon Charter High School will continue to offer Regents/AP/SAT preparation classes on Saturdays beginning in the 9th grade.
GOAL 3: ENGLISH LANGUAGE ARTS
Goal 3: English Language Arts
ALL UNCOMMON NEW YORK CITY STUDENTS WILL BE PROFICIENT READERS AND WRITERS OF THE ENGLISH LANGUAGE.
BACKGROUND The Excellence Girls Charter School English Language Arts curriculum reflects our understanding that literacy is the foundation upon which all future knowledge is built. We provide our scholars with 160 minutes of reading instruction each day. Our reading program overcomes our scholars’ early literacy deficits by aggressively accelerating them through a coherent set of curricula that addresses five components of early literacy: phonemic awareness, phonics, vocabulary, fluency, and comprehension. The foundation of our reading curriculum lies in four complementary, research-based programs – Direct Instruction (Reading Mastery); Computer Reading Program; reading comprehension instruction based on the lesson plans of other Uncommon Schools teachers; guided reading instruction based on the STEP assessment, and explicit vocabulary instruction through Text Talk (designed by noted vocabulary expert Isabel Beck). We incorporate these five components of early literacy to provide a rigorous reading education. All Excellence Girls Charter School scholars start the day with a 25-minute Read Aloud, where they sit on the rug, listen to their teacher read to them from a text taken from the Text Talk Program or a teacher-selected text, and answer questions that increase their reading comprehension skills and vocabulary base. Teachers select texts which allow them to teach particular comprehension concepts that are being taught during Reading Comprehension. The Reading Mastery program, which Elementary Academy teachers use as the curriculum for one of the daily 45-minute reading blocks, has an extremely strong research base. It is particularly effective in building the core decoding and fluency skills of students; moreover, the program is designed in a very linear, sequential manner. Students are not allowed to move on until they show

2018-19 ACCOUNTABILITY PLAN PROGRESS REPORT
mastery of the reading material. The Excellence Girls Charter School program gives scholars five 45-minute Reading Mastery lessons a week in order to rapidly accelerate them to mastery. Scholars spend three 45-minute blocks each week doing Reading Comprehension. During this time, scholars delve into authentic literature and practice independent reading strategies. Scholars spend two 45-minute blocks each week doing Guided Reading using the STEP assessment. During this time, teachers use the assessment data as tools that are organized into a developmentally sequenced set of tasks that can help them understand the developmental status of individual students and a class of students at any given point. They also help teachers analyze students' progress over time. Scholars spend their third 45-minute reading block each day of the week on the classroom computers using the computer Reading Program, which provides engaging individualized early literacy instruction that reinforces both phonics and comprehension skills. Because we have two teachers in each classroom, all Excellence Girls Charter School Academy scholars are able to rotate through the above-mentioned three 45-minute reading blocks each day in groups of 10-11 scholars, following the below schedule. Between each reading group, scholars engage in a fun and energizing transition routine (e.g. singing the “Look at how I move! Dance to get from the desks to the rug”). In the Middle Academy, students receive 60 minutes of reading and writing instruction daily, independent reading on several mornings of the week, as well as a robust library with word incentives, including special sweaters for students who reach up to 1,000,000 words. During independent reading, students can read an independent reading book on their level. Their levels are determined by the STAR Reading Assessment 4 times a year. The mobile school library carried books ranging across all grade levels to support scholars’ growth and knowledge. Scholars were given point goals every month to aid in increasing reading levels. Excellence Girls Charter School administers several different assessments throughout the year for various grade levels. Commercial assessments include the STEP Program (see “Summary of ELA Goal” section). School-created assessments include: bimonthly writing compositions and quarterly Interim Assessments. A full-time Learning Support Coordinator helps the Principal develop and lead extensive and intensive professional development to ensure that Leadership Prep Ocean Hill’s English Language Arts Goals are met.
Goal 3: Absolute Measure
Each year, 75 percent of all tested students enrolled in at least their second year will perform at or above proficiency on the New York State English language arts examination for grades 3-8.
METHOD
The school administered the New York State Testing Program English language arts (“ELA”) assessment to students in 3rd through 8th grade in April 2019. Each student’s raw score has been converted to a grade-specific scaled score and a performance level.

2018-19 ACCOUNTABILITY PLAN PROGRESS REPORT
The table below summarizes participation information for this year’s test administration. The table indicates total enrollment and total number of students tested. It also provides a detailed breakdown of those students excluded from the exam. Note that this table includes all students according to grade level, even if they have not enrolled in at least their second year (defined as enrolled by BEDS day of the previous school year).
2018-19 State English Language Arts Exam Number of Students Tested and Not Tested
Grade
Total Tested
Not Tested4 Total Enrolled IEP ELL Absent Refused
3 91 0 0 0 0 91
4 88 1 0 0 0 89
5 54 0 0 0 0 54
6 81 0 0 0 0 81
7 75 0 0 0 0 75
8 81 0 0 0 1 82
All 470 1 0 0 1 472
RESULTS AND EVALUATION
Based on data from the 2018-2019 ELA Exam, we did not meet the measure of 75 percent of all tested students enrolled in at least their second year performing at or above proficiency on the New York State English language arts examination for grades 3-8. For 2018-2019, 67% of our student enrolled in at least their second year performed at or above proficiency. However, we feel energized to embrace the challenge of significant growth that we will need to make in order to achieve the goal. ELA continues to be an important focus area for the school in the 2019-20 school year.
We believe that the steps we continue to take will help to increase student performance on the exam in the coming year.
● We are continuing to prioritize our teacher professional development with a renewed focus on differentiation to meet individualized teacher needs. This includes strengthening our curriculum and lesson plan alignment with NY Standards, providing real-time (in the moment) feedback, developing individual performance goals and implementing measures for accountability. These outlined areas of focus will enable our teachers to further drive student achievement and provide our students with the knowledge and skills to demonstrate proficiency on the NY examinations.
● Our school is focusing on driving the rigor in each classroom, and particularly in our reading and writing classes. Driving rigor in classrooms includes maintaining fidelity to our meticulously developed lesson plans, prioritizing time for student independent practice, and ensuring that teachers are collecting and responding to data throughout their instruction. By providing students with increased opportunities to practice and demonstrate new
4 Students exempted from this exam according to their Individualized Education Program (IEP), because of English Language
Learners (ELL) status, or absence for at least some part of the exam.

2018-19 ACCOUNTABILITY PLAN PROGRESS REPORT
knowledge and skills, our school will prepare them for higher achievement more broadly, and specifically on the state examinations.
● Our school hosts weekly subject data meetings to dive deeply into student performance on lesson standards. This focus enables teachers to adjust lessons as needed in response to student data.
Performance on 2018-19 State English Language Arts Exam
By All Students and Students Enrolled in At Least Their Second Year
Grades
All Students Enrolled in at least their
Second Year
Percent Proficient
Number Tested
Percent Proficient
Number Tested
3 85% 91 84% 80
4 67% 88 68% 81
5 43% 54 39% 36
6 60% 81 65% 68
7 73% 75 72% 61
8 70% 81 71% 75
All 66% 470 67% 401
ADDITIONAL EVIDENCE
We have seen growth in grade levels 4 and 6, and slight dips in levels 3, 5, 7, and 8. The school’s goal remains to see that at least 75% of students reach proficiency on the NYS ELA exam, and we are looking forward to implementing a higher level of rigor and complemental instructional supports in our English Language Arts classes and overall school day to better prepare our students to meet and exceed this bar.
ELA Performance by Grade Level and Year
Grade
Percent of Students Enrolled in At Least Their Second Year Achieving Proficiency
2016-17 2017-18 2018-19
Percent Number Tested
Percent Number Tested
Percent Number Tested
3 81% 80 79% 68 84% 80
4 93% 71 86% 79 68% 81
5 55% 62 62% 70 39% 36
6 52% 62 81% 57 65% 68
7 70% 73 60% 65 72% 61
8 61% 61 71% 72 71% 75
All 70% 409 73% 411 67% 401

2018-19 ACCOUNTABILITY PLAN PROGRESS REPORT
Goal 3: Absolute Measure
Each year, the school’s aggregate Performance Index (“PI”) on the State English language arts exam will meet that year’s state Measure of Interim Progress (“MIP”) set forth in the state’s ESSA accountability system.
METHOD
In New York State, ESSA school performance goals are met by showing that an absolute proportion of a school's students who have taken the English language arts test have scored at the partially proficient, or proficient and advanced performance levels (Levels 2 or 3 & 4). The percentage of students at each of these three levels is used to calculate a PI and determine if the school has met the MIP set each year by the state’s ESSA accountability system. To achieve this measure, all tested students must have a PI value that equals or exceeds the state’s 2018-19 English language arts MIP for all students of 105. The PI is the sum of the percent of students in all tested grades combined scoring at Level 2, plus two times the percent of students scoring at Level 3, plus two-and-a-half times the percent of students scoring at Level 4. Thus, the highest possible PI is 250.
RESULTS AND EVALUATION
In 2018-2019, Excellence Girls tested students had a PI value of 169.5. MIP for 2018 and 2019 for NY State has not yet been released at the time of this report. Based on the Accountability Identification Report data shared by NY State for 2017-18, our school met Higher MIP and State Long Term Goal for ELA.
English Language Arts 2018-19 Performance Index
Number in Cohort
Percent of Students at Each Performance Level
Level 1 Level 2 Level 3 Level 4
469 10% 22% 45% 23%
(103)+(211x2)+(108x2.5)/(47+103+211+108)x100=169.5
Goal 3: Comparative Measure
Each year, the percent of all tested students who are enrolled in at least their second year and performing at proficiency on the state English language arts exam will be greater than that of all students in the same tested grades in the school district of comparison.
METHOD
A school compares tested students enrolled in at least their second year to all tested students in the public school district of comparison. Comparisons are between the results for each grade in which the school had tested students in at least their second year at the school and the total result for all students at the corresponding grades in the school district.5
5 Schools can acquire these data when the New York State Education Department releases its database containing grade level
ELA and math test results for all schools and districts statewide. The NYSED announces the release of the data on its News Release webpage.

2018-19 ACCOUNTABILITY PLAN PROGRESS REPORT
RESULTS AND EVALUATION
In 2018-2019, Excellence Girls tested students who were enrolled in at least their second year, all outperformed students in the same tested grades in Community District 16 and 17 on the English Language Arts Exam. The school had 67% of students perform at proficiency compared to the district’s 41%. This data further supports that the longer students are enrolled at Excellence Girls Charter School, the more prepared they are for college. This demonstrates that when students are enrolled at Excellence Girls, the more prepared they are for rigorous curriculum and to succeed in college.
2018-19 State English Language Arts Exam Charter School and District Performance by Grade Level
Grade
Percent of Students at or Above Proficiency
Charter School Students In At Least 2nd Year
All District Students
Percent Number Tested
Percent Number Tested
3 84% 80 46% 502
4 68% 81 43% 539
5 39% 36 30% 1330
6 65% 68 44% 1543
7 72% 61 37% 1468
8 71% 75 47% 1513
All 67% 401 41% 6895
ADDITIONAL EVIDENCE
Over the past three years, the school has outperformed the community district overall and across almost every grade on the English Language Arts exam. In 2016-2017, 70% of Excellence Girls students in at least their second year scored proficient compared with 34% in Community District 16/17. By the same metric in 2017-2018, there were 73% of Excellence Girls students and 34% of community district students scoring proficient. Finally, in 2018-2019, there were 67% of Excellence Girls students and 41% of community district students scoring proficient.

2018-19 ACCOUNTABILITY PLAN PROGRESS REPORT
English Language Arts Performance of Charter School and Local District
by Grade Level and School Year
Grade
Percent of Students Enrolled in at Least their Second Year Scoring at or Above Proficiency Compared to District Students
2016-17 2017-18 2018-19
Charter School
District Charter School
District Charter School
District
3 81% 35% 79% 46% 84% 46%
4 93% 36% 86% 48% 68% 43%
5 55% 29% 62% 29% 39% 30%
6 52% 24% 81% 23% 65% 44%
7 70% 35% 60% 21% 72% 37%
8 61% 42% 71% 28% 71% 47%
All 70% 34% 73% 34% 67% 41%
Goal 3: Comparative Measure
Each year, the school will exceed its predicted level of performance on the state English language
arts exam by an effect size of 0.3 or above (performing higher than expected to a meaningful degree) according to a regression analysis controlling for economically disadvantaged students among all public schools in New York State.
METHOD
The SUNY Charter Schools Institute (“Institute”) conducts a comparative performance analysis, which compares the school’s performance to that of demographically similar public schools statewide. The Institute uses a regression analysis to control for the percentage of economically disadvantaged students among all public schools in New York State. The Institute compares the school’s actual performance to the predicted performance of public schools with a similar concentration of economically disadvantaged students. The difference between the school’s actual and predicted performance, relative to other schools with similar economically disadvantaged statistics, produces an Effect Size. An Effect Size of 0.3, or performing higher than expected to a meaningful degree, is the requirement for achieving this measure.
Given the timing of the state’s release of economically disadvantaged data and the demands of the data analysis, the 2018-19 analysis is not yet available. This report contains 2017-18 results, the most recent Comparative Performance Analysis available.
RESULTS AND EVALUATION
The table below shows that the school’s overall comparative performance is higher than expected overall. Once again, Excellence Girls met this measure with a significant positive effect size in all grades. In 2017-2018, the aggregate effect size for Excellence Girls was 1.87. The effect size

2018-19 ACCOUNTABILITY PLAN PROGRESS REPORT
dropped slightly from last year’s overall effect size of 1.89, to this year’s current effect size of 1.87. We are continually pushing our student growth and are excited to see the magnitude of the work we are seeing each year
2017-18 English Language Arts Comparative Performance by Grade Level
Grade Percent
Economically Disadvantaged
Number Tested
Percent of Students at Levels 3&4
Difference between Actual and Predicted
Effect Size
Actual Predicted
3 82.0 90 80.0 41.5 38.5 2.13
4 80.4 87 87.4 39.3 48.0 2.49
5 76.7 88 59.1 29.5 29.6 1.82
6 78.7 82 76.8 39.8 37.0 1.97
7 78.5 88 61.4 31.2 30.2 1.62
8 74.5 90 65.6 41.2 24.3 1.20
All 78.5 525 71.6 37.1 34.5 1.87
School’s Overall Comparative Performance:
Higher than expected to large degree
ADDITIONAL EVIDENCE
As the school continues to strengthen its English language program, the effect size is anticipated to increase.
English Language Arts Comparative Performance by School Year
School Year
Grades
Percent Economically Disadvantage
d
Number Tested
Actual Predicted Effect Size
2015-16 K-7, 9-12 76.80% 325 69.8 31 1.98
2016-17 K-12 73.00% 512 65.4 32.5 1.89
2017-18 K-12 79.30% 525 74.0 36.4 1.87
Goal 3: Growth Measure6
Each year, under the state’s Growth Model, the school’s mean unadjusted growth percentile in English language arts for all tested students in grades 4-8 will be above the target of 50.
6 See Guidelines for Creating a SUNY Accountability Plan for an explanation.

2018-19 ACCOUNTABILITY PLAN PROGRESS REPORT
METHOD
This measure examines the change in performance of the same group of students from one year to the next and the progress they are making in comparison to other students with the same score in the previous year. The analysis only includes students who took the state exam in 2017-18 and also have a state exam score from 2016-17 including students who were retained in the same grade. Students with the same 2016-17 score are ranked by their 2017-18 score and assigned a percentile based on their relative growth in performance (student growth percentile). Students’ growth percentiles are aggregated school-wide to yield a school’s mean growth percentile. In order for a school to perform above the target for this measure, it must have a mean growth percentile greater than 50.
Given the timing of the state’s release of Growth Model data, the 2018-19 analysis is not yet available. This report contains 2017-18 results, the most recent Growth Model data available.7
RESULTS AND EVALUATION
The school’s overall Mean Growth Percentile was 48.1%, which is less than 50 and the Growth Measure set forth by the State. Individually, our school did meet the goal in 4 and 7 grades individually.
2017-18 English Language Arts Mean Growth Percentile by Grade Level
Grade Mean Growth Percentile
School Target
4 55.7 50.0
5 37.5 50.0
6 49.8 50.0
7 51.6 50.0
8 46.3 50.0
All 48.1 50.0
ADDITIONAL EVIDENCE
In 2017-2018, we did not meet this measure, and we spent time examining and analyzing teacher practice and support during the 2018-2019 school year to make progress toward this benchmark. This included better guided reading instruction, additional passage practice for middle school and building a more cohesive English Language Arts curriculum. While we are still working toward meeting this measure across all grades, we are excited to see an increase in 5th and 8th grade from last year.
English Language Arts Mean Growth Percentile by Grade Level and School Year
Grade
Mean Growth Percentile
2015-16 2016-17 2017-18 Target
4 63.8 64.3 55.7 50.0
7 Schools can acquire these data from the NYSED’s Business Portal: portal.nysed.gov.

2018-19 ACCOUNTABILITY PLAN PROGRESS REPORT
5 53.9 29.6 37.5 50.0
6 57.4 56.3 49.8 50.0
7 66.3 53.5 51.6 50.0
8 0 41.5 46.3 50.0
All 60.2 49.5 48.1 50.0
SUMMARY OF THE ENGLISH LANGUAGE ARTS GOAL
In its fifth year of state testing, Excellence Girls met 2 out of the 4 applicable English Language Arts goals and we feel confident we will reach 1 of 2 absolute goals once the MIP data is released.
Type Measure Outcome
Absolute Each year, 75 percent of all tested students who are enrolled in at least their second year will perform at proficiency on the New York State English language arts exam for grades 3-8.
Did not Achieve
Absolute Each year, the school’s aggregate PI on the state’s English language arts exam will meet that year’s state MIP as set forth in the state’s ESSA accountability system.
N/A
Comparative
Each year, the percent of all tested students who are enrolled in at least their second year and performing at proficiency on the state English language arts exam will be greater than that of students in the same tested grades in the school district of comparison.
Achieved
Comparative
Each year, the school will exceed its predicted level of performance on the state English language arts exam by an effect size of 0.3 or above (performing higher than expected to a meaningful degree) according to a regression analysis controlling for economically disadvantaged students among all public schools in New York State. (Using 2017-18 results.)
Achieved
Growth Each year, under the state’s Growth Model the school’s mean unadjusted growth percentile in English language arts for all tested students in grades 4-8 will be above the target of 50. (Using 2017-18 results.)
Did not achieve
ACTION PLAN
Literacy is the foundation on which all other learning rests, and accordingly, English Language Arts (ELA) instruction lies at the core of Excellence Girls’ curriculum. Excellence Girls has come close to meeting most of its ELA accountability goals over this past year, has demonstrated progress towards all remaining goals, and is continuously improving upon its literacy instruction. Excellence Girls e realizes that, similar to most urban public schools, this is still an area for growth.
Based on historical accountability progress performance, Excellence Girls urgently made adjustments to improve outcomes for students since last year. This year we intend to strengthen skills as well as systems for responding to data. Our Dean of Curriculum and Instruction will hold weekly practice groups with their newest teachers to give feedback and improve instruction provided to students, Instructional Leaders will review teacher lesson plans weekly and provided

2018-19 ACCOUNTABILITY PLAN PROGRESS REPORT
feedback before implementation, and leaders will increase the amount of real time feedback given to teachers during the school day. Additionally, our instructional leadership along with the Uncommon Curriculum and Development team will lead professional development sessions in addition to Weekly Data Meetings and Creating Response to Data Lessons. As a result, we intend to see an increase in student performance on the NYS ELA exam for this coming year and make more progress toward our absolute, growth and comparative ELA accountability goals and measures for school year 2019-2020.
HIGH SCHOOL ENGLISH LANGUAGE ARTS
Goal 3: Absolute Measure
Each year, 65 percent of students in the high school Accountability Cohort will exceed Common Core expectations (currently scoring at or above Performance Level 4 on the Regents Exam in English Language Arts (Common Core)) by the completion of their fourth year in the cohort.
METHOD
The school administered the Regents English exam that students must pass to graduate. The school scores Regents on a scale from 0 to 100. The State Education Department currently defines the college and career readiness standard as scoring at or above Performance Level 4 (meeting Common Core expectations) on the Regents Exam in English Language Arts (Common Core). This measure examines the percent of the Accountability Cohort that achieved at least Performance Level 4 by the completion of their fourth year in the cohort.
RESULTS AND EVALUATION
Uncommon Charter High School’s 2013 cohort had 92 students (91%) pass the English Regents with a score of 75 or higher. The 2014 cohort had 114 students (86%) pass the English Regents with a score of 75 or higher. The 2015 cohort had 93 students (72%) pass the English Regents with a score of 75 or higher.
This exceeds the goal of 65% of students passing the English Language Arts Common Core Regents Exam with a score of 75% or higher. We expect to continue to see a similar level of performance with future cohorts.
Percent Scoring at Least Level 4 on Regents English Common Core Exam
by Fourth Year Accountability Cohort8
Cohort Designation
Fourth
Year
Number in
Cohort
Percent Scoring at Least Level 4 on Common Core
ELA Exam
2013 2016-17 92 91%
2014 2017-18 114 86%
2015 2018-19 93 72%
8 Based on the highest score for each student on the English Regents exam

2018-19 ACCOUNTABILITY PLAN PROGRESS REPORT
Percent Achieving at Least Level 4 by Cohort and Year
Cohort Designatio
n
2016-17 2017-18 2018-19
Number in Cohort
Percent Level 4
Number in Cohort
Percent Level 4
Number in Cohort
Percent Level 4
2015 117 60% 104 68% 93 72%
2016 241 20% 271 40% 254 50%
2017 89 37% 76 43%
2018 223 20%
Goal 3: Absolute Measure
Each year, 80 percent of students in the high school Accountability Cohort will at least partially meet Common Core expectations (currently scoring at or above Performance Level 3 on the Regents Exam in English Language Arts (Common Core)) by the completion of their fourth year in the cohort.
METHOD
The school administered the Regents English exam that students must pass to graduate. The school scores Regents on a scale from 0 to 100. The State Education Department currently defines the cut off for passing and meeting the requirement for graduation as scoring at or above Performance Level 3 (partially meeting Common Core expectations) on the Regents Exam in English Language Arts (Common Core). This measure examines the percent of the Accountability Cohort that achieved at least Performance Level 3 by the completion of their fourth year in the cohort.
RESULTS AND EVALUATION
99% of the 2013 cohort, 100% of the 2014 cohort, and 98% of the 2015 scored at least a level 3 on the Regents English Exam. This far exceeds the goal of 80% of students in the cohort will score at or above a level 3. We are excited to continue to monitor our progress with future cohorts of students.
Percent Scoring at Least Level 3 on Regents English Common Core Exam
by Fourth Year Accountability Cohort9
Cohort Designation
Fourth
Year
Number in
Cohort
Percent Scoring at Least Level 3 on the Regents
English Exam
2013 2016-17 92 99%
2014 2017-18 114 100%
2015 2018-19 93 98%
9 Based on the highest score for each student on the English Regents exam

2018-19 ACCOUNTABILITY PLAN PROGRESS REPORT
ADDITIONAL EVIDENCE
Percent Achieving at Least Level 3 by Cohort and Year
Cohort Designatio
n
2016-17 2017-18 2018-19
Number in Cohort
Percent Passing
Number in Cohort
Percent Passing
Number in Cohort
Percent Passing
2015 117 90% 104 95% 93 98%
2016 241 39% 271 69% 254 85%
2017 89 57% 76 72%
2018 223 56%
Goal 3: Absolute Measure
Each year, the Performance Index (“PI”) on the Regents English exam of students completing their fourth year in the Accountability Cohort will meet the state’s Measure of Interim Progress (“MIP”) set forth in the state’s ESSA accountability system.
METHOD
In the state’s revised calculation of the high school Performance Index, schools now receive additional credit for students scoring at Accountability Level 4.10 To achieve this measure, all tested students in the Accountability Cohort must have a PI that equals or exceeds the state’s 2018-19 English language arts MIP for all students of 191.
The Performance Index is calculated as such: (percent of students scoring at Accountability Level 2) + 2*(percent of students scoring at Accountability Level 3) + 2.5 * (percent of students scoring at Accountability Level 4). Thus, the highest possible PI is 250. The basis for the percent of students is the school’s fourth year Accountability Cohort. The Regents Examination in English Language Arts (Common Core) is scored on a scale from 0 to 100; 0 to 64 is Accountability Level 1, 65 to 78 is Accountability Level 2; 79 to 84 is Accountability Level 3, and 85 to 100 is Accountability Level 4.
RESULTS AND EVALUATION
Based on the 2015 High School Accountability Cohort, the School achieved this measure and surpassed the 2018-2019 ELA MIP with a score of 232. At this time, the Performance Index benchmark is unavailable.
English Language Arts Performance Index (PI)
10 For more details on the score ranges used to determine Accountability Levels as distinguished from Performance
Levels, see www.p12.nysed.gov/irs/sirs/documents/2017RegentsScoreRangesforAnnualandAccountabilityReporting.pdf

2018-19 ACCOUNTABILITY PLAN PROGRESS REPORT
For the 2015 High School Accountability Cohort
Number in Cohort
Percent of Students at Each Accountability Level
Level 1 Level 2 Level 3 Level 4
93 1% 0 26% 72%
PI = 0 + 26 + 72 = 98 26 + 72 = 98 + 36 = 36 PI = 232
Goal 3: Comparative Measure
Each year, the percent of students in the high school Total Cohort meeting or exceeding Common Core expectations on the Regents Exam in English Language Arts (Common Core) will exceed the percentage of comparable students in the district meeting or exceeding Common Core expectations.
METHOD
The school compares the performance of students in their fourth year in the charter school Total Cohort to that of the respective Total Cohort of students in the school district of comparison. Due to availability of comparative data, this measure uses the school’s Total Cohort results and not the Accountability Cohort results. In order to meet or exceed Common Core expectations, a student must achieve Performance Level 4 or 5. Given that students may take Regents exam up through the summer of their fourth year, the school presents most recently available school district results.
RESULTS AND EVALUATION
Uncommon Charter High School’s 2015 cohort 72% of students achieve performance level 4 or higher on English Regents. This exceeds the school district comparison of 45%. The Uncommon Charter High School cohort exceed the percentage of comparable students in the district meeting or exceeding Common Core expectations.
Percent Achieving Performance Level 4 or Higher on English Regents
of Fourth-Year Total Cohorts by Charter School and School District
Cohort
Fourth
Year
Charter School School District
Percent Level 4 or 5
Number in Cohort
Percent Level 4 or 5
Number in Cohort
2013 2016-17
81% 89
Data Not
Available
Data Not
Available
2014 2017-18 86% 114 40% 1,793
2015 2018-19 72% 93 45% 2,657
ADDITIONAL EVIDENCE

2018-19 ACCOUNTABILITY PLAN PROGRESS REPORT
Goal 3: Comparative Measure
Each year, the percent of students in the high school Total Cohort at least partially meeting Common Core expectations on the Regents Exam in English Language Arts (Common Core) will exceed the percentage of comparable students in the district at least partially meeting Common Core expectations.
METHOD
The school compares the performance of students in their fourth year in the charter school Total Cohort to that of the respective Total Cohort of students in the school district of comparison. Due to availability of comparative data, this measure uses the school’s Total Cohort results and not the Accountability Cohort results. In order to at least partially meet Common Core expectations, a student would need to pass the exam and score at Performance Level 3 or higher (i.e. scoring at least 65). Given that students may take Regents exam up through the summer of their fourth year, the school presents most recently available school district results.
RESULTS AND EVALUATION
At the time of this report, comparative data for 2015 cohort has not yet been released. Uncommon Charter High School will update this report when the data becomes available. Our 2013 and 2014 cohorts met/exceeded the percentage of comparable students in the district at least partially meeting Common Core expectations.
Percent Achieving Performance Level 3 or Higher on English Regents
of Fourth-Year Total Cohorts by Charter School and School District
Cohort
Fourth
Year
Charter School School District
Percent Level 3 or
Higher
Number in Cohort
Percent Level 3 or Higher
Number in Cohort
2013 2016-17 99% 89 74% 2,657
2014 2017-18 100% 114 70% 1,793
2015 2018-19
98% 93
Data not
Available
Data not
Available
ADDITIONAL EVIDENCE
Goal 3: Comparative Measure
Each year, the Performance Index (“PI”) in Regents English of students in the fourth year of their high school Accountability Cohort will exceed that of comparable students from the school district of comparison.

2018-19 ACCOUNTABILITY PLAN PROGRESS REPORT
METHOD
The school compares the performance of students in their fourth year in the charter school Accountability Cohort to that of the respective cohort of students in the school district of comparison. Given that students may take Regents exam up through the summer of their fourth year, the school presents most recently available school district results.
RESULTS AND EVALUATION
At the time of this report, comparative Performance Index data for English Regents had not yet been released. Uncommon Charter High School will update this report when the data becomes available.
English Regents Performance Index (PI)11
of Fourth-Year Accountability Cohorts by Charter School and School District
Cohort
Fourth
Year
Charter School School District
PI Cohort
Size PI
Cohort Size
2013 2016-17
213 89
Data Not
Available
Data Not
Available
2014 2017-18
243 114
Data Not
Available
Data Not
Available
2015 2018-19
232 93
Data Not
Available
Data Not
Available
ADDITIONAL EVIDENCE
Goal 3: Growth Measure
Each year, 50 percent of students in the high school Accountability Cohort who did not score proficient on their New York State 8th grade English language arts exam will meet the college and career readiness standard (currently scoring at Performance Level 4 and fully meeting Common Core expectations on the Regents Exam in English Language Arts (Common Core)) by the completion of their fourth year in the cohort.
METHOD
The school demonstrates the effectiveness of its English language arts program by enabling students who were not meeting proficiency standards in the eighth grade to meet the English requirement for the college and career readiness standard.
11 For an explanation of the procedure to calculate the school’s PI, see page 28.

2018-19 ACCOUNTABILITY PLAN PROGRESS REPORT
RESULTS AND EVALUATION
Of the 59 students in the 2013 cohort who were not proficient in the 8th grade for English language arts exams, 73% met the college and career readiness standard of scoring at Performance Level 4 and fully meeting the Common Core expectations on the Regents Exams in English Language Arts.
Of the 63 students in the 2014 cohort who were not proficient in the 8th grade for English language arts exams, 83% met the college and career readiness standard of scoring at Performance Level 4 and fully meeting the Common Core expectations on the Regents Exams in English Language Arts.
Of the 51 students in the 2015 cohort who were not proficient in the 8th grade for English language arts exams, 63% met the college and career readiness standard of scoring at Performance Level 4 and fully meeting the Common Core expectations on the Regents Exams in English Language Arts.
This does meet the measure.
Percent Achieving at Least Performance Level 4 on Common Core exam among Students
Who Were Not Proficient in the 8th Grade by Fourth Year Accountability Cohort 12
Cohort Designation
Fourth
Year
Number in Cohort
Percent Achieving Level 4 on Common Core exam
2013 2016-17 59 73%
2014 2017-18 63 83%
2015 2018-19 51 63%
ADDITIONAL EVIDENCE
Goal 3: Growth Measure
Each year, 75 percent of students in the high school Accountability Cohort who did not score proficient on their New York State 8th grade English language arts exam will at least partially meet Common Core expectations (currently scoring at Performance Level 3 on the Regents Exam in English Language Arts (Common Core)) by the completion of their fourth year in the cohort.
METHOD
The school demonstrates the effectiveness of its English language arts program by enabling students who were not meeting proficiency standards in the eighth grade to meet the English requirement for graduation.
12 Based on the highest score for each student on the English Regents exam

2018-19 ACCOUNTABILITY PLAN PROGRESS REPORT
RESULTS AND EVALUATION
Of the 59 students in the 2013 cohort who were not proficient in the 8th grade for English language arts exams, 98% met the college and career readiness standard of scoring at Performance Level 3 and fully meeting the Common Core expectations on the Regents Exams in English Language Arts.
Of the 63 students in the 2014 cohort who were not proficient in the 8th grade for English language arts exams, 100% met the college and career readiness standard of scoring at Performance Level 3 and fully meeting the Common Core expectations on the Regents Exams in English Language Arts.
Of the 51 students in the 2015 cohort who were not proficient in the 8th grade for English language arts exams, 98% met the college and career readiness standard of scoring at Performance Level 3 and fully meeting the Common Core expectations on the Regents Exams in English Language Arts.
This does meet the measure.
Percent Achieving at Least Performance Level 3 on Common Core exam among Students
Who Were Not Proficient in the 8th Grade by Fourth Year Accountability Cohort 13
Cohort Designation
Fourth
Year
Number in Cohort
Percent Achieving Level 3 on Regents English Exam
2013 2016-17 59 98%
2014 2017-18 63 100%
2015 2018-19 51 98%
ADDITIONAL EVIDENCE
SUMMARY OF THE HIGH SCHOOL ENGLISH LANGUAGE ARTS GOAL
The 2015 Graduating Cohort achieved and surpassed the English Language Arts goals. Approximately 72% of the 2015 cohort has scored a Level 4 on the Regents Exam in English Language Arts, and 98% of students scored at least a Level 3 on the exam. Regarding both measurements, the 2015 cohort surpassed the necessary benchmark and measure.
Additionally, among the students in the 2015 Graduating Cohort who did not achieve a proficient score in their 8th grade New York State English Language Arts exams, 63% achieved at least a Level 4 score and 98% achieved at least a level 3 score on their English Language Arts Regents Exams.
The 2015 Cohort has a Performance Index of 232 out of 250.
13 Based on the highest score for each student on the English Regents exam

2018-19 ACCOUNTABILITY PLAN PROGRESS REPORT
Type Measure Outcome
Absolute
Each year, 65 percent of students in the high school Accountability Cohort will meet or exceed Common Core expectations (currently scoring at or above Performance Level 4 on the Regents Exam in English Language Arts (Common Core)) by the completion of their fourth year in the cohort.
Achieved
Absolute
Each year, 80 percent of students in the high school Accountability Cohort will at least partially meet Common Core expectations (currently scoring at or above Performance Level 3 on the Regents Exam in English Language Arts (Common Core)) by the completion of their fourth year in the cohort.
Achieved
Absolute
Each year, the Performance Index (PI) on the Regents English exam of students completing their fourth year in the Accountability Cohort will meet the state Measure of Interim Progress (MIP) set forth in the state’s ESSA accountability system.
Achieved
Comparative
Each year, the percentage of students in the Total Cohort meeting or exceeding Common Core expectations on the Regents Exam in English Language Arts (Common Core) will exceed the percentage of comparable students from the district meeting or exceeding Common Core expectations.
Achieved
Comparative
Each year, the percentage of students in the Total Cohort partially meeting Common Core expectations on the Regents Exam in English Language Arts (Common Core) will exceed the percentage of comparable students in the district at least partially meeting Common Core expectations.
No Data Yet
Comparative
Each year, the Performance Index (PI) in Regents English of students in the fourth year of their high school Accountability Cohort will exceed that of comparable students from the school district of comparison. (Using 2016-17 school district results.)
No Data Yet
Growth
Each year, 50 percent of students in the high school Accountability Cohort who did not score proficient on their New York State 8th grade English language arts exam will meet or exceed Common Core expectations (currently scoring at or above Performance Level 4 on the Regents Exam in English Language Arts (Common Core)) by the completion of their fourth year in the cohort.
Achieved
Growth
Each year, 75 percent of students in the high school Accountability Cohort who did not score proficient on their New York State 8th grade English language arts exam will at least partially meet Common Core expectations (currently scoring at least Performance Level 3 on the Regents Exam in English Language Arts (Common Core)) by the completion of their fourth year in the cohort.
Achieved
ACTION PLAN
● Students will continue to receive 60-120 minutes of English instruction each day.
● The high school instructional leadership team will continue to review teacher lesson plans, observe classroom instruction and provide feedback on instruction.
● The school’s leadership team will be responsible for identifying areas for growth and providing an extensive professional development program that meets the needs of both the school and individual teachers.
● The school’s leadership team will continue to review the effectiveness of the school’s curriculum and make necessary revisions to increase student achievement.

2018-19 ACCOUNTABILITY PLAN PROGRESS REPORT
● School leaders will continue to work with master teachers at the school to research and develop curriculum modifications that will ensure increased levels of student achievement and will continuously monitor the effectiveness of those modifications.
● Uncommon Charter High School will continue to offer Regents/AP/SAT preparation beginning in the 9th grade and continuing through all four grades
● Uncommon Charter High School will continue to provide professional development before the school year, during the school year, and following the school year, during which teachers can review and discuss results.
GOAL 4: MATHEMATICS
Goal 4: Mathematics
STUDENTS WILL DEMONSTRATE COMPETENCY IN THE UNDERSTANDING AND APPLICATION OF MATHEMATICAL
COMPUTATION AND PROBLEM SOLVING.
BACKGROUND
We believe our students should be able to compute numbers quickly and accurately, apply appropriate math procedures in single- and multi-step problems, and speak and write fluently and clearly about math problem solving and procedures, using accurate mathematical vocabulary. For this reason, our students take 90 minutes of math per day, during which students review concepts for procedural fluency, explore conceptual understanding of old and new content through guided instruction and partner work, and engage in rigorous problem solving requiring the application of skills and the extension of learned content. Basically, we double the time dedicated to math instruction each day to ensure that students can compute and problem solve. Excellence Girls uses data from the following assessments to ensure student proficiency in Mathematics:
● Criterion-referenced New York State exams in Mathematics ● Internally developed Interim Assessments in Mathematics ● Internally developed Final Examination in Mathematics
Excellence Girls administered 5 internally developed and aligned Interim Assessments, including a Final Exam in Math during the 2018-19 school year. These assessments were created to reflect the school’s scope and sequence in Math, and to mirror the style and scope of the New York State Math exams. The assessments focused primarily on the most recently covered standards, with a smaller focus on cumulative skills and standards covered in previous units. After the tests were administered, teachers graded each exam and entered individual performance data into a shared template for detailed test analysis. With the individual student, whole class, and whole grade data, teachers analyzed the data and developed strategic plans to re-teach specific standards to individuals, small groups, and classes. Excellence Girls also utilized the information to target content- and skills-driven tutoring throughout the day in school from January to May.

2018-19 ACCOUNTABILITY PLAN PROGRESS REPORT
Goal 4: Absolute Measure
Each year, 75 percent of all tested students enrolled in at least their second year will perform at proficiency on the New York State mathematics examination for grades 3-8.
METHOD
The school administered the New York State Testing Program mathematics assessment to students in 3 through 8 grade in April 2019. Each student’s raw score has been converted to a grade-specific scaled score and a performance level.
The table below summarizes participation information for this year’s test administration. The table indicates total enrollment and total number of students tested. It also provides a detailed breakdown of those students excluded from the exam. Note that this table includes all students according to grade level, even if they have not enrolled in at least their second year.
2018-19 State Mathematics Exam Number of Students Tested and Not Tested
Grade Total
Tested
Not Tested14 Total Enrolled IEP ELL Absent Refused
3 91 0 0 0 1 92
4 88 0 0 0 1 89
5 54 0 0 0 0 54
6 79 0 0 0 2 81
7 75 0 0 0 0 75
8 N/A N/A N/A N/A N/A N/A
All 387 0 0 0 4 391
RESULTS AND EVALUATION
On the 2018-19 NYS Math exam, 68.4% of students in their second year at Excellence Girls scored advanced or proficient. When looking at all students, including those that have been at Excellence Girls Charter School for less than 2 years, only 65.6% of students scored advanced or proficient.
While we keep making progress, In the 6th year of the administration of the New York State mathematics examination, the school did not meet its measure of at least 75% of students reaching proficiency on the Common Core exam. In evaluating our scholars’ results, we are strengthening our math curriculum and teacher development to help bring all our scholars, not just those in at least their second year, closer to meeting the 75% goal of proficiency. We are looking forward to implementing a higher level of rigor in our Math classes going forward to better prepare our students to meet this bar.
Performance on 2018-19 State Mathematics Exam
14 Students exempted from this exam according to their Individualized Education Program (IEP), because of English Language
Learners (ELL) status, or absence for at least some part of the exam.

2018-19 ACCOUNTABILITY PLAN PROGRESS REPORT
By All Students and Students Enrolled in At Least Their Second Year
Grades
All Students Enrolled in at least their
Second Year
Percent Proficient
Number Tested
Percent Proficient
Number Tested
3 89% 91 90% 80
4 72% 88 69% 84
5 54% 54 56% 36
6 56% 79 60% 67
7 57% 75 67% 61
8 N/A N/A N/A N/A
All 65.6% 387 68.4% 328
ADDITIONAL EVIDENCE
We have seen growth in grade levels 3, 5, 6, 7 and a slight dip in 4th grade. The school’s goal remains to see that at least 75% of students reach proficiency on the NYS Math exam, and we are looking forward to implementing a higher level of rigor and complemental instructional supports in our Math classes and overall school day to better prepare our students to meet and exceed this bar.
Performance on a Regents Mathematics Exam Of 8th Grade All Students by Year
Grade Year
Regents Exam
Percent Passing
with a 65
Number Tested
8 2016-17 Algebra 1 83% 71
8 2017-18 Algebra 1 64% 88
8 2018-19 Algebra 1 47% 76
The chart above represents the percentage of Excellence Girls’ 8th grade cohort who passed the Algebra 1 regents with a score of 65. From our 2018-2019 8th grade cohort, 47% scored 65 or higher on the Algebra 1 Regents exam. Based on this data, we are confident that they are developing a strong foundation preparing them for College.
Mathematics Performance by Grade Level and School Year
Grade
Percent of Students Enrolled in At Least Their Second Year Achieving Proficiency
2016-17 2017-18 2018-19
Percent Number Tested
Percent Number Tested
Percent Number Tested
3 87% 82 90% 80 90% 80

2018-19 ACCOUNTABILITY PLAN PROGRESS REPORT
4 97% 68 93% 71 69% 84
5 62% 55 65% 62 56% 36
6 63% 62 59% 63 60% 67
7 63% 60 60% 73 67% 61
8 N/A N/A N/A N/A N/A N/A
All 78% 327 74% 349 68.4% 328
Goal 4: Absolute Measure
Each year, the school’s aggregate Performance Index (“PI”) on the state mathematics exam will meet that year’s state Measure of Interim Progress (“MIP”) set forth in the state’s ESSA accountability system.
METHOD
In New York State, ESSA school performance goals are met by showing that an absolute proportion of a school's students who have taken the mathematics test have scored at the partially proficient, or proficient and advanced performance levels (Levels 2 or 3 & 4). The percentage of students at each of these three levels is used to calculate a PI and determine if the school has met the MIP set each year by the state’s ESSA accountability system. To achieve this measure, all tested students must have a PI value that equals or exceeds the state’s 2018-19 mathematics MIP for all students of 107. The PI is the sum of the percent of students in all tested grades combined scoring at Level 2, plus two times the percent of students scoring at Level 3, plus two-and-a-half times the percent of students scoring at Level 4. Thus, the highest possible PI is 250.
RESULTS AND EVALUATION
Excellence Girls achieved a Performance Level Index of 175.5. The 2019 MIP for NY State has not yet been released at the time of this report. Therefore, Excellence Girls cannot report if this measure was achieved.
Mathematics 2017-18 Performance Level Index (PI)
Number in Cohort
Percent of Students at Each Performance Level
Level 1 Level 2 Level 3 Level 4
387 9% 24% 33% 34%
(93)+(128x2)+(132x2.5)/(35+93+128+132)x100=175.5

2018-19 ACCOUNTABILITY PLAN PROGRESS REPORT
Goal 4: Comparative Measure
Each year, the percent of all tested students who are enrolled in at least their second year and performing at proficiency on the state mathematics exam will be greater than that of all students in the same tested grades in the school district of comparison.
METHOD
A school compares the performance of tested students enrolled in at least their second year to that of all tested students in the public school district of comparison. Comparisons are between the results for each grade in which the school had tested students in at least their second year at the school and the total result for all students at the corresponding grades in the school district.15
RESULTS AND EVALUATION
Excellence Girls percentage of students scoring proficient on the NYS mathematics exam exceeded the percentage of students in Community School District 16-17 scoring proficient or advanced on the exam in the same grades by 29%.
Excellence Girls met its comparative measure with its overall percentage of students scoring proficient exceeding the percentage of students in CSD 16-17 scoring proficient or advanced on the 2019 NYS Math Exam. In all grades, 67% of students in their second year at Excellence Girls scored proficient or advanced. While Excellence Girls is still not satisfied with this performance and hopes to get all students to proficiency as quickly as possible, the school is glad to offer students a viable alternative to reaching math proficiency. 2018-1 Charter School and District Performance by Grade Level
Grade
Percent of Students at or Above Proficiency
Charter School Students In At Least 2nd Year
All District Students
Percent Number Tested
Percent Number Tested
3 90% 80 49% 498
4 69% 84 41% 537
5 56% 36 34% 1353
6 60% 67 39% 1556
7 67% 61 33% 1344
8 N/A N/A 40% 668
All 68.4% 328 39.3% 5956
ADDITIONAL EVIDENCE
Over the past three years, the school has outperformed the community district overall and across almost every grade on the NYS Math exam. In 2016-2017, 74% of Excellence Girls students in at least their second year scored proficient compared with 20% in Community District 16-17. By the
15 Schools can acquire these data when the New York State Education Department releases its database containing grade level
ELA and math test results for all schools and districts statewide. The NYSED announces the release of the data on its News Release webpage.

2018-19 ACCOUNTABILITY PLAN PROGRESS REPORT
same metric in 2017-2018, there were 77% of Excellence Girls students and 29% of community district students scoring proficient. Finally, in 2018-2019, there were 68% of Excellence Girls students and 39% of community district students scoring proficient.
Mathematics Performance of Charter School and Local District by Grade Level and School Year
Grade
Percent of Students Enrolled in at Least their Second Year Who Are at Proficiency Compared to Local District Students
2016-17 2017-18 2018-19
Charter School
District Charter School
District Charter School
District
3 90% 34% 91% 47% 90% 49%
4 93% 25% 84% 40% 69% 41%
5 65% 65% 68% 33% 56% 34%
6 59% 59% 68% 13% 60% 39%
7 60% 60% 70% 12% 67% 33%
8 N/A 25% N/A 15% N/A 40%
All 74% 20% 77% 29% 68.4% 39.3%
Goal 4: Comparative Measure
Each year, the school will exceed its predicted level of performance on the state mathematics exam
by an Effect Size of 0.3 or above (performing higher than expected to a meaningful degree) according to a regression analysis controlling for economically disadvantaged students among all public schools in New York State.
METHOD
The Institute conducts a Comparative Performance Analysis, which compares the school’s performance to that of demographically similar public schools statewide. The Institute uses a regression analysis to control for the percentage of economically disadvantaged students among all public schools in New York State. The Institute compares the school’s actual performance to the predicted performance of public schools with a similar concentration of economically disadvantaged students. The difference between the school’s actual and predicted performance, relative to other schools with similar economically disadvantaged statistics, produces an Effect Size. An Effect Size of 0.3, or performing higher than expected to a meaningful degree, is the requirement for achieving this measure.
Given the timing of the state’s release of economically disadvantaged data and the demands of the data analysis, the 2017-18 analysis is not yet available. This report contains 2017-18 results, the most recent Comparative Performance Analysis available.

2018-19 ACCOUNTABILITY PLAN PROGRESS REPORT
RESULTS AND EVALUATION
The table below shows that the school’s overall comparative performance is higher than expected overall. Once again, Excellence Girls met this measure with a significant positive effect size in all grades. In 2017-2018, the aggregate effect size for Excellence Girls was 1.82. Excellence Girls’ student achievement increases the longer students are enrolled at the school, the effect size jumped from last year’s overall effect size of 1.78, to this year’s current effect size of 1.82. We are continually pushing our student growth and are excited to see the magnitude of our work each year.
2017-18 Mathematics Comparative Performance by Grade Level
Grade Percent
Economically Disadvantaged
Number Tested
Percent of Students at Levels 3&4
Difference between Actual and Predicted
Effect Size
Actual Predicted
3 82.0 90 83.3 44.4 38.9 1.89
4 80.4 88 87.5 38.5 49.0 2.33
5 76.7 88 68.2 34.9 33.3 1.80
6 78.7 80 65.0 33.8 31.2 1.50
7 78.5 88 64.8 30.1 34.6 1.52
8 N/A N/A N/A N/A N/A N/A
All 79.3 434 74.0 36/4 37.5 1.82
School’s Overall Comparative Performance:
Higher than expected to large degree
ADDITIONAL EVIDENCE
As the school continues to strengthen its English language program, the effect size is anticipated to increase.
Mathematics Comparative Performance by School Year
School Year
Grades
Percent Economically Disadvantage
d
Number Tested
Actual Predicted Effect Size
2015-16 K-7, 9-12 76.8% 327 69.8 31.0 1.98
2016-17 K-12 74.3% 439 68.3 33.4 1.78
2017-18 K-12 79.3% 434 74.0 36.4 1.82

2018-19 ACCOUNTABILITY PLAN PROGRESS REPORT
Goal 4: Growth Measure16
Each year, under the state’s Growth Model, the school’s mean unadjusted growth percentile in mathematics for all tested students in grades 4-8 will be above the target of 50.
METHOD
This measure examines the change in performance of the same group of students from one year to the next and the progress they are making in comparison to other students with the same score in the previous year. The analysis only includes students who took the state exam in 2017-18 and also have a state exam score in 2016-17 including students who were retained in the same grade. Students with the same 2016-17 scores are ranked by their 2017-18 scores and assigned a percentile based on their relative growth in performance (student growth percentile). Students’ growth percentiles are aggregated school-wide to yield a school’s mean growth percentile. In order for a school to meet the measure, the school would have to achieve a mean growth percentile above the target of 50.
Given the timing of the state’s release of Growth Model data, the 2018-19 analysis is not yet available. This report contains 2017-18 results, the most recent Growth Model data available.17
RESULTS AND EVALUATION
The school’s overall Mean Growth Percentile was 51.3%, which is greater than 50. This measure was met when averaged across all grades within the school. Specifically grades 4 and 7 individually met the benchmark.
2017-18 Mathematics Mean Growth Percentile by Grade Level
Grade Mean Growth Percentile
School Target
4 56.7 50.0
5 33.9 50.0
6 45.3 50.0
7 69.1 50.0
8 0.0 50.0
All 51.3 50.0
ADDITIONAL EVIDENCE
In 2016-2017, we did not meet this measure, and we spent time examining and analyzing teacher practice and support during the 2017-2018 school year to ensure that we would meet this benchmark. This included building a more cohesive Math curriculum. We are very excited to see that those efforts paid off and will continue working towards meeting this goal across all grades.
16 See Guidelines for Creating a SUNY Accountability Plan for an explanation.
17 Schools can acquire these data from the NYSED’s business portal: portal.nysed.gov.

2018-19 ACCOUNTABILITY PLAN PROGRESS REPORT
Mathematics Mean Growth Percentile by Grade Level and School Year
Grade
Mean Growth Percentile
2015-16 2016-17 2017-18 Target
4 49.0 52.5 56.7 50.0
5 39.1 24.4 33.9 50.0
6 63.5 49.9 45.3 50.0
7 59.0 64.8 69.1 50.0
8 N/A 0 0.0 50.0
All 52.6 48.1 51.3 50.0
SUMMARY OF THE MATHEMATICS GOAL
In its fifth year of state testing, Excellence Girls did not achieve the goal of having 75% of all tested students who are enrolled in at least their second-year score proficient. However, Excellence Girls achieved the comparative and growth goals. Additionally, Excellence Girls, as a whole, outperformed its district peers by 29% percentage points. The school had an effect size of 1.82, exceeding the goal of exceeding the predicted level of performance by an effect size of 0.3. Finally, Excellence Girls exceeded the aggregate statewide growth percentile.
Type Measure Outcome
Absolute Each year, 75 percent of all tested students who are enrolled in at least their second year will perform at proficiency on the New York State mathematics exam for grades 3-8.
Did not Achieve
Absolute Each year, the school’s aggregate PI on the state’s English language arts exam will meet that year’s state MIP as set forth in the state’s ESSA accountability system.
Not Available
Comparative
Each year, the percent of all tested students who are enrolled in at least their second year and performing at proficiency on the state mathematics exam will be greater than that of students in the same tested grades in the school district of comparison.
Achieved
Comparative
Each year, the school will exceed its predicted level of performance on the state mathematics exam by an Effect Size of 0.3 or above (performing higher than expected to a meaningful degree) according to a regression analysis controlling for economically disadvantaged students among all public schools in New York State. (Using 2017-18 results.)
Achieved
Growth Each year, under the state’s Growth Model the school’s mean unadjusted growth percentile in mathematics for all tested students in grades 4-8 will be above the target of 50. (Using the 2017-18 results.)
Achieved
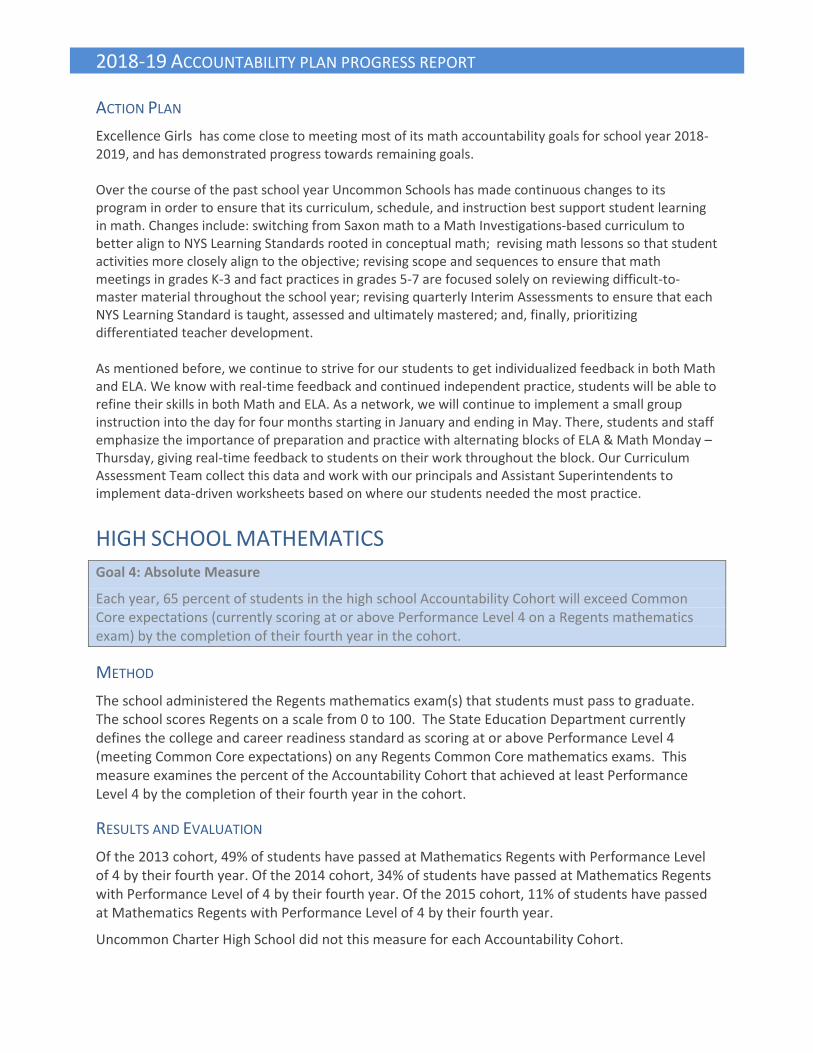
2018-19 ACCOUNTABILITY PLAN PROGRESS REPORT
ACTION PLAN
Excellence Girls has come close to meeting most of its math accountability goals for school year 2018-2019, and has demonstrated progress towards remaining goals. Over the course of the past school year Uncommon Schools has made continuous changes to its program in order to ensure that its curriculum, schedule, and instruction best support student learning in math. Changes include: switching from Saxon math to a Math Investigations-based curriculum to better align to NYS Learning Standards rooted in conceptual math; revising math lessons so that student activities more closely align to the objective; revising scope and sequences to ensure that math meetings in grades K-3 and fact practices in grades 5-7 are focused solely on reviewing difficult-to-master material throughout the school year; revising quarterly Interim Assessments to ensure that each NYS Learning Standard is taught, assessed and ultimately mastered; and, finally, prioritizing differentiated teacher development. As mentioned before, we continue to strive for our students to get individualized feedback in both Math and ELA. We know with real-time feedback and continued independent practice, students will be able to refine their skills in both Math and ELA. As a network, we will continue to implement a small group instruction into the day for four months starting in January and ending in May. There, students and staff emphasize the importance of preparation and practice with alternating blocks of ELA & Math Monday – Thursday, giving real-time feedback to students on their work throughout the block. Our Curriculum Assessment Team collect this data and work with our principals and Assistant Superintendents to implement data-driven worksheets based on where our students needed the most practice.
HIGH SCHOOL MATHEMATICS
Goal 4: Absolute Measure
Each year, 65 percent of students in the high school Accountability Cohort will exceed Common Core expectations (currently scoring at or above Performance Level 4 on a Regents mathematics exam) by the completion of their fourth year in the cohort.
METHOD
The school administered the Regents mathematics exam(s) that students must pass to graduate. The school scores Regents on a scale from 0 to 100. The State Education Department currently defines the college and career readiness standard as scoring at or above Performance Level 4 (meeting Common Core expectations) on any Regents Common Core mathematics exams. This measure examines the percent of the Accountability Cohort that achieved at least Performance Level 4 by the completion of their fourth year in the cohort.
RESULTS AND EVALUATION
Of the 2013 cohort, 49% of students have passed at Mathematics Regents with Performance Level of 4 by their fourth year. Of the 2014 cohort, 34% of students have passed at Mathematics Regents with Performance Level of 4 by their fourth year. Of the 2015 cohort, 11% of students have passed at Mathematics Regents with Performance Level of 4 by their fourth year.
Uncommon Charter High School did not this measure for each Accountability Cohort.

2018-19 ACCOUNTABILITY PLAN PROGRESS REPORT
Percent Scoring at Least Level 4 on a Regents Mathematics Common Core Exam
by Fourth Year Accountability Cohort18
Cohort Designation
Fourth
Year
Number in
Cohort
Percent Scoring at Least Level 4
2013 92 49%
2014 114 34%
2015 93 11%
ADDITIONAL EVIDENCE
Percent Achieving at Least Level 4 by Cohort and Year
Cohort Designatio
n
2016-17 2017-18 2018-19
Number in Cohort
Percent Level 4
Number in Cohort
Percent Level 4
Number in Cohort
Percent Level 4
2015 117 9% 104 10% 93 11%
2016 241 48% 271 52% 254 54%
2017 89 38% 76 37%
2018 223 37%
Goal 4: Absolute Measure
Each year, 80 percent of students in the high school Accountability Cohort will at least partially meet Common Core expectations (currently scoring at or above Performance Level 3 on a Regents mathematics exam) by the completion of their fourth year in the cohort.
METHOD
The school administered the Regents mathematics exam(s) that students must pass to graduate. The school scores Regents on a scale from 0 to 100. The State Education Department currently defines the cut off for passing and meeting the requirement for graduation as scoring at or above Performance Level 3 (partially meeting Common Core expectations) on the Regents mathematics exams. This measure examines the percent of the Accountability Cohort that achieved at least Performance Level 3 by the completion of their fourth year in the cohort.
RESULTS AND EVALUATION
Of the 2013 Cohort at Uncommon Charter High School, 99% of students have scored at or above Level 3 on a Regents Mathematics Exam. Of the 2014 Cohort, 100% of students have scored at or above Level 3 on a Regents Mathematics Exam. Of the 2015 Cohort, 99% of students have scored at or above Level 3 on a Regents Mathematics Exam.
Uncommon Charter High School has met this absolute measure.
18 Based on the highest score for each student on a mathematics Regents exam

2018-19 ACCOUNTABILITY PLAN PROGRESS REPORT
Percent Scoring at Least Level 3 on a Regents Mathematics Common Core Exam
by Fourth Year Accountability Cohort19
Cohort Designation
Number
in Cohort
Percent Scoring at Least Level 3 on a Regents Mathematics Exam
Fourth
Year
2013 2016-17 92 99%
2014 2017-18 114 100%
2015 2018-19 93 99%
ADDITIONAL EVIDENCE
Our data shows that subsequent cohorts are also on track to meet or exceed this benchmark in future years.
Percent Achieving at Least Level 3 by Cohort and Year
Cohort Designatio
n
2016-17 2017-18 2018-19
Number in Cohort
Percent Passing
Number in Cohort
Percent Passing
Number in Cohort
Percent Passing
2015 117 92% 104 99% 93 99%
2016 241 86% 271 94% 254 97%
2017 89 79% 76 86%
2018 223 84%
Goal 4: Absolute Measure
Each year, the Performance Index (“PI”) on the Regents mathematics exam of students completing their fourth year in the Accountability Cohort will meet the state’s Measure of Interim Progress (“MIP”) set forth in the state’s ESSA accountability system.
METHOD
In the state’s revised calculation of the high school Performance Index, schools now receive additional credit for students scoring at Accountability Level 4.20 To achieve this measure, all tested students in the Accountability Cohort must have a PI that equals or exceeds the state’s 2018-19 mathematics MIP for all students of 151.
The Performance Index is calculated as such: (percent of students scoring at Accountability Level 2) + 2*(percent of students scoring at Accountability Level 3) + 2.5 * (percent of students scoring at
19 Based on the highest score for each student on a mathematics Regents exam
20 For more details on the score ranges used to determine Accountability Levels as distinguished from Performance
Levels, see www.p12.nysed.gov/irs/sirs/documents/2017RegentsScoreRangesforAnnualandAccountabilityReporting.pdf

2018-19 ACCOUNTABILITY PLAN PROGRESS REPORT
Accountability Level 4). Thus, the highest possible PI is 250. The basis for the percent of students is the school’s fourth year Accountability Cohort. Regents Common Core mathematics exams are scored on a scale from 0 to 100; 0 to 64 is Accountability Level 1, 65 to 79 is Accountability Level 2 (65 to 77 for Algebra II); 80 to 84 is Accountability Level 3 (78 to 84 for Algebra II), and 85 to 100 is Accountability Level 4.
RESULTS AND EVALUATION
The Performance Index for the Mathematics Regents exam for the 2015 Graduating Cohort is 204.5 out of the highest possible 250.
Mathematics Performance Index (PI)
For the 2015 High School Accountability Cohort
Number in Cohort
Percent of Students at Each Accountability Level
Level 1 Level 2 Level 3 Level 4
93 0 1% 88% 11%
PI = 1 + 88 + 11 = 100 88 + 11 = 99 + 5.5 = 5.5 PI = 204.5
ADDITIONAL EVIDENCE
Goal 4: Comparative Measure
Each year, the percent of students in the high school Total Cohort meeting or exceeding Common Core expectations on a Regents mathematics exams will exceed the percentage of comparable students in the district meeting or exceeding Common Core expectations.
METHOD
The school compares the performance of students in their fourth year in the charter school Total Cohort to that of the respective Total Cohort of students in the school district of comparison. Due to availability of comparative data, this measure uses the school’s Total Cohort results and not the Accountability Cohort results. In order to meet or exceed Common Core expectations, a student must achieve Performance Level 4 or 5. Given that students may take Regents exam up through the summer of their fourth year, the school presents most recently available school district results.
RESULTS AND EVALUATION
At the time of this report, comparative 2015 cohort data for NYS Mathematics Regents has not yet been released. The school will update this report when the data becomes available.

2018-19 ACCOUNTABILITY PLAN PROGRESS REPORT
Percent Achieving Performance Level 4 or Higher on a Mathematics Regents
of Fourth-Year Total Cohorts by Charter School and School District
Cohort
Fourth
Year
Charter School School District
Percent Level 4 or 5 Number in
Cohort Percent Level 4 or 5
Number in Cohort
2013 2016-17 49% 92 11% 3,445
2014 2017-18 34% 114 40% 2,573
2015 2018-19
11% 93 Data Not Available
Data Not
Available
ADDITIONAL EVIDENCE
Goal 4: Comparative Measure
Each year, the percent of students in the high school Total Cohort at least partially meeting Common Core expectations on a Regents mathematics exams will exceed the percentage of comparable students in the district at least partially meeting Common Core expectations.
METHOD
The school compares the performance of students in their fourth year in the charter school Total Cohort to that of the respective Total Cohort of students in the school district of comparison. Due to availability of comparative data, this measure uses the school’s Total Cohort results and not the Accountability Cohort results. In order to at least partially meet Common Core expectations, a student would need to pass the exam and score at Performance Level 3 or higher (i.e. scoring at least 65).Given that students may take Regents exam up through the summer of their fourth year, the school presents most recently available school district results.
RESULTS AND EVALUATION
At the time of this report, comparative 2015 cohort data for NYS Mathematics Regents has not yet been released. The school will update this report when the data becomes available.
Percent Achieving Performance Level 3 or Higher on a Mathematics Regents
of Fourth-Year Total Cohorts by Charter School and School District
Cohort
Fourth Year
Charter School School District
Percent Level 3 or Higher
Number in Cohort
Percent Level 3 or Higher
Number in Cohort
2013 2016-17 99% 92 61% 3,445
2014 2017-18 100% 114 70% 2,573
2015 2018-19
99% 93 Data Not Available
Data Not
Available

2018-19 ACCOUNTABILITY PLAN PROGRESS REPORT
ADDITIONAL EVIDENCE
Goal 4: Comparative Measure
Each year, the Performance Index (“PI”) in Regents mathematics of students in the fourth year of their high school Accountability Cohort will exceed that of comparable students from the school district of comparison.
METHOD
The school compares the performance of students in their fourth year in the charter school Accountability Cohort to that of the respective cohort of students in the school district of comparison. Given that students may take Regents exam up through the summer of their fourth year, the school presents most recently available school district results.
RESULTS AND EVALUATION
At the time of this report, comparative Performance Index data for NYS Mathematics Regents has not yet been released. The school will update this report when the data becomes available.
Mathematics Regents Performance Index (PI)
of Fourth-Year Accountability Cohorts by Charter School and School District
Cohort
Fourth
Year
Charter School School District
PI Cohort
Size PI
Cohort Size
2013 2016-17
184.5 89
Data Not
Available
Data Not
Available
2014 2017-18
217 114
Data Not
Available
Data Not
Available
2015 2018-19
204.5 93
Data Not
Available
Data Not
Available
ADDITIONAL EVIDENCE
Goal 4: Growth Measure
Each year, 50 percent of students in the high school Accountability Cohort who did not score proficient on their New York State 8th grade mathematics exam will meet the college and career readiness standard (currently scoring at Performance Level 4 and fully meeting Common Core expectations on a Regents mathematics exam) by the completion of their fourth year in the cohort.
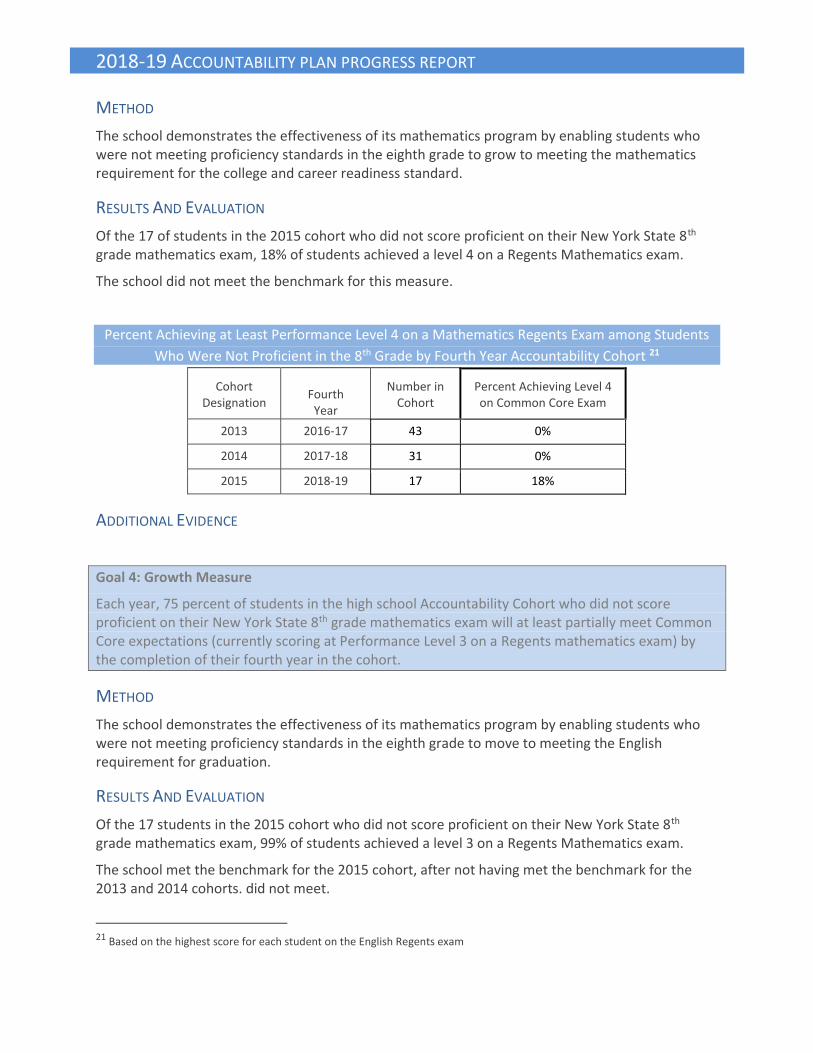
2018-19 ACCOUNTABILITY PLAN PROGRESS REPORT
METHOD
The school demonstrates the effectiveness of its mathematics program by enabling students who were not meeting proficiency standards in the eighth grade to grow to meeting the mathematics requirement for the college and career readiness standard.
RESULTS AND EVALUATION
Of the 17 of students in the 2015 cohort who did not score proficient on their New York State 8th grade mathematics exam, 18% of students achieved a level 4 on a Regents Mathematics exam.
The school did not meet the benchmark for this measure.
Percent Achieving at Least Performance Level 4 on a Mathematics Regents Exam among Students
Who Were Not Proficient in the 8th Grade by Fourth Year Accountability Cohort 21
Cohort Designation
Fourth
Year
Number in Cohort
Percent Achieving Level 4 on Common Core Exam
2013 2016-17 43 0%
2014 2017-18 31 0%
2015 2018-19 17 18%
ADDITIONAL EVIDENCE
Goal 4: Growth Measure
Each year, 75 percent of students in the high school Accountability Cohort who did not score proficient on their New York State 8th grade mathematics exam will at least partially meet Common Core expectations (currently scoring at Performance Level 3 on a Regents mathematics exam) by the completion of their fourth year in the cohort.
METHOD
The school demonstrates the effectiveness of its mathematics program by enabling students who were not meeting proficiency standards in the eighth grade to move to meeting the English requirement for graduation.
RESULTS AND EVALUATION
Of the 17 students in the 2015 cohort who did not score proficient on their New York State 8th grade mathematics exam, 99% of students achieved a level 3 on a Regents Mathematics exam.
The school met the benchmark for the 2015 cohort, after not having met the benchmark for the 2013 and 2014 cohorts. did not meet.
21 Based on the highest score for each student on the English Regents exam

2018-19 ACCOUNTABILITY PLAN PROGRESS REPORT
Percent Achieving at Least Performance Level 3 on a Mathematics Regents Exam among Students
Who Were Not Proficient in the 8th Grade by Fourth Year Accountability Cohort 22
Cohort Designation
Fourth
Year
Number in Cohort
Percent Achieving Level 3
2013 2016-17 43 30%
2014 2017-18 31 48%
2015 2018-19 17 99%
ADDITIONAL EVIDENCE
SUMMARY OF THE HIGH SCHOOL MATHEMATICS GOAL 23
The Accountability Cohort of Uncommon Charter High School met and exceeded three of the mathematics goals for school year 2018-2019. The school will update the report as the district comparison data becomes available.
Type Measure Outcome
Absolute
Each year, 65 percent of students in the high school Accountability Cohort will meet or exceed Common Core expectations (currently scoring at or above Performance Level 4 on a Regents mathematics exam) by the completion of their fourth year in the cohort.
Not Met
Absolute
Each year, 80 percent of students in the high school Accountability Cohort will at least partially meet Common Core expectations (currently scoring at or above Performance Level 3 on a Regents mathematics exam) by the completion of their fourth year in the cohort.
Met and Exceeded
Absolute Each year, the Performance Index (PI) in mathematics of students completing their fourth year in the Accountability Cohort will meet the state Measure of Interim Progress (MIP) set forth in the state’s ESSA accountability system.
Met and Exceeded
Comparative
Each year, the percentage of students in the Total Cohort meeting or exceeding Common Core expectations on a Regents mathematics exam will exceed the percentage of comparable students from the district meeting or exceeding Common Core expectations.
No Data Yet
Comparative
Each year, the percentage of students in the Total Cohort partially meeting Common Core expectations on a Regents mathematics exam will exceed the percentage of comparable students in the district at least partially meeting Common Core expectations.
No Data yet
Comparative
Each year, the Performance Index (PI) in Regents mathematics of students in the fourth year of their high school Accountability Cohort will exceed that of comparable students from the school district of comparison. (Using 2016-17 school district results.)
No Data Yet
Growth Each year, 50 percent of students in the high school Accountability Cohort who did not score proficient on their New York State 8th grade mathematics exam will meet or exceed Common Core expectations (currently scoring at or above
Not Met
22 Based on the highest score for each student on the mathematics Regents exam
23 If the school includes a middle school component, add these measures to the subject area goal for the younger grades.

2018-19 ACCOUNTABILITY PLAN PROGRESS REPORT
Performance Level 4 on a Regents mathematics exam) by the completion of their fourth year in the cohort.
Growth
Each year, 75 percent of students in the high school Accountability Cohort who did not score proficient on their New York State 8th grade mathematics exam will at least partially meet Common Core expectations (currently scoring at least Performance Level 3 on a Regents mathematics exam) by the completion of their fourth year in the cohort.
Met and Exceeded
ACTION PLAN
● Students will continue to receive 60-120 minutes of math instruction each day.
● The high school instructional leadership team will continue to review teacher lesson plans, observe classroom instruction and provide feedback on instruction.
● The school’s leadership team will be responsible for identifying areas for growth and providing an extensive professional development program that meets the needs of both the school and individual teachers.
● The school’s leadership team will continue to review the effectiveness of the school’s curriculum and make necessary revisions to increase student achievement.
● School leaders will continue to work with master teachers at the school to research and develop curriculum modifications that will ensure increased levels of student achievement and will continuously monitor the effectiveness of those modifications.
● Uncommon Charter High School will continue to offer Regents/AP/SAT preparation beginning in the 9th grade.
● Uncommon Charter High School will continue to provide professional development before the school year, during the school year, and following the school year, during which teachers can review and discuss results.
GOAL 5: SCIENCE
Goal 5: Science
STUDENTS WILL DEMONSTRATE PROFICIENCY IN THE UNDERSTANDING AND APPLICATION OF SCIENTIFIC PRINCIPLES.
BACKGROUND
Excellence Girls Science curriculum is aligned to the NY State standards and includes the use of both authentic text such as articles, or passages from non-fiction texts, and the use of textbooks in class to ensure that students are reading to learn new material presented.
The science curriculum is created within the Uncommon Schools Network. Lesson plans associated multi-media resource materials and assessments are aligned to NYS standards. The curricula are designed with minute-by-minute plans for teachers to execute in their classrooms. The plans include a variety of activities: hands-on experiments, reading and responding to complex non-fiction texts, classroom discussion and debate of key issues, vocabulary instruction, and student presentations.
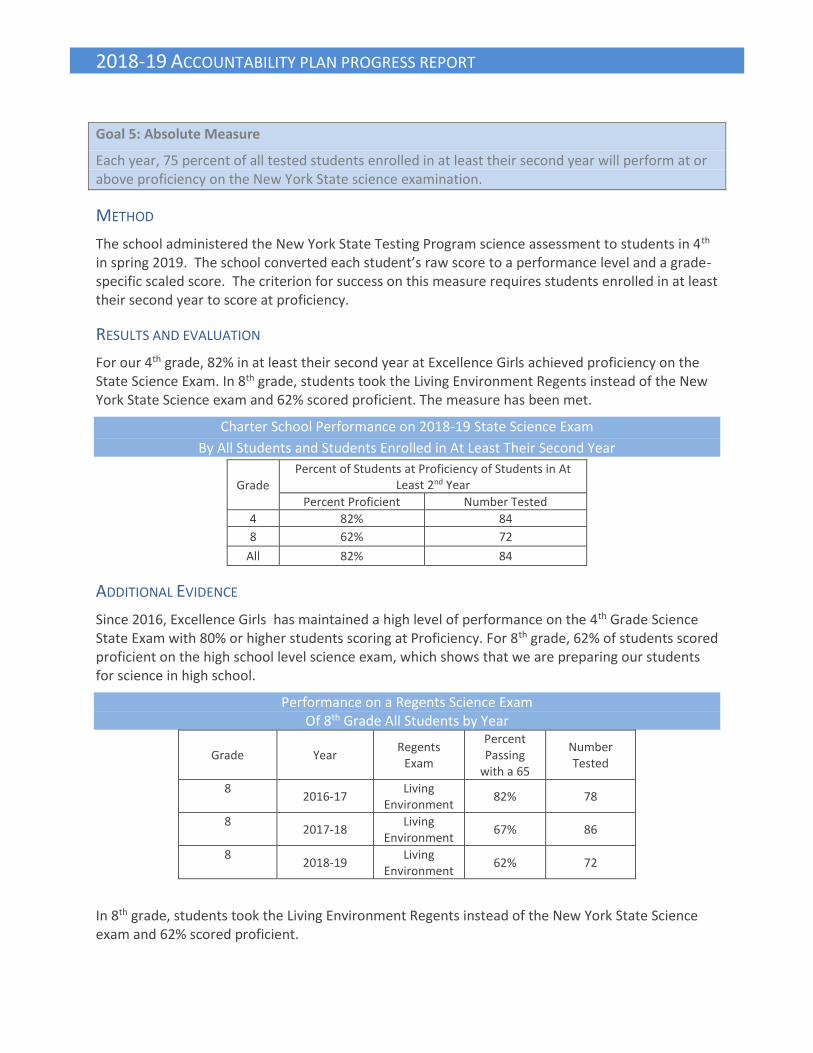
2018-19 ACCOUNTABILITY PLAN PROGRESS REPORT
Goal 5: Absolute Measure
Each year, 75 percent of all tested students enrolled in at least their second year will perform at or above proficiency on the New York State science examination.
METHOD
The school administered the New York State Testing Program science assessment to students in 4th in spring 2019. The school converted each student’s raw score to a performance level and a grade-specific scaled score. The criterion for success on this measure requires students enrolled in at least their second year to score at proficiency.
RESULTS AND EVALUATION
For our 4th grade, 82% in at least their second year at Excellence Girls achieved proficiency on the State Science Exam. In 8th grade, students took the Living Environment Regents instead of the New York State Science exam and 62% scored proficient. The measure has been met.
Charter School Performance on 2018-19 State Science Exam
By All Students and Students Enrolled in At Least Their Second Year
Grade Percent of Students at Proficiency of Students in At
Least 2nd Year
Percent Proficient Number Tested
4 82% 84
8 62% 72
All 82% 84
ADDITIONAL EVIDENCE
Since 2016, Excellence Girls has maintained a high level of performance on the 4th Grade Science State Exam with 80% or higher students scoring at Proficiency. For 8th grade, 62% of students scored proficient on the high school level science exam, which shows that we are preparing our students for science in high school.
Performance on a Regents Science Exam Of 8th Grade All Students by Year
Grade Year
Regents Exam
Percent Passing
with a 65
Number Tested
8 2016-17
Living Environment
82% 78
8 2017-18
Living Environment
67% 86
8 2018-19
Living Environment
62% 72
In 8th grade, students took the Living Environment Regents instead of the New York State Science exam and 62% scored proficient.

2018-19 ACCOUNTABILITY PLAN PROGRESS REPORT
Science Performance by Grade Level and School Year
Grade
Percent of Students Enrolled in At Least Their Second Year at Proficiency
2016-17 2017-18 2018-19
Percent Proficien
t
Number
Tested
Percent
Number
Tested
Percent Proficien
t
Number
Tested
4 97% 74 96% 76 82% 84
8 82% 78 67% 86 62% 72
All 90%% 74 82% 76
72% 84
Goal 5: Comparative Measure
Each year, the percent of all tested students enrolled in at least their second year and performing at proficiency on the state science exam will be greater than that of all students in the same tested grades in the school district of comparison.
METHOD
The school compares tested students enrolled in at least their second year to all tested students in the public school district of comparison. Comparisons are between the results for each grade in which the school had tested students in at least their second year and the results for the respective grades in the school district of comparison. Given the timing of the state’s release of district science data, the 2018-19 comparative data may not yet be available. If not, schools should report comparison to the district’s 2017-18 data.
RESULTS AND EVALUATION
The district comparative data was not available for the 2018-2019 State Science Exam or Living Environment Regents Exam while completing this report so we are using 2017-18 data for comparison purposes. Excellence Girls had 82% of students score as proficient or advanced compared to 72% of Community School District 16-17.
2018-19 State Science Exam
Charter School and District Performance by Grade Level
Grade
Percent of Students at Proficiency
Charter School Students In At Least 2nd Year
All District Students24
Percent Proficient
Number Tested
Percent Proficient
Number Tested
24 This table uses the prior year’s results as 2018-19 district science scores are not yet available.

2018-19 ACCOUNTABILITY PLAN PROGRESS REPORT
4 82% 84 N/A N/A
8 62% 72 N/A N/A
All 82% 84 N/A N/A
Science Performance of Charter School and Local District by Grade Level and School Year
Grade
Percent of Charter School Students at Proficiency and Enrolled in At Least their Second Year Compared to Local District Students
2016-17 2017-18 2018-19
Charter School
District Charter School
District Charter School
District
4 97% N/A 96% 87% 82% N/A
8 85% N/A 65% 54% 62% N/A
SUMMARY OF THE SCIENCE GOAL
The absolute measure was not achieved, and the comparative data was achieved when comparing the 2018-2019 Excellence Girls data to the 2017-2018 District data.
Type Measure Outcome
Absolute Each year, 75 percent of all tested students enrolled in at least their second year will perform at or above proficiency on the New York State examination.
Not achieved
Comparative
Each year, the percent of all tested students enrolled in at least their second year and performing at proficiency on the state exam will be greater than that of all students in the same tested grades in the school district of comparison.
Achieved
ACTION PLAN
In the 2019-2020 school year, Excellence Girls will continue to employ our internally created science programs and extensive hands-on experiments to move students towards competency in the understanding and application of Science.
Excellence Girls remains strongly committed to ensuring that our scholars develop the core knowledge that will allow them to become critical thinkers in all areas and will support their development in reading comprehension. We are equally committed to meeting our Accountability Plan goals in Science.

2018-19 ACCOUNTABILITY PLAN PROGRESS REPORT
HIGH SCHOOL SCIENCE
Goal 5: Absolute Measure
Each year, 75 percent of students in the high school Accountability Cohort will score at least 65 on a New York State Regents science exam by the completion of their fourth year in the cohort.
METHOD
New York State schools administer multiple high school science assessments; current Regent exams are Living Environment, Earth Science, Chemistry and Physics. The school administered Living Environment, Earth Science. It scores Regents on a scale from 0 to 100; students must score at least 65 to pass. This measure requires students in each Accountability Cohort to pass any one of the Regents science exams by their fourth year in the cohort. Students may have taken a particular Regents science exam multiple times or have taken multiple science exams. Students have until the summer of their fourth year to pass a science exam.
RESULTS AND EVALUATION
Uncommon Charter High School had 98% of students in the 2013 cohort pass the Living Environment Regents with a score of 65 or higher. 100% of students in the 2014 and 89% of students in the 2015 cohorts passed the Living Environment Regents with a score of 65 or higher.
This measure was met and exceeded, for the 2018-2019 school year.
Science Regents Passing Rate with a Score of 65
by Fourth Year Accountability Cohort25
Cohort Designation
Fourth
Year
Number in Cohort
Percent Passing with a score of 65
2013 2016-17 92 98%
2014 2017-18 114 100%
2015 2018-19 93 89%
ADDITIONAL EVIDENCE
25 Based on the highest score for each student on any science Regents exam

2018-19 ACCOUNTABILITY PLAN PROGRESS REPORT
Science Regents Passing Rate with a score of 65 by Cohort and Year
Cohort Designatio
n
2016-17 2017-18 2018-19
Number in Cohort
Percent Passing
Number in Cohort
Percent Passing
Number in Cohort
Percent Passing
2015 117 82% 104 91% 93 89%
2016 241 83% 271 87% 254 90%
2017 89 80% 76 84%
2018 223 75%
Goal 5: Comparative Measure
Each year, the percent of students in the high school Total Cohort passing a Regents science exam with a score of 65 or above will exceed that of the high school Total Cohort from the school district of comparison.
METHOD
The school compares the performance of students in their fourth year in the charter school high school Total Cohort to that of the respective cohort of students in the school district of comparison. Due to the availability of comparative data, this measure uses the school’s Total Cohort results and not the Accountability Cohort results. Given that students may take Regents exam up through the summer of their fourth year, the school presents most recently available district results.
RESULTS AND EVALUATION
At the time of submission, comparative data for the 2015 cohort has not been released. For the 2013 and 2014 cohorts, Uncommon Charter High School has met the measure of having a higher percentage of students pass the science exam with a 65 of above compared to the community school district our school is located in. Data for the 2015 cohort is not currently available.
Science Regents Passing Rate of the High School Total Cohort by Charter School and School District
Cohort
Fourth Year
Charter School School District
Percent Passing
Cohort Size
Percent Passing
Cohort Size
2013 2016-17 98% 92 48% 195
2014 2017-18 100% 114 74% 1901
2015 2018-19
89% 93
Data Not
Available
Data Not
Available

2018-19 ACCOUNTABILITY PLAN PROGRESS REPORT
GOAL 6: SOCIAL STUDIES
Goal 6: Social Studies
Students will demonstrate proficiency in the understanding and application of principles related to the social sciences.
Goal 6: Absolute Measure
Each year, 75 percent of students in the high school Accountability Cohort will score at least 65 on the New York State Regents U.S. History exam by the completion of their fourth year in the cohort.
METHOD
New York State administers two high school social studies assessments: U.S. History and Global History. In order to graduate, students must pass both of these Regents exams with a score of 65 or higher. This measure requires students in each Accountability Cohort to pass the two exams by the completion of their fourth year in the cohort. Students may have taken the exams multiple times and have until the summer of their fourth year to pass it. Once students pass it, performance on subsequent administrations of the same exam do not affect their status as passing.
RESULTS
The 2015 cohort had 92% of students pass the US History Regents compared to 96% in 2014 and 93% in 2013.
U.S. History Regents Passing Rate with a Score of 65
by Fourth Year Accountability Cohort26
Cohort Designation
Fourth
Year
Number in Cohort
Percent Passing with a score of 65
2013 2016-17 92 93%
2014 2017-18 114 96%
2015 2018-19 93 92%
EVALUATION
Uncommon Charter High School met and surpassed this measure with a 92% pass rate on the US History Regents in the 2015 cohort.
ADDITIONAL EVIDENCE
26 Based on the highest score for each student on a science Regents exam

2018-19 ACCOUNTABILITY PLAN PROGRESS REPORT
U.S. History Regents Passing Rate with a score of 65 by Cohort and Year
Cohort Designatio
n
2016-17 2017-18 2018-19
Number in Cohort
Percent Passing
Number in Cohort
Percent Passing
Number in Cohort
Percent Passing
2015 271 0% 104 95% 93 92%
2016 89 1% 271 0% 254 29%
2017 89 1% 76 0%
2018 223 0%
Goal 6: Comparative Measure
Each year, the percent to students in the high school Total Cohort passing the Regents U.S. History exam with a score of 65 or above will exceed that of the high school Total Cohort from the school district of comparison.
METHOD
The school compares the performance of students in their fourth year in the charter school high school Total Cohort to that of the respective cohort of students in the school district of comparison. Due to the availability of comparative data, this measure uses the school’s Total Cohort results and not the Accountability Cohort results. Given that students may take Regents exam up through the summer of their fourth year, school presents the most recently available district results.
RESULTS
At submission, comparative graduation data for U.S. History Regents had not yet been released for the 2015 cohort. The Uncommon Charter High School will update this report when the data becomes available. The Uncommon Charter High School 2015 cohort had a pass rate of 92% on the U.S. History Regents. Uncommon Charter High School met this measure with a 93% passing rate for the 2013 cohort, compared to the district average of 56%. Uncommon Charter High School has also met this measure in 2014. Data is not currently available for the 2015 cohorts.
U.S. History Passing Rate
of the High School Total Cohort by Charter School and School District
Cohort
Fourth
Year
Charter School School District
Percent Passing
Cohort Size
Percent Passing
Cohort Size
2013 2016-17 93% 92 56% 763
2014 2017-18 96% 114 67% 1901
2015 2018-19
92% 93
Data Not
Available
Data Not
Available

2018-19 ACCOUNTABILITY PLAN PROGRESS REPORT
EVALUATION
Data is not currently available for the 2015 cohort.
ADDITIONAL EVIDENCE
Goal 6: Absolute Measure
Each year, 75 percent of students in the high school Accountability Cohort will score at least 65 on the New York State Regents Global History exam by the completion of their fourth year in the cohort.
METHOD
This measure requires students in each Accountability Cohort to pass the Global History exam by the completion of their fourth year in the cohort. Students may have taken the exam multiple times, and had until the summer of their fourth year to pass it. Once students pass it, performance on subsequent administrations of the same exam do not affect their status as passing.
RESULTS
The 2015 cohort had a 90% pass rate on the Global History Regents. The 2014 cohort had a 98% pass rate and the 2013 cohort had a 93% pass rate on the Global History Regents.
Global History Regents Passing Rate with a Score of 65
by Fourth Year Accountability Cohort27
Cohort Designation
Fourth
Year
Number in Cohort
Percent Passing with a score of 65
2013 2016-17 92 93%
2014 2017-18 114 98%
2015 2018-19 93 90%
EVALUATION
Based on the data shared in the table above the measure was met, with 90% of students achieving proficiency or passing the Global History exam by the completion of their fourth year in the 2015 cohort.
ADDITIONAL EVIDENCE
27 Based on the highest score for each student on a science Regents exam

2018-19 ACCOUNTABILITY PLAN PROGRESS REPORT
Global History Regents Passing Rate with a score of 65 by Cohort and Year
Cohort Designatio
n
2016-17 2017-18 2018-19
Number in Cohort
Percent Passing
Number in Cohort
Percent Passing
Number in Cohort
Percent Passing
2015 117 68% 104 88% 93 90%
2016 241 0% 271 29% 254 70%
2017 89 0% 76 74%
2018 223 0%
Goal 6: Comparative Measure
Each year, the percent of students in the high school Total Cohort passing the Regents Global History exam with a score of 65 or above will exceed that of the high school Total Cohort from the school district of comparison.
METHOD
The school compares the performance of students in their fourth year in the charter school high school Total Cohort to that of the respective cohort of students in the school district of comparison. Due to the availability of comparative data, this measure uses the school’s Total Cohort results and not the Accountability Cohort results. Given that students may take Regents exam up through the summer of their fourth year, the school presents most recently available district results.
RESULTS
At submission, comparative graduation data for Global History Regents had not yet been released for the 2015 cohort. The Uncommon Charter High School will update this report when the data becomes available. In comparison to the district, the 2013 and 2014 cohort met this measure.
Global History Passing Rate
of the High School Total Cohort by Charter School and School District
Cohort
Fourth
Year
Charter School School District
Percent Passing
Number in Cohort
Percent Passing
Number in Cohort
2013 2016-17 93% 92 45% 751
2014 2017-18 98% 114 67% 1901
2015 2018-19
90% 93
Data Not
Available
Data Not
Available
EVALUATION
At submission, comparative graduation data for Global History Regents had not yet been released for the 2015 cohort.
ADDITIONAL EVIDENCE

2018-19 ACCOUNTABILITY PLAN PROGRESS REPORT
GOAL 7: ESSA
The school will remain in good standing under the state’s ESSA accountability system.
Goal 4: Absolute Measure
Under the state’s ESSA accountability system, the school is in good standing: the state has not identified the school for comprehensive or targeted improvement.
METHOD
Because all students are expected to meet the state's performance standards, the federal statute stipulates that various sub-populations and demographic categories of students among all tested students must meet the state standard in and of themselves aside from the overall school results. As New York State, like all states, is required to establish a specific system for making these determinations for its public schools, charter schools do not have latitude in establishing their own performance levels or criteria of success for meeting the ESSA accountability requirements. Each year, the state issues School Report Cards that indicate a school’s status under the state accountability system.
RESULTS AND EVALUATION
Uncommon Charter High School and Excellence Girls received a “Good Standing” status under ESSA. The school has diligently worked to meet each ESSA requirement and comply with all stated guidelines for testing and we will maintain this going forward.
Accountability Status by Year
Year Status
2016-17 Good Standing
2017-18 Good Standing
2018-19 Good Standing