2019 aon human capital intelligence solutions - aon hewitt · how to win the talent competition in...
TRANSCRIPT

2019 Aon Human CapitalIntelligence Solutions
Empowering Economic & Human Possibility

Value of Insight = Data Analytics (Business Expertise)2
How to win the talent competition in the digital era has become one of the focuses among business leaders. Aon Learning Center will launch training session on human capital digital transformation in August. For more information, please check the 2019 Aon Learning Cen-ter Training Schedule on P22.
, , 。 8, 。 22 《2019 》。
The daily business operation usually produces a lot of human capital data. However, it’s very diffi cult for many companies to use the data to improve effi ciency due to the shortage of data analysis ability and insightful opin-ions. Meanwhile, some leading-edge companies are increasingly adopting sophisticated methods of analyzing employee data to enhance their competitive advantage in the digital era of human capital.
, 。 ,, 。 ,
。
A common misunderstanding is that digitalized human capital is based on a professional data science team. How-ever, Aon’s study indicates that eff ectiveness at business expertise improves analytic impact more than eff ective-ness at data science. People analytics eff orts is to inspire, infl uence and shape business decision.
。 , 。。
Benchmark
Insights Prediction
CEO Objectives:
CEO :
Business Outcomes
Succession Planning
Leadership Development
Administrative Data
Employee Demographics
CompensationBehavior Data
Professional and Social Networks
Real-time Behavior Data
(e.g., email )
( )
Talent Manage-ment Data
Engagement(individual)
PerformancePotential
Assessment Promotion and Rotation
CHRO Objectives:
CHRO :
Agile Workforce Planning
Employee Experience
Quantifi cation of the impact peo-ple have on business outcomes
CFO Objectives:
CFO :
ROI of people spend
Cost of distributed workforce
Cost of people related risks
People Analytics

Cash and Practice Report Package
Step 1 : Choose ONE Report from CASH Categories Listed Below:
Industry Cash Report 1st Tier Cities Report 2nd Tier Cities Report Area ReportExecutive CompensationReport
Step 2 : Choose Report(s) from PRACTICE Categories Listed Below:
Rewards Strategy and HR Practices Report - 1st Tier / 2nd Tier Cities (General Version) - ( )
Retention and Benefits Practices Report - 1st Tier / 2nd Tier Cities (General Version) - ( )
Domestic Relocation Policies Report
China City Index Report
Long-term Incentive Case Report - Chinese Companies
Step 3 : According to the number of report(s) from PRACTICE Categories, you may enjoy below discount : ,
Report Package
Notes :
1. All packages are available for participants only, and the promotion price is only valid from 2019/01/01 to 2019/07/31., 2019/01/01 2019/07/31。
2. The packages may not be used in conjuction with any other discounts.。
3. McLagan cash reports are not applicable to this package.。
One Report +5,000
Two Reports +9,000
Three Reports and above +4,000 / Report
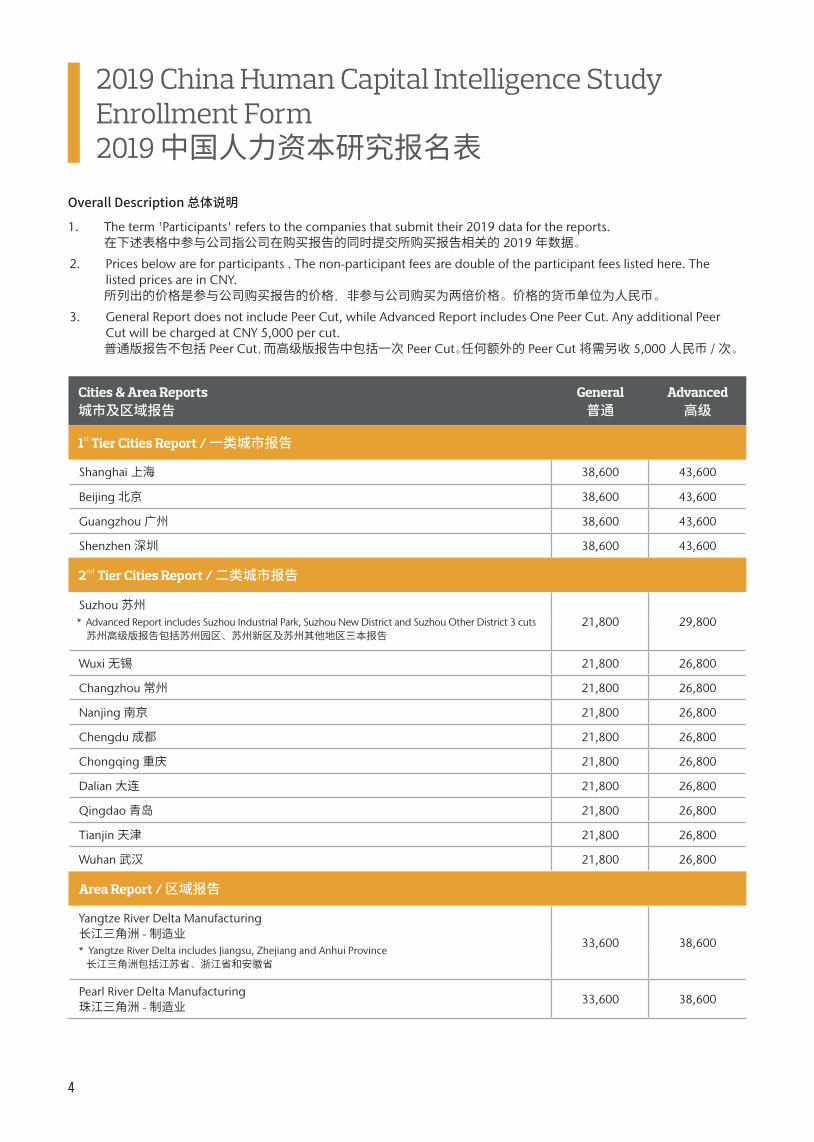
2019 China Human Capital Intelligence Study Enrollment Form2019
1. The term 'Participants' refers to the companies that submit their 2019 data for the reports. 2019 。
2. Prices below are for participants . The non-participant fees are double of the participant fees listed here. The listed prices are in CNY.
, 。 。
3. General Report does not include Peer Cut, while Advanced Report includes One Peer Cut. Any additional Peer Cut will be charged at CNY 5,000 per cut.
Peer Cut, Peer Cut。 Peer Cut 5,000 / 。
Cities & Area Reports General Advanced
1st Tier Cities Report /
Shanghai 38,600 43,600
Beijing 38,600 43,600
Guangzhou 38,600 43,600
Shenzhen 38,600 43,600
2nd Tier Cities Report /
Suzhou 21,800 29,800 * Advanced Report includes Suzhou Industrial Park, Suzhou New District and Suzhou Other District 3 cuts
、
Wuxi 21,800 26,800
Changzhou 21,800 26,800
Nanjing 21,800 26,800
Chengdu 21,800 26,800
Chongqing 21,800 26,800
Dalian 21,800 26,800
Qingdao 21,800 26,800
Tianjin 21,800 26,800
Wuhan 21,800 26,800
Area Report /
Yangtze River Delta Manufacturing -
33,600 38,600 * Yangtze River Delta includes Jiangsu, Zhejiang and Anhui Province
、
Pearl River Delta Manufacturing -
33,600 38,600
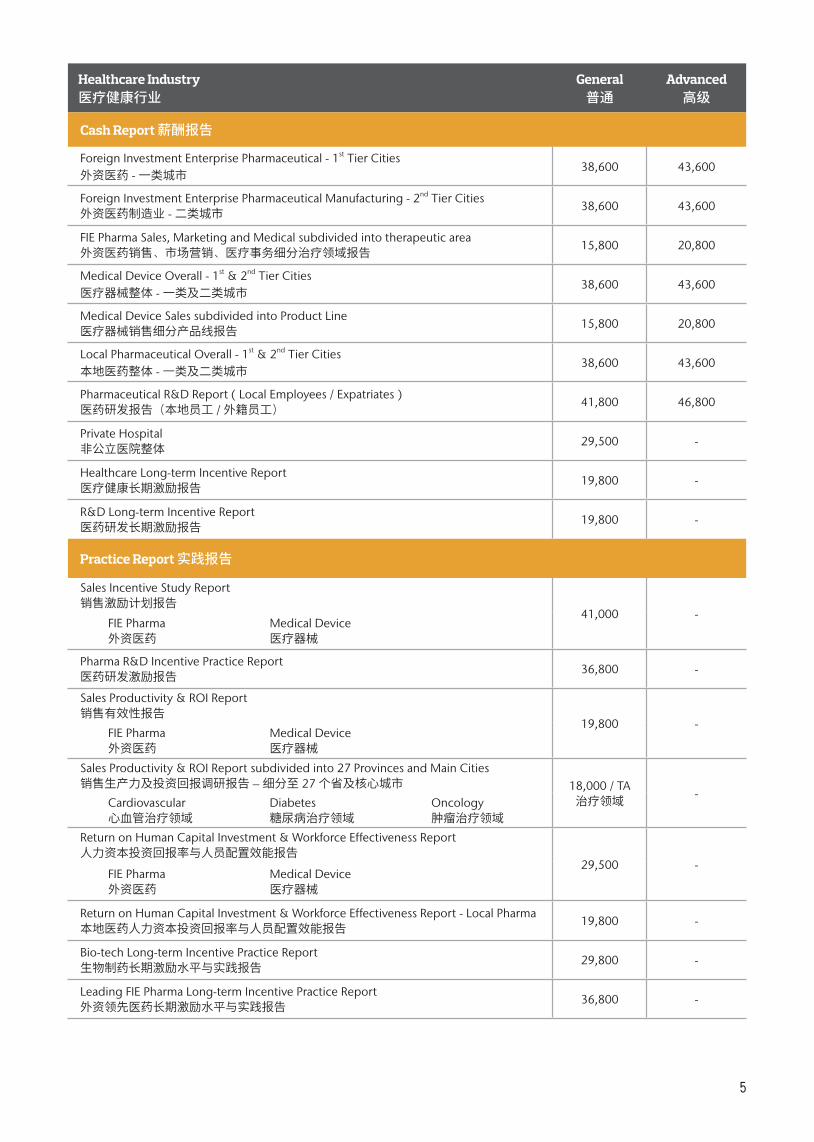
Healthcare Industry General Advanced
Cash Report
Foreign Investment Enterprise Pharmaceutical - 1st Tier Cities -
38,600 43,600
Foreign Investment Enterprise Pharmaceutical Manufacturing - 2nd Tier Cities -
38,600 43,600
FIE Pharma Sales, Marketing and Medical subdivided into therapeutic area、 、 15,800 20,800
Medical Device Overall - 1st & 2nd Tier Cities -
38,600 43,600
Medical Device Sales subdivided into Product Line15,800 20,800
Local Pharmaceutical Overall - 1st & 2nd Tier Cities -
38,600 43,600
Pharmaceutical R&D Report ( Local Employees / Expatriates )( / ) 41,800 46,800
Private Hospital29,500 -
Healthcare Long-term Incentive Report19,800 -
R&D Long-term Incentive Report19,800 -
Practice Report
Sales Incentive Study Report
41,000 -FIE Pharma Medical Device
Pharma R&D Incentive Practice Report 36,800 -
Sales Productivity & ROI Report
19,800 -FIE Pharma Medical Device
Sales Productivity & ROI Report subdivided into 27 Provinces and Main Cities – 27 18,000 / TA
-Cardiovascular
Diabetes
Oncology
Return on Human Capital Investment & Workforce Effectiveness Report
29,500 -FIE Pharma Medical Device
Return on Human Capital Investment & Workforce Effectiveness Report - Local Pharma19,800 -
Bio-tech Long-term Incentive Practice Report29,800 -
Leading FIE Pharma Long-term Incentive Practice Report36,800 -
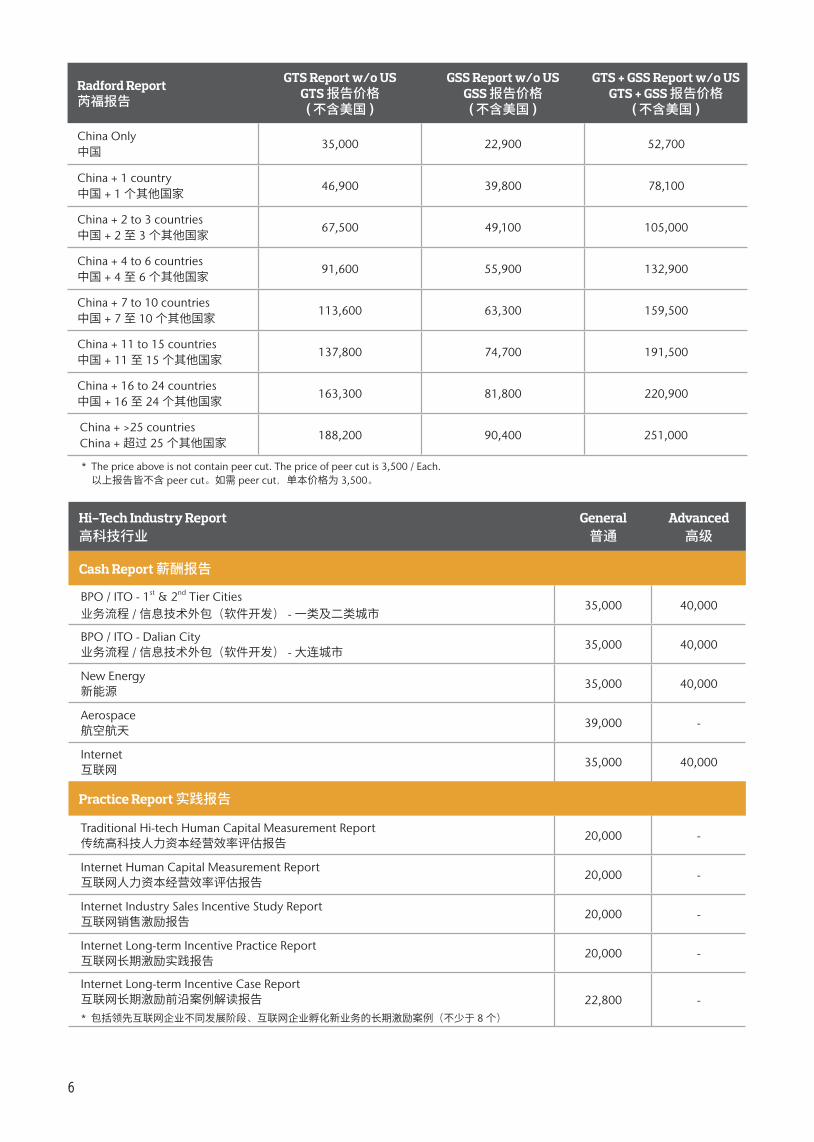
Radford Report GTS Report w/o USGTS
( )
GSS Report w/o USGSS
( )
GTS + GSS Report w/o USGTS + GSS
( )
China Only35,000 22,900 52,700
China + 1 country + 1
46,900 39,800 78,100
China + 2 to 3 countries + 2 3
67,500 49,100 105,000
China + 4 to 6 countries + 4 6
91,600 55,900 132,900
China + 7 to 10 countries + 7 10
113,600 63,300 159,500
China + 11 to 15 countries + 11 15
137,800 74,700 191,500
China + 16 to 24 countries + 16 24
163,300 81,800 220,900
China + >25 countriesChina + 25
188,200 90,400 251,000
Hi-Tech Industry Report General Advanced
Cash Report
BPO / ITO - 1st & 2nd Tier Cities/ ( ) -
35,000 40,000
BPO / ITO - Dalian City/ ( ) -
35,000 40,000
New Energy35,000 40,000
Aerospace39,000 -
Internet35,000 40,000
Practice Report
Traditional Hi-tech Human Capital Measurement Report20,000 -
Internet Human Capital Measurement Report20,000 -
Internet Industry Sales Incentive Study Report20,000 -
Internet Long-term Incentive Practice Report20,000 -
Internet Long-term Incentive Case Report
* 、 ( 8 )
22,800 -
* The price above is not contain peer cut. The price of peer cut is 3,500 / Each.peer cut。 peer cut, 3,500。

Chemical Industry General Advanced
Chemical Overall & Manufacturing & Non-Manufacturing - 1st Tier Cities, -
33,800 38,800
Chemical Overall - 2nd Tier Cities -
33,800 38,800
Sourcing Industry General Advanced
Sourcing Overall - 1st Tier Cities -
35,500 40,500
Auto Industry General Advanced
Auto Non-Manufacturing Report - 1st Tier Cities -
37,500 42,500
Auto Vehicle Manufacturing Report - 1st & 2nd Tier Cities -
37,500 42,500
Auto Parts Manufacturing Report - 1st & 2nd Tier Cities -
37,500 42,500
Auto Vehicle and Parts Manufacturing Report - Chengyu -
27,500 32,500
Auto Vehicle and Parts Manufacturing Report - Wuhan / Changsha - /
27,500 32,500
Auto Vehicle and Parts Manufacturing Report - Changchun / Shenyang - /
27,500 32,500
Auto Vehicle and Parts R&D Report - 1st Tier Cities - ( )
37,500 42,500
Auto Vehicle and Parts R&D Report - 2nd Tier Cities - ( )
35,500 40,500
Auto Vehicle Human Capital Measurement Report33,000 38,000
Auto Parts Human Capital Measurement Report31,800 36,800
Machinery and Industrial Manufacturing Industry General Advanced
Machinery and Industrial Manufacturing - 1st Tier Cities -
33,800 38,800
Machinery and Industrial Manufacturing - 2nd Tier Cities -
33,800 38,800
Machinery and Industrial Manufacturing Human Capital Measurement Report30,000 50,000

Hospitality Industry General Advanced
Hotel Group Corporate Office20,000 25,000
Hotel Property - 1st Tier Cities -
15,000 20,000Beijing Guangzhou / Shenzhen /
Shanghai
Hotel Property - 2nd Tier Cities -
15,000 20,000
Chengdu Tianjin
Chongqing Xi'an
Hainan Yunan
Fuzhou / Xiamen/
Guangdong ( without Guangzhou , Shenzhen )
( 、 )
Heilongjiang / Jilin / Liaoning/ /
Jinan / Qingdao/
Zhejiang / Jiangsu/
Hotel Human Capital Measurement Report30,000 50,000
Consumer Goods / Retail Industry/
General Advanced
Consumer Goods Overall - 1st Tier Cities -
37,500 42,500 * Reports marked with a superscript (1) is CNY 5,000 for the purchaser of Consumer Goods Overall- 1st Tier Cities Report
- 5,000 1
Food & Beverage - 1st Tier Cities1
- 37,500 42,500
Cosmetics - 1st Tier Cities1
- 37,500 42,500
Retail Headquarter and Store - 1st Tier Cities -
28,800 33,800 * Reports marked with a superscript (2) is CNY 5,000 for the purchaser of Retail Headquarter and Store - 1st Tier Cities Report
- 5,000 2
Restaurant - 1st Tier Cities2
- 28,800 33,800
Garment - 1st Tier Cities2
- 28,800 33,800
Consumer Goods e-commerce Cash Report18,800 23,800
Consumer Goods e-commerce Talent Management Practice Report20,800 -
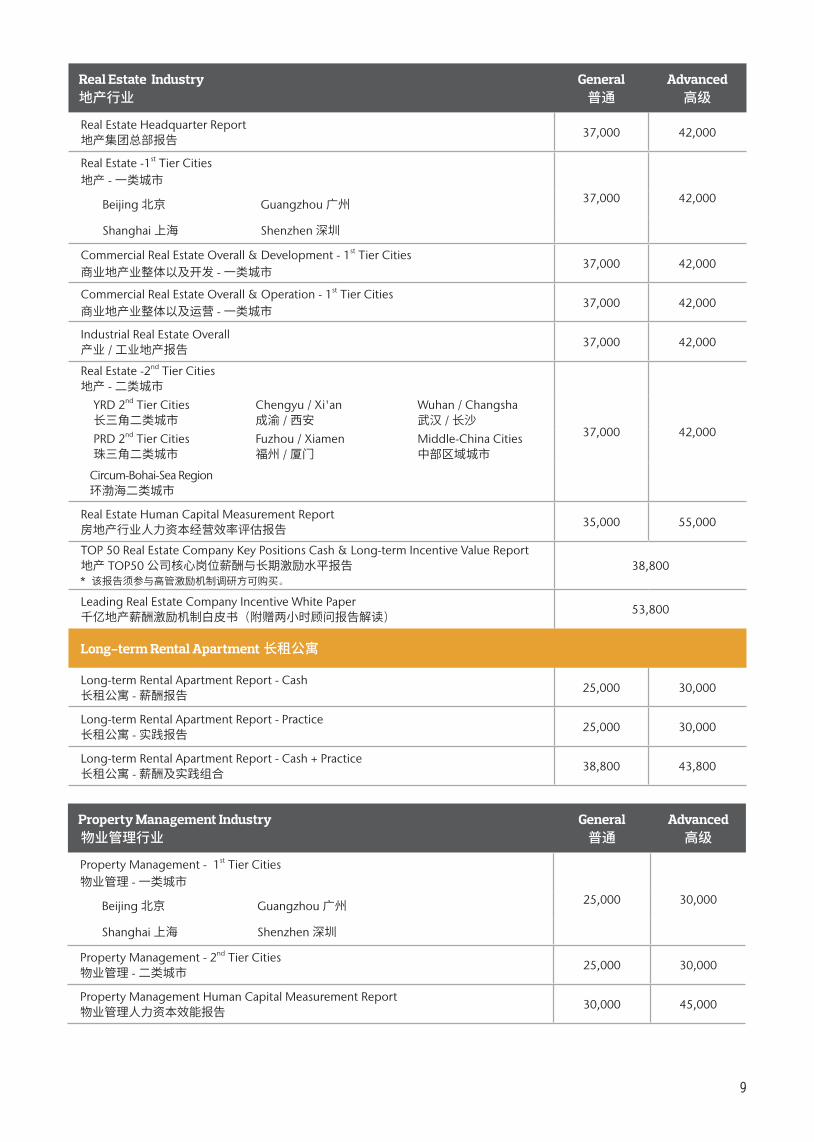
Real Estate Industry General Advanced
Real Estate Headquarter Report37,000 42,000
Real Estate -1st Tier Cities -
37,000 42,000 Beijing Guangzhou
Shanghai Shenzhen
Commercial Real Estate Overall & Development - 1st Tier Cities-
37,000 42,000
Commercial Real Estate Overall & Operation - 1st Tier Cities-
37,000 42,000
Industrial Real Estate Overall/
37,000 42,000
Real Estate -2nd Tier Cities -
37,000 42,000
YRD 2nd Tier Cities Chengyu / Xi'an /
Wuhan / Changsha/
PRD 2nd Tier Cities Fuzhou / Xiamen/
Middle-China Cities
Circum-Bohai-Sea Region
Real Estate Human Capital Measurement Report 35,000 55,000
TOP 50 Real Estate Company Key Positions Cash & Long-term Incentive Value ReportTOP50
* 。38,800
Leading Real Estate Company Incentive White Paper( ) 53,800
Long-term Rental Apartment
Long-term Rental Apartment Report - Cash -
25,000 30,000
Long-term Rental Apartment Report - Practice -
25,000 30,000
Long-term Rental Apartment Report - Cash + Practice -
38,800 43,800
Property Management Industry
General Advanced
Property Management - 1st Tier Cities -
25,000 30,000 Beijing Guangzhou
Shanghai Shenzhen
Property Management - 2nd Tier Cities -
25,000 30,000
Property Management Human Capital Measurement Report30,000 45,000

Direct Labor Report General Advanced
Shanghai 16,000 20,000
Suzhou 16,000 20,000
Wuxi 16,000 20,000
Changzhou 16,000 20,000
Nanjing 16,000 20,000
Chengyu 16,000 20,000
Qingdao 16,000 20,000
Tianjin 16,000 20,000
Wuhan 16,000 20,000
Yangtze River Delta Direct Labor Report ( 5 cuts including Shanghai, Suzhou, Wuxi, Changzhou and Nanjing )
( , 、 、 、 )28,800 33,800
Pearl River Delta Direct Labor Report ( 4 cuts including Guangzhou, Shenzhen, Dong-guan and Pearl River Delta 2nd Tier Cities )
( , 、 、 )28,800 33,800
* 50% off for any Industry or 1st Tier Cities or 2nd Tier Cities report purchaser., 50% 。
Engineering Industry General Advanced
Engineering & Design Consulting Non-Manufacturing - 1st Tier Cities& - 33,800 38,800
Logistics Industry General Advanced
Logistics and Transportation Overall - 1st Tier Cities -
35,500 40,500 * Advanced version includes one of shipping or logistics services reports and 1 free peer cut
- peer cut
Logistics and Transportation Logistics Services - 1st Tier Cities -
35,500 40,500
Logistics and Transportation Shipping - 1st Tier Cities -
35,500 40,500
Logistics and Transportation Overall - 2nd Tier Cities -
21,500 26,500

Expatriates Reports Participants
China Local Hired Foreigner (LHF) Premium Package
38,800* Including China LHF Compensation & Benefits Report and Global Mobility Report ( for China Outbound Employees )
, ( )
China Local Hired Foreigner ( LHF ) Lite Package
29,800* Including China LHF Compensation & Benefits Report
Global Mobility Report12,000
Customized Report Participants Non-Participants
PayInsight Analytics Tool 12,800 -
Customized HCI Report50,000 80,000
Competitive Analysis Full Report
100,000 -* Including half an hour onsite reporting and one Indusrty Advanced Report
Position Title Listing Lite Report5,000
/ Job Fuction -* Only 10 -15 companies could be selected
10 -15
Job Pricing Middle Managers and below jobs Expatriate, Senior Managersand above jobs
、
Cash + Benefits Prevalence +
6,600 7,800
Cash + Benefits Practices + LTI + +
- 11,500

2019 McLagan Mainland China Study2019
General Financial Industry Reports General Advanced
General Financial Industry Top Management
* The Maximum bundle fee for top management survey is 30,000 CNY30,000
6,000 / Position
General Financial Industry Back Office20,000 +5,000
Insurance Industry Reports General Advanced
Life Insurance Headquarter & 1st Tier Cities*
35,000 +8,000Property Insurance Headquarter & 1st Tier Cities*
* Life Insurance and Property General Report (3 cuts, including Headquarter & 1st Tier Cities, Headquarter, and Subsidiary 1st Tier Cities)
( 、 、 )
Life / Property Insurance Subsidiary Leadership Report /
30,000 -
Life / Property Insurance Subsidiary Report / 5,000 / Province
* At least 6 provinces are selected. Purchaser of more than 10 provinces is entitled to 12% discount .6 , 10 88
Life / Property Insurance Human Capital Measurement Report /
40,000 -
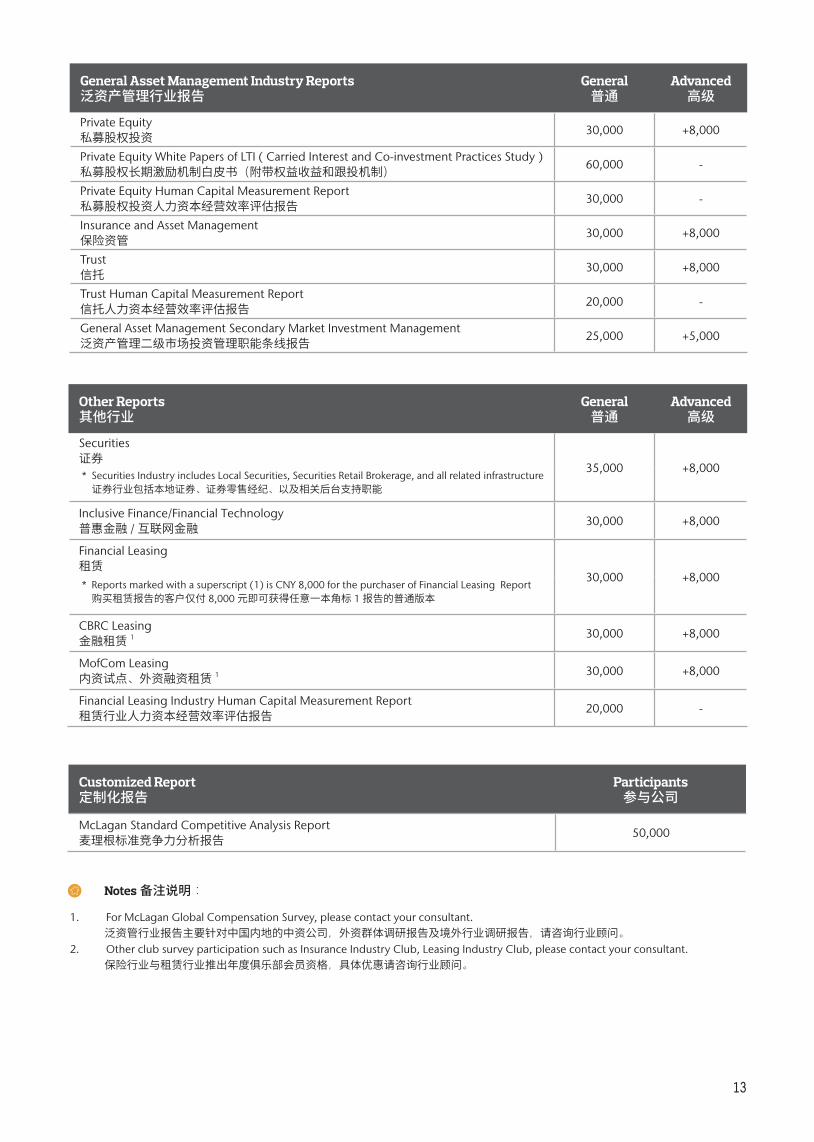
General Asset Management Industry Reports General Advanced
Private Equity 30,000 +8,000
Private Equity White Papers of LTI ( Carried Interest and Co-investment Practices Study )( ) 60,000 -
Private Equity Human Capital Measurement Report30,000 -
Insurance and Asset Management30,000 +8,000
Trust 30,000 +8,000
Trust Human Capital Measurement Report20,000 -
General Asset Management Secondary Market Investment Management25,000 +5,000
Notes :
1. For McLagan Global Compensation Survey, please contact your consultant., , 。
2. Other club survey participation such as Insurance Industry Club, Leasing Industry Club, please contact your consultant., 。
Other Reports General Advanced
Securities
35,000 +8,000* Securities Industry includes Local Securities, Securities Retail Brokerage, and all related infrastructure
、 、
Inclusive Finance/Financial Technology/
30,000 +8,000
Financial Leasing
30,000 +8,000* Reports marked with a superscript (1) is CNY 8,000 for the purchaser of Financial Leasing Report
8,000 1
CBRC Leasing1 30,000 +8,000
MofCom Leasing、 1 30,000 +8,000
Financial Leasing Industry Human Capital Measurement Report20,000 -
Customized Report Participants
McLagan Standard Competitive Analysis Report50,000
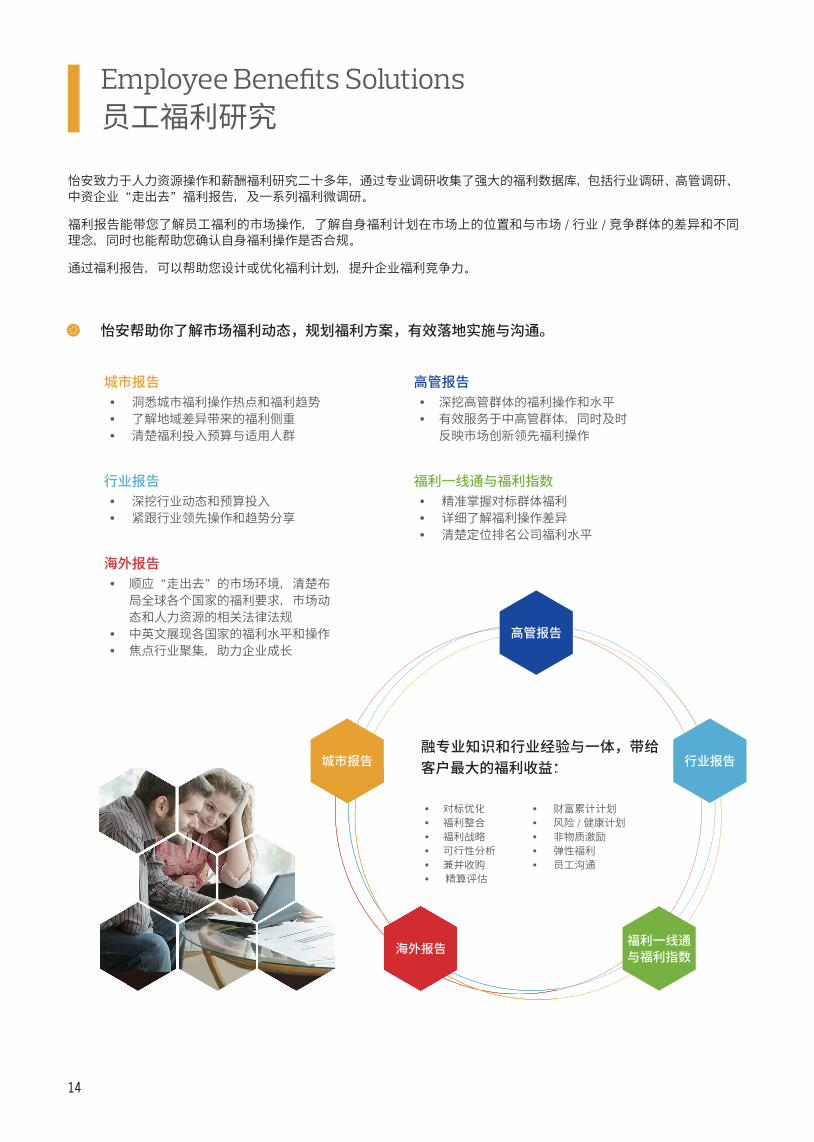
Employee Benefits Solutions
/ /
• • •
• • •
• •
• •
•
• •
• • • • • •
• • /• • •
••••••
• • • • •

2019 Benefit Study2019
Benefi ts and Retention Practices Report General
Benefi ts and Retention Practices - 1st Tier Cities -
18,800
Benefi ts and Retention Practices - 2nd Tier Cities -
18,800
Benefi ts and Retention Practices
25,000
Auto Industry Healthcare Industry
Chemical Industry
Hi-tech Industry
Consumer Goods / Retail Industry/
Financial Industry
Risk Insurance Leave and Other Benefi ts
5,500 / Item 9,900 / Item( Industry )
( )
Supplemental Medical Wellness Management
Wealth Accumulation Plan Retention
Industry Benefi t Specifi cation Listing General
Industry Benefit Specification Listing - 1st Tier Cities -
60,000
Industry Benefit Specification Listing - 2nd Tier Cities -
60,000
Risk Insurance
Leave and Other Benefits
20,000 / Item Supplemental Medical
Wellness Management
Wealth Accumulation Plan
Retention

Global Report English Version Bilingual Version
Country Profile
- 10,000 / country - 64,000 , 86 countries and regions
86
- 20,000 / country - 162,000 , 9 countries and regions
9 *
Benefits Snapshot
- 4,000 / country - 40,000 , 74 countries and regions
74
- 8,000 / country - 64,800 , 9 countries and regions
9 *
Benefits Snapshot in Technology Industry
- 12,000 / country - 120,000 , 25 countries and regions
25
- 24,000 / country - 194,400 , 9 countries and regions
9 *
US Benefits Survey in Technology Industry
- 28,000 / report
- 28,000 / report - 56,000 , report with Chinese explanation
+
Executive Benefi ts General
Executive Benefit Report - General Industry-
20,000
Notes :
* 9 countries and regions including: USA, France, UK, Germany, Singapore, Hong Kong, India, Nigeria and Indonesia.If needed other countries’ bilingual report, the delivery period will be 2-3 weeks.9 : 、 、 、 、 、 、 、 、 。 , 2-3 。
Notes :
* Benefi t Specifi cation Listing and Benefi t Index can only select 8 -15 companies.8-15 。
Benefi t Index General
Benefit Index - 1st Tier Cities -
60,000
Benefit Index - 2nd Tier Cities -
60,000
Risk Insurance
Leave and Other Benefits
20,000 / Item Supplemental Medical
Wellness Management
Wealth Accumulation Plan
Retention

Rewards Strategy and HR Practices Report General
Rewards Strategy and HR Practices - 1st Tier Cities -
18,800
Rewards Strategy and HR Practices - 2nd Tier Cities -
18,800
Rewards Strategy and HR Practices
26,800
Auto Industry Healthcare Industry
Chemical Industry Hi-tech Industry
Consumer Goods / Retail Industry/
Insurance Industry
Rewards Strategy and Pay Positioning Short-term Incentive Program
9,900 / Item
Business Travel Policy (Domestic / Overseas)
( / )
Working Time and Shift Work
Salary Structure Design Training and Development Policy
Work / Life Benefi ts/
Domestic Relocation Policies Report15,000
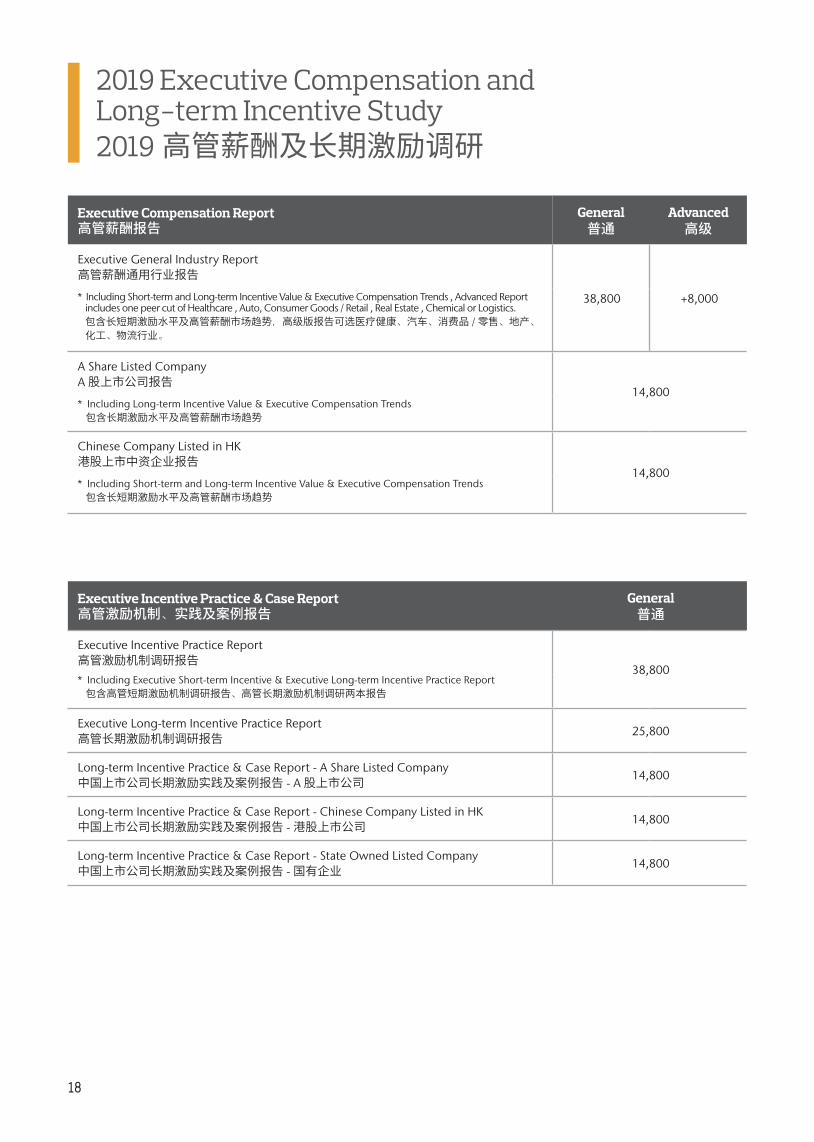
2019 Executive Compensation andLong-term Incentive Study2019
Executive Compensation Report General Advanced
Executive General Industry Report
38,800 +8,000* Including Short-term and Long-term Incentive Value & Executive Compensation Trends , Advanced Report includes one peer cut of Healthcare , Auto, Consumer Goods / Retail , Real Estate , Chemical or Logistics.
, 、 、 / 、 、、 。
A Share Listed CompanyA
14,800* Including Long-term Incentive Value & Executive Compensation Trends
Chinese Company Listed in HK
14,800* Including Short-term and Long-term Incentive Value & Executive Compensation Trends
Executive Incentive Practice & Case Report 、
General
Executive Incentive Practice Report
38,800* Including Executive Short-term Incentive & Executive Long-term Incentive Practice Report 、
Executive Long-term Incentive Practice Report25,800
Long-term Incentive Practice & Case Report - A Share Listed Company- A
14,800
Long-term Incentive Practice & Case Report - Chinese Company Listed in HK-
14,800
Long-term Incentive Practice & Case Report - State Owned Listed Company-
14,800
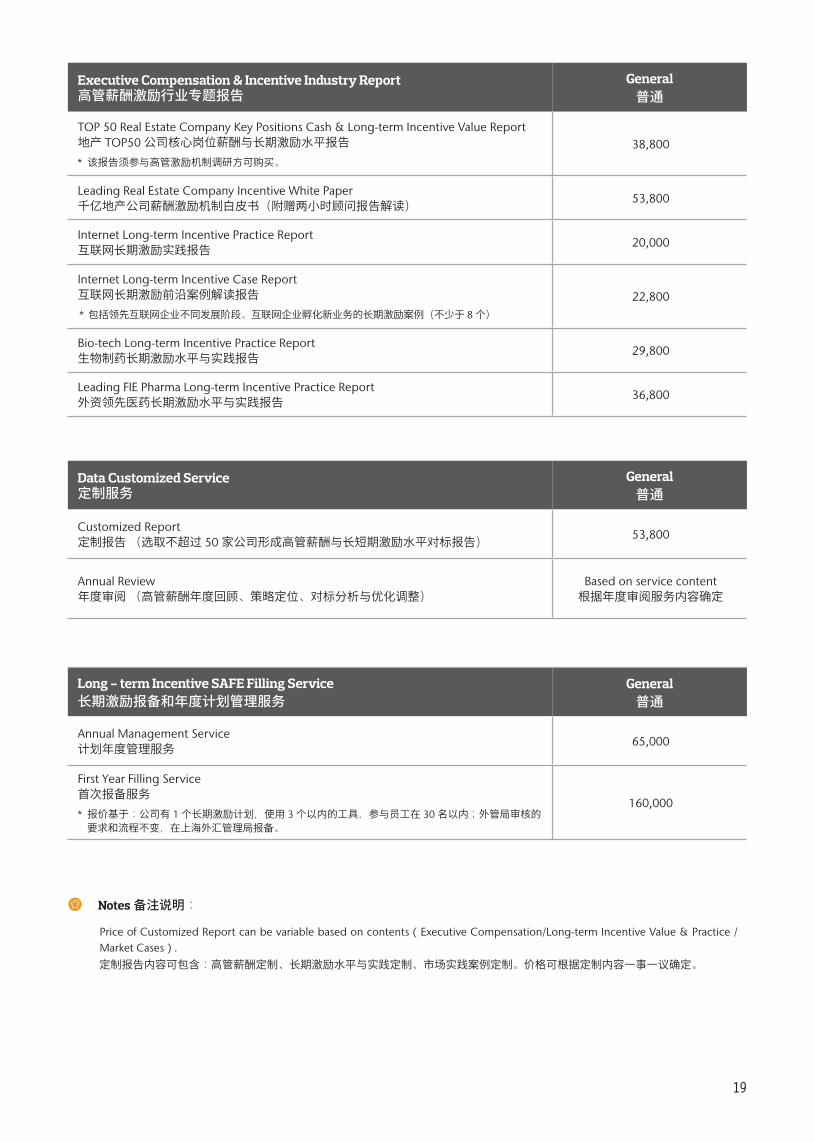
Executive Compensation & Incentive Industry Report General
TOP 50 Real Estate Company Key Positions Cash & Long-term Incentive Value ReportTOP50
* 。
38,800
Leading Real Estate Company Incentive White Paper( ) 53,800
Internet Long-term Incentive Practice Report20,000
Internet Long-term Incentive Case Report
* 、 ( 8 )
22,800
Bio-tech Long-term Incentive Practice Report29,800
Leading FIE Pharma Long-term Incentive Practice Report36,800
Data Customized Service General
Customized Report ( 50 ) 53,800
Annual Review ( 、 、 )
Based on service content
Long - term Incentive SAFE Filling Service General
Annual Management Service65,000
First Year Filling Service
* : 1 , 3 , 30 ;, 。
160,000
Notes :
Price of Customized Report can be variable based on contents ( Executive Compensation/Long-term Incentive Value & Practice /Market Cases ) .
: 、 、 。 。

Other Products / Services Participants Non-Participants
China City Index Report8,800 -
China Salary Planning Report Free6,000
HR Quarterly Watch Free6,000
China Compensation and Benefi ts Summary Report Free6,000
Onsite Group Job Matching Training 20,000 / Day -
Onsite Human Capital China Market Finding Sharing ( Half day )( ) 15,000 -
Pricing Policy
Final Purchased Reports Price exceeds CNY 60,000 (after discount)
60,000( )
8% Additional Discount
8%
Final Purchased Reports Price exceeds CNY 120,000 (after discount)
120,000( )
12% Additional Discount
12%
Notes :
1. Prices listed are for a single report only. The currency is CNY. 。 。
2. Discount does not apply to Job Pricing, Customized Report, Competitive Analysis Report, non-Mainland China Reports, and Aon Learning Center Courses.
、 、 、 。
3. Package products are not eligible for this discount.
。
4. All the services (including training and marketing sharing) are provided by Aon Consultant.( ) 。
5. Aon reserves the right to review the price and discount, and may adjust price and discount accordingly.。
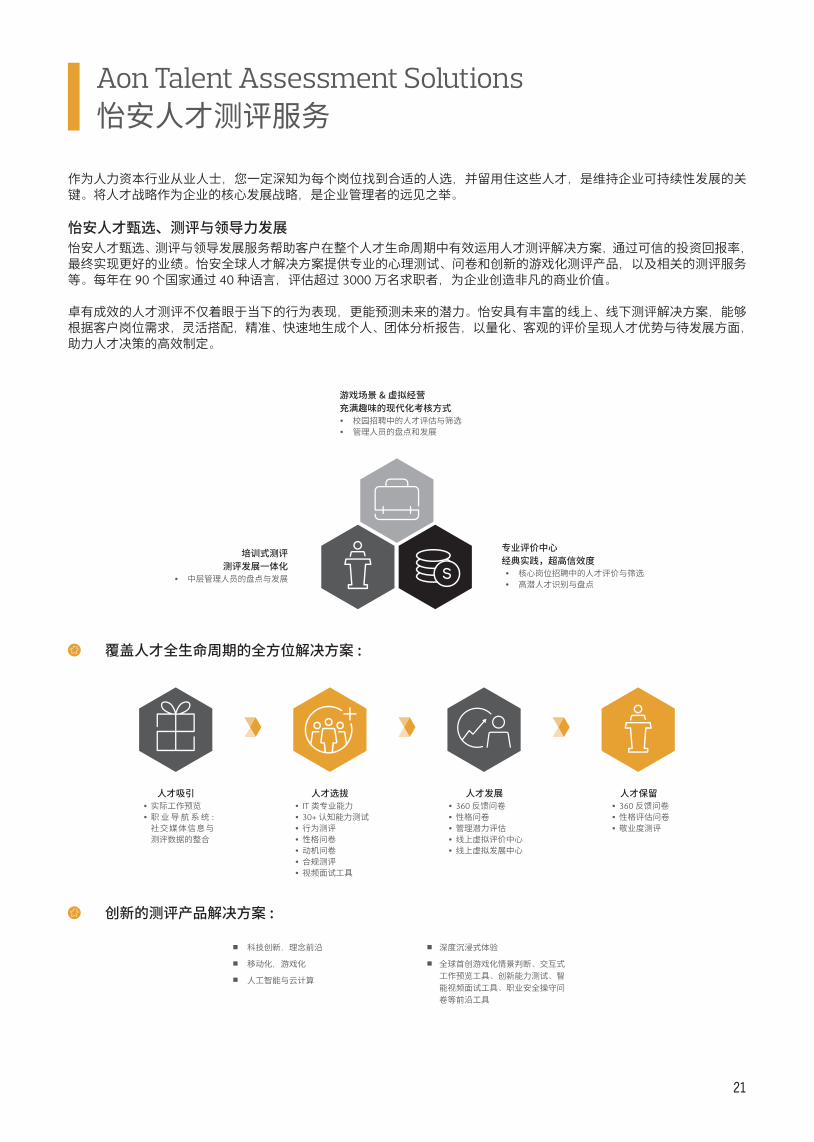
Aon Talent Assessment Solutions
, , ,。 , 。
、 , ,。 、 ,
。 90 40 , 3000 , 。
, 。 、 ,, , 、 、 , 、 ,
。
• •
• • :
,
, 、、 、
、
• IT• 30+• • • • •
• 360• • • •
• 360• •
• • •

2019 Aon Learning Center Training Schedule2019
Course Days( )
Q1 Jan. - Mar.1 3
Q2 Apr. - Jun.
4 6
Q3 Jul. - Sep.
7 9
Q4 Oct. - Dec.
10 12
Early Bird Regular
Cut-e AccreditationCut-e ( ) 2 SH
SZ4/10-115/29-30
SHGZ
9/11-127/3-4 9,000 10,000
Interviewer certification 1 BJ 3/29 SH 4/19 SH 10/18 6,800 7,800
Leadership - Nurturing High Performance Team - 1 SH 6/7 SH 8/2 6,800 7,800
Digital Transformation 1 SH 8/9 6,800 7,800
Improve HR Business AcumenHR ( 1 ) 2 SH 5/30-31 SH 10/24-25 9,500 10,500
Talent Review: Key Talent Management: 1.5 SH 3/21-22 SH 5/16-17 SH
GZ7/18-197/25-26 6,800 7,800
Excel and Statistical Skills for Rewards ProfessionalsXLS 1.5 GZ 5/22-23 SH 7/11-12 6,000 6,600
Market Benchmarking and Salary Structure Design 2 SZ 5/15-16 SHSH
10/10-1112/12-13 8,500 9,400
Total Rewards Management 2 SHGZ
4/25-264/18-19
SHSZ
8/15-168/21-22 8,500 9,400
Sales Incentive Management 1.5 SHGZ
5/23-246/19-20 SH 9/26-27 6,800 7,800
Benefit Practice & Innovation in New Era 1 SH 6/21 SH 11/8 6,000 6,600
LTI Design (For Entry Level) ( ) 1 SH
BJ5/106/6 SZ 11/22 8,000 8,500
LTI Design (For Master Level)( ) 2 BJ
SH8/239/6 SH 10/11 14,000 15,000
Discount Policies : 1. Training fund is valid for one year, commencing from the first training date. , 。 2. Training fund could only be used for public classroom trainings. 。
Aon Learning Center Contact / :
China :
Shelly Fang [email protected]
Shanghai :
Grace Xu [email protected]
Beijing :
Sheffey Shi [email protected]
Guangzhou & Shenzhen :
Kenny Feng [email protected]
Description / Price /
25% discount on Regular Price of Classroom Training75
30,000
30% discount on Regular Price of Classroom Training7
50,000
32% discount on Regular Price of Classroom Training68
100,000
Aon Training Fund
Discount Policies :
1. Early bird price is only available if payment is settled at least 7 working days in advance. 7 。 2. Purchase of 2 courses at one time is entitled to 15% discount on Regular Price. 2 85 。 3. Purchase of 4 courses and above at one time is entitled to 20% discount on Regular Price. 4 8 。
Notes :
1. For those classroom training courses, the fees only include hard copies, lunch and tea break. Participants should cover their own lodging, transportation and ect. , 、 。 、 。
2. Due to the protection of intellectual property rights, Aon provides training materials with hard copies only. , , 。
3. Aon will decide whether above courses are open as planned or add sessions based on actual participants to ensure the quality of course. Please contact Aon consultants for confi rmed open date.
, 。 。
4. All classroom training listed above could be tailored into in-house training. If you need know more about In-house training, please contact Aon Learning Center. 。 , 。
Contact Us
Aon Human Capital Intelligence Center
800 988 [email protected]
Shanghai
+86 (21) 23066688
Beijing
+86 (10) 65875800
Guangzhou
+86 (20) 38165788
Shenzhen
+86 (755) 33602008
Nanjing
+86 (25) 56335002
:www.aonhewitt.com.cn

© Aon plc 2019. All rights reserved.The information contained herein and the statements expressed are of a general nature and are not intended to address the circumstances of any particular individual or entity. Although we endeavor to provide accurate and timely information and use sources we consider reliable, there can be no guarantee that such information is accurate as of the date it is received or that it will continue to be accurate in the future. No one should act on such information without appropriate professional advice after a thorough examination of the particular situation.
About AonAon plc (NYSE.AON) is a leading global professional services fi rm providing a broad range of risk, retirement and health solutions. Our 50,000colleagues in 120 countries empower results for clients by using proprietary data and analytics to deliver insights that reduce volatility and improve performance.
For further information on our capabilities and to learn how we empower results for clients, please visit www.aon.com.