2019 employment survey - gov
TRANSCRIPT

August 2020
2019 Employment Survey Tabulation Set

Department of Statistics
Cedar Park Centre 48 Cedar Avenue Hamilton HM 11 Bermuda
P.O. Box HM 3015 Hamilton HM MX Bermuda
Phone (441) 297-7761 Fax: (441) 295-8390 Email:[email protected] Website: www.gov.bm/department/statistics
August 2020
Dear Reader,
2019 EMPLOYMENT SURVEY
TABULATION SET
Thank you for requesting a copy of the 2019 Employment Tabulation Set. The set contains
detailed labour market comparisons from the 2019 and 2018 Employment Surveys. Should you
require any additional information not contained in this document, contact the Department of
Statistics at 297-7761 extensions 1960, 1956 or 1896. Please note that due to rounding,
percentages presented in the tables may not add to 100 per cent.
Yours sincerely,
Steven Holdipp
Statistician - Business Statistics
R - Revised

i
TABLE OF CONTENTS
Summary Tabulations Page
Number
Table 1 – Filled Jobs by Sex, Bermudian Status and Race of Job Holder, 2019 and 2018…… 1
Table 2 – Filled Jobs by Major Occupational Group, 2019 and 2018 ……………………………… 1
Table 3 – Filled Jobs by Major Division of Economic Activity, 2019 and 2018 …………………... 2
Table 4 – Filled Jobs by Major Division of Economic Activity and Sex of Job Holder, 2019 and
2018 ………………………………………………………………………………..……... 3
Table 5 – Change in the Number of Filled Jobs by Major Division of Economic Activity
and Sex of Job Holder, 2018-2019 …………...…………………………………………..
3
Table 6a – Filled Jobs by Major Division of Economic Activity and Major Occupational Group,
2019 ……………………………..………………………………………………………. 4
Table 6b – Percentage Distribution of Filled Jobs by Major Division of Economic Activity
and Major Occupational Group, 2019 …………………………………………………... 4
Table 7 – Filled Jobs by Major Occupational Group and Sex of Job Holder, 2019 and 2018...…..... 5
Table 8 – Change in the Number of Filled Jobs by Major Occupational Group and Sex of
Job Holder, 2018-2019 …………………………………………………………….…..…. 5
Table 9 – Filled Jobs by Major Occupational Group and Bermudian Status of Job Holder,
2019 and 2018 ……………………………………………………………………………. 6
Table 10 – Change in the Number of Jobs Held by Major Occupational Group and Bermudian
Status of Job Holder, 2018-2019 ……………….……………………………………….. 7
Table 11 – Filled Jobs by Major Occupational Group, Sex and Race of Job Holder, 2019 and 2018 8
Table 12 – Change in the Number of Jobs Held by Major Occupational Group, Sex and Race of
Job Holder, 2018 and 2019 ..……………………………………………………………
9
Table 13 – Filled Jobs by Age of Worker, 2019 and 2018 and the Change between 2018 and
2019 ………………...……………………………………………………………………
9
Table 14 – Business Establishments by Major Division of Economic Activity and Establishment
Size, 2019 …………………………………………………...…………..……………….
10
Table 15 – Business Establishments by Major Division of Economic Activity and Number
of Filled Jobs by Establishment Size, 2019 ……………………………………………... 10

ii
Summary Tabulations cont.
Page
Number
Table 16 – Jobs by Major Division of Economic Activity and Selected Benefits, 2019 ………… 11
Table 17 – Jobs by Major Occupational Group and Selected Benefits, 2019 …………………… 12
Table 18 – Filled Jobs by Gross Annual Income and Age Group, 2019 …………………………. 13
Table 19 – Filled Jobs by Gross Annual Income and Major Occupational Group, 2019 ………… 14
Table 20 – Bermudians and Other non-Bermudians in Selected Occupations
and Percentage of Jobs Filled by Other non-Bermudians, 2019 ….…………………… 15
Table 21 – Labour Market Indicators by Sex and Bermudian Status, 2019 ……………………….... 18
Table 22 – Summer Students by Major Division of Economic Activity and Race, 2019 ...……...…. 19
Table 23 – Bermudians in Twenty Lowest Paid Occupations by Median Gross Annual Income,
2019……………………………………………………………………………………… 20
Table 24 – Other Non-Bermudians in Twenty Lowest Paid Occupations by Median Gross Annual
Income, 2019……..……………………………………………………………………… 21
Detailed Tabulations
Table 1 – Filled Jobs by Major Division of Economic Activity and Major Occupational Group
– Males, 2019……………………………………………………………………….…….. 22
Table 2 – Filled Jobs by Major Division of Economic Activity and Major Occupational Group
– Females, 2019 …………………………………………………………………….…….. 23
Table 3 – Filled Jobs by Minor Division of Economic Activity and Bermudian Status of
Job Holders, 2019 …………………….....……………………………...………………… 24
Table 4 – Filled Jobs by Minor Division of Economic Activity and Bermudian Status of
Job Holders, Males, 2019 ...…………………….………………………………………… 25
Table 5 – Filled Jobs by Minor Division of Economic Activity and Bermudian Status of
Job Holders, Females, 2019 …...………………....………………………………………. 26
Table 6.1 – Filled Jobs by Specific Occupation and Bermudian Status of Job Holders within the
Senior Officials and Managers Occupational Group, 2019 ....................………………. 27

iii
Detailed Tabulations cont.
Page
Number
Table 6.2 – Filled Jobs by Specific Occupation and Bermudian Status of Job Holders within the
Professionals Occupational Group, 2019 ...………………….……................................ 29
Table 6.3 – Filled Jobs by Specific Occupation and Bermudian Status of Job Holders within the
Technicians and Associate Professionals Occupational Group, 2019 …………....……. 33
Table 6.4 – Filled Jobs by Specific Occupation and Bermudian Status of Job Holders within the
Clerical Occupational Group, 2019 ………….………………………………………… 35
Table 6.5 – Filled Jobs by Specific Occupation and Bermudian Status of Job Holders within the
Service Workers, Shop and Market Sales Workers Occupational Group, 2019 …......... 36
Table 6.6 – Filled Jobs by Specific Occupation and Bermudian Status of Job Holders within the
Skilled Agricultural & Fishery Workers Occupational Group, 2019 …………………. 38
Table 6.7 – Filled Jobs by Specific Occupation and Bermudian Status of Job Holders within the
Craft and Related Trades Workers Occupational Group, 2019 ……………………….. 39
Table 6.8 – Filled Jobs by Specific Occupation and Bermudian Status of Job Holders within the
Plant and Machine Operators and Assemblers Occupational Group, 2019 …………… 42
Table 6.9 – Filled Jobs by Specific Occupation and Bermudian Status of Job Holders within the
Elementary Occupations Group, 2019 ………….……………………………………... 44
Table 6.10 – Filled Jobs by Specific Occupation and Bermudian Status of Job Holders within the
Armed Forces, 2019 ………………………………………………………………...... 45

Table 1
Filled Jobs by Sex, Bermudian Status and Race of Job Holder, 2019 and 2018R
Percentage Increase/Decrease(-)
Sex, Bermudian Status Number Distribution Number Percent
and Race of
Job Holder 2019 2018R
2019 2019R
Total 34,378 33,855 100% 100% 523 1.5
Males 17,527 17,228 51% 51% 299 1.7
Females 16,851 16,627 49% 49% 224 1.3
Bermudians 23,841 23,615 69% 70% 226 1.0
Males 10,981 10,838 32% 32% 143 1.3
Females 12,860 12,777 37% 38% 83 0.6
Non-Bermudians 10,537 10,240 31% 30% 297 2.9
Non-Bermudian Spouses of Bermudians 1,907 1,876 6% 6% 31 1.7
Other non-Bermudians 7,894 7,570 23% 22% 324 4.3
Permanent Resident Certificate Holders 736 794 2% 2% -58 -7.3
Black 18,076 17,858 53% 53% 218 1.2
White 10,677 10,681 31% 32% -4 0.0
Mixed/Other Races 5,625 5,316 16% 16% 309 5.8
Table 2
Filled Jobs by Major Occupational Group, 2019 and 2018R
Percentage Increase/Decrease(-)
Number Distribution Number Percent
Major Occupational Group 2019 2018R
2019 2018R
Total 34,378 33,855 100% 100% 523 1.5
Senior Officials and Managers 6,454 6,381 19% 19% 73 1.1
Professionals 6,514 6,328 19% 19% 186 2.9
Technicians and Associate Professionals 2,857 2,864 8% 8% -7 -0.2
Clerks 5,054 5,093 15% 15% -39 -0.8
Service Workers and Shop and Market Sales Workers 7,427 7,248 22% 21% 179 2.5
Skilled Agricultural and Fishery Workers 771 762 2% 2% 9 1.2
Craft and Related Trades Workers 2,814 2,730 8% 8% 84 3.1
Plant and Machine Operators and Assemblers 1,441 1,459 4% 4% -18 -1.2
Elementary Occupations 1,018 963 3% 3% 55 5.7
Armed Forces 28 27 0% 0% 1 3.7
2018-2019
2018-2019
1

Table 3
Filled Jobs By Major Division of Economic Activity, 2019 and 2018R
Percentage Increase/Decrease(-)
Number Distribution Number Percent
Major Division of Economic Activity 2019 2018R
2019 2018R
2018-2019
Total 34,378 33,855 100% 100% 523 1.5
Agriculture, Forestry, Fisheries, Mining & Quarrying 564 571 2% 2% -7 -1.2
Manufacturing 521 537 2% 2% -16 -3.0
Electricity, Gas & Water 295 314 1% 1% -19 -6.1
Construction 2,221 2,132 6% 6% 89 4.2
Wholesale Trade & Motor Vehicles 1,469 1,439 4% 4% 30 2.1
Retail Trade & Repair Services 2,722 2,797 8% 8% -75 -2.7
Hotels 2,534 2,383 7% 7% 151 6.3
Restaurant, Cafes & Bars 2,155 2,164 6% 6% -9 -0.4
Transport & Communications 1,912 1,889 6% 6% 23 1.2
Financial Intermediation 2,222 2,267 6% 7% -45 -2.0
Real Estate & Renting Services 491 469 1% 1% 22 4.7
Business Services 3,644 3,579 11% 11% 65 1.8
Public Administration 3,964 3,766 12% 11% 198 5.3
Education, Health & Social Work 3,833 3,725 11% 11% 108 2.9
Other Community, Social & Personal Services 1,906 1,838 6% 5% 68 3.7
International Business Activity 3,925 3,985 11% 12% -60 -1.5
2

Table 4
Filled Jobs by Major Division of Economic Activity and Sex of Job Holder, 2019 and 2018R
Distribution
Major Division of Economic Activity Total Males Females Males Females Total Males Females Males Females
Total 34,378 17,527 16,851 100% 100% 33,855 17,228 16,627 100% 100%
Agriculture, Forestry, Fisheries, Mining & Quarrying 564 517 47 3% 0% 571 524 47 3% 0%
Manufacturing 521 374 147 2% 1% 537 383 154 2% 1%
Electricity, Gas & Water 295 252 43 1% 0% 314 264 50 2% 0%
Construction 2,221 2,084 137 12% 1% 2,132 2,005 127 12% 1%
Wholesale Trade & Motor Vehicles 1,469 1,056 413 6% 2% 1,439 1,039 400 6% 2%
Retail Trade & Repair Services 2,722 1,204 1,518 7% 9% 2,797 1,228 1,569 7% 9%
Hotels, Restaurants, Cafes & Bars 2,534 1,402 1,132 8% 7% 2,383 1,331 1,052 8% 6%
Restaurant, Cafes & Bars 2,155 1,445 710 8% 4% 2,164 1,455 709 8% 4%
Transport & Communications 1,912 1,288 624 7% 4% 1,889 1,269 620 7% 4%
Financial Intermediation 2,222 700 1,522 4% 9% 2,267 694 1,573 4% 9%
Real Estate & Renting Services 491 282 209 2% 1% 469 255 214 1% 1%
Business Services 3,644 1,755 1,889 10% 11% 3,579 1,737 1,842 10% 11%
Public Administration 3,964 1,881 2,083 11% 12% 3,766 1,787 1,979 10% 12%
Education, Health & Social Work 3,833 882 2,951 5% 18% 3,725 851 2,874 5% 17%
Other Community, Social & Personal Services 1,906 652 1,254 4% 7% 1,838 621 1,217 4% 7%
International Business Activity 3,925 1,753 2,172 10% 13% 3,985 1,785 2,200 10% 13%
Table 5
Change in the Number of Filled Jobs by Major Division of Economic Activity
and Sex of Job Holder, 2018R-2019
Growth in Jobs
Major Division of Economic Activity Total Males Females
Total 523 299 224
Agriculture, Forestry, Fisheries, Mining & Quarrying -7 -7 0
Manufacturing -16 -9 -7
Electricity, Gas & Water -19 -12 -7
Construction 89 79 10
Wholesale Trade & Motor Vehicles 30 17 13
Retail Trade & Repair Services -75 -24 -51
Hotels 151 71 80
Restaurant, Cafes & Bars -9 -10 1
Transport & Communications 23 19 4
Financial Intermediation -45 6 -51
Real Estate & Renting Services 22 27 -5
Business Services 65 18 47
Public Administration 198 94 104
Education, Health & Social Work 108 31 77
Other Community, Social & Personal Services 68 31 37
International Business Activity -60 -32 -28
Number
2019 2018R
Number
Percentage
Distribution
Percentage
3

Table 6a
Filled Jobs by Major Division of Economic Activity and Major Occupational Group, 2019
Major Occupational Group
Service Skilled Craft & Plant &
Senior Technicians Workers & Agricultural Related Machine
Officials & & Associate Shop & Market & Fishery Trades Operators & Elementary Armed
Major Division of Economic Activity Total Managers Professionals Professionals Clerks Sales Workers Workers Workers Assemblers Occupations Forces
Total 34,378 6,454 6,514 2,857 5,054 7,427 771 2,814 1,441 1,018 28
Agriculture, Forestry, Fisheries, Mining & Quarrying 564 41 11 4 18 2 462 19 4 3 0
Manufacturing 521 106 39 15 44 44 0 229 31 13 0
Electricity, Gas & Water 295 41 23 24 43 6 0 87 57 14 0
Construction 2,221 340 57 54 80 32 39 1,236 92 291 0
Wholesale Trade & Motor Vehicles 1,469 315 21 128 211 169 4 234 249 138 0
Retail Trade & Repair Services 2,722 644 138 162 604 781 1 200 77 115 0
Hotels 2,534 299 42 32 227 1,652 57 100 117 8 0
Restaurant, Cafes & Bars 2,155 268 22 10 118 1,670 2 43 10 12 0
Transport & Communications 1,912 246 100 235 511 59 4 167 542 48 0
Financial Intermediation 2,222 793 489 175 713 47 1 4 0 0 0
Real Estate & Renting Services 491 119 26 137 62 48 22 47 8 22 0
Business Services 3,644 897 945 246 517 841 11 111 24 52 0
Public Administration 3,964 510 1,255 630 465 460 81 180 112 243 28
Education, Health & Social Work 3,833 403 1,962 182 472 638 12 95 51 18 0
Other Community, Social & Personal Services 1,906 209 220 136 160 955 69 57 67 33 0
International Business Activity 3,925 1,223 1,164 687 809 23 6 5 0 8 0
Table 6b
Percentage Distribution of Filled Jobs by Major Division of Economic Activity and Major Occupational Group, 2019
Major Occupational Group
Service Skilled Craft & Plant &
Senior Technicians Workers & Agricultural Related Machine
Officials & & Associate Shop & Market & Fishery Trades Operators & Elementary Armed
Major Division of Economic Activity Total Managers Professionals Professionals Clerks Sales Workers Workers Workers Assemblers Occupations Forces
Total 100% 19% 19% 8% 15% 22% 2% 8% 4% 3% 0%
Agriculture, Forestry, Fisheries, Mining & Quarrying 100% 7% 2% 1% 3% 0% 82% 3% 1% 1% 0%
Manufacturing 100% 20% 7% 3% 8% 8% 0% 44% 6% 2% 0%
Electricity, Gas & Water 100% 14% 8% 8% 15% 2% 0% 29% 19% 5% 0%
Construction 100% 15% 3% 2% 4% 1% 2% 56% 4% 13% 0%
Wholesale Trade & Motor Vehicles 100% 21% 1% 9% 14% 12% 0% 16% 17% 9% 0%
Retail Trade & Repair Services 100% 24% 5% 6% 22% 29% 0% 7% 3% 4% 0%
Hotels 100% 12% 2% 1% 9% 65% 2% 4% 5% 0% 0%
Restaurant, Cafes & Bars 100% 12% 1% 0% 5% 77% 0% 2% 0% 1% 0%
Transport & Communications 100% 13% 5% 12% 27% 3% 0% 9% 28% 3% 0%
Financial Intermediation 100% 36% 22% 8% 32% 2% 0% 0% 0% 0% 0%
Real Estate & Renting Services 100% 24% 5% 28% 13% 10% 4% 10% 2% 4% 0%
Business Services 100% 25% 26% 7% 14% 23% 0% 3% 1% 1% 0%
Public Administration 100% 13% 32% 16% 12% 12% 2% 5% 3% 6% 1%
Education, Health & Social Work 100% 11% 51% 5% 12% 17% 0% 2% 1% 0% 0%
Other Community, Social & Personal Services 100% 11% 12% 7% 8% 50% 4% 3% 4% 2% 0%
International Business Activity 100% 31% 30% 18% 21% 1% 0% 0% 0% 0% 0%
4
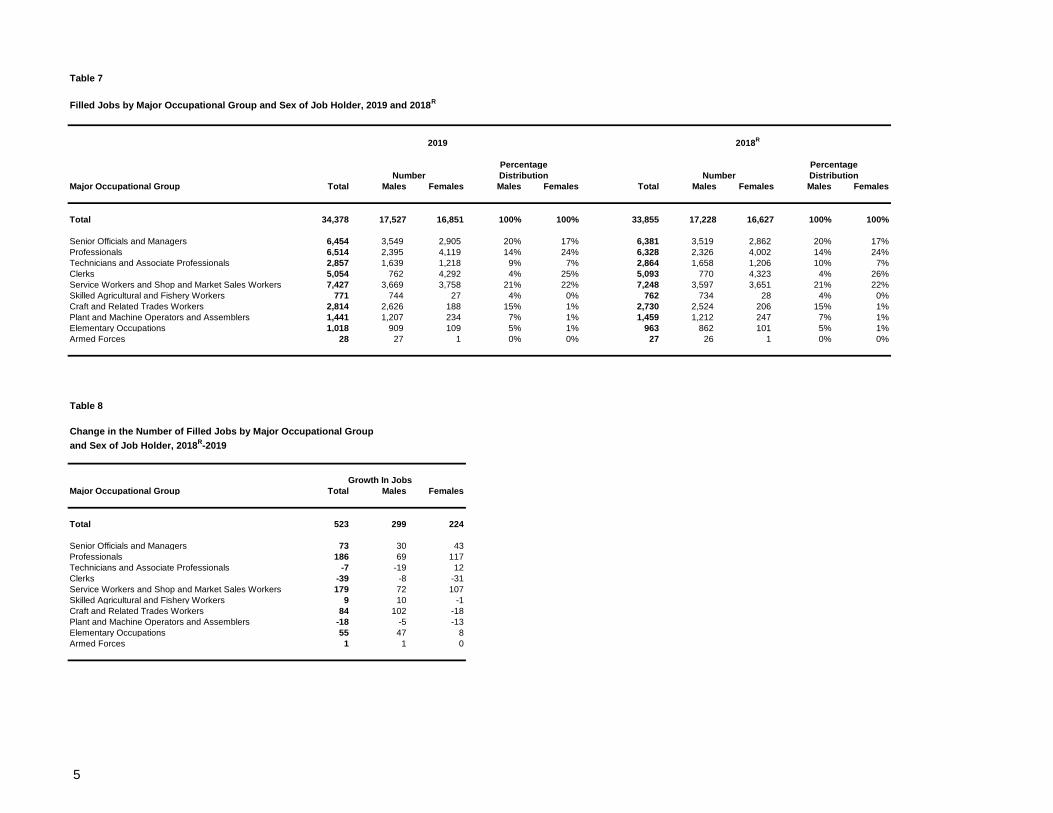
Table 7
Filled Jobs by Major Occupational Group and Sex of Job Holder, 2019 and 2018R
Percentage Percentage
Number Distribution Number Distribution
Major Occupational Group Total Males Females Males Females Total Males Females Males Females
Total 34,378 17,527 16,851 100% 100% 33,855 17,228 16,627 100% 100%
Senior Officials and Managers 6,454 3,549 2,905 20% 17% 6,381 3,519 2,862 20% 17%
Professionals 6,514 2,395 4,119 14% 24% 6,328 2,326 4,002 14% 24%
Technicians and Associate Professionals 2,857 1,639 1,218 9% 7% 2,864 1,658 1,206 10% 7%
Clerks 5,054 762 4,292 4% 25% 5,093 770 4,323 4% 26%
Service Workers and Shop and Market Sales Workers 7,427 3,669 3,758 21% 22% 7,248 3,597 3,651 21% 22%
Skilled Agricultural and Fishery Workers 771 744 27 4% 0% 762 734 28 4% 0%
Craft and Related Trades Workers 2,814 2,626 188 15% 1% 2,730 2,524 206 15% 1%
Plant and Machine Operators and Assemblers 1,441 1,207 234 7% 1% 1,459 1,212 247 7% 1%
Elementary Occupations 1,018 909 109 5% 1% 963 862 101 5% 1%
Armed Forces 28 27 1 0% 0% 27 26 1 0% 0%
Table 8
Change in the Number of Filled Jobs by Major Occupational Group
and Sex of Job Holder, 2018R-2019
Major Occupational Group Total Males Females
Total 523 299 224
Senior Officials and Managers 73 30 43
Professionals 186 69 117
Technicians and Associate Professionals -7 -19 12
Clerks -39 -8 -31
Service Workers and Shop and Market Sales Workers 179 72 107
Skilled Agricultural and Fishery Workers 9 10 -1
Craft and Related Trades Workers 84 102 -18
Plant and Machine Operators and Assemblers -18 -5 -13
Elementary Occupations 55 47 8
Armed Forces 1 1 0
2019 2018R
Growth In Jobs
5

Table 9
Filled Jobs by Major Occupational Group and Bermudian Status of Job Holder, 2019 and 2018R
Non-Bermudian Other Permanent
Spouse of non- Resident
Major Occupational Group Total Bermudian Bermudian Bermudian Certificate Holder
Total 34,378 23,841 1,907 7,894 736
Senior Officials and Managers 6,454 4,256 435 1,564 199
Professionals 6,514 3,827 441 2,140 106
Technicians and Associate Professionals 2,857 2,126 178 500 53
Clerks 5,054 4,699 195 101 59
Service Workers and Shop and Market Sales Workers 7,427 4,595 379 2,278 175
Skilled Agricultural and Fishery Workers 771 355 42 310 64
Craft and Related Trades Workers 2,814 1,767 147 853 47
Plant and Machine Operators and Assemblers 1,441 1,361 40 29 11
Elementary Occupations 1,018 829 50 117 22
Armed Forces 28 26 0 2 0
Total 33,855 23,615 1,876 7,570 794
Senior Officials and Managers 6,381 4,216 437 1,527 201
Professionals 6,328 3,727 428 2,064 109
Technicians and Associate Professionals 2,864 2,090 180 527 67
Clerks 5,093 4,724 194 107 68
Service Workers and Shop and Market Sales Workers 7,248 4,563 357 2,151 177
Skilled Agricultural and Fishery Workers 762 348 39 313 62
Craft and Related Trades Workers 2,730 1,747 147 786 50
Plant and Machine Operators and Assemblers 1,459 1,368 43 35 13
Elementary Occupations 963 807 51 58 47
Armed Forces 27 25 0 2 0
2018R
2019
Bermudian Status
6

Table 10
Change in the Number of Jobs Held by Major Occupational Group and Bermudian Status of Job Holder, 2018-2019
Non-Bermudian Other Permanent
Spouse of non- Resident
Major Occupational Group Total Bermudian Bermudian Bermudian Certificate Holder
Total 523 226 31 324 -58
Senior Officials and Managers 73 40 -2 37 -2
Professionals 186 100 13 76 -3
Technicians and Associate Professionals -7 36 -2 -27 -14
Clerks -39 -25 1 -6 -9
Service Workers and Shop and Market Sales Workers 179 32 22 127 -2
Skilled Agricultural and Fishery Workers 9 7 3 -3 2
Craft and Related Trades Workers 84 20 0 67 -3
Plant and Machine Operators and Assemblers -18 -7 -3 -6 -2
Elementary Occupations 55 22 -1 59 -25
Armed Forces 1 1 0 0 0
Bermudian Status
7

Table 11
Filled Jobs by Major Occupational Group, Sex and Race of Job Holder, 2019 and 2018R
Service Skilled Craft & Plant &
Senior Technicians Workers & Agricultural Related Machine
Officials & & Associate Shop & Market & Fishery Trades Operators & Elementary Armed
Sex & Race Total Managers Professionals Professionals Clerks Sales Workers Workers Workers Assemblers Occupations Forces
Total 34,378 6,454 6,514 2,857 5,054 7,427 771 2,814 1,441 1,018 28
Black 18,076 2,509 3,154 1,334 3,474 4,079 271 1,354 1,164 717 20
White 10,677 3,164 2,534 1,219 1,093 1,135 323 885 169 148 7
Mixed/other races 5,625 781 826 304 487 2,213 177 575 108 153 1
Males 17,527 3,549 2,395 1,639 762 3,669 744 2,626 1,207 909 27
Black 8,231 1,131 911 717 552 1,806 261 1,236 965 633 19
White 5,992 1,983 1,168 755 132 512 310 835 153 137 7
Mixed/other races 3,304 435 316 167 78 1,351 173 555 89 139 1
Females 16,851 2,905 4,119 1,218 4,292 3,758 27 188 234 109 1
Black 9,845 1,378 2,243 617 2,922 2,273 10 118 199 84 1
White 4,685 1,181 1,366 464 961 623 13 50 16 11 0
Mixed/other races 2,321 346 510 137 409 862 4 20 19 14 0
Total 33,855 6,381 6,328 2,864 5,093 7,248 762 2,730 1,459 963 27
Black 17,858 2,486 3,026 1,324 3,472 4,057 270 1,338 1,178 688 19
White 10,681 3,156 2,505 1,245 1,120 1,121 325 882 166 154 7
Mixed/other races 5,316 739 797 295 501 2,070 167 510 115 121 1
Males 17,228 3,519 2,326 1,658 770 3,597 734 2,524 1,212 862 26
Black 8,122 1,128 855 709 555 1,806 259 1,210 967 615 18
White 5,999 1,967 1,167 787 141 506 311 825 147 141 7
Mixed/other races 3,107 424 304 162 74 1,285 164 489 98 106 1
Females 16,627 2,862 4,002 1,206 4,323 3,651 28 206 247 101 1
Black 9,736 1,358 2,171 615 2,917 2,251 11 128 211 73 1
White 4,682 1,189 1,338 458 979 615 14 57 19 13 0
Mixed/other races 2,209 315 493 133 427 785 3 21 17 15 0
Major Occupational Group
2019
2018R
8
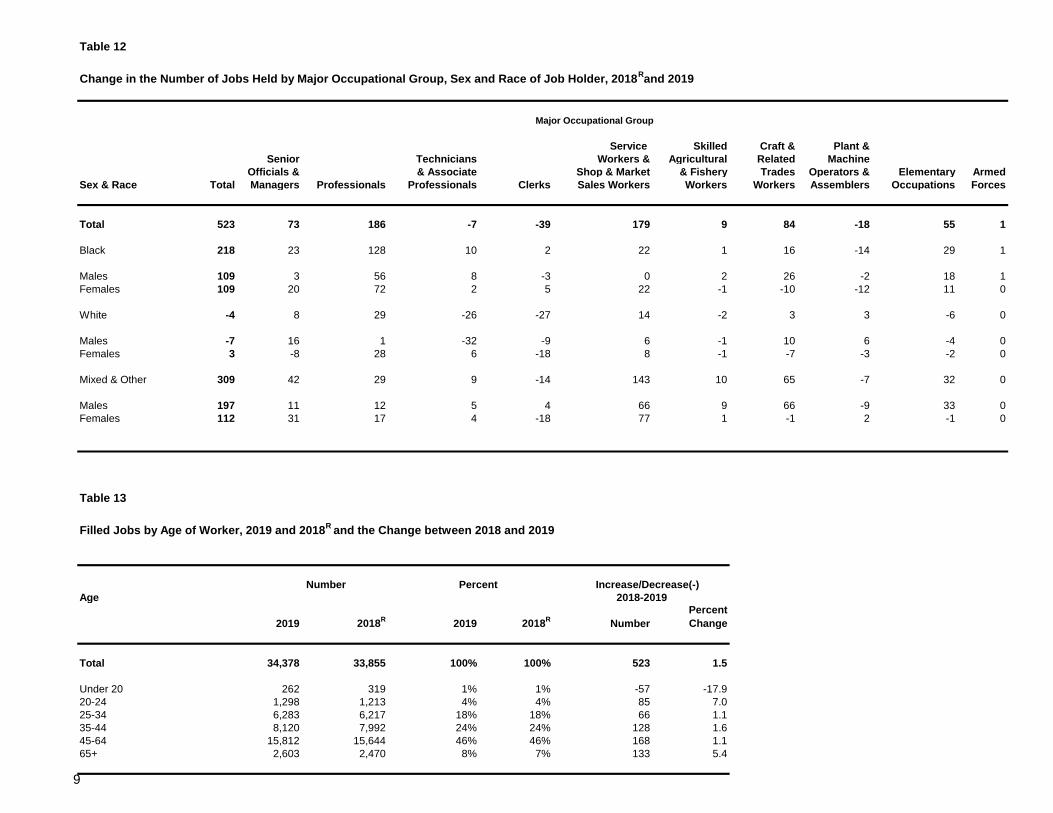
Table 12
Change in the Number of Jobs Held by Major Occupational Group, Sex and Race of Job Holder, 2018Rand 2019
Major Occupational Group
Service Skilled Craft & Plant &
Senior Technicians Workers & Agricultural Related Machine
Officials & & Associate Shop & Market & Fishery Trades Operators & Elementary Armed
Sex & Race Total Managers Professionals Professionals Clerks Sales Workers Workers Workers Assemblers Occupations Forces
Total 523 73 186 -7 -39 179 9 84 -18 55 1
Black 218 23 128 10 2 22 1 16 -14 29 1
Males 109 3 56 8 -3 0 2 26 -2 18 1
Females 109 20 72 2 5 22 -1 -10 -12 11 0
White -4 8 29 -26 -27 14 -2 3 3 -6 0
Males -7 16 1 -32 -9 6 -1 10 6 -4 0
Females 3 -8 28 6 -18 8 -1 -7 -3 -2 0
Mixed & Other 309 42 29 9 -14 143 10 65 -7 32 0
Males 197 11 12 5 4 66 9 66 -9 33 0
Females 112 31 17 4 -18 77 1 -1 2 -1 0
Table 13
Filled Jobs by Age of Worker, 2019 and 2018R
and the Change between 2018 and 2019
Age
2019 2018R
2019 2018R
Number
Percent
Change
Total 34,378 33,855 100% 100% 523 1.5
Under 20 262 319 1% 1% -57 -17.9
20-24 1,298 1,213 4% 4% 85 7.0
25-34 6,283 6,217 18% 18% 66 1.1
35-44 8,120 7,992 24% 24% 128 1.6
45-64 15,812 15,644 46% 46% 168 1.1
65+ 2,603 2,470 8% 7% 133 5.4
Percent Increase/Decrease(-)
2018-2019
Number
9

Table 14
Business Establishments by Major Division of Economic Activity and Establishment Size, 2019
Size of Establishment (Jobs)
Major Division of Economic Activity Total 1 to 4 5 to 9 10 to 49 50+
Total 4,032 2,973 491 450 118
Agriculture, Forestry, Fisheries, Mining & Quarrying 182 147 26 9 0
Manufacturing 125 96 20 7 2
Electricity, Gas & Water 23 21 0 1 1
Construction 535 437 45 47 6
Wholesale Trade & Motor Vehicles 144 86 25 29 4
Retail Trade & Repair Services 302 209 40 39 14
Hotels 40 20 2 7 11
Restaurant, Cafes & Bars 131 42 30 52 7
Transport & Communications 328 287 13 19 9
Financial Intermediation 86 52 15 10 9
Real Estate & Renting Services 112 89 11 12 0
Business Services 557 431 61 51 14
Public Administration 63 5 14 32 12
Education, Health & Social Work 314 198 73 36 7
Other Community, Social & Personal Services 780 685 59 36 0
International Business Activity 310 168 57 63 22
Table 15
Business Establishments by Major Division of Economic Activity and Number of
Filled Jobs by Establishment Size, 2019
Size of Establishment (Jobs)
Major Division of Economic Activity Total 1 to 4 5 to 9 10 to 49 50+
Total 34,378 4,645 3,164 9,288 17,281
Agriculture, Forestry, Fisheries, Mining & Quarrying 564 230 154 180 0
Manufacturing 521 165 134 89 133
Electricity, Gas & Water 295 24 0 39 232
Construction 2,221 609 294 861 457
Wholesale Trade & Motor Vehicles 1,469 157 158 669 485
Retail Trade & Repair Services 2,722 377 252 710 1,383
Hotels 2,534 36 15 185 2,298
Restaurant, Cafes & Bars 2,155 95 192 1,185 683
Transport & Communications 1,912 357 81 508 966
Financial Intermediation 2,222 102 96 248 1,776
Real Estate & Renting Services 491 147 71 273 0
Business Services 3,644 656 402 966 1,620
Public Administration 3,964 16 96 835 3,017
Education, Health & Social Work 3,833 377 473 635 2,348
Other Community, Social & Personal Services 1,906 964 382 560 0
International Business Activity 3,925 333 364 1,345 1,883
10

Table 16
Jobs by Major Division of Economic Activity and Selected Benefits, 2019
Annual Car Housing Mortgage Stock Travel Other
Major Division Of Economic Activity Total2
Bonus Allowance Allowance Subsidy Plan Allowance Benefits
Total 18,712 9,193 814 2,113 692 1,315 1,084 3,501
Agriculture, Forestry, Fisheries, Mining & Quarrying 21 12 2 5 0 0 1 1
Manufacturing 56 30 4 2 0 0 10 10
Electricity, Gas & Water 527 258 32 4 0 232 1 0
Construction 441 243 15 89 9 2 33 50
Wholesale Trade & Motor Vehicles 358 188 49 7 1 0 3 110
Retail Trade & Repair Services 909 717 48 12 0 2 16 114
Hotels 310 157 6 33 7 0 5 102
Restaurant, Cafes & Bars 832 119 3 237 6 15 6 446
Transport & Communications 969 500 16 29 0 4 17 403
Financial Intermediation 3,416 1,800 21 69 393 530 32 571
Real Estate & Renting Services 122 101 6 4 0 0 3 8
Business Services 1,752 1,270 176 21 5 14 75 191
Public Administration 733 73 48 423 7 1 163 18
Education, Health & Social Work 322 150 15 44 4 0 38 71
Other Community, Social & Personal Services 391 146 51 69 15 1 39 70
International Business Activity 7,553 3,429 322 1,065 245 514 642 1,336
1Excludes all legally mandated benefits such as health insurance and pension benefits.
2The total number of jobs does not equal the total number of benefits job holders were entitled to receive because
respondents were invited to report multiple responses.
Selected Benefits1
11

Table 17
Jobs by Major Occupational Group and Selected Benefits, 2019
Annual Car Housing Mortgage Stock Travel Other
Major Occupational Group Total2
Bonus Allowance Allowance Subsidy Plan Allowance Benefits
Total 18,712 9,193 814 2,113 692 1,315 1,084 3,501
Senior Officials and Managers 6,082 2,864 338 663 240 543 444 990
Professionals 4,022 2,161 184 385 134 257 267 634
Technicians and Associate Professionals 2,617 1,037 131 576 90 145 187 451
Clerks 3,145 1,886 90 72 187 215 90 605
Service Workers and Shop and Market Sales Workers 1,526 478 35 289 29 30 41 624
Skilled Agricultural and Fishery Workers 62 46 5 7 0 0 1 3
Craft and Related Trades Workers 670 392 8 27 7 83 7 146
Plant and Machine Operators and Assemblers 231 149 17 1 0 35 2 27
Elementary Occupations 303 180 5 69 2 7 19 21
Armed Forces 54 0 1 24 3 0 26 0
1Excludes all legally mandated benefits such as health insurance and pension benefits.
2The total number of jobs does not equal the total number of benefits job holders were entitled to receive because
respondents were invited to report multiple responses.
Selected Benefits1
12

Table 18
Filled Jobs by Gross Annual Income1 and Age Group, 2019
Age Group
Under
Gross Annual Income Total2
20 20-24 25-29 30-34 35-39 40-44 45-49 50-54 55-59 60-64 65+
Total 33,225 260 1,269 2,627 3,511 3,980 3,938 4,078 4,003 4,104 3,110 2,345
Under $12,000 1,614 97 111 104 139 126 125 155 154 188 159 256
$12,000 to $29,999 2,924 98 299 289 245 254 245 239 262 345 233 415
$30,000 to $35,999 1,488 24 146 157 145 158 146 152 132 136 121 171
$36,000 to $47,999 4,332 37 409 526 493 508 447 418 368 401 356 369
$48,000 to $59,999 5,443 1 150 519 648 647 629 627 664 690 540 328
$60,000 to $71,999 3,616 1 88 305 380 404 419 448 442 493 428 208
$72,000 to $83,999 3,140 0 45 340 394 388 331 391 372 413 305 161
$84,000 to $95,999 2,855 1 13 158 319 395 378 410 424 385 267 105
$96,000 to $107,999 1,821 0 2 98 205 221 235 298 253 258 175 76
$108,000 to $131,999 2,044 0 4 82 245 276 295 284 297 295 194 72
$132,000 to $155,999 1,051 1 1 29 123 167 153 144 162 127 94 50
$156,000 to $234,999 1,496 0 1 17 127 247 263 229 217 196 127 72
$235,000 to $349,999 805 0 0 1 36 124 175 167 124 102 43 33
$350,000 to $499,999 350 0 0 1 7 41 62 73 81 34 33 18
$500,000 to $649,999 104 0 0 1 3 11 14 22 22 16 11 4
$650,000 to $749,999 41 0 0 0 1 2 9 8 7 9 4 1
$750,000 to $849,999 50 0 0 0 0 6 6 7 12 7 11 1
$850,000 to $899,999 10 0 0 0 1 2 1 1 2 2 0 1
$900,000 and over 41 0 0 0 0 3 5 5 8 7 9 4
1Includes job holders in all establishments.
2There were 1,153 responses for which income was not stated.
13

Table 19
Filled Jobs by Gross Annual Income1 and Major Occupational Group, 2019
Major Occupational Group
Service Skilled Craft & Plant &
Senior Technicians Workers & Agricultural Related Machine
Gross Annual Income Total2
Officials & & Associate Shop & Market & Fishery Trades Operators & Elementary Armed
Managers Professionals Professionals Clerks Sales Workers Workers Workers Assemblers Occupations Forces
Total 33,225 6,200 6,378 2,789 5,001 7,205 706 2,640 1,294 984 28
Under $12,000 1,614 149 100 91 215 786 25 77 122 49 0
$12,000 to $29,999 2,924 184 152 85 450 1,586 58 155 144 110 0
$30,000 to $35,999 1,488 97 84 57 198 771 44 123 79 35 0
$36,000 to $47,999 4,332 296 199 151 693 1,771 258 457 254 253 0
$48,000 to $59,999 5,443 472 420 289 1,073 1,450 192 803 381 363 0
$60,000 to $71,999 3,616 540 496 301 848 465 91 529 224 121 1
$72,000 to $83,999 3,140 578 785 463 679 227 17 307 55 25 4
$84,000 to $95,999 2,855 524 1,284 442 378 64 5 111 22 21 4
$96,000 to $107,999 1,821 535 819 171 191 40 5 40 8 2 10
$108,000 to $131,999 2,044 806 846 167 159 26 10 21 2 3 4
$132,000 to $155,999 1,051 539 312 114 62 10 1 6 1 1 5
$156,000 to $234,999 1,496 740 490 206 45 5 0 9 0 1 0
$235,000 to $349,999 805 386 258 154 6 1 0 0 0 0 0
$350,000 to $499,999 350 196 91 62 0 1 0 0 0 0 0
$500,000 to $649,999 104 61 19 19 0 1 0 2 2 0 0
$650,000 to $749,999 41 27 8 4 2 0 0 0 0 0 0
$750,000 to $849,999 50 33 9 6 2 0 0 0 0 0 0
$850,000 to $899,999 10 7 1 2 0 0 0 0 0 0 0
$900,000 and over 41 30 5 5 0 1 0 0 0 0 0
1Includes job holders in all establishments.
2There were 1,153 responses for which income was not stated.
14

Table 20
Bermudians and Other non-Bermudians in Selected Occupations and Percentage of Jobs Filled by Other non-Bermudians, 2019
% Jobs Filled
Total Other Non- by Other Non-
Selected Occupations Jobs1
Bermudians Bermudians2
Bermudians
Chef de Partie/Cook 721 118 583 81
Waiter/Waitress General 749 237 478 64
Finance (Insurance Banking Accounting) - Manager 692 294 338 49
Nurse Registered 541 128 332 61
Accountant I 547 174 330 60
Director and Chief Executive 567 245 237 42
Mason 396 118 234 59
Landscape Gardener 394 106 229 58
Cleaner/Houseperson 782 481 193 25
Accountant II 292 106 173 59
Actuary 208 34 166 80
Managers N.E.C. 801 540 165 21
Finance (Insurance Banking Accounting) - Sub-Manager 403 212 159 39
Secondary Education Teaching Professional 284 125 131 46
Underwriter 440 264 128 29
Beautician 195 53 121 62
Commis de Cuisine/Assistant Cook 164 41 115 70
Nursemaid/Nanny 140 20 113 81
Housekeeper (Private Service) 198 53 108 55
Lawyer 347 214 99 29
Accountant Ill 245 137 92 38
Physician 185 76 89 48
Sous Chef/Second Chef 107 17 89 83
Finance (Insurance Banking Accounting) - General Manager 194 75 86 44
Building Construction Labourer 302 203 78 26
Police Officer/Detective 296 205 72 24
Carpenter and Joiner 209 127 72 34
Other Professional Technical and Related N.E.C. 419 314 70 17
Captain Head/Waiter 87 15 68 78
Kitchen Assistant 269 183 63 23
General Managers N.E.C. 233 150 59 25
Executive Chef/Head Cook 99 28 58 59
Home-based Personal Care Worker 85 18 58 68
Motor Vehicle Mechanic 160 93 57 36
Broker 122 51 56 46
Butcher/Fish Butcher 68 9 56 82
Supervisor / Foreman N.E.C. 332 259 53 16
Barber Hairdresser 182 102 51 28
Sub-Managers N.E.C. 280 208 48 17
Marketing and Sales - Manager 298 220 46 15
Waiter/Chef de Rang 69 23 45 65
Refrigeration and Air Conditioning Plant Installer and Mechanic 145 96 45 31
Baker/Mixer 54 10 41 76
Pharmacist 61 16 39 64
Production / Operations - Manager 216 158 38 18
Gardener (General) 120 55 36 30
Marketing and Sales - Sub-Manager 140 90 35 25
Auditor Internal 67 30 35 52
Computer Professional N.E.C. 99 61 34 34
Primary Education Teaching Professional 407 340 34 8
Food and Beverage (Catering) - Sub-Manager 67 28 33 49
15

Table 20 cont.
Bermudians and Other non-Bermudians in Selected Occupations and Percentage of Jobs Filled by Other non-Bermudians, 2019
% Jobs Filled
Total Other Non- by Other Non-
Selected Occupations Jobs 1
Bermudians Bermudians 2
Bermudians
Consultant Business (General) 164 112 33 20
Maitre D’/Room Manager 58 22 33 57
Farm Worker (General) 41 7 33 80
Business Analyst 149 107 32 21
Plumber (General) 134 93 31 23
Food and Beverage (Catering) - Manager 86 46 30 35
Investment Officer 107 64 30 28
Tiler 43 11 30 70
Electrician (General) 164 127 30 18
Middle School Teacher 113 79 26 23
Compliance Officer 110 76 25 23
Drywaller 43 13 25 58
Autobody Worker 43 17 23 53
Supervisor Foreman (Construction) 127 94 20 16
Radiological Technologist 59 32 20 34
Machinery/Maintenance Mechanic 94 67 20 21
Medical Laboratory Technologist 42 22 19 45
Specialist Economist/Securities Analyst 54 29 19 35
Software Engineer / Developer / Application programmer 29 6 19 66
Legal Secretary 118 90 19 16
General Administration / Personnel - General Manager 339 291 18 5
Legal Clerk 170 139 18 11
Motorcycle Mechanic 44 24 18 41
Statistical and Mathematical Technician 43 23 17 40
Biological Technician/Public Health Analyst 44 27 17 39
Minister of Religion/Chaplain/Nun/Priest/Pastor 75 54 17 23
Underwater Worker/Diver 31 14 17 55
Marketing and Sales - General Manager 67 41 16 24
General Administration / Personnel - Manager 308 265 16 5
Computer Programmer / Analyst 68 48 16 24
Dental Hygienist (Oral) 40 19 16 40
Technical Salesperson 171 141 16 9
Fitness Instructor/Physical Trainer 59 31 16 27
Software Engineer / Computer Science Designer 28 9 15 54
Special Education Teacher 66 47 15 23
Child-Care Worker 33 17 15 45
Janitor/Caretaker 146 111 15 10
Other Teaching Professionals N.E.C. 93 75 14 15
Executive Secretary/Personal Assistant 669 603 14 2
Nursing Aide (includes Orderly) 478 421 14 3
Semi-skilled Construction Labourer 270 235 14 5
Data Processing / Information Technology - General Manager 37 19 13 35
Physiotherapist 43 20 13 30
Machinery Fitter and Assembler Mechanic N.E.C. 91 75 13 14
Corporate / Legal - Manager 41 25 12 29
Meteorologist 25 13 12 48
16
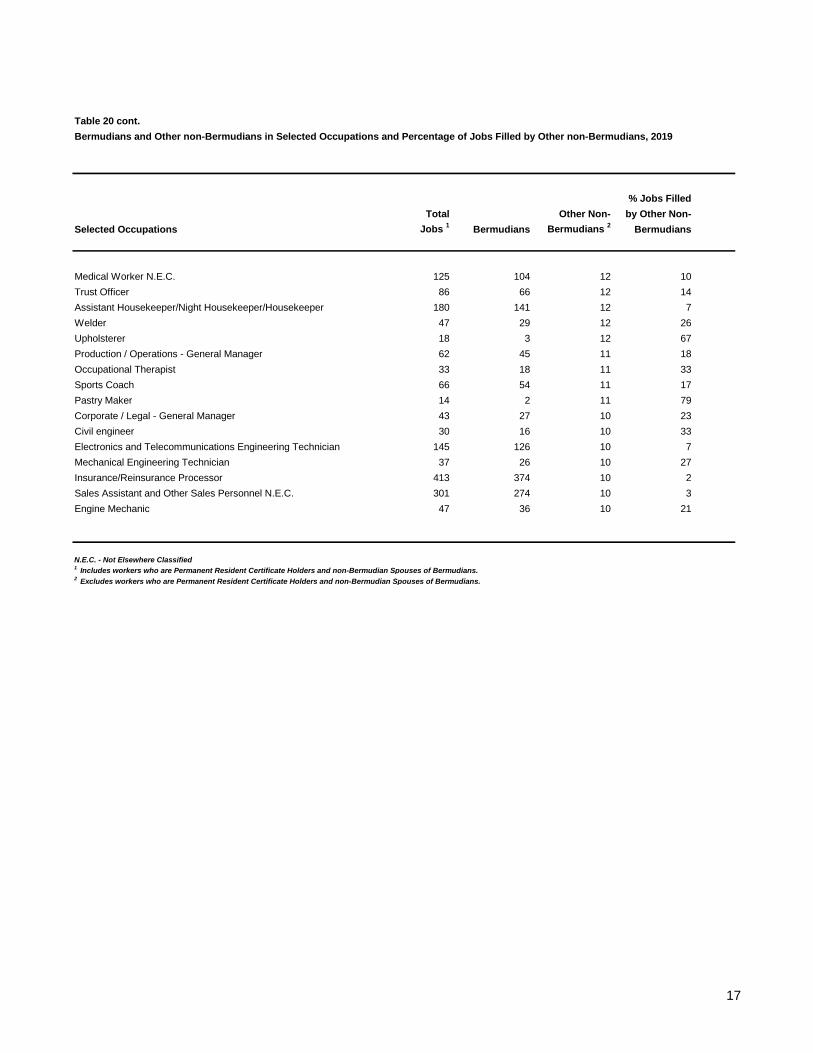
Table 20 cont.
Bermudians and Other non-Bermudians in Selected Occupations and Percentage of Jobs Filled by Other non-Bermudians, 2019
% Jobs Filled
Total Other Non- by Other Non-
Selected Occupations Jobs 1
Bermudians Bermudians 2
Bermudians
Medical Worker N.E.C. 125 104 12 10
Trust Officer 86 66 12 14
Assistant Housekeeper/Night Housekeeper/Housekeeper 180 141 12 7
Welder 47 29 12 26
Upholsterer 18 3 12 67
Production / Operations - General Manager 62 45 11 18
Occupational Therapist 33 18 11 33
Sports Coach 66 54 11 17
Pastry Maker 14 2 11 79
Corporate / Legal - General Manager 43 27 10 23
Civil engineer 30 16 10 33
Electronics and Telecommunications Engineering Technician 145 126 10 7
Mechanical Engineering Technician 37 26 10 27
Insurance/Reinsurance Processor 413 374 10 2
Sales Assistant and Other Sales Personnel N.E.C. 301 274 10 3
Engine Mechanic 47 36 10 21
N.E.C. - Not Elsewhere Classified 1 Includes workers who are Permanent Resident Certificate Holders and non-Bermudian Spouses of Bermudians.
2 Excludes workers who are Permanent Resident Certificate Holders and non-Bermudian Spouses of Bermudians.
17

Table 21
Labour Market Indicators by Sex and Bermudian Status, 2019
Sex and Labour Market Indicators Total Bermudian
Non-
Bermudian
Spouse of
Bermudian
Other non-
Bermudian
Permanent
Resident
Certificate
Holder
Total Filled Positions 34,378 23,841 1,907 7,894 736
Male 17,527 10,981 849 5,259 438
Female 16,851 12,860 1,058 2,635 298
Median Age of Job Holder (Years)
Total 46 48 47 42 56
Male 47 48 48 43 57
Female 46 48 46 40 55
Average Weekly Hours Worked
Total 37 35 37 42 36
Male 39 37 40 44 38
Female 34 33 35 38 32
Median Annual Gross Earnings ($)1
Total 62,693 60,112 73,220 74,587 65,531
Male 60,231 58,465 72,960 66,399 68,327
Female 65,398 62,305 73,412 83,700 58,313
1 Includes job holders in all establishments.
Bermudian Status
18

Table 22
Summer Students by Major Division of Economic Activity and Race, 2019
Major Division of Economic Activity Total Black WhiteMixed / Other
Races
Total 507 308 139 60
Agriculture, Forestry, Fisheries, Mining & Quarrying 3 1 2 0
Manufacturing 11 7 4 0
Electricity, Gas & Water 7 6 0 1
Construction 13 5 6 2
Wholesale Trade & Motor Vehicles 26 20 5 1
Retail Trade & Repair Services 103 62 22 19
Hotels 76 67 7 2
Restaurant, Cafes & Bars 60 42 9 9
Transport & Communications 14 10 4 0
Financial Intermediation 4 3 0 1
Real Estate & Renting Services 13 5 5 3
Business Services 56 15 36 5
Public Administration 24 14 9 1
Education, Health & Social Work 38 30 5 3
Other Community, Social & Personal Services 44 13 19 12
International Business Activity 15 8 6 1
19

Table 23
Bermudians in Twenty Lowest Paid Occupations who Worked Thirty-Five Hours or More
per Week in Twenty Lowest Paid Occupations by Median Gross Annual Income, 2019
Median Gross
Specific Occupations Annual Income1
Nursery Nurse $21,000
Orchestra and Band Conductor $21,000
Floral Arranger $21,000
Wine Steward/Sommelier/Wine Waiter/Bar Waiter $21,000
Wood Furniture Finisher $21,000
Lathe Setter/Fitter/Turner $21,000
Jewellery Repairer $21,000
Musical Instrument Tuner/Repairer $21,000
Woodworking Machine Operator $21,000
Textile Products Assembler $21,000
Dry-cleaning Machinery Operator $21,000
Driving Instructor $21,000
Lifeguard $21,600
Sound Equipment Operator $23,250
Assistant Housekeeper/Night Housekeeper/Housekeeper $24,176
Waiter/Waitress General $24,375
Chambermaid and/or Night Maid $24,409
Social Hostess/Social Director $24,750
Performing Arts Director/Producer (General) Actor Film/stage Director $25,500
Commercial Fisherperson/Charter Fisherperson $25,500
1 Includes job holders in all establishments with job holders who normally work 35 hours or more per week.
20

Table 24
Other non-Bermudians in Twenty Lowest Paid Occupations who Worked
Thirty-Five Hours or More Per Week by Median Gross Annual Income, 2019
Median Gross
Specific Occupations Annual Income1
Reading Resource— Primary School $21,000
Aircraft Pilot $21,000
Senior Bookkeeper/Night Auditor $21,000
Cashier $21,000
Chambermaid and/or Night Maid $21,000
Bus Person /Commis Waiter $21,000
Bar Person/Bartender/Bar Steward $21,000
Lifeguard $21,000
Livestock Worker $21,000
Assistant Housekeeper/Night Housekeeper/Housekeeper $24,000
Building Construction Labourer $26,040
Light Truck / Van Driver (includes Ambulance) $30,000
Housekeeper (Private Service) $31,350
Personal Care and Related Worker N.E.C. $31,500
Publicity Writer $33,000
Dolphin Apprentice Trainer - Level 1 $33,000
Butler $33,000
Salesperson $33,000
Boat Builder $33,000
Building Structure Cleaner $33,000
N.E.C. - Not Elsewhere Classified 1 Includes job holders in all establishments with job holders who normally work 35 hours or more per week.
21

Detailed Tabulations

Table 1
Filled Jobs by Major Division of Economic Activity and Major Occupational Group - Males, 2019
Service
Workers & Skilled Craft & Plant
Major Senior Technicians Shop & Agricultural Related Machine
Division of Officials & Associate Market Sales & Fishery Trades Operators & Elementary Armed
Economic Activity Total & Managers Professionals Professionals Clerks Workers Workers Workers Assemblers Occupations Forces
Total 17,527 3,549 2,395 1,639 762 3,669 744 2,626 1,207 909 27
Agriculture, Forestry, Fisheries, Mining & Quarrying 517 25 9 0 4 1 452 19 4 3 0
Manufacturing 374 71 30 7 12 20 0 195 27 12 0
Electricity, Gas & Water 252 33 19 19 21 3 0 87 56 14 0
Construction 2,084 301 49 51 25 10 39 1,231 91 287 0
Wholesale Trade & Motor Vehicles 1,056 226 8 79 57 99 4 233 231 119 0
Retail Trade & Repair Services 1,204 364 64 81 125 259 1 160 69 81 0
Hotels 1,402 143 15 24 40 964 55 95 58 8 0
Restaurant, Cafes & Bars 1,445 182 13 7 16 1,182 2 27 8 8 0
Transport & Communications 1,288 175 57 180 184 23 4 162 458 45 0
Financial Intermediation 700 332 187 82 76 19 1 3 0 0 0
Real Estate & Renting Services 282 75 11 63 11 25 21 47 7 22 0
Business Services 1,755 486 491 148 31 442 11 90 20 36 0
Public Administration 1,881 266 321 378 39 275 74 179 95 227 27
Education, Health & Social Work 882 96 455 42 36 158 6 46 26 17 0
Other Community, Social & Personal Services 652 96 106 64 10 182 68 47 57 22 0
International Business Activity 1,753 678 560 414 75 7 6 5 0 8 0
Major Occupational Group
22

Table 2
Filled Jobs by Major Division of Economic Activity and Major Occupational Group - Females, 2019
Service
Workers & Skilled Craft & Plant
Major Senior Technicians Shop & Agricultural Related Machine
Division of Officials & Associate Market Sales & Fishery Trades Operators & Elementary Armed
Economic Activity Total & Managers Professionals Professionals Clerks Workers Workers Workers Assemblers Occupations Forces
Total 16,851 2,905 4,119 1,218 4,292 3,758 27 188 234 109 1
Agriculture, Forestry, Fisheries, Mining & Quarrying 47 16 2 4 14 1 10 0 0 0 0
Manufacturing 147 35 9 8 32 24 0 34 4 1 0
Electricity, Gas & Water 43 8 4 5 22 3 0 0 1 0 0
Construction 137 39 8 3 55 22 0 5 1 4 0
Wholesale Trade & Motor Vehicles 413 89 13 49 154 70 0 1 18 19 0
Retail Trade & Repair Services 1,518 280 74 81 479 522 0 40 8 34 0
Hotels 1,132 156 27 8 187 688 2 5 59 0 0
Restaurant, Cafes & Bars 710 86 9 3 102 488 0 16 2 4 0
Transport & Communications 624 71 43 55 327 36 0 5 84 3 0
Financial Intermediation 1,522 461 302 93 637 28 0 1 0 0 0
Real Estate & Renting Services 209 44 15 74 51 23 1 0 1 0 0
Business Services 1,889 411 454 98 486 399 0 21 4 16 0
Public Administration 2,083 244 934 252 426 185 7 1 17 16 1
Education, Health & Social Work 2,951 307 1,507 140 436 480 6 49 25 1 0
Other Community, Social & Personal Services 1,254 113 114 72 150 773 1 10 10 11 0
International Business Activity 2,172 545 604 273 734 16 0 0 0 0 0
Major Occupational Group
23

Table 3
Filled Jobs by Minor Division of Economic Activity and Bermudian Status of Job Holders, 2019
Permanent
Non-Bermudian Other Resident
Spouse of non- Certificate
Minor Division of Economic Activity Total Bermudian Bermudian Bermudian Holder
Total 34,378 23,841 1,907 7,894 736
Agriculture 499 177 25 268 29
Forestry 0 0 0 0 0
Fishing 65 63 2 0 0
Mining of coal, extraction of petroleum natural gas and mining of ores 0 0 0 0 0
Other mining and quarrying, n.e.c. 0 0 0 0 0
Manufacture of food, beverage and tobacco 78 46 2 29 1
Manufacture of textiles, wearing apparel, leather including footwear 15 5 2 7 1
Manufacture of wood and products of wood and cork, except furniture 10 5 1 4 0
Manufacture of paper and paper products publishing, printing and reproduction of recorded media 133 95 8 29 1
Manufacture of coke, refined petroleum products and nuclear fuel, chemicals and chemical products,
rubber and plastic products 25 22 2 0 1
Manufacture of other non-metallic mineral products 77 73 3 1 0
Manufacture of metals, fabricated metal products, machinery and equipment, including transport
equipment 111 90 4 15 2
Manufacture of furniture 62 38 3 19 2
Manufacture, n.e.c.; recycling 10 7 1 2 0
Electricity, gas, steam and hot water supply 235 215 5 15 0
Water 60 58 2 0 0
Construction 2,221 1,348 146 676 51
Sale, maintenance and repair of motor vehicles and motorcycles; retail sale of automotive fuel 696 544 30 109 13
Wholesale trade and commission trade, except of motor vehicle and motorcycles 773 702 49 16 6
Retail trade, except of motor vehicles and motorcycles, repair of personal and household goods 2,722 2,194 166 324 38
Hotels, guest houses and other accommodation 2,534 1,650 144 697 43
Restaurants, bars and canteens 2,155 938 71 1,114 32
Transport 1,272 1,200 18 43 11
Post and telecommunications 640 570 26 39 5
Financial intermediation, except insurance and pension funding 1,493 1,173 70 232 18
Insurance and pension funding, except compulsory social security 490 404 31 47 8
Activities auxiliary to financial intermediation 239 170 19 45 5
Real estate activities 379 323 28 19 9
Renting of machinery and equipment without operator, and of personal and household goods 112 94 2 15 1
Computer and related activities 199 122 8 65 4
Research and development 72 31 3 37 1
Legal, accounting, market research and business and management consultancy 1,901 1,017 95 734 55
Other business activities 1,472 1,000 94 294 84
Public administration 3,964 3,479 133 339 13
Education 892 624 91 160 17
Health 2,501 1,654 219 581 47
Social Work 440 378 29 27 6
Sewage and refuse disposal; sanitation and similar activities 39 32 2 4 1
Recreational, cultural and sporting activities 913 751 47 104 11
Other service activities 446 261 41 135 9
Activities of private households as employers of domestic staff 483 109 18 307 49
Extra-Territorial organizations and bodies 25 19 1 4 1
Financial and insurance activities of IBEs 3,576 1,957 247 1,230 142
Non-financial activities of IBEs 340 199 19 105 17
International business activities, n.e.c. 9 4 0 3 2
IBE - International Business Entities
Bermudian Status
24

Table 4
Filled Jobs by Minor Division of Economic Activity and Bermudian Status of Job Holders - Males, 2019
Permanent
Non-Bermudian Other Resident
Spouse of non- Certificate
Minor Division of Economic Activity Total Bermudian Bermudian Bermudian Holder
Total 17,527 10,981 849 5,259 438
Agriculture 453 140 19 266 28
Forestry 0 0 0 0 0
Fishing 64 62 2 0 0
Mining of coal, extraction of petroleum natural gas and mining of ores 0 0 0 0 0
Other mining and quarrying, n.e.c. 0 0 0 0 0
Manufacture of food, beverage and tobacco 47 20 1 26 0
Manufacture of textiles, wearing apparel, leather including footwear 12 3 2 6 1
Manufacture of wood and products of wood and cork, except furniture, and articles of straw and 9 4 1 4 0
plaiting materials 72 42 6 23 1
Manufacture of paper and paper products publishing, printing and reproduction of recorded 18 16 1 0 1
media 63 59 3 1 0
Manufacture of coke, refined petroleum products and nuclear fuel, chemicals and chemical 98 79 3 15 1
products, rubber and plastic products 49 26 2 19 2
Manufacture of other non-metallic mineral products 6 3 1 2 0
Manufacture of metals, fabricated metal products, machinery and equipment, including 201 186 2 13 0
transport equipment 51 50 1 0 0
Manufacture of furniture 2,084 1,236 140 659 49
Manufacture, n.e.c.; recycling 517 376 25 106 10
Electricity, gas, steam and hot water supply 539 480 38 16 5
Water 1,204 870 61 255 18
Construction 1,402 790 59 522 31
Sale, maintenance and repair of motor vehicles and motorcycles; retail sale of automotive fuel 1,445 471 34 917 23
Wholesale trade and commission trade, except of motor vehicle and motorcycles 916 864 13 31 8
Retail trade, except of motor vehicles and motorcycles, repair of personal and household 372 320 18 32 2
goods 466 286 27 147 6
Hotels, guest houses and other accommodation 154 109 17 24 4
Restaurants, bars and canteens 80 46 5 26 3
Transport 193 167 9 11 6
Post and telecommunications 89 71 2 15 1
Financial intermediation, except insurance and pension funding 157 98 5 53 1
Insurance and pension funding, except compulsory social security 34 13 1 19 1
Activities auxiliary to financial intermediation 759 304 29 396 30
Real estate activities 805 517 43 194 51
Renting of machinery and equipment without operator, and of personal and household goods 1,881 1,600 64 208 9
Computer and related activities 192 117 21 49 5
Research and development 627 412 45 161 9
Legal, accounting, market research and business and management consultancy 63 51 6 5 1
Other business activities 30 23 2 4 1
Public administration 407 341 10 50 6
Education 137 92 9 34 2
Health 65 21 4 29 11
Social Work 13 9 1 2 1
Sewage and refuse disposal; sanitation and similar activities 1,621 561 107 857 96
Recreational, cultural and sporting activities 127 44 10 61 12
Other service activities 5 2 0 1 2
IBE - International Business Entities
Bermudian Status
25

Table 5
Filled Jobs by Minor Division of Economic Activity and Bermudian Status of Job Holders - Females, 2019
Permanent
Non-Bermudian Other Resident
Spouse of non- Certificate
Minor Division of Economic Activity Total Bermudian Bermudian Bermudian Holder
Total 16,851 12,860 1,058 2,635 298
Agriculture 46 37 6 2 1
Forestry 0 0 0 0 0
Fishing 1 1 0 0 0
Mining of coal, extraction of petroleum natural gas and mining of ores 0 0 0 0 0
Other mining and quarrying, n.e.c. 0 0 0 0 0
Manufacture of food, beverage and tobacco 31 26 1 3 1
Manufacture of textiles, wearing apparel, leather products including footwear 3 2 0 1 0
Manufacture of wood and products of wood and cork, except furniture, and articles of straw and
plaiting materials 1 1 0 0 0
Manufacture of paper and paper products publishing, printing and reproduction of recorded media 61 53 2 6 0
Manufacture of coke, refined petroleum products and nuclear fuel, chemicals and chemical
products, rubber and plastic products 7 6 1 0 0
Manufacture of other non-metallic mineral products 14 14 0 0 0
Manufacture of metals, fabricated metal products, machinery and equipment, including transport
equipment 13 11 1 0 1
Manufacture of furniture 13 12 1 0 0
Manufacture, n.e.c.; recycling 4 4 0 0 0
Electricity, gas, steam and hot water supply 34 29 3 2 0
Water 9 8 1 0 0
Construction 137 112 6 17 2
Sale, maintenance and repair of motor vehicles and motorcycles; retail sale of automotive fuel 179 168 5 3 3
Wholesale trade and commission trade, except of motor vehicle and motorcycles 234 222 11 0 1
Retail trade, except of motor vehicles and motorcycles, repair of personal and household goods 1,518 1,324 105 69 20
Hotels, guest houses and other accommodation 1,132 860 85 175 12
Restaurants, bars and canteens 710 467 37 197 9
Transport 356 336 5 12 3
Post and telecommunications 268 250 8 7 3
Financial intermediation, except insurance and pension funding 1,027 887 43 85 12
Insurance and pension funding, except compulsory social security 336 295 14 23 4
Activities auxiliary to financial intermediation 159 124 14 19 2
Real estate activities 186 156 19 8 3
Renting of machinery and equipment without operator, and of personal and household goods 23 23 0 0 0
Computer and related activities 42 24 3 12 3
Research and development 38 18 2 18 0
Legal, accounting, market research and business and management consultancy 1,142 713 66 338 25
Other business activities 667 483 51 100 33
Public administration 2,083 1,879 69 131 4
Education 700 507 70 111 12
Health 1,874 1,242 174 420 38
Social Work 377 327 23 22 5
Sewage and refuse disposal; sanitation and similar activities 9 9 0 0 0
Recreational, cultural and sporting activities 506 410 37 54 5
Other service activities 309 169 32 101 7
Activities of private households as employers of domestic staff 418 88 14 278 38
Extra-Territorial organizations and bodies 12 10 0 2 0
Financial and insurance activities of IBEs 1,955 1,396 140 373 46
Non-financial activities of IBEs 213 155 9 44 5
International business activities, n.e.c. 4 2 0 2 0
IBE - International Business Entities
Bermudian Status
26

Table 6.1
Filled Jobs by Specific Occupation and Bermudian Status of Job Holders within the Senior Officials and Managers
Occupational Group, 2019
Permanent
Non-Bermudian Other Resident
Spouse of non- Certificate
Specific Occupation Total Bermudian Bermudian Bermudian Holder
Total 6,454 4,256 435 1,564 199
GOVERNMENT EXECUTIVE OFFICIALS
Government executive official 34 32 0 2 0
Government administrator 54 47 1 6 0
DIRECTORS AND CHIEF EXECUTIVES
Director and chief executive 567 245 40 237 45
SUPERVISORS
Supervisor, Production foreman (general foreman) 45 33 1 9 2
Supervisor foreman (construction) 127 94 9 20 4
Supervisor foreman (Mechanic) 34 27 1 5 1
Supervisor (Statistical work) 2 2 0 0 0
Supervisor (warehouse) 91 85 4 1 1
Supervisor (Clerical) 72 65 3 4 0
Supervisor (Sales) 125 115 2 2 6
Compliance officer 110 76 7 25 2
Supervisor / Foreman, N.E.C. 332 259 12 53 8
GENERAL MANAGERS
General administration / Personnel (General Manager) 339 291 24 18 6
Corporate / Legal (General Manager) 43 27 6 10 0
Data processing / Information technology (General Manager) 37 19 1 13 4
Finance (Insurance, Banking, Accounting) (General Manager) 194 75 17 86 16
Engineering (Including maintenance) (General Manager) 25 16 2 6 1
Marketing and sales (General Manager) 67 41 9 16 1
Food and beverage (catering) (General Manager) 28 16 1 8 3
Production / Operations (General Manager) 62 45 5 11 1
Public relations (General Manager) 2 2 0 0 0
General managers not elsewhere classified, N.E.C. (General Manager) 233 150 15 59 9
MANAGERS
General administration / Personnel (Manager) 308 265 21 16 6
Corporate / Legal (Manager) 41 25 4 12 0
Data processing / Information technology (Manager) 54 40 5 9 0
Finance (Insurance, Banking, Accounting) (Manager) 692 294 35 338 25
Engineering (Including maintenance) (Manager) 110 92 5 9 4
Marketing and sales (Manager) 298 220 26 46 6
Food and beverage (catering) (Manager) 86 46 9 30 1
Production / Operations (Manager) 216 158 18 38 2
Public relations (Manager) 46 36 2 8 0
General managers not elsewhere classified, N.E.C. (Manager) 801 540 71 165 25
Bermudian Status
27

Table 6.1 cont.
Filled Jobs by Specific Occupation and Bermudian Status of Job Holders within the Senior Officials and Managers
Occupational Group, 2019
Permanent
Non-Bermudian Other Resident
Spouse of non- Certificate
Specific Occupation Total Bermudian Bermudian Bermudian Holder
SUB-MANAGERS
General administration / Personnel (Sub-Manager) 128 108 11 8 1
Corporate / Legal (Sub-Manager) 27 17 4 6 0
Data processing / Information technology (Sub-Manager) 25 22 0 2 1
Finance (Insurance, Banking, Accounting) (Sub-Manager) 403 212 25 159 7
Engineering (Including maintenance) (Sub-Manager) 53 41 0 8 4
Marketing and sales (Sub-Manager) 140 90 14 35 1
Food and beverage (catering) (Sub-Manager) 67 28 4 33 2
Production / Operations (Sub-Manager) 46 42 1 3 0
Public relations (Sub-Manager) 10 10 0 0 0
General managers not elsewhere classified, N.E.C. 280 208 20 48 4
Bermudian Status
28

Table 6.2
Filled Jobs by Specific Occupation and Bermudian Status of Job Holders within the Professionals Occupational Group, 2019
Permanent
Non-Bermudian Other Resident
Spouse of non- Certificate
Specific Occupation Total Bermudian Bermudian Bermudian Holder
Total 6,514 3,827 441 2,140 106
PHYSICISTS, CHEMISTS AND RELATED PROFESSIONALS
Physicist (General) 0 0 0 0 0
Physicist and astronomer 1 0 0 1 0
Meteorologist 25 13 0 12 0
Chemist (General) 2 1 1 0 0
Analytical chemist 1 1 0 0 0
Geologist and geophysicist 0 0 0 0 0
Physical science technician 0 0 0 0 0
MATHEMATICIANS, STATISTICIAN AND RELATED PROFESSIONALS
Statistical and mathematical technician 43 23 1 17 2
Statistician 3 2 0 1 0
COMPUTING PROFESSIONALS
Computer programmer / Analyst 68 48 3 16 1
Computer programmer 36 21 5 9 1
Software engineer / Computer science designer 28 9 3 15 1
Computing professional, N.E.C. 99 61 3 34 1
ARCHITECTS AND RELATED PROFESSIONALS
Architect 30 22 3 3 2
Telecommunication network architect 0 0 0 0 0
Town planner / Traffic planner 12 8 0 4 0
Land surveyor 13 11 0 2 0
Building surveyor 4 4 0 0 0
Estates surveyor 15 7 1 7 0
Quantity surveyor 13 6 1 5 1
Cartographical draughts person 1 1 0 0 0
Architects (landscaper) 3 2 0 1 0
ENGINEERS AND RELATED PROFESSIONALS
Civil engineer 30 16 3 10 1
Mechanical engineer 18 15 0 3 0
Chemical engineer 1 1 0 0 0
Metallurgist 0 0 0 0 0
Mining engineer 0 0 0 0 0
Organisation and methods officer 4 4 0 0 0
Mechanical engineer, N.E.C. 10 5 2 2 1
ELECTRICAL AND ELECTRONIC ENGINEERS
Electrical engineer (General) 28 17 1 9 1
Electronic engineer (General) 4 3 0 0 1
Electrical engineer (Power distribution and transmission) 10 5 0 5 0
Electrical engineer (Power generation) 3 3 0 0 0
Telecommunications engineer 13 5 1 7 0
Wireless RF / Field engineer 2 2 0 0 0
LIFE SCIENCE PROFESSIONALS
Biologist, botanist, Zoologist and related Professional 19 7 2 9 1
Plant pathologist, medical pathologist, pharmacologist and related 2 2 0 0 0
Agronomist 0 0 0 0 0
Horticulturalist 12 11 1 0 0
Biological technician / Public health analyst 44 27 0 17 0
Medical laboratory technologist 42 22 0 19 1
Biochemist 0 0 0 0 0
Bermudian Status
29

Table 6.2 cont.
Filled Jobs by Specific Occupation and Bermudian Status of Job Holders within the Professionals Occupational Group, 2019
Permanent
Non-Bermudian Other Resident
Spouse of non- Certificate
Specific Occupation Total Bermudian Bermudian Bermudian Holder
HEALTH PROFESSIONALS (Except nursing)
Physician 185 76 17 89 3
Surgeon 12 4 3 5 0
Dentist 33 23 4 5 1
Veterinarian 16 10 0 6 0
Pharmacist 61 16 6 39 0
Public health nutritionist 4 3 1 0 0
Medical worker, N.E.C. 125 104 6 12 3
MEDICAL TECHNOLOGIST AND THERAPISTS
Nuclear medical technologist 1 0 0 1 0
Radiological technologist 59 32 6 20 1
Radiologist 4 0 1 3 0
Physiotherapist 43 20 10 13 0
Occupational therapist 33 18 4 11 0
Osteopath 0 0 0 0 0
Chiropractor 10 3 2 5 0
NURSING AND MIDWIFERY PROFESSIONALS
Chief nursing officer 3 1 0 2 0
Nurse, Registered 541 128 65 332 16
District nurse 25 15 5 4 1
Enrolled nurse 15 11 1 1 2
Professional midwife 1 1 0 0 0
Other Health Professional, N.E.C 10 7 0 3 0
COLLEGE, UNIVERSITY AND HIGHER EDUCATION
TEACHING PROFESSIONALS
College, university and higher education teaching professional 43 38 2 3 0
SECONDARY EDUCATION TEACHING PROFESSIONALS
Secondary education teaching professional 284 125 24 131 4
Vocational instructor 4 4 0 0 0
Middle school teacher 113 79 7 26 1
PRIMARY AND PRE-PRIMARY EDUCATION TEACHING PROFESSIONALS
Primary education teaching professional 407 340 32 34 1
Reading resource - Primary school 6 4 0 1 1
Pre-primary education teaching professional 144 126 9 7 2
Teacher's aide / pre-school paraprofessional 159 148 9 2 0
SPECIAL EDUCATION TEACHING PROFESSIONALS
Special education teacher 66 47 3 15 1
Speech correction teacher 18 13 1 4 0
OTHER TEACHING PROFESSIONALS
Education methods specialist 0 0 0 0 0
Education officer 23 21 2 0 0
School inspector 0 0 0 0 0
Principal 46 38 1 7 0
Home visitor 16 14 2 0 0
Vocational guidance counsellor / School counsellor 46 37 7 2 0
Other teaching professionals, N.E.C. 93 75 2 14 2
Bermudian Status
30

Table 6.2 cont.
Filled Jobs by Specific Occupation and Bermudian Status of Job Holders within the Professionals Occupational Group, 2019
Permanent
Non-Bermudian Other Resident
Spouse of non- Certificate
Specific Occupation Total Bermudian Bermudian Bermudian Holder
BUSINESS PROFESSIONAL
Accountant I 547 174 25 330 18
Accountant II 292 106 10 173 3
Accountant III 245 137 15 92 1
Auditor, internal 67 30 2 35 0
Actuary 208 34 5 166 3
Specialist economist / Securities analyst 54 29 4 19 2
Market controller analyst 15 7 2 5 1
Business analyst 149 107 9 32 1
Other professional, technical and related, N.E.C. 419 314 30 70 5
LEGAL PROFESSIONALS
Lawyer 347 214 21 99 13
Judge 14 14 0 0 0
Notary, Notary public 0 0 0 0 0
Legal executive 21 18 0 3 0
ARCHIVISTS, LIBRARIANS
Librarian 17 14 1 2 0
Archivist / Conservator 2 2 0 0 0
Art gallery and museum curator 14 12 2 0 0
INFORMATION PROFESSIONALS
Author / Writer 0 0 0 0 0
Journalist / Reporter 19 9 3 7 0
Documentalist 1 1 0 0 0
Sub-editor / Editor 11 5 2 4 0
Advertising copywriter 1 1 0 0 0
Public relations officer / Publicity agent 31 29 1 1 0
Publicity writer 4 2 0 2 0
Technical writer 1 1 0 0 0
SOCIAL SCIENCE AND RELATED PROFESSIONALS
Economist (General) 1 1 0 0 0
Sociologist, anthropologist and related professional 0 0 0 0 0
Philosopher, historian and political scientist 0 0 0 0 0
Philologist, translator and interpreter 0 0 0 0 0
Psychologist 32 25 2 5 0
Other sociologist, anthropologist, and related workers, N.E.C. 2 2 0 0 0
SOCIAL WORK PROFESSIONALS
Social worker (General) 39 36 3 0 0
Social worker / Social assistant worker 28 26 2 0 0
Social worker / Residential care worker / Welfare worker 33 32 1 0 0
Youth co-coordinator / Youth leader 36 33 2 1 0
Social worker / Delinquency worker 51 47 3 1 0
Nursery nurse 5 4 1 0 0
Child care assistant 15 14 0 1 0
Personnel specialist 98 87 6 5 0
Job analyst 33 24 0 8 1
Bermudian Status
31

Table 6.2 cont.
Filled Jobs by Specific Occupation and Bermudian Status of Job Holders within the Professionals Occupational Group, 2019
Permanent
Non-Bermudian Other Resident
Spouse of non- Certificate
Specific Occupation Total Bermudian Bermudian Bermudian Holder
CREATIVE OR PERFORMING ARTIST
Sculptor 0 0 0 0 0
Artist (General / Painter) 10 9 1 0 0
Printing engraver and etcher 0 0 0 0 0
Composer, musician and singer 21 15 3 3 0
Orchestra and band conductor 2 2 0 0 0
Choreographer and dancer 24 22 0 2 0
Performing arts director / Producer (general),actor, film / stage director 15 8 0 7 0
COMMERCIAL ARTISTS
Commercial artist 14 13 1 0 0
Interior decoration designer 41 33 2 5 1
Fashion / Product designer 5 4 1 0 0
Display artist 3 3 0 0 0
Floral arranger 15 3 3 8 1
Photographer / Cameraperson 31 29 1 1 0
RELIGIOUS PROFESSIONALS
Minister / Chaplain / Nun / Priest / Pastor 75 54 3 17 1
Religious worker 4 4 0 0 0
Theologian 0 0 0 0 0
ANIMAL TRAINERS
Dolphin Educator 0 0 0 0 0
Senior Dolphin Trainer - Level 3 1 1 0 0 0
Dolphin Supervisor / Trainer - Level 3 0 0 0 0 0
Dolphin Trainer - Level 2 3 0 0 3 0
Dolphin Apprentice Trainer - Level 1 5 1 0 4 0
SOFTWARE AND APPLICATION DEVELOPERS AND ANALYSTS
Systems Analyst 8 6 0 1 1
Software Engineer /Developer / Application programmer 29 6 4 19 0
Web and Multimedia Developer 6 5 1 0 0
Database Designer and Administration 6 4 0 2 0
Systems Administrator 22 19 2 1 0
IT Networking / Communications Analyst 34 29 4 1 0
Bermudian Status
32

Table 6.3
Filled Jobs by Specific Occupation and Bermudian Status of Job Holders within the Technicians and Associate Professionals
Occupational Group, 2019
Permanent
Non-Bermudian Other Resident
Spouse of non- Certificate
Specific Occupation Total Bermudian Bermudian Bermudian Holder
Total 2,857 2,126 178 500 53
PHYSICAL AND ENGINEERING SCIENCE TECHNICIANS
Town planning technician 1 1 0 0 0
Civil engineering technician 1 1 0 0 0
Electrical engineering technician 4 3 0 1 0
Electronics and telecommunications engineering technician 145 126 7 10 2
Mechanical engineering technician 37 26 1 10 0
Wireless install technician / Wireless installer 0 0 0 0 0
Architectural assistant / technician 25 14 1 9 1
Draughtsperson (General) 7 4 0 3 0
Surveyor's technician / Reference 6 6 0 0 0
OPTICAL AND ELECTRONIC EQUIPMENT OPERATORS
Radio and television transmitting equipment operator 6 6 0 0 0
Motion picture projectionist 1 1 0 0 0
Sound equipment operator 10 9 0 1 0
Computer equipment operator 5 4 0 1 0
SHIP CONTROLLERS AND TECHNICIANS
Ships' master (Sea going) 1 0 0 1 0
Tug / Tender pilot / Ships' master (coastal waters) 5 5 0 0 0
Ships' navigation officer (sea going) 0 0 0 0 0
Ship pilot / Branch pilot 9 8 0 1 0
Ferry pilot / Sightseeing and charter boat pilot 44 43 0 0 1
Marine superintendent 12 11 0 1 0
Marine engineer officer 8 8 0 0 0
AIRCRAFT CONTROLLERS AND TECHNICIANS
Aircraft pilot 1 0 0 1 0
Flight navigator 0 0 0 0 0
Flight engineer 0 0 0 0 0
Flying instructor 0 0 0 0 0
Air traffic controller 12 5 0 7 0
Air traffic safety technician 5 5 0 0 0
Flight operations officer 5 5 0 0 0
SAFETY AND QUALITY INSPECTORS
Clerk of works / Building inspectors 7 7 0 0 0
Health and safety inspector 39 34 1 4 0
Facilities manager 64 57 5 2 0
LIFE SCIENCE TECHNICIANS AND RELATED ASSOCIATE PROF
Life science technician 5 5 0 0 0
Agronomy and forestry technician 1 1 0 0 0
Farming and forestry 1 1 0 0 0
Bermudian Status
33

Table 6.3 cont.
Filled Jobs by Specific Occupation and Bermudian Status of Job Holders within the Technicians and Associate Professionals
Occupational Group, 2019
Permanent
Non-Bermudian Other Resident
Spouse of non- Certificate
Specific Occupation Total Bermudian Bermudian Bermudian Holder
MODERN HEALTH ASSOCIATE PROFESSIONALS (except nursing)
Medical assistant 20 12 6 2 0
Sanitarian 4 3 1 0 0
Dietician 12 4 1 7 0
Optometrist and optician 11 6 2 3 0
Dispensing optician 2 1 0 1 0
Dental assistant 38 27 4 7 0
Dental hygienist (oral) 40 19 3 16 2
Pharmaceutical assistant 23 20 2 1 0
TRADITIONAL MEDICINE PRACTITIONERS AND FAITH HEALERS
Traditional medicine practitioner 0 0 0 0 0
FINANCE AND SALES ASSOCIATE PROFESSIONALS
Insurance salesperson 19 18 1 0 0
Real estate salesperson / House agent 113 108 4 1 0
Technical salesperson 171 141 13 16 1
Technical service advisor 41 39 2 0 0
Buyer 49 41 4 3 1
Purchasing officer 34 27 4 3 0
Appraiser, valuer and auctioneer 8 3 0 5 0
BUSINESS SERVICES AGENTS AND TRADE BROKERS
Broker 122 51 7 56 8
Trust officer 86 66 5 12 3
Investment officer 107 64 8 30 5
Business services and advertising salesperson 38 26 4 8 0
Manufactures' agent 61 53 6 0 2
Consultant, business (general) 164 112 12 33 7
Underwriter 440 264 32 128 16
Pawnbroker and money lender 2 2 0 0 0
CUSTOMS, TAX AND RELATED GOVERNMENT ASSOCIATE PROFFESIONALS
Immigration inspector 11 11 0 0 0
Ship surveyor 3 1 0 2 0
Customs officer 170 170 0 0 0
POLICE INSPECTORS AND DETECTIVES
Police officer / Detective 296 205 19 72 0
Police cadet 9 9 0 0 0
Traffic warden 18 16 2 0 0
ARTISTIC, ENTERTAINMENT AND SPORTS ASSOCIATE PROFESSIONALS
Decorator and commercial designer 3 3 0 0 0
Radio, television and other announcer 15 12 1 2 0
Sports coach 66 54 1 11 0
Fitness instructor / Physical trainer 59 31 10 16 2
INFORMATION AND COMMUNICATION TECHNOLOGY OPERATIONS
AND USER SUPPORT TECHNICIANS
Information and Communications Technology Operations Technician 14 11 1 1 1
Information and Communications Technology User Support Technician 54 47 4 3 0
IT Networking and Systems Technician 63 50 4 8 1
Web Technician 0 0 0 0 0
TELECOMMUNICATIONS AND BROADCASTING TECHNICIANS
Broadcasting and Audiovisual Technician 4 3 0 1 0
Bermudian Status
34

Table 6.4
Filled Jobs by Specific Occupation and Bermudian Status of Job Holders within the Clerical Occupational Group, 2019
Permanent
Non-Bermudian Other Resident
Spouse of non- Certificate
Specific Occupation Total Bermudian Bermudian Bermudian Holder
Total 5,054 4,699 195 101 59
SECRETARIES AND KEYBOARD-OPERATING CLERKS
Executive secretary / Personal assistant 669 603 41 14 11
Senior secretary 167 157 6 1 3
Junior secretary 66 64 2 0 0
Legal secretary 118 90 9 19 0
Medical secretary 40 33 5 0 2
Shorthand / Speedwriting typist 1 1 0 0 0
Shorthand / Speedwriting typist with foreign language 0 0 0 0 0
Teletypist 1 1 0 0 0
Audio / Copy typist 0 0 0 0 0
NUMERICAL CLERKS
Senior bookkeeping / Night auditor 137 130 4 1 2
Junior bookkeeper 117 114 3 0 0
Finance clerk 279 261 8 6 4
Senior clerk 468 446 15 6 1
Junior clerk / Typist 210 200 8 0 2
Legal clerk 170 139 9 18 4
Insurance / Reinsurance processor 413 374 21 10 8
Data clerk (input) 71 68 1 1 1
MATERIAL - RECORDING AND TRANSPORT CLERKS
Clerk (warehouse / Storeroom) 252 241 9 2 0
Customs clerk 49 46 2 1 0
Meter reader (electrical) 8 8 0 0 0
Supervisor / Dispatcher road transport 37 36 1 0 0
Transport and communications supervisors 0 0 0 0 0
Telecommunications service supervisor 16 15 0 1 0
LIBRARY, MAIL AND RELATED WORKS
Postmaster 6 6 0 0 0
Postal supervisor 5 5 0 0 0
Mail sorting clerk 27 27 0 0 0
Postperson 42 42 0 0 0
Messenger, porter 72 68 2 2 0
Filing clerk 54 53 0 0 1
Records officer (archives) 6 6 0 0 0
CASHIERS, TELLERS AND RELATED CLERKS
Chief cashier 14 13 0 0 1
Cashier 580 564 8 2 6
Bank teller 112 94 7 6 5
Cash clerk 78 75 2 1 0
Debt-collecter and related worker 22 21 1 0 0
CLIENT INFORMATION CLERKS
Travel agency clerk 36 36 0 0 0
Airline passenger agent 79 77 1 0 1
Airline reservations / Ticket agent 4 4 0 0 0
Airline freight agent 71 70 0 1 0
Client information clerk 55 53 2 0 0
Receptionist 330 303 21 2 4
Hotel receptionist / Cashier 114 99 7 5 3
Telephone switchboard operators 52 52 0 0 0
Telegrapher 6 4 0 2 0
Bermudian Status
35

Table 6.5
Filled Jobs by Specific Occupation and Bermudian Status of Job Holders within the Service Workers, Shop and Market Sales
Workers Occupational Group, 2019
Permanent
Non-Bermudian Other Resident
Spouse of non- Certificate
Specific Occupation Total Bermudian Bermudian Bermudian Holder
Total 7,427 4,595 379 2,278 175
TRAVEL ATTENDANTS AND RELATED WORKERS
Sightseeing, travel, museum guide 49 48 0 0 1
Fishing guide 0 0 0 0 0
HOUSEKEEPING AND RELATED SERVICES
Executive housekeeper 22 12 1 8 1
Assistant housekeeper / Night housekeeper / Housekeeper 180 141 24 12 3
Housekeeper (private service) 198 53 13 108 24
Butler 4 0 1 3 0
Cleaner / Houseperson 782 481 36 193 72
Nursemaid / Nanny 140 20 4 113 3
Companion 15 9 0 6 0
Chambermaid and/or Night maid 172 148 23 1 0
COOKS
Executive chef / Head cook 99 28 9 58 4
Sous chef / second chef 107 17 1 89 0
Chef de partie / Cook 721 118 13 583 7
Commis de cuisine / Assistant cook 164 41 7 115 1
Cook (private service) 3 1 0 2 0
WAITER / WAITRESSES, BARTENDER, AND RELATED WORKERS
Waiter / waitress, general 749 237 25 478 9
Maitre D' / Room manager 58 22 2 33 1
Captain head / Waiter 87 15 3 68 1
Waiter / Chef de rang 69 23 0 45 1
Bus boy / Commis waiter 17 15 1 1 0
Barperson / Bartender / Bar steward 337 320 12 3 2
Wine steward / Sommelier / Wine waiter / Bar waiter 3 3 0 0 0
Bar porter 22 21 1 0 0
Kitchen Assistant 269 183 15 63 8
PERSONAL CARE AND RELATED WORKERS
Child-care worker 33 17 0 15 1
Institution-based personal care worker 3 2 0 1 0
Home-based personal care worker 85 18 1 58 8
Personal care and related worker, N.E.C. 4 0 0 3 1
OTHER PERSONAL SERVICES WORKER
Barber, Hairdresser 182 102 21 51 8
Beautician 195 53 18 121 3
Undertaker 0 0 0 0 0
Funeral Director 10 10 0 0 0
Morgue attendant 1 1 0 0 0
Bermudian Status
36

Table 6.5 cont.
Filled Jobs by Specific Occupation and Bermudian Status of Job Holders within the Service Workers, Shop and Market Sales
Workers Occupational Group, 2019
Permanent
Non-Bermudian Other Resident
Spouse of non- Certificate
Specific Occupation Total Bermudian Bermudian Bermudian Holder
OTHER SERVICE WORKERS
Social hostess / Social director 32 31 1 0 0
Bookmaker 0 0 0 0 0
Croupier 0 0 0 0 0
Nursing aide (includes orderly) 478 421 39 14 4
Travel attendant 4 4 0 0 0
Pool attendant / Beach attendant 112 112 0 0 0
Convention coordinator 17 15 2 0 0
Other service worker, N.E.C. 221 201 14 5 1
PROTECTIVE SERVICES WORKERS
Fire-fighter 91 85 6 0 0
Security officer 478 455 14 5 4
Prison officer 175 164 10 1 0
Watchperson 5 5 0 0 0
Lifeguard 21 16 0 5 0
FASHION AND OTHER MODELS
Salesperson 187 168 12 5 2
Sales clerk, retail trade 524 484 33 2 5
Fashion and other model 1 1 0 0 0
Sales assistant and other sales personnel, N.E.C. 301 274 17 10 0
Bermudian Status
37

Table 6.6
Filled Jobs by Specific Occupation and Bermudian Status of Job Holders within the Skilled Agricultural
& Fishery Workers Occupational Group, 2019
Permanent
Non-Bermudian Other Resident
Spouse of non- Certificate
Specific Occupation Total Bermudian Bermudian Bermudian Holder
Total 771 355 42 310 64
MARKET GARDENERS AND CROP GROWERS
Farmer 19 14 0 5 0
Farm worker (general) 41 7 1 33 0
Gardner (general) 120 55 11 36 18
Plant nursery worker 27 20 1 4 2
Landscape gardener 394 106 21 229 38
Sports grounds attendant 73 62 5 1 5
Live stock worker 33 29 1 2 1
Commercial fisherperson / Charter fishperson 64 62 2 0 0
Bermudian Status
38
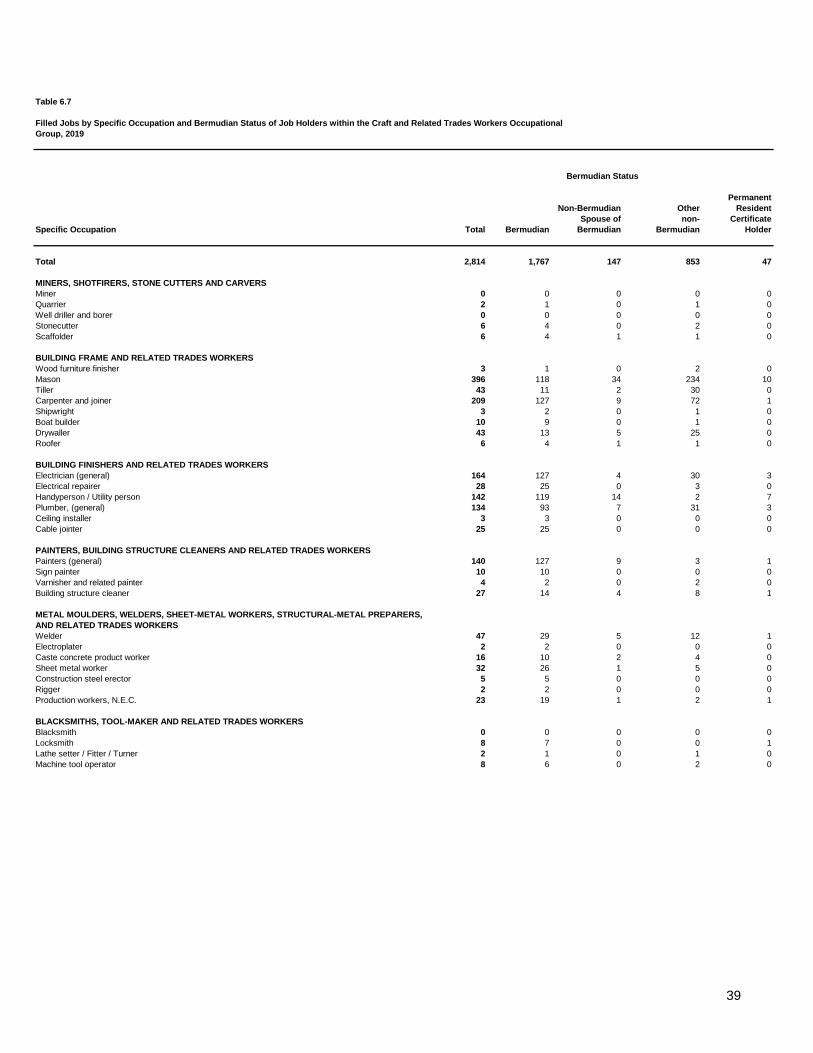
Table 6.7
Filled Jobs by Specific Occupation and Bermudian Status of Job Holders within the Craft and Related Trades Workers Occupational
Group, 2019
Permanent
Non-Bermudian Other Resident
Spouse of non- Certificate
Specific Occupation Total Bermudian Bermudian Bermudian Holder
Total 2,814 1,767 147 853 47
MINERS, SHOTFIRERS, STONE CUTTERS AND CARVERS
Miner 0 0 0 0 0
Quarrier 2 1 0 1 0
Well driller and borer 0 0 0 0 0
Stonecutter 6 4 0 2 0
Scaffolder 6 4 1 1 0
BUILDING FRAME AND RELATED TRADES WORKERS
Wood furniture finisher 3 1 0 2 0
Mason 396 118 34 234 10
Tiller 43 11 2 30 0
Carpenter and joiner 209 127 9 72 1
Shipwright 3 2 0 1 0
Boat builder 10 9 0 1 0
Drywaller 43 13 5 25 0
Roofer 6 4 1 1 0
BUILDING FINISHERS AND RELATED TRADES WORKERS
Electrician (general) 164 127 4 30 3
Electrical repairer 28 25 0 3 0
Handyperson / Utility person 142 119 14 2 7
Plumber, (general) 134 93 7 31 3
Ceiling installer 3 3 0 0 0
Cable jointer 25 25 0 0 0
PAINTERS, BUILDING STRUCTURE CLEANERS AND RELATED TRADES WORKERS
Painters (general) 140 127 9 3 1
Sign painter 10 10 0 0 0
Varnisher and related painter 4 2 0 2 0
Building structure cleaner 27 14 4 8 1
METAL MOULDERS, WELDERS, SHEET-METAL WORKERS, STRUCTURAL-METAL PREPARERS,
AND RELATED TRADES WORKERS
Welder 47 29 5 12 1
Electroplater 2 2 0 0 0
Caste concrete product worker 16 10 2 4 0
Sheet metal worker 32 26 1 5 0
Construction steel erector 5 5 0 0 0
Rigger 2 2 0 0 0
Production workers, N.E.C. 23 19 1 2 1
BLACKSMITHS, TOOL-MAKER AND RELATED TRADES WORKERS
Blacksmith 0 0 0 0 0
Locksmith 8 7 0 0 1
Lathe setter / Fitter / Turner 2 1 0 1 0
Machine tool operator 8 6 0 2 0
Bermudian Status
39

Table 6.7 cont.
Filled Jobs by Specific Occupation and Bermudian Status of Job Holders within the Craft and Related Trades Workers Occupational
Group, 2019
Permanent
Non-Bermudian Other Resident
Spouse of non- Certificate
Specific Occupation Total Bermudian Bermudian Bermudian Holder
MACHINERY MECHANICS AND FITTERS
Motor vehicle mechanic 160 93 7 57 3
Motor cycle mechanic 44 24 1 18 1
Autobody worker 43 17 1 23 2
Tyre rebuilder 4 4 0 0 0
Vehicle spray painter 18 9 1 7 1
AIRCRAFT AND MARINE MECHANICS
Aircraft engineer 5 5 0 0 0
Aircraft engineer / Air frame mechanic 0 0 0 0 0
Marine engine fitter / Assembler 9 7 0 2 0
Underwater worker / Diver 31 14 0 17 0
OTHER MACHINE MECHANICS
Machinery / maintenance mechanic 94 67 5 20 2
Machinery engine fitter (general) 12 12 0 0 0
Engine mechanic 47 36 1 10 0
Refrigeration and air conditioning plant installer and mechanic 145 96 3 45 1
Office machines mechanic 6 6 0 0 0
Machinery fitter and assembler mechanic, N.E.C. 91 75 3 13 0
ELECTRICAL AND ELECTRONIC EQUIPMENT MECHANICS AND FITTERS
Electrical fitters / electrical meter fitter 16 12 0 4 0
Electronics fitter 3 2 0 1 0
Telephone installer / Repairer 19 19 0 0 0
Telephone and telegraph mechanic 0 0 0 0 0
Telephone and telegraph tester 0 0 0 0 0
Radio and television repairer 4 2 1 1 0
Electronic computer and related equipment mechanic 24 17 0 7 0
Overhead linesperson 21 21 0 0 0
Telephone cable linesperson 53 50 3 0 0
PRECISION WORKERS IN METAL AND RELATED MATERIALS
Jeweler 12 9 2 1 0
Jeweler repairer 3 3 0 0 0
Watch, Clock, Precision and optical instrument assembler and repairer 5 2 2 1 0
Goldsmith and silversmith 0 0 0 0 0
Engraver 2 2 0 0 0
Musical instrument tuner / repairer 3 3 0 0 0
Dental mechanic 2 2 0 0 0
POTTERS, GLASS-MAKERS AND RELATED TRADES WORKERS
Glass blower 6 5 0 1 0
Glazing Installer / Glass Cutter 11 10 0 1 0
Glass engraver and etcher 0 0 0 0 0
Optical mechanic / Technician 10 6 2 2 0
Potter 0 0 0 0 0
Potter worker,N.E.C. 1 1 0 0 0
Bermudian Status
40

Table 6.7 cont.
Filled Jobs by Specific Occupation and Bermudian Status of Job Holders within the Craft and Related Trades Workers Occupational
Group, 2019
Permanent
Non-Bermudian Other Resident
Spouse of non- Certificate
Specific Occupation Total Bermudian Bermudian Bermudian Holder
PRINTING AND RELATED TRADES WORKERS
Compositor / Typesetter 0 0 0 0 0
Silk-screen printer 2 1 1 0 0
Block printer / Textile 0 0 0 0 0
Graphic arts cameraperson 5 4 0 0 1
Graphic designer 30 26 0 4 0
Bookbinder 2 2 0 0 0
Darkroom attendant 0 0 0 0 0
Offset press operator 3 1 1 1 0
FOOD PROCESSING AND RELATED TRADES WORKERS
Butcher / Fish butcher 68 9 3 56 0
Baker / Mixer 54 10 1 41 2
Baker helper 6 6 0 0 0
Pastry maker 14 2 0 11 1
Fruit and vegetable preserver 3 2 0 1 0
Beverage maker 8 7 1 0 0
Tobacco preparers and tobacco products maker 0 0 0 0 0
Dairy products processor 9 5 0 4 0
Food and beverage processor, N.E.C. 97 86 6 4 1
WOOD TREATERS, CABINET-MAKERS AND RELATED TRADESWORKERS
Wood products assembler 0 0 0 0 0
Cabinet maker 12 7 0 5 0
Wood treater 0 0 0 0 0
Woodworking machine operator 1 1 0 0 0
TEXTILE, GARMENT AND RELATED TRADES WORKERS
Tailor / Dressmaker 3 0 0 3 0
Seamstress 7 4 0 1 2
Weaver (general) 0 0 0 0 0
Sail, tent and awning maker 5 2 0 2 1
Textile products assembler 1 1 0 0 0
Upholsterer 18 3 3 12 0
Carpet layer 11 11 0 0 0
PELT, LEATHER AND SHOEMAKING TRADES WORKERS
Leather goods maker 0 0 0 0 0
Shoe repairer 2 0 0 2 0
Bermudian Status
41

Table 6.8
Filled Jobs by Specific Occupation and Bermudian Status of Job Holders within the Plant and Machine Operators and Assemblers
Occupational Group, 2019
Permanent
Non-Bermudian Other Resident
Spouse of non- Certificate
Specific Occupation Total Bermudian Bermudian Bermudian Holder
Total 1,441 1,361 40 29 11
POWER-PRODUCTION AND RELATED PLANT OPERATIONS
Power switchboard operator 5 5 0 0 0
Engine operator 33 33 0 0 0
Pump person 125 122 1 2 0
Boiler fireperson, watch engineer, watch keeper 15 14 0 1 0
Incinerator plant operator 3 3 0 0 0
Stationery engine and related equipment operator, N.E.C. 2 2 0 0 0
PRINTING-, BINDING- AND PAPER-PRODUCTS MACHINE OPERATORS
Photo-typesetting machine operator 0 0 0 0 0
Linotype operator 0 0 0 0 0
Type-casting machine operator 0 0 0 0 0
Plastic molding / Laminating machinery operator 2 2 0 0 0
Letter press operator 0 0 0 0 0
Other compositors and typesetters,N.E.C. 7 5 1 1 0
TEXTILE-, FUR- AND LEATHER- PRODUCTS MACHINE OPERATORS
Laundry machine operator 86 76 6 3 1
Dry-cleaning machine operator 1 1 0 0 0
Other launder, dry cleaning and presser, carpet shampooer, N.E.C. 52 43 5 4 0
FOOD AND RELATED PRODUCTS MACHINE OPERATORS
Bakery products machine operator 2 2 0 0 0
Grain processing machine operator 0 0 0 0 0
Chocolate products and production machine operator 0 0 0 0 0
ASSEMBLER
Electronic-equipment assembler 1 1 0 0 0
Electrical-equipment assembler 0 0 0 0 0
Rubber products assembler 0 0 0 0 0
Plastic products assembler 4 2 1 0 1
Mechanical machinery assembler 0 0 0 0 0
Metal products assembler / Mechanic 2 2 0 0 0
OTHER MACHINE OPERATORS AND ASSEMBLERS
Data encoding machine operator 27 27 0 0 0
Bookkeeping machine operator 0 0 0 0 0
Automatic data processing machine operator 20 19 1 0 0
Perfume distiller 0 0 0 0 0
Bermudian Status
42

Table 6.8 cont.
Filled Jobs by Specific Occupation and Bermudian Status of Job Holders within the Plant and Machine Operators and Assemblers
Occupational Group, 2019
Permanent
Non-Bermudian Other Resident
Spouse of non- Certificate
Specific Occupation Total Bermudian Bermudian Bermudian Holder
MOTOR-VEHICLE DRIVERS
Motor-car driver (includes taxi and chauffeur-driven car) 187 183 3 1 0
Motor bus and limousine driver 167 159 7 0 1
Trailer / Tank driver 26 26 0 0 0
Heavy-truck driver 353 330 10 7 6
Light truck / Van driver (includes ambulance) 107 102 2 2 1
Driving instructor 4 4 0 0 0
Driver of animal-drawn vehicle 1 1 0 0 0
AGRICULTURAL AND OTHER MOBILE-PLANT OPERATORS
Hoist equipment operator 3 3 0 0 0
Earth-moving- and related plant operator 45 37 0 7 1
Crane operators 2 2 0 0 0
Open bridge operator 0 0 0 0 0
Material handling equipment operator 50 48 2 0 0
Lighthouse keeper 0 0 0 0 0
SHIPS' DECK CREWS AND RELATED WORKERS
Boatswain 1 1 0 0 0
Able sea person 27 26 1 0 0
Ordinary sea person 38 38 0 0 0
Deck hand / Boatperson 43 42 0 1 0
Ships' oiler and greaser 0 0 0 0 0
Bermudian Status
43

Table 6.9
Filled Jobs by Specific Occupation and Bermudian Status of Job Holders within the Elementary Occupations Group, 2019
Permanent
Non-Bermudian Other Resident
Spouse of non- Certificate
Specific Occupation Total Bermudian Bermudian Bermudian Holder
Total 1,018 829 50 117 22
STREET VENDORS AND RELATED WORKERS
Street food vendor 0 0 0 0 0
Street vendor, non-food products 1 1 0 0 0
BUILDING CARETAKERS, WINDOW AND RELATED CLEANERS
Janitor / Caretaker 146 111 9 15 11
Swimming pool service person 18 12 2 4 0
Char worker, cleaner, and related worker, N.E.C. 24 20 0 4 0
GARBAGE COLLECTORS AND RELATED LABOURERS
Garbage collector 23 23 0 0 0
Sweeper and related labourer 27 27 0 0 0
MINING AND CONSTRUCTION LABOURERS
Mining and quarrying labourer 0 0 0 0 0
Semi-skilled construction labourer 270 235 16 14 5
Building construction labourer 302 203 18 78 3
MANUFACTURING LABOURERS
Goods handler and longshoreperson 168 161 5 1 1
Packer / Bottler 39 36 0 1 2
Grocery Packer 0 0 0 0 0
Bermudian Status
44

Table 6.10
Filled Jobs by Specific Occupation and Bermudian Status of Job Holders within the Armed Forces, 2019
Permanent
Non-Bermudian Other Resident
Spouse of non- Certificate
Specific Occupation Total Bermudian Bermudian Bermudian Holder
Total 28 26 0 2 0
ARMED FORCES
Armed Forces 28 26 0 2 0
Bermudian Status
45

Cedar Park Centre, 48 Cedar Avenue, Hamilton HM 11 P.O. Box HM 3015, Hamilton HM MX, Bermuda
Tel: (441) 297-7761 Fax: (441) 295-8390
E-mail: [email protected]
Website: https://www.gov.bm/department/statistics