2019 ipma-hr benchmarking report - ww1.prweb.com
TRANSCRIPT
Employee Engagement & Retention
2019 IPMA-HR Benchmarking Report

2019 IPMA-HR Benchmarking Report Employee Engagement & Retention
1
Table of Contents
Executive Summary . . . . . . . . . . . . . . . . . . 2
Objectives . . . . . . . . . . . . . . . . . . . . . . . . . . 3
Methodology . . . . . . . . . . . . . . . . . . . . . . . . 3
Demographics . . . . . . . . . . . . . . . . . . . . . . . 3
Employee Engagement . . . . . . . . . . . . . . . 4
Common Practices . . . . . . . . . . . . . . . . . . . 6
Barriers to Employee Engagement . . . . 10
Organizational Support . . . . . . . . . . . . . . 14
Other Efforts to Engage . . . . . . . . . . . . . 17
Retention Strategies . . . . . . . . . . . . . . . . 20
Case Studies . . . . . . . . . . . . . . . . . . . . . .204
When people are
financially invested,
they want a return.
When people are
emotionally invested,
they want to contribute.
– Simon Sinek

2019 IPMA-HR Benchmarking Report Employee Engagement & Retention
2
Executive Summary
� Sixty-five percent of respondents to IPMA-HR’s 2019 Benchmarking Survey reported that they have carried out efforts to engage their employees.
� Agency-wide communication and action plan development are the next steps IPMA-HR members most often take after receiving results from an employee engagement study.
� Involving staff in decision-making (45%) was the most frequently cited effort to engage employees, followed by increasing communications (24%), particularly interdepartmental communication and communication from the top of the organization to the bottom.
� IPMA-HR members from large organizations reported carrying out employee engagement efforts (71%) more often than did members from medium-sized organizations (68%) and small organizations (60%).
� Although a third of IPMA-HR members indicated that it is too early to determine which improvements have been made since their organization started measuring employee engagement, 24% cited a more-collaborative workplace, 22% mentioned an increase in communication, and 19% cited higher retention.
� Lack of resources (time, staff, etc.) and a nonconductive organizational culture were identified as the main barriers to conducting employee engagement studies.
� The highest barrier to conducting employee engagement studies varied by organization size. IPMA-HR members from small organizations cited a lack of resources as their greatest challenge, and member from medium-sized organizations cited an organizational culture that did not support such studies. At large organizations, lack of support from leadership holds back the conduct of engagement studies.
� Across all organizations, leadership support was cited as the most helpful factor in initiating an employee engagement study.
Data come from the responses of 417 IPMA-HR members to a survey that was sent to all 7,206 Association members during June and July 2019.
� Large organizations, defined as those employing 10,000 or more people, conduct employee engagement studies at much higher rates (63% conduct engagement studies) and much more frequently (59% conduct studies yearly) than do small organizations with fewer than 500 employees (33% conduct studies, with 41% of those small organizations conducting them yearly). Fifty-three percent of medium-sized organizations conduct engagement studies, and 36% of such organizations conduct studies yearly.
� Across organizations of all sizes, 55-65% have outsourced employee engagement studies.
� Employee satisfaction (90%) and workplace culture (85%) are the measures most commonly included in employee engagement studies.
The International Public Management Association for Human Resources conducted its 2019 Benchmarking Survey to gain an understanding of the current state of employee engagement practices in public sector human resources and to offer HR professionals suggestions for engaging and retaining employees. Key findings from the survey include the following:

2019 IPMA-HR Benchmarking Report Employee Engagement & Retention
3
The survey received 297 completed responses and 120 partial responses for a total of 417 participants. The response rate is approximately 6 percent. The results of the survey have a ±5 margin of error at a 95 percent confidence level.
The mix of respondents was highly representative of IPMA-HR’s membership. Thus, no weighting of responses by demographic characteristics was required. Most of the survey respondents hold senior-level positions, with 61 percent of respondents being managers or directors of human resources. The chart below depicts the composition of survey participants by type of government organization, organization size, and job title.
Responses to the 2019 Benchmarking Survey were analyzed to provide an understanding of the current state of employee engagement practices in the public sector human resources field and to offer HR professionals suggestions on engaging and retaining employees.
Employee Engagement Study Practices
� Understand the ways public sector HR organizations handle Employee Engagement studies. Determine the percentage of agencies conducting said studies, how often they are conducted, and the most common next steps with their results.
Barriers to Conducting Employee Engagement Study
� Identify the common barriers to running an Employee Engagement study at public sector organizations. Determine what would help agencies launch said study. Examine if the barriers and support needed vary by organization size.
Organizational Support
� Determine the value and support provided by leadership for employee engagement efforts at public sector organizations. Evaluate how public sector HR professionals rate their own organization’s level of employee engagement and the reasons behind it. Examine support and value at different agency sizes.
Other strategies to engage and retain
� Identify what efforts public sector HR organizations carry out to engage and retain employees besides running an Employee Engagement study. Determine the retention factors measured and if they vary by organization size.
IPMA-HR emailed the Benchmarking Survey to 7,206 public sector human resources members of the association on June 26, 2019. Two additional reminder emails were sent to members. For their participation, respondents were given the option to register to win a drawing for one of three $50 Amazon gift cards.
ORGANIZATION SIZE BY EMPLOYEE
COUNTYn=286
Small (48%)
1 - 200 23%
200 - 500 25%
Medium (40%)
500 - 1,000 15%
1,000 - 5,000 25%
Large (12%)
5,000 - 10,000 5%
10,000 - 20,000 3%
20,000 + 4%
JOB TITLE n=286
Director 37%
Deputy Director 5%
Manager 24%
Consultant/Partner
4%
Analyst 8%
Coordinator 4%
Assistant 2%
Other 15%
LEVEL OF GOVERNMENT WHERE EMPLOYED n=288
Local/County/Town 76%
State 9%
Federal 3%
Special District 7%
Educational Organization 2%
Note: Throughout this report, organizations with <500 employees are described as small. Those with 500-5,000 employees are described as medium or medium-sized, and those with >5,000 employees are described as large. Percentages do not always total 100 due to rounding and because some survey questions permitted more than one response.
Objectives
Methodology
Demographics

Kevin Kruse defines employee engagement as the “emotional commitment the employee has to the organization and its goals.” The government workforce is 76 % fully or somewhat engaged, leaving about a quarter of the public sector workforce identifying itself as unengaged. In an effort to provide public sector HR professionals more opportunities to conduct studies and engage employees, this report presents the current common practices around Employee Engagement studies.
In this report, we will examine the way public sector HR organizations handle Employee Engagement studies, communicate results, implement changes, and examine the organizational support around it. This report also identifies the barriers organizations face in conducting such studies, as well as efforts to engage and retain employees. The goal is to present the current state of standards in public sector HR for Employee Engagement studies.
Employee Engagement

2019 IPMA-HR Benchmarking Report Employee Engagement & Retention
5
Employee Engagement Studies
Forty-two percent of IPMA-HR members reported to have conducted an Employee Engagement Survey at their agency. Findings varied by organization size, with 33% of respondents from small organizations, 53% from medium-sized organizations, and 63% from large organizations reporting they had conducted such a survey at their agency.
Of those members who have conducted an Employee Engagement study at their agency, 83% of them had done it within the last 2 years. Within the last year, 62% had done so, and 21% had conducted the study about 1-2 years ago.
WHEN WAS THE LAST TIME AN EMPLOYEE ENGAGEMENT STUDY WAS CONDUCTED AT YOUR ORGANIZATION? (N=159)
Has Conducted A Study Has Not Conducted A Study
HAS YOUR ORGANIZATION CONDUCTED A SURVEY MEASURING EMPLOYEE ENGAGEMENT? (N=385)
SMALL MEDIUM LARGE
0-1 Year Ago 1-2 Years Ago 2-3 Years Ago 3-4 Years Ago 4-5 Years Ago 5+ Years Ago
20%
20%
0%
0%
40%
40%
60%
60%
80%
80%
100%
100%
67%
62%
21%
47% 37%
7%1% 4% 6%
Yes No
42%
58%
33%
53%63%

This section explores the common practices by those members who have conducted Employee Engagement Study at their agency, including who conducts the study, the frequency, the measures included, results distribution, and common next steps.
Common Practices

2019 IPMA-HR Benchmarking Report Employee Engagement & Retention
7
Internally or Externally Sourced
From those whose organizations have conducted Employee Engagement surveys, 55% used an external organization for their study, while 45% conducted a study internally. Members from smaller organizations, most likely due to less internal staff and resources, reported higher on conducting studies from external organizations (66%).
IS THE EMPLOYEE ENGAGEMENT SURVEY CONDUCTED INTERNALLY OR IS IT EXTERNALLY SOURCED? (N=156)
ORGANIZATION SIZE
SMALL MEDIUM LARGE
SMALL MEDIUM LARGEEvery Year Every 2-4 Years
Every 5-10 Years
Every 10 Years We have only conducted
an Employee Engagement survey one
time
20%
10% 20%
0%
0% 0%
40%
20% 40%
60%
30% 60%
80%
40% 80%
100%
50% 100%
34%
66%
45%55%
45%55%
Internal Survey Internal SurveyExternal Survey External Survey
45%55%
HOW OFTEN DOES YOUR AGENCY CONDUCT AN EMPLOYEE ENGAGEMENT STUDY? (N=157)
Frequency of Employee Engagement Studies
Three-quarters of public sector HR professionals reported conducting Employee Engagement studies either yearly (39%) or every 2-4 years (36%). Almost a fifth (18%) of those surveyed responded their organization has only conducted an Employee Engagement study once. Members from large organizations reported conducting yearly Employee Engagement studies (60%) higher than medium-sized (36%) and smaller organizations (40%).
We have only conducted an Employee Engagement survey one time
Every 5-10 Years
Every 2-4 Years
Every Year
ORGANIZATION SIZE

2019 IPMA-HR Benchmarking Report Employee Engagement & Retention
8
Results Distribution
A vast majority of IPMA-HR members (91%) reported communicating the results of their organizations Employee Engagement study to the rest of the organization. Over half of IPMA-HR members reported they communicated the results either through a report, a presentation, an email, or during a meeting. Seventeen percent cited other forms of communicating the Employee Engagement Study results such as internal newsletter or through their organization’s website.
Agency-wide communication
Review by senior leadership/management
Employee engagement focus groups
Action plan development
Handled by department
Program development
0% 5% 10% 15% 25% 35%20% 30%
WHAT DID YOUR ORGANIZATION DO WITH THE RESULTS OF THE EMPLOYEE ENGAGEMENT STUDY?
33%
33%
22%
19%
14%
11%
WERE THE RESULTS COMMUNICATED TO THE ORGANIZATION? (N=148)
Report Presentation Email Meeting Other
10%
0%
20%
30%
40%
50%
60%
56% 55% 53% 53%
17%
Yes No
91%
9%
Next Steps for Employee Engagement Study Results
When asked to describe what their organizations do with the results of their Employee Engagement studies, IPMA-HR members most commonly cited action plan development (33%) or providing agency-wide communication of the results (33%) in their comments. About one-fifth of the comments reported that the results are to be reviewed by senior leadership/management (22%) and developing employee engagement focus groups (19%). Some comments mentioned that the results were handled separately by each department (14%) or focused mainly on program development in response to the results (11%). Answers were coded and evaluated for emerging themes.
2019 IPMA-HR Benchmarking Report Employee Engagement & Retention
9
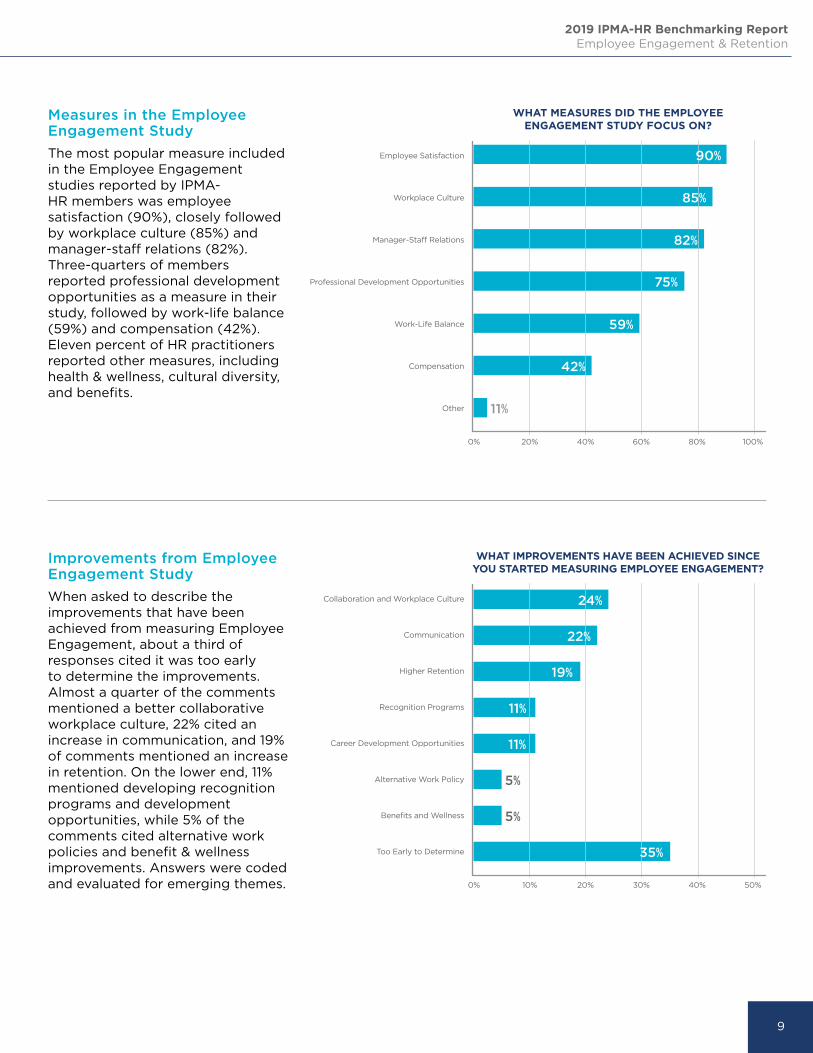
Improvements from Employee Engagement Study
When asked to describe the improvements that have been achieved from measuring Employee Engagement, about a third of responses cited it was too early to determine the improvements. Almost a quarter of the comments mentioned a better collaborative workplace culture, 22% cited an increase in communication, and 19% of comments mentioned an increase in retention. On the lower end, 11% mentioned developing recognition programs and development opportunities, while 5% of the comments cited alternative work policies and benefit & wellness improvements. Answers were coded and evaluated for emerging themes.
Manager-Staff Relations
Recognition Programs
Professional Development Opportunities
Career Development Opportunities
Work-Life Balance
Alternative Work Policy
Workplace Culture
Higher Retention
Employee Satisfaction
Collaboration and Workplace Culture
Communication
Compensation
Benefits and Wellness
Other
Too Early to Determine
0%
0%
20%
10%
40%
20%
60%
30%
100%
50%
80%
40%
WHAT MEASURES DID THE EMPLOYEE ENGAGEMENT STUDY FOCUS ON?
WHAT IMPROVEMENTS HAVE BEEN ACHIEVED SINCE YOU STARTED MEASURING EMPLOYEE ENGAGEMENT?
90%
24%
22%
19%
11%
11%
5%
5%
35%
85%
82%
75%
59%
42%
11%
Measures in the Employee Engagement Study
The most popular measure included in the Employee Engagement studies reported by IPMA-HR members was employee satisfaction (90%), closely followed by workplace culture (85%) and manager-staff relations (82%). Three-quarters of members reported professional development opportunities as a measure in their study, followed by work-life balance (59%) and compensation (42%). Eleven percent of HR practitioners reported other measures, including health & wellness, cultural diversity, and benefits.

Barriers to Employee Engagement Studies
This section examines the common barriers organizations experience when seeking to conduct and Employee Engagement study. It also explores the support needed to move forward.

2019 IPMA-HR Benchmarking Report Employee Engagement & Retention
11
Barriers to Measuring Employee Engagement
When asked what keeps their organizations from conducting an Employee Engagement study, almost a third responded ”other” with a majority of comments citing a lack of resources (time, staff, etc.). The second-most popular comments mention that such a study has never been done before, implying that Employee Engagement studies are not part of their organization’s culture. Organizational culture (22%), and lack of support from leadership (21%) were the most common answers. Budgetary restrictions (14%), Concern over staff cooperation (9%), and bureaucratic processes as the least common answers.
Small organizations marked other as their most popular answer, with 45% of comments referring to organizational culture (“Just not done here”) and 35% referring to a lack of resources (“time/resource shortage”). Medium-sized organizations cited organizational culture as their most popular answer. Large organizations cited lack of support from leadership and organizational culture as the main reasons keeping them from measuring employee engagement at their agency.
WHAT KEEPS YOUR ORGANIZATION FROM MEASURING EMPLOYEE ENGAGEMENT? (N=182)
Bureaucratic Processes
Concern Cover Staff Cooperation
Budgetory Restrictions
Lack of Support from Leadership
Organizational Culture
Other
5%
0%
10%
15%
20%
25%
30%
6%
9%
14%
21% 22%
28%
SMALL MEDIUM LARGE
10%
0%
20%
30%
40%
50%
17%
13%
8%6%
11%
0%
19%22%
31%
13%
30% 31%
11%
7%
0%
34%
17%
31%
Budgetary Restrictions
Lack of Support from Leadership
Concern Over Staff Cooperation
Bureaucratic Processes
Organizational Culture
Other
ORGANIZATION SIZE

2019 IPMA-HR Benchmarking Report Employee Engagement & Retention
12
Barriers to Employee Engagement
We asked public sector HR professionals to describe the barriers they face when trying to improve employee engagement at their organization. A third of the comments mentioned a lack of leadership support as the barrier from improving employee engagement. Staff cooperation (17%) and budget restrictions (17%) were the second-most mentioned barriers. Fifteen percent of the comments cited organizational culture as a barrier, while 6% cited a lack of training in employee engagement practices and lack of resources as the barriers to improving employee engagement. Answers were coded and evaluated for emerging themes.
Staff Cooperation
Budget
Culture (Communication Styles, Generational Divides)
Leadership Support
Training in Employee Engagement Practices
Resources (time, staff)
0% 5% 10% 15% 25% 35%20% 30%
WHAT BARRIERS HAVE YOU ENCOUNTERED TO IMPROVING EMPLOYEE ENGAGEMENT?
33%
17%
17%
15%
6%
6%

2019 IPMA-HR Benchmarking Report Employee Engagement & Retention
13
Launch an Employee Engagement study
In order to explore what would help public sector HR practitioners launch an Employee Engagement study in their organizations we asked our members to describe that to us. Leadership support (26%) has been the most commonly mentioned barrier and potential are of help to develop Employee Engagement initiatives at public sector HR agencies. Fifteen percent of comments mentioned resources (time, staff, etc.) and cost-effective options as potential ways to help HR launch an Employee Engagement study. Eleven percent cited staff buy-in and understanding the value of employee engagement as important ways to help launch a study, including a comment mentioning “seeing the benefit and ROI other agencies have found.” Lastly, 9% of comments asked for a simple tool or template for HR practitioners to be able to use internally to measure employee engagement on their own. Answers were coded and evaluated for emerging themes.
Employee Engagement Study in 12 Months
Half of IPMA-HR members reported their organization will run an Employee Engagement study in the next 12 months. The results vary by organization size, with 69% members from large organizations reporting a study within 12 months, 54% members from medium-size organizations, and 44% of members from small organizations (44%).
Resources (time, staff)
Cost-effective Options
Staff Cooperation
Leadership Support
Understanding the Value
Simple Tool
0% 5% 10% 15% 25%20% 30%
WHAT WOULD HELP YOUR AGENCY LAUNCH AN EMPLOYEE ENGAGEMENT STUDY?
26%
15%
15%
11%
11%
9%
SMALL
MEDIUM
LARGE
0% 20% 40% 60% 80% 100%
57%
46%
31%
DOES YOUR ORGANIZATION PLAN TO MEASURE EMPLOYEE ENGAGEMENT IN THE NEXT 12 MONTHS? (N=318)
NoYes
NoYes
50% 50%
43%
54%
69%

Organizational Support
This section examines organization support for employee engagement, including the value given to employee engagement and the support public sector HR professionals receive from management and leadership.

2019 IPMA-HR Benchmarking Report Employee Engagement & Retention
15
How valuable is Employee Engagement at your organization?
About 70% of public sector HR professionals responded that employee engagement is valued or highly valued at their organization, with 68% reporting it valued or highly valued. A higher number of members from smaller organizations reported their organizations highly value employee engagement (30%) than medium-sized (24%) and large organizations (23%).
How would you rate your own organizations level of Employee Engagement?
When asked to rate their own organization’s level of employee engagement from 0-10 with 0 being not at all engaged to 10 being highly engaged, public sector HR professionals most commonly responded 7 (26.7%) than any other rating.
Highly valued
Valued
Neutral
Not valued
Not valued at all
0% 5% 10% 15% 25% 35% 40% 45%20% 30%
HOW VALUABLE IS EMPLOYEE ENGAGEMENT AT YOUR ORGANIZATION? (N=316)
HOW WOULD YOU RATE YOUR OWN ORGANIZATION’S LEVEL OF EMPLOYEE ENGAGEMENT? (N=311)
26%
42%
22%
7%
4%
SMALL
MEDIUM
LARGE
0% 20% 40% 60% 80% 100%
Highly valued Valued
Not valued Not valued at all
Neutral
30% 40% 19% 5%
5%
3%
3%
24% 43% 22% 9%
23% 46% 20% 9%
5%
0%
0 1 2 3 4 5 6 7 8 9 10
10%
15%
20%
25%
30%
2.3% 1.6%3.2%
6.4% 6.8%
15.1% 15.8%
26.7%
15.4%
4.2%2.6%

2019 IPMA-HR Benchmarking Report Employee Engagement & Retention
16
Leadership and Management Support
About three-quarters of HR Practitioners reported that their management and leadership provide moderate to high support for employee engagement efforts (73%). Almost a fifth reported low levels of support, and 8% reported having no support at their organization. Of large organizations, 80% reported their management and leadership provides moderate to high support.
HIGH MODERATE LOW NONE
10%
0%
20%
30%
40%
50%
29%
44%
18%
8%
WHAT LEVEL OF SUPPORT DOES MANAGEMENT AND LEADERSHIP TEAM PROVIDE FOR EMPLOYEE ENGAGEMENT EFFORTS? (N=308)
None Low Moderate High
SMALL MEDIUM LARGE
10%
0%
20%
30%
40%
50%
10%
5%9%
15%
23%
11%
42%44%
51%
33%
28% 29%
ORGANIZATION SIZE

Other Efforts to Engage
In this section we examine the initiatives public sector HR organizations carry out to engage employees and whether they are helpful and sustainable.

2019 IPMA-HR Benchmarking Report Employee Engagement & Retention
18
Efforts to Engage Employees
Of participants, 65% reported that their agency has carried out efforts to engage their staff in the organization’s goals. Twenty percent reported no, while 15% reported that they’re not sure. Members from small organizations reported their agency has carried out efforts that engage their employees (60%), while 68% of members from medium-sized organizations, and 71% of members from large organizations.
Common Efforts
When asked to describe what efforts public sector HR practitioners carry out to engage their employee’s in the organization’s goals, almost half of the comments (43%) mentioned involving employees in decision making, particularly in the development of the organization’s strategic planning. Enhanced communication, particularly interdepartmental communication and communication coming from top to bottom of the organization.
Almost a fifth of comments cited recognition programs as a way to engage employees, and 16% mentioned career development opportunities and Committees/Focus groups. The focus groups concentrated on ideas such as tacking organizational issues or introducing new programs.
Lastly, 12% of comments mentioned actively linking individual goals to the larger organization through performance evaluations and consistent meetings. When asked which effort was most successful at their organization, IPMA-HR members listed communication (30%), career development (23%), and staff involvement (14%). Answers were coded and evaluated for emerging themes.
BESIDES CONDUCTING AN EMPLOYEE ENGAGEMENT SURVEY, HAS YOUR AGENCY CARRIED OUT EFFORTS TO ENGAGE
YOUR EMPLOYEES IN THE ORGANIZATION’S GOALS? (N=309)
Yes
No
Not sure
IS THE TRAINING PROVIDED IN-HOUSE OR THROUGH AN EXTERNAL AGENCY? (N=48)
65%
19%
16% SMALL
MEDIUM
LARGE
0% 20% 40% 60% 80% 100%
Highly valued Valued Neutral
60% 22% 18%
68% 17% 14%
71% 17% 11%
Staff Involvement In
Decision Making
Communication
Recognition and Acknowledgement
Career Development Opportunities
Communities/Focus Groups
Link Individual Goals to the Organization’s
0% 5% 10% 15% 25% 35% 40% 45%20% 30%
DESCRIBE THE EFFORTS YOUR ORGANIZATION HAS CARRIED OUT TO ENGAGE YOUR
EMPLOYEES IN THE ORGANIZATION’S GOALS
43%
24%
18%
16%
16%
12%

2019 IPMA-HR Benchmarking Report Employee Engagement & Retention
19
Sustainable Efforts
Those whose organizations had carried out efforts to engage employees, 91% said their efforts were helpful. Majority of members from small (92%) and medium-sized (93%) organization reported that their efforts were helpful. However, 86% of members of large organizations reported their efforts to engage with employees were helpful.
A large majority of efforts were reported as helpful, sustainable efforts in the long term (57%). Meanwhile, 38% reported their efforts were sustainable only in the short term, and 5% reported their efforts were not sustainable at all. Small and medium-sized organizations reported their efforts were sustainable long-term (60 percent), however only 36% of IPMA-HR members from larger organizations reported their efforts were sustainable long term.
WERE THESE EFFORTS HELPFUL? (N=179)
WAS THE EFFORT SUSTAINABLE? (N=133)
91%
38%
57%
9%
5%
Yes
Yes, in the short term Yes, in the long term Yes, in the short term Yes, in the long term
No, it was not sustainable No, it was not sustainable
YesNo No
Org
an
izati
on
Siz
e
Organization Size
Small
Medium
Large
0% 20% 40% 60% 80% 100%
60% 8%
7%
14%
93%
92%
86%
Small Medium Large
20%
0%
40%
60%
80%
100%
60%61%
36%
32%
7% 7%
57%40%

2019 IPMA-HR Benchmarking Report Employee Engagement & Retention
20
Employee Retention
This section explores retention factors measured by public sector HR professionals, as well as the retention strategies employed by their organizations.

2019 IPMA-HR Benchmarking Report Employee Engagement & Retention
21
Retention Factors
Overall retention rate was the most popular retention factors measured by IPMA-HR members (68%), followed by Retention Rate by Department (46%), and Voluntary Retention Rate (44%). When examined by organization size, small and medium-sized organizations maintain Overall Retention Rate as most common (68%, 72%) whereas large organizations most popular retention factor measured is Employee Satisfaction (57%).
WHICH RETENTION FACTORS ARE MEASURED IN YOUR ORGANIZATION?
0%
0%
10%
10%
20%
20%
30%
30%
60%
60%
50%
50%
80%
80%
40%
40%
70%
70%
Voluntary Retention Rate
Voluntary Retention Rate
Employee Satisfaction
Employee Satisfaction
Involuntary Retention Rate
Involuntary Retention Rate
Retention Rate by Department
Retention Rate by Department
Overall Retention Rate
Overall Retention Rate
Turnover Costs
Turnover Costs
Other
Other
68%
46%
44%
42%
37%
21%
12%
Small Medium LargeOrganization Size
20%11%11%
20%22%22%
29%46%
32%
57%43%
40%
31%48%
44%
40%52%
42%
51%72%
68%

2019 IPMA-HR Benchmarking Report Employee Engagement & Retention
22
0%
0%
10%
10%
20%
20%
30%
30%
60%
60%
50%
50%
80%
80%
40%
40%
70%
70%
Retention Strategies
Gathering information from employees is the most common retention method (79%) at public sector HR organizations, followed by providing an orientation program for new hires (77%), and offering career development opportunities to employees (63%). Although these are the most common, IPMA-HR members reported that the most successful method are increase in total compensation (18%); other (17%) typical comments mention a combination of strategies and career development opportunities (16%). Large organizations reported alternative work schedules as one of their most successful retention strategies (30%).
Increase Salaries & Compensation
Increase Salaries & Compensation
Host Team-Building Activities (e.g. Social Events)
Host Team-Building Activities (e.g. Social Events)
Alternative Work Schedules (job rotation, telecommuting)
Alternative Work Schedules (job rotation, telecommuting)
Offer Career Development Opportunities
Offer Career Development Opportunities
Provide An Orientation Program For New Hires
Gather information (exit interviews, focus groups)
Provide An Orientation Program For New Hires
Gather information (exit interviews, focus groups)
Improved Selection Practices
Improved Selection Practices
Other
Other
WHICH RETENTION FACTORS ARE MEASURED IN YOUR ORGANIZATION?
Small Medium LargeOrganization Size
77%83%
73%
71%82%
79%
66%67%
57%
43%54%
50%
37%46%
48%
66%46%
37%
31%49%
37%
6%16%
8%
77%
79%
63%
51%
46%
45%
41%
11%

2019 IPMA-HR Benchmarking Report Employee Engagement & Retention
23
WHICH RETENTION STRATEGY PROVED TO BE MOST SUCCESSFUL? (N=271)
0%
0%
5%
5%
10%
10%
15%
15% 30%
30%
25%
25%20%
20%
Small Medium LargeOrganization Size
Alternative Work Schedules (job rotation, telecommuting)
Alternative Work Schedules (job rotation, telecommuting)
Improved Hiring Practices
Improved Hiring Practices
Gather Information (e.g. Exit Interviews, focus groups)
Gather Information (e.g. Exit Interviews, focus groups)
Offer Career Development Opportunities
Offer Career Development Opportunities
Other
Increase Salaries & Compensation
Other
Increase Salaries & Compensation
Provide an Orientation Program for New Hires
Provide an Orientation Program for New Hires
Host Team-Building Activities (e.g. Social Events)
Host Team-Building Activities (e.g. Social Events)
3%1%7%
10%10%8%
3%9%13%
7%10%10%
29%12%16%
7%20%16%
29%20%11%
13%17%20%
4%
9%
10%
10%
16%
16%
17%
18%

2019 IPMA-HR Benchmarking Report Employee Engagement & Retention
24
Case Study 1
Santa Clarita 2020 Strategic Plan & Employee Engagement Initiatives Organization City of Santa Clarita, CA
Contact Kristi Hobrecker HR Manager
Organization Profile The mission of Human Resources is to recruit, develop, support, and motivate employees in alignment with the City's philosophy and goals. We are committed to developing and maintaining a highly skilled and diverse workforce that prides itself on service excellence. The City of Santa Clarita has about 430 full-time employees and 430 part-time/seasonal employees.
Human Resources is a division of the City Manager’s Office and we manage and oversee the following program areas: Recruitment and Selection, Classification and Compensation, Employee Benefits Administration, Labor Relations, and Employee Training and Development.
Initiative
They are in the last year of their Strategic Plan they call Santa Clarita 2020. They have 52 items on their strategic plan and their full document plan discusses how they established the plan, details on the action items and the quality of life values they established.
In addition to this plan, they have several other initiatives/programs related to employee engagement
� They conduct an employee survey every 2 years. The results are shared with leadership who are expected to come with action plans to address concerns/issues.
� Employee run wellness committee. There is no budget provided to this committee. They raise money through employee donations/events throughout the year. The employees decided what events they want to hold. They have done workshops on cooking, financial, etc. They also select a non-profit each year and part of the funds raised are donated to this non-profit.
� Training and Development Programs that are designed towards the core competencies. They have core competencies for every position and all training programs are designed to help improve in these competencies
Leadership Academy--18 months program taught by internal staff, by application only
Job Rotations
Interim Job Assignments
Onboarding process
Supervisory series
Trade support series
Professional Support series
Job shadowing program held 2x year, helps with organizational awareness by putting employees with other employees in different areas to learn about different jobs in the organization
Internship Program--Helps with succession planning. Their current city manager started out as an intern over 10 years ago

2019 IPMA-HR Benchmarking Report Employee Engagement & Retention
25
Case Study 2Case Study 2
Irvine Ranch Water District Values Project Organization Irvine Ranch Water District
Contact Lisa Srader Sr. Human Resources Analyst
Organization Profile Established in 1961 as a California Water District, the Irvine Ranch Water District is an independent special district serving Central Orange County, California. IRWD provides high-quality drinking water, reliable wastewater collection and treatment, ground-breaking recycled water programs, and environmentally sound urban runoff treatment to more than 380,000 residents. As an independent, not-for-profit public agency, IRWD is governed by a five-member publicly elected Board of Directors. Board members are elected at-large for four-year terms. The Board is responsible for the District's policies and decision-making. Day-to-day operations are supervised by the General Manager.
InitiativeTheir project was called the Values Project and they utilized a consultant for this project. The consultant did an online survey and only brought up issues to managers that were mentioned more than once. Any one-offs were not included. If something was brought up multiple times, they addressed directly with that management team and HR as appropriate. The consultant also randomly selected some employees for a 1-1 meeting so they could share any additional information about their work experience, management, etc. There were many people who weren’t selected that wanted to talk with the consultant and she made herself available to anyone that wanted to talk.
After they received the results of their survey and focus groups an all-day offsite meeting with all managers, directors, executive directors and HR was held. This was facilitated by the consultant.
Each Director/Executive Director was to review their results prior to the meeting and come up with a plan for their areas. This was shared at this offsite meeting with the others. They also went through their top issues as a group. They brainstormed ways to resolve the issues.
Next Steps
They have implemented some of the ideas from the meeting to see what will work. A couple of pilots they started is HR Hours in other locations throughout their organization, as well as created a Supervisor 101 to explain different processes (performance evaluation, recruitment, etc.) to supervisors, they are also working on ideas for communication. They still have big changes to work on such as the performance evaluation and recruitment processes.
Lessons Learned:
� Be prepared for situation that come up that you didn’t plan for
� Make sure that all staff know you are continuing to work on the project even if they aren’t hearing about specific things
� Make connections between the changes you are making, and the feedback staff provided

International Public Management Association for Human Resources
1617 Duke Street, Alexandria, VA 22314
P: 703.549.7100 | F: 703.684.0948 www.ipma-hr.org