2019 pennsylvania sat suite of assessments annual report
TRANSCRIPT

Pennsylvania
-100064
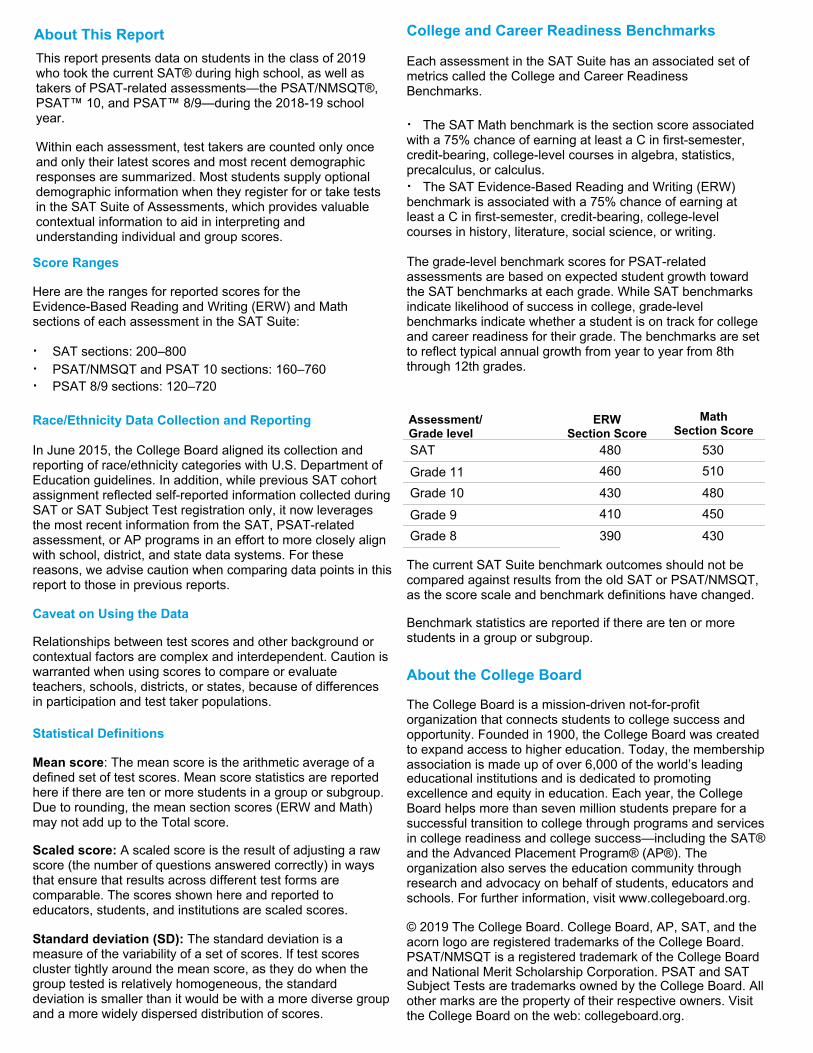
Statistical Definitions
Mean score: The mean score is the arithmetic average of adefined set of test scores. Mean score statistics are reportedhere if there are ten or more students in a group or subgroup.Due to rounding, the mean section scores (ERW and Math)may not add up to the Total score.
Scaled score: A scaled score is the result of adjusting a rawscore (the number of questions answered correctly) in waysthat ensure that results across different test forms arecomparable. The scores shown here and reported toeducators, students, and institutions are scaled scores.
Standard deviation (SD): The standard deviation is ameasure of the variability of a set of scores. If test scorescluster tightly around the mean score, as they do when thegroup tested is relatively homogeneous, the standarddeviation is smaller than it would be with a more diverse groupand a more widely dispersed distribution of scores.
College and Career Readiness Benchmarks
Each assessment in the SAT Suite has an associated set ofmetrics called the College and Career ReadinessBenchmarks.
· The SAT Math benchmark is the section score associatedwith a 75% chance of earning at least a C in first-semester,credit-bearing, college-level courses in algebra, statistics,precalculus, or calculus.· The SAT Evidence-Based Reading and Writing (ERW)benchmark is associated with a 75% chance of earning atleast a C in first-semester, credit-bearing, college-levelcourses in history, literature, social science, or writing.
The grade-level benchmark scores for PSAT-relatedassessments are based on expected student growth towardthe SAT benchmarks at each grade. While SAT benchmarksindicate likelihood of success in college, grade-levelbenchmarks indicate whether a student is on track for collegeand career readiness for their grade. The benchmarks are setto reflect typical annual growth from year to year from 8ththrough 12th grades.
The current SAT Suite benchmark outcomes should not becompared against results from the old SAT or PSAT/NMSQT,as the score scale and benchmark definitions have changed.
Benchmark statistics are reported if there are ten or morestudents in a group or subgroup.
About the College Board
The College Board is a mission-driven not-for-profitorganization that connects students to college success andopportunity. Founded in 1900, the College Board was createdto expand access to higher education. Today, the membershipassociation is made up of over 6,000 of the world’s leadingeducational institutions and is dedicated to promotingexcellence and equity in education. Each year, the CollegeBoard helps more than seven million students prepare for asuccessful transition to college through programs and servicesin college readiness and college success—including the SAT®and the Advanced Placement Program® (AP®). Theorganization also serves the education community throughresearch and advocacy on behalf of students, educators andschools. For further information, visit www.collegeboard.org.
© 2019 The College Board. College Board, AP, SAT, and theacorn logo are registered trademarks of the College Board.PSAT/NMSQT is a registered trademark of the College Boardand National Merit Scholarship Corporation. PSAT and SATSubject Tests are trademarks owned by the College Board. Allother marks are the property of their respective owners. Visitthe College Board on the web: collegeboard.org.
SAT
Grade 11
Grade 10
Grade 9
Grade 8
530480
510460
480430
450410
430390
Score Ranges
Here are the ranges for reported scores for theEvidence-Based Reading and Writing (ERW) and Mathsections of each assessment in the SAT Suite:
· SAT sections: 200–800· PSAT/NMSQT and PSAT 10 sections: 160–760· PSAT 8/9 sections: 120–720
Race/Ethnicity Data Collection and Reporting
In June 2015, the College Board aligned its collection andreporting of race/ethnicity categories with U.S. Department ofEducation guidelines. In addition, while previous SAT cohortassignment reflected self-reported information collected duringSAT or SAT Subject Test registration only, it now leveragesthe most recent information from the SAT, PSAT-relatedassessment, or AP programs in an effort to more closely alignwith school, district, and state data systems. For thesereasons, we advise caution when comparing data points in thisreport to those in previous reports.
Caveat on Using the Data
Relationships between test scores and other background orcontextual factors are complex and interdependent. Caution iswarranted when using scores to compare or evaluateteachers, schools, districts, or states, because of differencesin participation and test taker populations.
Assessment/Grade level
ERWSection Score
MathSection Score
This report presents data on students in the class of 2019who took the current SAT® during high school, as well astakers of PSAT-related assessments—the PSAT/NMSQT®,PSAT™ 10, and PSAT™ 8/9—during the 2018-19 schoolyear.
Within each assessment, test takers are counted only onceand only their latest scores and most recent demographicresponses are summarized. Most students supply optionaldemographic information when they register for or take testsin the SAT Suite of Assessments, which provides valuablecontextual information to aid in interpreting andunderstanding individual and group scores.
About This Report

2019 SAT Suite Annual Report Pennsylvania
259,755 test takers completed the SAT or a PSAT‐relatedassessment (PSAT/NMSQT, PSAT 10, or PSAT 8/9) in the 2018-19
school year.
SAT Takers¹High School Graduates²SAT Participation Rate
137,70995,794
70%
Class of 2019
PSAT/NMSQT Takers³11th-Grade Enrollment²Participation Rate
144,14277,696
54%
Class of 2020
PSAT/NMSQT or PSAT 10 Takers³10th-Grade Enrollment²Participation Rate
153,37072,275
47%
Class of 2021
PSAT 8/9 Takers³9th-Grade Enrollment²Participation Rate
159,09721,615
14%
Class of 2022
PSAT 8/9 Takers³8th-Grade Enrollment²Participation Rate
148,9022%
2,901
Class of 2023
SAT Suite Participation Summary
The SAT Suite of Assessments — the SAT (grades 12 and 11), PSAT/NMSQT and PSAT 10 (grades 11 and 10), and PSAT8/9 (grades 9 and 8) — measures a student’s college and career readiness. Together, these assessments provide acomprehensive solution that systematically and progressively measures the knowledge, skills, and understandings essentialfor success in college and career.
¹ Reflects 2019 high school graduates who took the current SAT during high school.² Knocking at the College Door, WICHE, December 2016.³ PSAT‐related assessment data reflect students who tested during the 2018-19 school year.
70% of graduatesin the class of 2019took the SAT duringhigh school
47% of 10th graderstook thePSAT/NMSQT orPSAT 10in 2018-19
14% of 9th graderstook the PSAT 8/9in 2018-19
2% of 8th graderstook the PSAT 8/9in 2018-19
54% of 11th graderstook thePSAT/NMSQT lastfall

SAT Participation and Performance
Number Percent Total ERW Math Both ERW Math None
Female
Male
No Response 86%
23%
23%
10%
58%
48%
14%
75%
75%
10%
55%
46%
396
551
525
409
546
545
805
1097
1070
0%
46%
54%
29
43,902
51,863
Number Percent Total ERW Math Both ERW Math None
American Indian/Alaska Native
Asian
Black/African American
Hispanic/Latino
Native Hawaiian/Other Pacific Islander
White
Two or More Races
No Response 52%
25%
15%
45%
42%
58%
14%
49%
28%
47%
60%
29%
31%
18%
77%
29%
46%
74%
84%
52%
56%
41%
81%
47%
26%
45%
58%
26%
29%
17%
71%
25%
466
528
554
478
481
447
621
477
479
543
564
484
498
464
581
479
945
1071
1119
962
979
911
1202
956
3%
4%
68%
0%
9%
10%
6%
0%
2,671
3,657
64,724
65
8,967
9,820
5,603
287
Sex
Race / Ethnicity
2019 SAT Suite Annual Report Pennsylvania
Test Takers Mean Score Met Benchmarks
Number Percent Total ERW Math Both ERW Math None
No High School Diploma
High School Diploma
Associate Degree
Bachelor's Degree
Graduate Degree
No Response 66%
10%
14%
25%
34%
54%
17%
71%
62%
45%
37%
26%
32%
89%
84%
73%
64%
43%
15%
70%
60%
43%
34%
22%
430
590
557
517
499
466
443
596
565
529
511
467
873
1186
1122
1046
1010
933
4%
23%
33%
8%
28%
4%
3,840
22,108
31,504
8,066
26,690
3,586
Highest Level of Parental Education
Test Takers Mean Score Met Benchmarks
Number Percent Total ERW Math Both ERW Math None
Used at any point
Did not use 18%
42%
58%
30%
80%
56%
56%
28%
551
484
558
497
1109
981
79%
21%
75,278
20,516
SAT Fee Waiver²
Test Takers Mean Score Met Benchmarks
Test Takers Mean Score Met Benchmarks
Number Percent Total ERW Math Both ERW Math None
Total
Took Essay¹ 15%
23%
63%
52%
84%
75%
61%
50%
566
537
574
545
1140
1082
47%45,457
95,794
Mean ScoreTest Takers Met Benchmarks
Data reflect 2019 high school graduates who took the current SAT during high school. If a student took the SAT more than once, themost recent score is summarized.
Number Percent Total ERW Math Both ERW Math None
English Only
English and Another Language
Another Language
No Response 69%
32%
33%
21%
17%
54%
46%
54%
29%
62%
65%
78%
15%
48%
44%
52%
426
553
529
539
438
523
528
551
864
1076
1057
1090
2%
5%
9%
85%
1,747
4,413
8,400
81,234
First Language Learned Test Takers Mean Score Met Benchmarks
Total
¹ Reflects the most recent essay of test takers who completed the SAT Essay at any point, not necessarily on the most recent test administration date.
² Reflects students who used a fee waiver for an SAT or Subject Test registration at any point. Caution is warranted if using fee waiver usage to estimate participation and performancefor low-income students. For example, fee-waiver usage will likely understate low-income participation in locations in which students participate in SAT School Day under a district orstate contract.

7,956
18,429
36,514
23,785
8,646
464
537
107
8%
19%
38%
25%
9%
SAT Participation and Performance: Score Distributions
2019 SAT Suite Annual Report Pennsylvania
Total and Section Scores
1400–1600 6,017
1200–1390 20,939
1000–1190 36,932
800–990 24,835
600–790 6,861
400–590 210
Mean 1082
SD 195
6%
22%
39%
26%
7%
700–800 6,262
600–690 24,522
500–590 34,698
400–490 24,005
300–390 6,042
200–290 265
Mean 545
SD 98
7%
26%
36%
25%
6%
35–40
30–34
25–29
20–24
15–19
10–14
Mean
SD
8,4887,334
27,84124,074
32,59837,524
20,62020,673
5,8475,665
400524
2827
55
Analysis inHistory/SocialStudies
Analysis inScience
13–15
10–12
7–9
4–6
1–3
Mean
SD 3
9
2,921
17,936
36,168
26,238
12,531
3
9
5,681
15,827
30,146
30,240
13,900
3
9
1,958
14,867
41,929
26,784
10,256
3
9
3,650
23,500
30,900
27,247
10,497
3
9
1,128
13,349
34,415
32,657
14,245
3
9
554
14,487
36,942
31,635
12,176
3
9
2,918
12,151
30,988
38,749
10,988
Words inContext
Commandof Evidence
Expressionof Ideas
StandardEnglish
ConventionsHeart ofAlgebra
ProblemSolvingand DataAnalysis
Passport toAdvanced Mathematics
Reading
Analysis
Writing 1
1
1
5
4
5
730
11,760
1,582
1,443
9,308
3,110
9,707
14,130
13,299
9,553
6,764
11,229
20,843
3,039
14,190
2,524
411
1,682
657
45
365
8 7 6 5 4 3 2 Mean SD
Subscores
Essay¹
¹ Reflects the most recent essay of test takers who completed the SAT Essay at any point, not necessarily on the most recent test administration date.
35–40
30–34.5
25–29.5
20–24.5
15–19.5
10–14.5
Mean
SD 5
27
464
8,646
23,785
36,514
18,429
7,956
5
27
472
7,199
24,459
31,673
24,485
7,506
5
27
327
4,981
21,252
34,853
27,055
7,326
ReadingWriting andLanguage Math
Cross-Test Scores
_________________________________________________________
_____________________________________ _________________________________________________
______________________________________________________________________________________________
Total Score ERW Math
Test Scores
Data reflect 2019 high school graduates who took the current SAT during high school. If a student took the SAT more than once,the most recent score is summarized.

3,65764,724658,9679,8205,60328743,90251,86395,794
SAT Participation and Performance: Score Distributions by Subgroup
2019 SAT Suite Annual Report Pennsylvania
¹ The Math test score is found by dividing the Math section score by 20.
Data reflect 2019 high school graduates who took the current SAT during high school. If a student took the SAT more than once, themost recent score is summarized.
Total Score
AmericanIndian
TotalStudents Female Male
AfricanAmerican HispanicAsian
NativeHawaiian White
Two orMoreRaces
700–800
600–690
500–590
400–490
300–390
200–290 0%
5%
29%
35%
23%
7%
0%
2%
20%
40%
30%
7%
2%
23%
29%
31%
14%
2%
1%
15%
36%
30%
15%
3%
1%
21%
45%
24%
8%
1%
0%
5%
18%
29%
31%
17%
1%
16%
45%
28%
9%
1%
0%
7%
24%
35%
26%
7%
0%
6%
26%
37%
25%
6%
0%
6%
25%
36%
26%
7%
Section Scores - ERW
700–800 (35–40)
600–690 (30–34.5)
500–590 (25–29.5)
400–490 (20–24.5)
300–390 (15–19.5)
200–290 (10–14.5) 0%
9%
29%
37%
16%
8%
0%
4%
22%
43%
23%
8%
2%
18%
34%
35%
9%
2%
1%
20%
35%
31%
10%
3%
2%
29%
40%
23%
5%
1%
0%
5%
12%
25%
25%
33%
2%
18%
34%
34%
8%
2%
1%
8%
21%
37%
22%
11%
0%
10%
28%
39%
17%
6%
0%
9%
25%
38%
19%
8%
Section (Test) Scores - Math¹
35–40
30–34
25–29
20–24
15–19
10–14 0%
4%
25%
36%
26%
9%
0%
2%
17%
39%
33%
9%
2%
15%
31%
35%
14%
3%
1%
12%
33%
34%
17%
4%
2%
18%
41%
29%
10%
1%
0%
5%
18%
29%
32%
17%
1%
12%
40%
32%
12%
2%
0%
5%
21%
35%
29%
9%
0%
5%
23%
38%
27%
7%
0%
5%
22%
36%
28%
8%
Test Scores - Reading
35–40
30–34
25–29
20–24
15–19
10–14 0%
7%
29%
33%
23%
8%
0%
3%
22%
37%
30%
8%
2%
22%
37%
22%
18%
0%
1%
16%
36%
28%
15%
4%
2%
23%
42%
22%
9%
1%
0%
6%
17%
25%
31%
20%
1%
18%
47%
21%
12%
1%
1%
8%
26%
32%
25%
8%
0%
7%
25%
34%
26%
8%
0%
8%
26%
33%
26%
8%
Test Scores - Writing and Language
Test Takers
1400–1600
1200–1390
1000–1190
800–990
600–790
400–590 0%
7%
31%
37%
18%
7%
0%
2%
22%
44%
26%
6%
0%
26%
29%
32%
11%
2%
0%
17%
38%
31%
11%
3%
1%
25%
45%
23%
5%
1%
0%
4%
15%
27%
30%
23%
0%
18%
43%
29%
9%
2%
0%
7%
24%
37%
24%
8%
0%
7%
28%
40%
20%
5%
0%
7%
26%
39%
22%
6%

Data reflect 2019 high school graduates who took the current SAT during high school. If a student took the SAT more than once, themost recent score is summarized.
Agriculture, Agriculture Operations, and Related Sciences
Architecture and Related Services
Area, Ethnic, Cultural, and Gender Studies
Biological and Biomedical Sciences
Business, Management, Marketing, and Related Support Services
Communication, Journalism, and Related Programs
Computer and Information Sciences and Support Services
Construction Trades, General
Education
Engineering
Engineering Technologies/Technicians
English Language and Literature/Letters
Family and Consumer Sciences/Human Sciences
Foreign Languages and Literatures, General
Health Professions and Related Clinical Sciences
History, General
Legal Studies, General
Liberal Arts and Sciences, General Studies and Humanities
Library Science/Librarianship
Mathematics and Statistics
Mechanic and Repair Technologies/Technicians
Military Technologies
Multi/Interdisciplinary Studies
Natural Resources and Conservation
Parks, Recreation and Leisure Studies
Personal And Culinary Services, General
Philosophy and Religious Studies
Physical Sciences
Precision Production
Psychology, General
Public Administration and Social Service Professions
Security and Protective Services
Social Sciences
Theology and Religious Vocations
Transportation and Materials Moving
Visual and Performing Arts, General
Other
Undecided 546
493
520
525
545
572
496
496
515
610
562
477
502
554
593
520
495
645
532
549
542
530
529
561
495
541
544
606
515
491
580
521
546
571
499
548
505
554
507
552
527
567
602
512
525
547
604
589
488
505
576
603
527
491
600
586
582
569
576
540
590
516
599
530
583
533
500
573
555
543
579
536
541
519
1100
1000
1072
1052
1112
1174
1008
1021
1062
1213
1151
965
1007
1129
1196
1046
986
1245
1119
1131
1111
1106
1069
1151
1011
1140
1074
1189
1048
991
1153
1076
1089
1150
1035
1090
1024
7%
1%
6%
0%
0%
2%
3%
0%
4%
0%
2%
0%
0%
1%
1%
0%
0%
0%
1%
0%
0%
2%
1%
20%
1%
0%
1%
1%
10%
6%
0%
4%
2%
13%
9%
0%
1%
1%
5,555
1,092
5,020
48
87
1,464
2,832
323
3,630
9
1,405
113
181
531
567
102
251
157
922
14
392
1,611
723
16,438
472
241
795
1,095
8,095
4,744
113
3,561
1,908
10,666
7,257
92
1,004
766
2019 SAT Suite Annual Report Pennsylvania
SAT Participation and Performance: Intended College Major and Degree-Level Goal
Intended College Major Test Takers Percent Total ERW Math
Mean Score
Certificate Program
Associate Degree
Bachelor's Degree
Master's Degree
Doctoral or Related Degree
Other
Undecided 540
463
580
560
521
456
470
550
472
588
567
531
470
475
1090
935
1167
1127
1053
926
946
14%
0%
19%
30%
34%
2%
1%
11,658
392
15,937
25,219
27,948
1,427
556
Degree-Level Goal

Penn State University Park PA Public College
Temple University PA Public College
University of Pittsburgh PA Public College
West Chester University of Pennsylvania PA Public College
Drexel University PA Private College
Bloomsburg University of Pennsylvania PA Public College
Indiana University of Pennsylvania PA Public College
Kutztown University of Pennsylvania PA Public College
Millersville University of Pennsylvania PA Public College
University of Pennsylvania PA Private College
Shippensburg University of Pennsylvania PA Public College
NCAA Eligibility Center IN Public College
University of Delaware DE Public College
Villanova University PA Private College
Duquesne University PA Private College
Slippery Rock University of Pennsylvania PA Public College
Robert Morris University PA Private College
Lehigh University PA Private College
Arcadia University PA Private College
West Virginia University WV Public College
La Salle University PA Private College
Saint Joseph's University PA Private College
Carnegie Mellon University PA Private College
New York University NY Private College
Widener University PA Private College
East Stroudsburg University of Pennsylvania PA Public College
University of Scranton PA Private College
Boston University MA Private College
Cornell University NY Private College
University of Maryland: College Park MD Public College
Ohio State University: Columbus Campus OH Public College
California University of Pennsylvania PA Public College
Thomas Jefferson University: East Falls PA Private College
Bucknell University PA Private College
University of Michigan MI Public College
York College of Pennsylvania PA Private College
Northeastern University MA Private College
Syracuse University NY Private College
Princeton University NJ Private College
Lock Haven University of Pennsylvania PA Public College
Fordham University NY Private College
University of North Carolina at Chapel Hill NC Public College
Edinboro University of Pennsylvania PA Public College
Wilkes University PA Private College
Clarion University of Pennsylvania PA Public College
38.9%26,815
19.7%13,563
19.2%13,197
16.0%11,028
11.7%8,031
8.7%5,966
8.2%5,670
7.0%4,825
6.6%4,551
6.4%4,431
6.2%4,275
6.2%4,273
5.3%3,668
5.3%3,642
5.0%3,439
4.8%3,323
4.7%3,203
4.6%3,137
4.3%2,928
4.1%2,819
4.0%2,748
3.8%2,592
3.6%2,511
3.6%2,507
3.5%2,444
3.5%2,405
3.0%2,063
3.0%2,052
2.8%1,948
2.8%1,927
2.7%1,880
2.6%1,812
2.6%1,775
2.5%1,742
2.4%1,633
2.3%1,613
2.3%1,601
2.3%1,585
2.3%1,554
2.2%1,500
2.1%1,459
2.1%1,423
2.1%1,413
2.0%1,382
2.0%1,364
¹ Of students who designated that their SAT score reports be sent to institutions, the 'Percent of Score Senders' indicates the percent of those students who had their scores sent toeach institution listed.
Of the 95,794 students from Pennsylvania who took the SAT, 68,868 designated that their score reports be sent to institutions.Students may designate more than one institution to receive scores. This list includes only the institutions that received the mostscore reports. A total of 3,132 institutions received score reports from Pennsylvania students.
2019 SAT Suite Annual Report Pennsylvania
Institution State Type Number of Students % of Score Senders¹
SAT Score Sending: Institutions That Received the Most SAT Score Reports from Pennsylvania
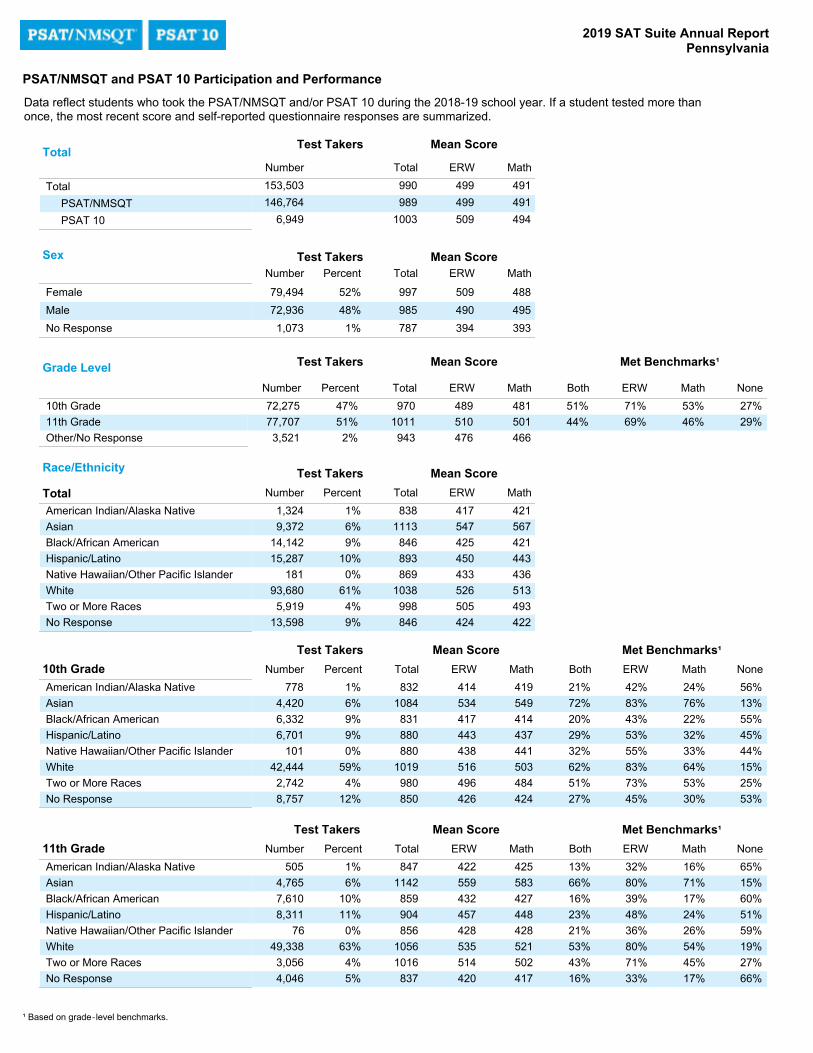
PSAT/NMSQT and PSAT 10 Participation and Performance
2019 SAT Suite Annual Report Pennsylvania
Number Total ERW Math
Total
PSAT/NMSQT
PSAT 10 494
491
491
509
499
499
1003
989
990
6,949
146,764
153,503
Test Takers Mean Score
Number Percent Total ERW Math
Female
Male
No Response 393
495
488
394
490
509
787
985
997
1%
48%
52%
1,073
72,936
79,494
Sex Test Takers Mean Score
Number Percent Total ERW Math Both ERW Math None
10th Grade11th GradeOther/No Response
29%27%
46%53%
69%71%
44%51%
466501481
476510489
9431011970
2%51%47%
3,52177,70772,275
Grade Level Test Takers Mean Score Met Benchmarks¹
Number Percent Total ERW Math
American Indian/Alaska NativeAsianBlack/African AmericanHispanic/LatinoNative Hawaiian/Other Pacific IslanderWhiteTwo or More RacesNo Response 422
493513436443421567421
424505526433450425547417
84699810388698938461113838
9%4%61%0%10%9%6%1%
13,5985,91993,680181
15,28714,1429,3721,324
Test Takers Mean ScoreRace/Ethnicity
Number Percent Total ERW Math Both ERW Math None
American Indian/Alaska NativeAsianBlack/African AmericanHispanic/LatinoNative Hawaiian/Other Pacific IslanderWhiteTwo or More RacesNo Response 53%
25%15%44%45%55%13%56%
30%53%64%33%32%22%76%24%
45%73%83%55%53%43%83%42%
27%51%62%32%29%20%72%21%
424484503441437414549419
426496516438443417534414
85098010198808808311084832
12%4%59%0%9%9%6%1%
8,7572,74242,4441016,7016,3324,420778
Test Takers Mean Score Met Benchmarks¹
Number Percent Total ERW Math Both ERW Math None
American Indian/Alaska NativeAsianBlack/African AmericanHispanic/LatinoNative Hawaiian/Other Pacific IslanderWhiteTwo or More RacesNo Response 66%
27%19%59%51%60%15%65%
17%45%54%26%24%17%71%16%
33%71%80%36%48%39%80%32%
16%43%53%21%23%16%66%13%
417502521428448427583425
420514535428457432559422
837101610568569048591142847
5%4%63%0%11%10%6%1%
4,0463,05649,33876
8,3117,6104,765505
Test Takers Mean Score Met Benchmarks¹
¹ Based on grade‐level benchmarks.
Data reflect students who took the PSAT/NMSQT and/or PSAT 10 during the 2018-19 school year. If a student tested more thanonce, the most recent score and self-reported questionnaire responses are summarized.
Total
10th Grade
11th Grade
Total

PSAT/NMSQT and PSAT 10 Participation and Performance
2019 SAT Suite Annual Report Pennsylvania
Number Percent Total ERW Math Both ERW Math None
English OnlyEnglish and Another LanguageAnother LanguageNo Response 51%
34%31%22%
32%50%50%57%
46%60%67%76%
29%45%47%55%
429486481489
429468482500
858954963989
12%3%11%74%
8,4722,3217,84753,635
Number Percent Total ERW Math Both ERW Math None
English OnlyEnglish and Another LanguageAnother LanguageNo Response 72%
39%38%25%
12%46%39%48%
26%55%60%73%
11%40%38%47%
402506492507
402482494519
8049899851026
4%4%11%81%
3,0493,4828,24862,928
Number Percent Total ERW Math Both ERW Math None
No High School DiplomaHigh School DiplomaAssociate DegreeBachelor's DegreeGraduate DegreeNo Response 53%
10%13%27%35%54%
29%74%67%48%39%27%
45%88%84%70%62%43%
26%73%64%45%37%23%
423533508469453426
424546519476459420
84710801027946912846
17%20%31%5%23%4%
12,38514,50422,4273,83316,5562,570
Number Percent Total ERW Math Both ERW Math None
No High School DiplomaHigh School DiplomaAssociate DegreeBachelor's DegreeGraduate DegreeNo Response 75%
11%17%31%42%62%
10%68%57%37%30%20%
23%87%81%67%56%36%
8%66%55%35%28%18%
396558525482464436
396571537494471428
79211291063976936864
6%23%32%7%28%5%
4,49717,52724,8005,56321,7753,545
Number Percent Total ERW Math Both ERW Math None
A+ (97–100)A (93–96)A- (90–92)B (80–89)C (70–79)D, E, or F (below 70)No Response 51%
81%70%36%14%9%6%
32%6%12%35%62%75%86%
46%18%27%61%83%89%93%
29%5%9%32%60%74%85%
429374395447496527563
430369391451507542576
859743785898100210691139
13%1%5%29%19%25%9%
9,1263703,91420,84113,59018,0196,415
Number Percent Total ERW Math Both ERW Math None
A+ (97–100)A (93–96)A- (90–92)B (80–89)C (70–79)D, E, or F (below 70)No Response 70%
82%70%39%18%11%7%
13%5%10%29%54%68%82%
28%17%28%58%81%87%93%
12%4%8%26%52%67%81%
406376412465518552591
407377411473530565603
813753823938104811171194
5%0%7%35%20%24%9%
3,7313875,28027,34515,28318,3987,283
First Language Learned
11th Grade
Highest Level of Parental Education
11th Grade
High School Grade Point Average
11th Grade
Test Takers Mean Score
Test Takers Mean Score Met Benchmarks¹
Test Takers Mean Score Met Benchmarks¹
Test Takers Mean Score Met Benchmarks¹
Test Takers Mean Score Met Benchmarks¹
Test Takers Mean Score Met Benchmarks¹
¹ Based on grade‐level benchmarks.
10th Grade
10th Grade
10th Grade
Met Benchmarks¹
Data reflect students who took the PSAT/NMSQT and/or PSAT 10 during the 2018-19 school year. If a student tested more than once,the most recent score and self-reported questionnaire responses are summarized.

3,05649,338768,3117,6104,76550537,36940,12277,707
35–38
30–34
25–29
20–24
15–19
8–14 3%
15%
25%
33%
19%
6%
1%
10%
22%
36%
24%
6%
13%
33%
26%
18%
3%
7%
6%
29%
29%
24%
10%
2%
10%
32%
30%
20%
6%
1%
2%
10%
17%
26%
27%
18%
9%
37%
33%
17%
4%
0%
4%
19%
24%
29%
18%
5%
2%
13%
24%
33%
22%
6%
3%
16%
24%
31%
20%
6%
35–38
30–34
25–29
20–24
15–19
8–14 1%
13%
22%
39%
20%
5%
0%
7%
20%
42%
24%
6%
4%
37%
30%
20%
5%
4%
2%
27%
29%
29%
11%
2%
4%
32%
32%
24%
7%
1%
1%
8%
17%
33%
27%
15%
2%
33%
37%
23%
3%
0%
1%
16%
23%
35%
19%
6%
1%
12%
23%
39%
21%
5%
1%
14%
23%
37%
20%
5%
700–760 (35–38)
600–690 (30–34.5)
500–590 (25–29.5)
400–490 (20–24.5)
300–390 (15–19.5)
160–290 (8–14.5) 1%
12%
38%
31%
12%
6%
1%
7%
34%
38%
15%
5%
8%
34%
32%
22%
1%
3%
4%
26%
42%
20%
5%
2%
5%
32%
43%
16%
3%
1%
1%
5%
20%
27%
21%
25%
5%
31%
46%
17%
2%
0%
2%
14%
32%
31%
14%
7%
2%
13%
38%
32%
11%
4%
2%
13%
35%
31%
13%
5%
700–760
600–690
500–590
400–490
300–390
160–290 1%
15%
26%
35%
18%
5%
0%
9%
24%
40%
23%
4%
7%
43%
22%
20%
3%
5%
2%
31%
31%
25%
10%
1%
5%
36%
34%
20%
5%
1%
1%
10%
18%
30%
28%
14%
3%
40%
36%
18%
2%
1%
2%
19%
25%
32%
18%
4%
1%
13%
26%
36%
20%
4%
1%
16%
25%
34%
19%
4%
1400–1520
1200–1390
1000–1190
800–990
600–790
320–590 1%
13%
34%
34%
15%
4%
0%
7%
29%
42%
19%
3%
4%
39%
34%
16%
4%
3%
2%
30%
37%
23%
7%
1%
4%
36%
38%
18%
4%
0%
0%
7%
20%
31%
26%
17%
3%
37%
44%
15%
1%
0%
1%
17%
29%
32%
16%
4%
1%
13%
32%
37%
15%
3%
1%
15%
31%
35%
15%
3%
PSAT/NMSQT and PSAT 10 Participation and Performance: Score Distributions by Subgroup - 11th Grade
2019 SAT Suite Annual Report Pennsylvania
¹ The Math test score is found by dividing the Math section score by 20.
Total Score
AmericanIndian
TotalStudents Female Male
AfricanAmerican HispanicAsian
NativeHawaiian White
Section Scores - ERW
Section (Test) Scores - Math¹
Test Scores - Reading
Test Scores - Writing and Language
Test Takers
Two orMoreRaces
Data reflect students who took the PSAT/NMSQT and/or PSAT 10 during the 2018-19 school year. If a student tested more than once,the most recent score and self-reported questionnaire responses are summarized.

2,74242,4441016,7016,3324,42077834,16137,71272,275
35–38
30–34
25–29
20–24
15–19
8–14 4%
18%
27%
31%
18%
2%
1%
12%
26%
38%
20%
3%
8%
30%
30%
28%
5%
0%
7%
32%
30%
22%
8%
1%
11%
36%
30%
18%
5%
0%
2%
12%
20%
33%
26%
7%
10%
40%
32%
16%
2%
0%
6%
23%
27%
29%
14%
2%
3%
15%
26%
35%
18%
3%
4%
19%
27%
32%
16%
2%
35–38
30–34
25–29
20–24
15–19
8–14 1%
16%
25%
38%
17%
3%
0%
9%
24%
43%
19%
3%
5%
26%
39%
23%
7%
1%
3%
30%
32%
26%
8%
1%
5%
37%
32%
22%
5%
0%
1%
9%
20%
38%
25%
7%
3%
37%
35%
22%
2%
0%
2%
21%
27%
34%
15%
3%
1%
14%
26%
40%
16%
3%
1%
17%
26%
37%
16%
3%
700–760 (35–38)
600–690 (30–34.5)
500–590 (25–29.5)
400–490 (20–24.5)
300–390 (15–19.5)
160–290 (8–14.5) 2%
15%
41%
29%
10%
3%
1%
9%
38%
38%
12%
2%
5%
29%
42%
19%
4%
2%
5%
30%
42%
19%
4%
1%
7%
36%
42%
13%
2%
0%
1%
6%
25%
35%
21%
12%
4%
38%
43%
14%
1%
0%
3%
18%
35%
30%
11%
3%
2%
15%
41%
32%
8%
2%
3%
17%
38%
31%
9%
2%
700–760
600–690
500–590
400–490
300–390
160–290 2%
18%
28%
34%
16%
2%
0%
11%
28%
41%
18%
2%
4%
30%
38%
24%
5%
0%
3%
35%
32%
23%
7%
1%
6%
40%
32%
18%
4%
0%
1%
11%
22%
36%
25%
5%
3%
44%
36%
16%
1%
0%
2%
24%
28%
30%
13%
1%
1%
16%
29%
37%
16%
2%
2%
20%
28%
34%
15%
2%
1400–1520
1200–1390
1000–1190
800–990
600–790
320–590 1%
17%
35%
33%
12%
1%
0%
9%
34%
42%
13%
1%
1%
36%
41%
19%
4%
0%
2%
34%
38%
21%
4%
0%
4%
42%
38%
14%
2%
0%
0%
8%
24%
38%
25%
6%
2%
44%
38%
15%
1%
0%
2%
22%
32%
31%
11%
1%
1%
16%
36%
36%
10%
1%
1%
19%
34%
34%
11%
1%
PSAT/NMSQT and PSAT 10 Participation and Performance: Score Distributions by Subgroup - 10th Grade
2019 SAT Suite Annual Report Pennsylvania
¹ The Math test score is found by dividing the Math section score by 20.
Total Score
AmericanIndian
TotalStudents Female Male
AfricanAmerican HispanicAsian
NativeHawaiian White
Section Scores - ERW
Section (Test) Scores - Math¹
Test Scores - Reading
Test Scores - Writing and Language
Test Takers
Two orMoreRaces
Data reflect students who took the PSAT/NMSQT and/or PSAT 10 during the 2018-19 school year. If a student tested more than once,the most recent score and self-reported questionnaire responses are summarized.

2019 SAT Suite Annual Report Pennsylvania
PSAT/NMSQT and PSAT 10 Participation and Performance: Intended College Major - 10th and 11th Grades
Agriculture, Agriculture Operations, and Related Sciences
Architecture and Related Services
Area, Ethnic, Cultural, and Gender Studies
Biological and Biomedical Sciences
Business, Management, Marketing, and Related Support Services
Communication, Journalism, and Related Programs
Computer and Information Sciences and Support Services
Construction Trades, General
Education
Engineering
Engineering Technologies/Technicians
English Language and Literature/Letters
Family and Consumer Sciences/Human Sciences
Foreign Languages and Literatures, General
Health Professions and Related Clinical Sciences
History, General
Legal Studies, General
Liberal Arts and Sciences, General Studies and Humanities
Library Science/Librarianship
Mathematics and Statistics
Mechanic and Repair Technologies/Technicians
Military Technologies
Multi/Interdisciplinary Studies
Natural Resources and Conservation
Parks, Recreation and Leisure Studies
Personal And Culinary Services, General
Philosophy and Religious Studies
Physical Sciences
Precision Production
Psychology, General
Public Administration and Social Service Professions
Security and Protective Services
Social Sciences
Theology and Religious Vocations
Transportation and Materials Moving
Visual and Performing Arts, General
Other
Undecided 8%
2%
7%
0%
0%
2%
4%
0%
4%
0%
1%
0%
0%
1%
1%
0%
0%
0%
1%
0%
0%
2%
1%
19%
1%
0%
1%
1%
10%
5%
0%
4%
2%
12%
8%
0%
1%
1%
5,702
1,305
4,692
12
71
1,206
2,603
260
2,645
3
1,012
125
102
364
429
90
276
45
735
13
243
1,262
536
12,665
367
271
556
1,022
6,531
3,366
34
2,796
1,401
8,147
5,710
81
985
746
13%
2%
7%
0%
0%
2%
4%
0%
3%
1%
0%
0%
1%
0%
0%
0%
1%
0%
2%
1%
19%
0%
0%
1%
2%
10%
4%
0%
4%
2%
9%
8%
0%
2%
1%
6,779
992
3,809
2
32
838
2,074
125
1,639
0
754
92
30
280
256
127
244
0
532
0
75
1,124
373
9,588
257
185
438
926
4,992
1,999
1
1,847
953
4,592
4,329
67
847
535
Percent Test Takers PercentIntended College Major Test Takers
11th Grade10th Grade
Data reflect students who took the PSAT/NMSQT and/or PSAT 10 during the 2018-19 school year. If a student tested more than once,the most recent score and self-reported questionnaire responses are summarized.

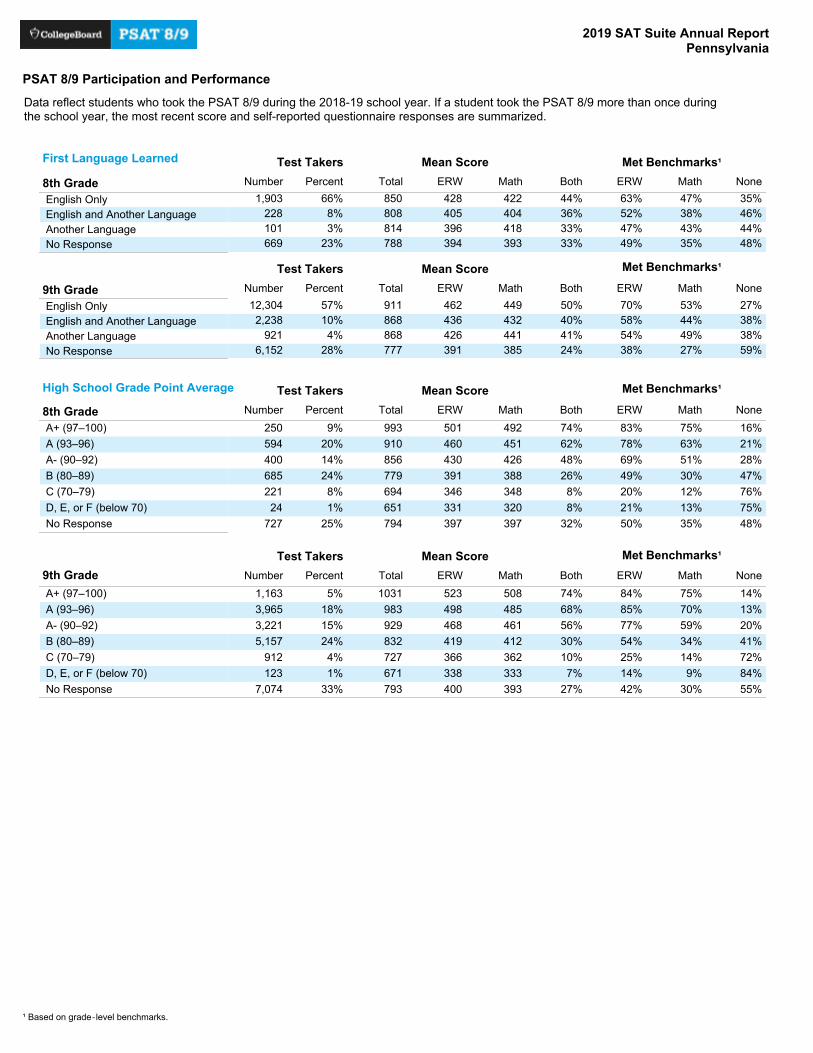
PSAT 8/9 Participation and Performance
2019 SAT Suite Annual Report Pennsylvania
¹Based on grade‐level benchmarks.
Number Total ERW Math
Total Fall Spring 434
425426
441433434
875859861
3,07821,87824,946
Number Percent Total ERW Math
FemaleMaleNo Response 364
427426
369424445
733852872
1%49%50%
24612,25512,445
Test Takers Mean Score
Sex Test Takers Mean Score
Number Percent Total ERW Math Both ERW Math None
8th Grade
9th Grade
Other / No Response
38%
39%
44%
43%
59%
58%
41%
41%
371
429
414
387
437
417
758
867
831
2%
87%
12%
430
21,615
2,901
Grade Level Test Takers Mean Score Met Benchmarks¹
Number Percent Total ERW Math
American Indian/Alaska NativeAsianBlack/African AmericanHispanic/LatinoNative Hawaiian/Other Pacific IslanderWhiteTwo or More RacesNo Response 383
437471404392383496382
388447484391402389479384
771884955796794772975766
27%4%39%0%11%12%5%1%
6,7349749,65838
2,7913,1151,355281
Mean ScoreRace/Ethnicity
Test Takers
Number Percent Total ERW Math Both ERW Math None
American Indian/Alaska NativeAsianBlack/African AmericanHispanic/LatinoNative Hawaiian/Other Pacific IslanderWhiteTwo or More RacesNo Response 47%
46%19%
45%68%27%63%
35%36%62%
33%18%64%25%
50%51%79%
52%29%66%37%
32%33%60%
31%15%56%25%
394400452
400359457385
394405463
405355451384
789805915
805713908769
23%6%40%0%9%18%3%2%
6531801,1502
2485219651
Test Takers Mean Score Met Benchmarks¹
Number Percent Total ERW Math Both ERW Math None
American Indian/Alaska NativeAsianBlack/African AmericanHispanic/LatinoNative Hawaiian/Other Pacific IslanderWhiteTwo or More RacesNo Response 59%
28%15%56%53%55%18%60%
25%52%65%25%27%24%72%23%
38%69%82%36%44%42%75%36%
22%49%62%17%24%20%65%19%
382447475402392388499381
389459488391402396482383
771906963794794784981765
27%4%39%0%12%12%6%1%
5,9117738,39136
2,5062,5201,250228
Test Takers Mean Score Met Benchmarks¹
Data reflect students who took the PSAT 8/9 during the 2018-19 school year. If a student took the PSAT 8/9 more than once duringthe school year, the most recent score and self-reported questionnaire responses are summarized.
Total
8th Grade
9th Grade
Total
PSAT 8/9 Participation and Performance
2019 SAT Suite Annual Report Pennsylvania
¹ Based on grade‐level benchmarks.
Number Percent Total ERW Math Both ERW Math None
English OnlyEnglish and Another LanguageAnother LanguageNo Response 48%
44%46%35%
35%43%38%47%
49%47%52%63%
33%33%36%44%
393418404422
394396405428
788814808850
23%3%8%66%
6691012281,903
First Language Learned Test Takers Mean Score Met Benchmarks¹
Number Percent Total ERW Math Both ERW Math None
English OnlyEnglish and Another LanguageAnother LanguageNo Response 59%
38%38%27%
27%49%44%53%
38%54%58%70%
24%41%40%50%
385441432449
391426436462
777868868911
28%4%10%57%
6,1529212,23812,304
9th Grade
Test Takers Mean Score Met Benchmarks¹
Number Percent Total ERW Math Both ERW Math None
A+ (97–100)A (93–96)A- (90–92)B (80–89)C (70–79)D, E, or F (below 70)No Response 48%
75%76%47%28%21%16%
35%13%12%30%51%63%75%
50%21%20%49%69%78%83%
32%8%8%26%48%62%74%
397320348388426451492
397331346391430460501
794651694779856910993
25%1%8%24%14%20%9%
72724221685400594250
Number Percent Total ERW Math Both ERW Math None
A+ (97–100)A (93–96)A- (90–92)B (80–89)C (70–79)D, E, or F (below 70)No Response 55%
84%72%41%20%13%14%
30%9%14%34%59%70%75%
42%14%25%54%77%85%84%
27%7%10%30%56%68%74%
393333362412461485508
400338366419468498523
7936717278329299831031
33%1%4%24%15%18%5%
7,0741239125,1573,2213,9651,163
High School Grade Point Average
Data reflect students who took the PSAT 8/9 during the 2018-19 school year. If a student took the PSAT 8/9 more than once duringthe school year, the most recent score and self-reported questionnaire responses are summarized.
Test Takers Mean Score Met Benchmarks¹
8th Grade
8th Grade
9th Grade
Test Takers Mean Score Met Benchmarks¹

7738,391362,5062,5201,25022810,72710,80821,615
35–36
30–34
25–29
20–24
15–19
6–14 4%
26%
34%
29%
6%
1%
1%
15%
33%
38%
11%
1%
3%
58%
25%
14%
0%
0%
13%
40%
30%
14%
3%
0%
12%
43%
31%
13%
2%
0%
2%
20%
33%
32%
11%
2%
14%
41%
34%
11%
0%
0%
11%
32%
28%
23%
5%
0%
6%
27%
31%
27%
8%
1%
9%
30%
30%
25%
6%
1%
35–36
30–34
25–29
20–24
15–19
6–14 2%
23%
34%
28%
12%
1%
1%
14%
34%
36%
15%
1%
6%
42%
39%
14%
0%
0%
5%
44%
31%
16%
4%
0%
5%
44%
33%
14%
3%
0%
1%
18%
27%
34%
19%
1%
7%
48%
35%
7%
2%
0%
5%
34%
29%
23%
9%
0%
3%
28%
32%
26%
10%
1%
4%
31%
31%
24%
9%
1%
700–720 (35–36)
600–690 (30–34.5)
500–590 (25–29.5)
400–490 (20–24.5)
300–390 (15–19.5)
120–290 (6–14.5) 5%
26%
36%
28%
6%
0%
2%
15%
41%
34%
7%
1%
6%
42%
42%
11%
0%
0%
13%
41%
33%
11%
1%
0%
11%
44%
35%
9%
1%
0%
2%
14%
30%
38%
15%
2%
12%
50%
29%
9%
0%
0%
10%
29%
34%
22%
5%
0%
8%
30%
37%
22%
4%
0%
9%
29%
35%
22%
4%
0%
700–720
600–690
500–590
400–490
300–390
120–290 2%
26%
35%
30%
7%
0%
1%
15%
37%
37%
11%
0%
6%
47%
36%
11%
0%
0%
8%
45%
31%
14%
3%
0%
8%
47%
32%
12%
1%
0%
1%
20%
32%
35%
12%
0%
10%
51%
31%
8%
0%
0%
7%
35%
31%
22%
5%
0%
4%
29%
33%
27%
7%
0%
6%
32%
32%
24%
6%
0%
1400–1440
1200–1390
1000–1190
800–990
600–790
240–590 3%
26%
38%
28%
5%
0%
1%
15%
41%
37%
6%
0%
6%
44%
39%
11%
0%
0%
9%
46%
32%
12%
1%
0%
8%
48%
35%
8%
0%
0%
1%
16%
34%
36%
12%
1%
9%
49%
34%
7%
0%
0%
8%
33%
34%
22%
4%
0%
5%
30%
37%
24%
4%
0%
6%
31%
35%
23%
4%
0%
PSAT 8/9 Participation and Performance: Score Distributions by Subgroup - 9th Grade
2019 SAT Suite Annual Report Pennsylvania
¹ The Math test score is found by dividing the Math section score by 20.
Total Score
AmericanIndian
TotalStudents Female Male
AfricanAmerican HispanicAsian
NativeHawaiian White
Section Scores - ERW
Section (Test) Scores - Math¹
Test Scores - Reading
Test Scores - Writing and Language
Test Takers
Data reflect students who took the PSAT 8/9 during the 2018-19 school year. If a student took the PSAT 8/9 more than once during theschool year, the most recent score and self-reported questionnaire responses are summarized.
Two orMoreRaces
1801,150224852196511,3721,4852,901
35–36
30–34
25–29
20–24
15–19
6–14 9%
45%
26%
17%
3%
0%
3%
23%
35%
31%
7%
1%
12%
43%
28%
14%
4%
0%
21%
53%
20%
6%
0%
0%
3%
34%
29%
21%
13%
0%
10%
53%
24%
12%
2%
0%
14%
38%
26%
18%
4%
0%
7%
35%
33%
20%
5%
1%
10%
36%
29%
19%
4%
0%
35–36
30–34
25–29
20–24
15–19
6–14 5%
41%
33%
16%
5%
0%
2%
20%
37%
28%
13%
1%
4%
47%
25%
17%
5%
1%
13%
58%
21%
7%
1%
0%
3%
32%
21%
29%
13%
2%
10%
49%
25%
16%
0%
0%
6%
39%
28%
20%
6%
0%
5%
35%
31%
20%
8%
0%
6%
37%
30%
20%
7%
0%
700–720 (35–36)
600–690 (30–34.5)
500–590 (25–29.5)
400–490 (20–24.5)
300–390 (15–19.5)
120–290 (6–14.5) 9%
42%
36%
12%
0%
1%
3%
22%
43%
28%
4%
0%
11%
37%
36%
15%
1%
0%
17%
54%
25%
3%
0%
0%
4%
26%
27%
34%
6%
2%
8%
51%
31%
10%
0%
0%
10%
34%
33%
20%
3%
0%
7%
37%
37%
16%
2%
0%
9%
36%
35%
18%
3%
0%
700–720
600–690
500–590
400–490
300–390
120–290 8%
47%
28%
14%
3%
0%
2%
22%
38%
29%
9%
0%
8%
46%
28%
16%
3%
0%
18%
57%
21%
4%
1%
0%
2%
35%
26%
26%
10%
0%
6%
59%
24%
10%
2%
0%
9%
40%
28%
18%
4%
0%
6%
36%
33%
19%
5%
0%
8%
38%
31%
19%
5%
0%
1400–1440
1200–1390
1000–1190
800–990
600–790
240–590 6%
48%
31%
13%
2%
0%
1%
23%
42%
29%
4%
0%
9%
42%
33%
14%
2%
0%
17%
57%
23%
3%
0%
0%
3%
29%
34%
28%
5%
0%
6%
57%
27%
10%
0%
0%
9%
38%
31%
18%
3%
0%
6%
38%
37%
18%
2%
0%
8%
38%
34%
18%
3%
0%
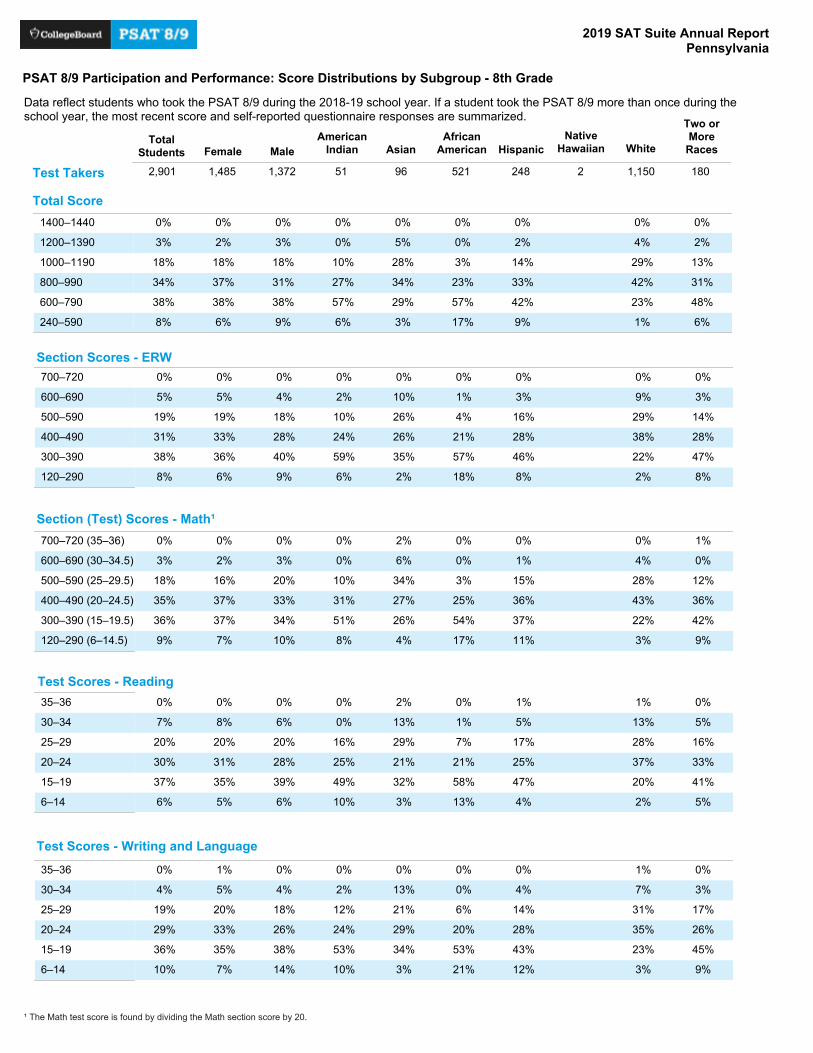
PSAT 8/9 Participation and Performance: Score Distributions by Subgroup - 8th Grade
2019 SAT Suite Annual Report Pennsylvania
¹ The Math test score is found by dividing the Math section score by 20.
Total Score
AmericanIndian
TotalStudents Female Male
AfricanAmerican HispanicAsian
NativeHawaiian White
Section Scores - ERW
Section (Test) Scores - Math¹
Test Scores - Reading
Test Scores - Writing and Language
Test Takers
Data reflect students who took the PSAT 8/9 during the 2018-19 school year. If a student took the PSAT 8/9 more than once during theschool year, the most recent score and self-reported questionnaire responses are summarized.
Two orMoreRaces

75th
50th
25th 24
28
31
24
27
31
23
26.5
30
23
27
31
24
28
31
460
530
600
470
550
620
950
1080
1210
SAT Suite Performance: Interquartile Ranges
MathTotal ERW Reading MathAnalysis inScience
75th
50th
25th 22
26
29
22
25
29
21.5
24.5
28.5
21
26
30
22
26
30
430
490
570
430
520
590
870
1010
1150
75th
50th
25th 21
24
28
21
25
28
20.5
24
27.5
20
24
29
21
25
28
410
480
550
410
490
560
830
970
1100
75th
50th
25th 18
22
26
18
21
25
18
21.5
25
17
22
25
18
22
26
360
430
500
360
430
510
720
860
1010
75th
50th
25th 17
21
24
17
20
24
17.5
20.5
24
17
20
24
17
21
25
350
410
480
340
410
490
690
820
960
SAT
PSAT/NMSQT and PSAT 10 - Grade 11
PSAT/NMSQT and PSAT 10 - Grade 10
PSAT 8/9 - Grade 9
PSAT 8/9 - Grade 8
Writing andLanguage
Analysis inHistory/SocialStudies
Section__________________
Percentile
Percentile
Percentile
Percentile
Percentile
Total
Total
Total
Total
ERW
ERW
ERW
ERW
Math
Math
Math
Math Reading
Reading
Reading
Reading
Writing andLanguage
Writing andLanguage
Writing andLanguage
Writing andLanguage
Math
Math
Math
Math
Analysis inHistory/SocialStudies
Analysis inHistory/SocialStudies
Analysis inHistory/SocialStudies
Analysis inHistory/SocialStudies
Analysis inScience
Analysis inScience
Analysis inScience
Analysis inScience
Section__________________
Section__________________
Section__________________
Section__________________
Comparing the 25th percentile point to the 75th percentile point gives an idea of the range of performance in a group. SAT data reflect2019 high school graduates who took the current SAT during high school. PSAT/NMSQT and PSAT 10 data reflect 10th or 11th gradestudents who took the PSAT/NMSQT and/or PSAT 10 during the 2018-19 school year. PSAT 8/9 data reflect 8th or 9th grade studentswho took the PSAT 8/9 during the 2018-19 school year. If a student took the respective assessment more than once, the most recentscore is summarized.
2019 SAT Suite Annual Report Pennsylvania