2019 reference site monitoring work plan
TRANSCRIPT
2019 Reference Site Monitoring Work Plan
PREPARED BY
Raissa Espejo Probabilistic Monitoring Section
WATERSHED ASSESSMENT and PLANNING BRANCH Indiana Department of Environmental Management
Office of Water Quality 100 North Senate Avenue
MC65-40-2 Shadeland Indianapolis, Indiana 46204-2251
July 19, 2019
B-045-OWQ-WAP-PRB-19-W-R0

2019 Reference Site Monitoring WP B-045-OWQ-WAP-PRB-19-W-R0
Date: July 19, 2019
This page is intended to be blank

2019 Reference Site Monitoring WP B-045-OWQ-WAP-PRB-19-W-R0
Date: July 19, 2019
i
SIGNATURE PAGE
2019 Reference Site Monitoring Work Plan
Indiana Department of Environmental Management Office of Water Quality
Watershed Assessment and Planning Branch Indianapolis, Indiana
B-045-OWQ-WAP-PRB-19-W-R0
Reviews and Approvals
___________________________________________________ Date______________ Stacey Sobat, Section Chief Probabilistic Monitoring Section ___________________________________________________ Date______________ Cyndi Wagner, Section Chief Targeted Monitoring Section ____________________________________________________ Date______________ Timothy Bowren, Project Quality Assurance Officer, Technical and Logistical Services Section ____________________________________________________ Date______________ Marylou Renshaw, Branch Chief, Branch Quality Assurance Coordinator IDEM Quality Assurance Staff reviewed and approved this Sampling and Analysis Work Plan. ____________________________________________________ Date______________ Quality Assurance Staff IDEM Office of Program Support

2019 Reference Site Monitoring WP B-045-OWQ-WAP-PRB-19-W-R0
Date: July 19, 2019
ii
This page is intended to be blank

2019 Reference Site Monitoring WP B-045-OWQ-WAP-PRB-19-W-R0
Date: July 19, 2019
iii
WORK PLAN ORGANIZATION This sampling and analysis work plan is an extension of the existing Watershed Assessment and Planning Branch (WAPB), March 2017 Quality Assurance Project Plan (QAPP) for Indiana Surface Water Programs (Surface Water QAPP) and serves as a link to the existing QAPP and an independent QAPP of the project. Per the United States Environmental Protection Agency 2002 (U.S. EPA 2006) Guidance for QAPPs, this work plan establishes criteria and specifications pertaining to a specific water quality monitoring project usually described in the following four element groups or sections as QAPP elements: Section A. Project Management
A.1 Project Objective A.2 Project or Task Organization and Schedule A.3 Background and Project or Task Description A.4 Data Quality Objectives (DQOs) A.5 Training and Staffing Requirements
Section B. Measurement and Data Acquisition B.1 Sampling Design and Site Locations B.2 Sampling Methods B.3 Analytical Methods B.4 Quality Control and Custody Requirements B.5 Field Parameter Measurements/Instrument Testing/Calibration
Section C. Assessment and Oversight C.1 External and Internal Checks C.2 Audits C.3 Data Quality Assessments (DQAs) C.4 Quality Assurance and Quality Control (QA/QC) Review Reports
Section D. Data Validation and Usability D.1 Data Handling and associated QA/QC activities D.2 QA/QC Review Reports D.3 Laboratory and Estimated Cost

2019 Reference Site Monitoring WP B-045-OWQ-WAP-PRB-19-W-R0
Date: July 19, 2019
iv
This page is intended to be blank

2019 Reference Site Monitoring WP B-045-OWQ-WAP-PRB-19-W-R0
Date: July 19, 2019
v
TABLE OF CONTENTS SIGNATURE PAGE ........................................................................................................................... i WORK PLAN ORGANIZATION ....................................................................................................... iii TABLE OF CONTENTS ................................................................................................................... v LIST OF FIGURES .......................................................................................................................... vi LIST OF TABLES ............................................................................................................................ vi LIST OF ATTACHMENTS ............................................................................................................... vi LIST OF APPENDICES .................................................................................................................. vii LIST OF ACRONYMS ................................................................................................................... viii DEFINITIONS .................................................................................................................................. ix A. PROJECT MANAGEMENT ......................................................................................................... 1
A.1 Project Objective ............................................................................................................. 1 A.2 Project or Task Organization and Schedule.................................................................... 1 A.3 Background and Project or Task Description .................................................................. 4 A.4 Data Quality Objectives (DQO) ....................................................................................... 4 A.5 Training and Staffing Requirements .............................................................................. 14
B. MEASUREMENT AND DATA ACQUISITION .......................................................................... 17 B.1 Sampling Design and Site Locations ............................................................................ 17 B.2 Sampling Methods ......................................................................................................... 20 B.3 Analytical Methods ........................................................................................................ 23 B.4 Quality Control and Custody Requirements .................................................................. 27 B.5 Field Parameter Measurements/Instrument Testing/Calibration................................... 29
C. ASSESSMENT AND OVERSIGHT........................................................................................... 29 C.3 Data Quality Assessment Levels .................................................................................. 30
D. DATA VALIDATION AND USABILITY ...................................................................................... 30 D.1. Data Handling and Associated QA/QC Activities .......................................................... 30 D.2. Data Usability ................................................................................................................ 30 D.3. Laboratory and Estimated Cost ..................................................................................... 31
E. REFERENCES .......................................................................................................................... 33 F. DISTRIBUTION LIST ................................................................................................................ 37

2019 Reference Site Monitoring WP B-045-OWQ-WAP-PRB-19-W-R0
Date: July 19, 2019
vi
LIST OF FIGURES Figure 1. 2019 Reference Sites for the Upper White (05120201), Driftwood (05120204), and Flatrock-Haw (05120205) Basins............................................. 18 Figure 2. 2019 Reference Sites for the Lower White (05120202) and Lower East Fork White (05120208) Basins ........................................................................... 19
LIST OF TABLES Table 1. Tasks, Schedule, and Evaluation ............................................................ 2 Table 2. Water Quality Criteria [327 IAC 2-1-6] .................................................... 5 Table 3. List of 2019 Reference Sites for the Lower White (05120202) and Lower East Fork White (05120208) Watersheds ............................................................. 9 Table 4. List of 2019 Reference Sites for the Upper White (05120201), Driftwood (05120204), and Flatrock-Haw (05120205) Watersheds .................................... 10 Table 5. Project Roles, Experience, and Training ............................................... 14 Table 6. Field Parameters Showing Method and IDEM Quantification Limit ....... 25 Table 7. Algal Parameters Showing Method and USGS Quantification Limit ..... 25 Table 8. Water Chemistry Sample Container, Preservative, and Holding Time Requirements ..................................................................................................... 25 Table 9. Water Chemistry Parameters, Test Method, IDEM, and Laboratory Reporting Limits .................................................................................................. 26 Table 10. Total Estimated Laboratory Cost for the Project. ................................ 31
LIST OF ATTACHMENTS Attachment 1 IDEM Site Reconnaissance Form ................................................. 38 Attachment 2 IDEM Stream Sampling Field Data Sheet ..................................... 39 Attachment 3 IDEM Algal Biomass Lab Data Sheet ........................................... 40 Attachment 4 IDEM Physical Description of Stream Site Form (front) ................ 41 Attachment 5 IDEM Fish Collection Data Sheet (front) ....................................... 43 Attachment 6 IDEM OWQ Macroinvertebrate Header Form ............................... 44 Attachment 7 IDEM OWQ Biological Qualitative Habitat Evaluation Index (front) ............................................................................................................................ 45 Attachment 8 IDEM OWQ Chain of Custody Form ............................................. 47 Attachment 9 2019 Reference Sites Water Sample Analysis Request Form. ..... 48 Attachment 10 Biological Samples Laboratory Chain of Custody Form .............. 49

2019 Reference Site Monitoring WP B-045-OWQ-WAP-PRB-19-W-R0
Date: July 19, 2019
vii
LIST OF APPENDICES Appendix 1 List of IDEM Documents and SOPs used in the Development of the 2019 Reference Site Monitoring Program Sampling and Analysis Work Plan. ... 50 Appendix 2 IDEM Fish Community Assessments for Aquatic Life Use ............... 52 Appendix 3 Calculating IDEM Macroinvertebrate Index of Biotic Integrity (mIBI) 54

2019 Reference Site Monitoring WP B-045-OWQ-WAP-PRB-19-W-R0
Date: July 19, 2019
viii
LIST OF ACRONYMS AIMS Assessment Information Management System ALUS Aquatic Life Use Support ASTM American Society for Testing and Materials CAC Chronic Aquatic Criterion CALM Consolidated Assessment Listing MethodologyDO Dissolved
Oxygen IAC Indiana Administrative Code IBI Index of Biotic Integrity IDEM Indiana Department of Environmental Management MHAB Multihabitat OHEPA Ohio Environmental Protection Agency OWQ Office of Water Quality QA Quality Assurance QA/QC Quality Assurance/Quality Control QC Quality Control QAPP Quality Assurance Project Plan QHEI Qualitative Habitat Evaluation Index S.U. Standard Units SOP Standard Operating Procedures U.S. EPA United States Environmental Protection Agency WAPB Watershed Assessment and Planning Branch

2019 Reference Site Monitoring WP B-045-OWQ-WAP-PRB-19-W-R0
Date: July 19, 2019
ix
DEFINITIONS Elutriate To purify, separate, or remove lighter or finer
particles by washing, decanting, and settling. Fifteen-(15-)minute pick A multihabitat macroinvertebrate sampling
method in which the one-minute kick sample and fifty-meter sweep sample collected at a site are first combined and elutriated. Macroinvertebrates are then manually removed from the resulting sample for 15 minutes.
Fifty-(50-)meter sweep A multihabitat macroinvertebrate sampling method in which approximately 50 meters (50m) of all available habitat in a stream or river is sampled with a standard 500 µm mesh width D-frame dipnet by taking 20—25 individual “jab” or “sweep” samples, which are then composited.
Macroinvertebrate Aquatic animals which lack a backbone, are visible without a microscope, and spend some period of their lives in or around water.
One-(1-)minute kick sample A multihabitat macroinvertebrate sampling method in which approximately 1 m² of riffle or run substrate habitat in a stream or river is sampled with a standard 500 µm mesh width D-frame dipnet for approximately 1 minute.
Ocular reticle A thin piece of glass marked with a linear or areal scale that is inserted into a microscope ocular, superimposing the scale onto the image viewed through the microscope.
Periphyton Algae attached to an aquatic substrate. Reach A segment of a stream used for sampling.
Seston Organic matter suspended in the water column generally comprised of phytoplankton, bacteria, and fine detritus.

2019 Reference Site Monitoring WP B-045-OWQ-WAP-PRB-19-W-R0
Date: July 19, 2019
1
A. PROJECT MANAGEMENT A.1 Project Objective The objective of the 2019 Reference Site Monitoring Project is to provide physical, chemical, and biological data from reference sites. These sites are located in areas with the least amount of anthropogenic disturbance and considered the most natural remaining areas within a specified geographic boundary. Candidate sampling reference sites are chosen based on abiotic factors such as land use, water chemistry, and in-stream physical habitat that function as potential stressors to the aquatic assemblages (i.e., fish, macroinvertebrate, and diatom communities) of the stream or river ecosystem. Data obtained from the chosen sites are used to establish and refine the Index of Biotic Integrity (IBI) for aquatic assemblages as well as biological criteria for aquatic life use assessments. The IBI is composed of 12 biological assemblage characteristics or metrics that assess the aquatic communities’ structural, compositional, and functional integrity. Different IBI metrics may be used depending on variables such as what part of the state is being sampled (ecoregion) and size of the stream (drainage area). The 12 different metrics can each score 0, 1, 3, or 5, which represents the deviation from expected community structure (i.e., 5 = no deviation from expectations, 0 = severe deviation from expected community structure). The total IBI score can range from 0 (severe disturbance) to 60 (excellent, compared to “least impacted” conditions). For more information on fish and macroinvertebrate IBI calculations, view Appendices 2 and 3 .
A.2 Project or Task Organization and Schedule Sampling for this project will begin in April and continue through October 2019. Chemical, physical, and biological parameters will be collected. Laboratory processing and data analysis for the project will continue through spring of 2020 (see Table 1).
2019 Reference Site Monitoring WP B-045-OWQ-WAP-PRB-19-W-R0
Date: July 19, 2019
2
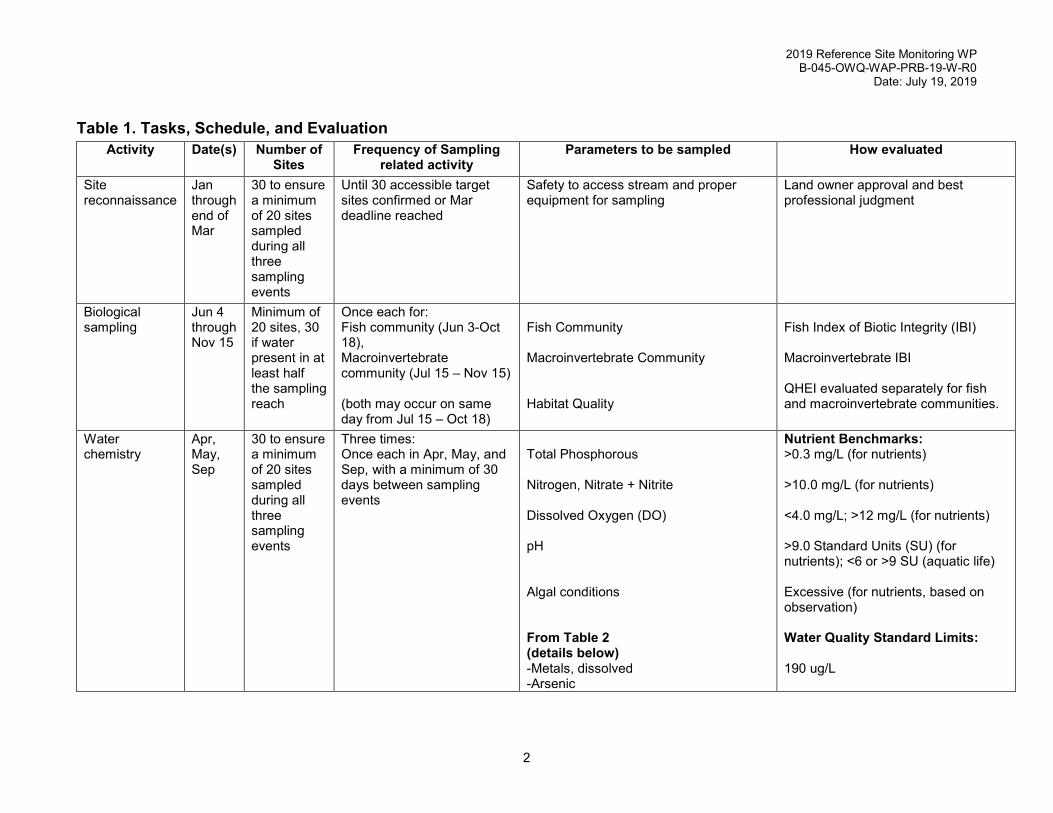
Table 1. Tasks, Schedule, and Evaluation Activity Date(s) Number of
Sites Frequency of Sampling
related activity Parameters to be sampled How evaluated
Site reconnaissance
Jan through end of Mar
30 to ensure a minimum of 20 sites sampled during all three sampling events
Until 30 accessible target sites confirmed or Mar deadline reached
Safety to access stream and proper equipment for sampling
Land owner approval and best professional judgment
Biological sampling
Jun 4 through Nov 15
Minimum of 20 sites, 30 if water present in at least half the sampling reach
Once each for: Fish community (Jun 3-Oct 18), Macroinvertebrate community (Jul 15 – Nov 15) (both may occur on same day from Jul 15 – Oct 18)
Fish Community Macroinvertebrate Community Habitat Quality
Fish Index of Biotic Integrity (IBI) Macroinvertebrate IBI QHEI evaluated separately for fish and macroinvertebrate communities.
Water chemistry
Apr, May, Sep
30 to ensure a minimum of 20 sites sampled during all three sampling events
Three times: Once each in Apr, May, and Sep, with a minimum of 30 days between sampling events
Total Phosphorous Nitrogen, Nitrate + Nitrite Dissolved Oxygen (DO) pH Algal conditions From Table 2 (details below) -Metals, dissolved -Arsenic
Nutrient Benchmarks: >0.3 mg/L (for nutrients) >10.0 mg/L (for nutrients) <4.0 mg/L; >12 mg/L (for nutrients) >9.0 Standard Units (SU) (for nutrients); <6 or >9 SU (aquatic life) Excessive (for nutrients, based on observation) Water Quality Standard Limits: 190 ug/L

2019 Reference Site Monitoring WP B-045-OWQ-WAP-PRB-19-W-R0
Date: July 19, 2019
3
Activity Date(s) Number of Sites
Frequency of Sampling related activity
Parameters to be sampled How evaluated
-Un-ionized ammonia as N -Chloride -Sulfate -Dissolved Solids
750 mg/L
Algal samples
Sep Minimum of 20 sites, 30 if water present in at least half the sampling reach
Once, with the 3rd water chemistry sample, Sep
Algal diatoms Algal Biomass: Periphyton (Include Seston, if the drainage area >1000 square miles)
Diatom identification and enumeration Chlorophyll a and Pheophytin a

2019 Reference Site Monitoring WP B-045-OWQ-WAP-PRB-19-W-R0
Date: July 19, 2019
4
A.3 Background and Project or Task Description The Reference Site Monitoring Project is operated through the WAPB OWQ IDEM. Other organizations assisting with data preparation, collection, and analysis include private laboratories under contract with the state of Indiana (Request For Proposals 16-74, see IDEM 2016a), Department of Biological and Environmental Sciences at Georgia College and State University, U.S. EPA Region V, and the Indiana Department of Natural Resources. Landowners and property managers throughout the state also participate in the Reference Site Monitoring Project through assisting staff with access to remote stream locations for collection of samples. The Reference Site Monitoring Project provides physical, chemical, and biological data to continuously refine and calibrate the IBI for aquatic assemblages. Refining and Calibrating are accomplished through sampling reference sites in Indiana over 10 years to assess and characterize overall water quality and biological integrity. The following parameters are investigated and the data utilized for IBI and biological criteria refinement as well as assessment purposes: water chemistry; algal samples (seston and periphyton); fish, macroinvertebrate, and diatom assemblages; and habitat evaluations.
A.4 Data Quality Objectives (DQO) The DQO process (U.S. EPA 2006) is U.S. EPA’s recommended planning process for environmental data collection activities. It provides a basis for balancing decision uncertainty with available resources. The DQO process is required for all significant environmental data collection projects and is a seven-step, systematic-planning process used to clarify study objectives; define the types and quantity of data needed to achieve the objectives; and establish decision criteria for evaluating data quality. The DQO process for the 2019 Reference Site Monitoring Project is identified in the following seven steps:
1. State the Problem Surface waters of the state are designated for full body contact recreation; will be capable of supporting a well-balanced, warm water aquatic community; and in some northern portions of the state, put-and-take trout fishing [327 IAC 2-1-3]. Indiana is required to assess all waters of the state to determine their designated use attainment status. This project gathers biological (algal, fish, and macroinvertebrate), chemical, and habitat data at reference sites for the purpose of refining Indiana’s IBI metrics and biological criteria thresholds, to more accurately assess aquatic life use attainment status. 2. Identify the Goals of the Study The objective of this project is to sample reference sites throughout Indiana to determine whether the reference sites chosen still meet criteria for a reference site; collect reference data against which ALUS assessments can be measured; and develop the Diatom IBI to provide a more sensitive tool to determine ALUS status to refine and further validate IBI metrics and biological criteria thresholds every 10 years.

2019 Reference Site Monitoring WP B-045-OWQ-WAP-PRB-19-W-R0
Date: July 19, 2019
5
3. Identify the Information Inputs Field monitoring activities are required to collect physical description, chemical, algal, biological, and habitat data. Samples will be collected for chemical parameters as well as biological communities. Collection procedures for field measurements, algal, chemical, biological, and habitat data will be described in detail under Section II MEASUREMENT/DATA ACQUISITION. Water Quality Criteria Chemical sampling data are used to validate the absence of anthropogenic disturbance or a minimal level of allowed disturbance at reference sites (U.S. EPA 2013). Thus, each site will be evaluated as “supporting” or “nonsupporting” when compared with water quality criteria shown in Table 2, which is derived from tables contained in [327 IAC 2-1-6] following Indiana’s 2018 Consolidated Assessment Listing Methodology (IDEM 2018a, CALM 2018b).
Table 2. Water Quality Criteria [327 IAC 2-1-6] Parameter Level Criterion Metals (dissolved)
Calculated based on hardness
Calculated Chronic Aquatic Criterion (CAC)
Arsenic III (dissolved)
190 µg/L Calculated CAC
Ammonia as Nitrogen
Calculated based on pH and temperature
Calculated CAC
Chloride Calculated based on hardness and sulfate values
Calculated CAC
DO At least 5.0 mg/L (warm water aquatic life)
Not less than 4.0 mg/L at any time.
pH 6.0—9.0 S.U. Must remain between 6.0 and 9.0 S.U. except for daily fluctuations that exceed 9.0 due to photosynthetic activity
Nitrogen, Nitrate + Nitrite
<10 mg/L Human Health point of drinking water intake
Sulfate Calculated based on hardness and chloride
In all waters outside the mixing zone
Dissolved Solids
750 mg/L Not-to-Exceed at point of drinking water intake
CAC = Chronic Aquatic Criterion, S.U. = Standard Units
Nutrient Criteria In addition to the chemical criteria listed in Table 2, data for several nutrient parameters will be evaluated against the benchmarks below (IDEM 2018b). Assuming a minimum of three sampling events, if two or

2019 Reference Site Monitoring WP B-045-OWQ-WAP-PRB-19-W-R0
Date: July 19, 2019
6
more of the conditions below are met on the same date, the waterbody assessment unit will be classified as nonsupporting due to nutrients. • Total Phosphorus: one or more measurements >0.3 mg/L. • Nitrogen, (Nitrate + Nitrite): one or more measurements >10.0 mg/L. • DO: one or more measurements <4.0 mg/L, or measurements that are
consistently at or close to the standard, in the range of 4.0—5.0 mg/L, or >12.0 mg/L.
• pH: one or more measurements >9.0 S.U. or measurements consistently at or close to the standard, ranging from 8.7—9.0 S.U.
• Algal Conditions: visually observed as “excessive” by trained staff using best professional judgment. Further explanation of this observance is documented in Measurement and Data Acquisition under Algal Community Data on page 34.
Biological Criteria: Indiana narrative biological criteria [327 IAC 2-1-3] states that “(2) All waters, except as described in subdivision (5),” (i.e., limited use waters) “will be capable of supporting: (A) a well-balanced, warm water aquatic community”. The water quality standard definition of a “well-balanced aquatic community” is “an aquatic community that: (A) is diverse in species composition; (B) contains several different trophic levels; and (C) is not composed mainly of pollution tolerant species” [327 IAC 2-1-9 (59)]. An interpretation or translation of narrative biological criteria into numeric criteria is illustrated by the table in Appendix 2. A stream segment is nonsupporting for aquatic life use when the monitored fish or macroinvertebrate community receives an IBI score of less than 36 which is considered “Poor” or “Very Poor” (IDEM 2018b). Stream segements with IBI scores greater than or equal to 36 (“Fair” to “Excellent” on the scale of 0 to 60) are supporting for aquatic life use. Assessment of each site sampled will be reported to U.S. EPA in the 2022 update of Indiana’s Integrated Water Monitoring and Assessment Report. Site specific data will be used to classify associated assessment units (AU) into one of five major categories in the state’s consolidated 303(d) list. Category definitions are available in Indiana’s CALM (IDEM 2018b pages N-40 and N-41). To develop the IBI for diatoms, as well as biological criteria for aquatic life use assessments, periphyton will be collected and analyzed separately for benthic diatoms and chlorophyll a in conjunction with chemical data from each site along with physical site descriptions. Once collected, the diatom samples will be preserved and transported to the laboratory where algae will be identified and enumerated as part of the development of algal metrics. 4. Define the Boundaries for the Study In 2019, reference sites were chose in two separate areas of the state to allow flexibility in sampling, as a result of high water or bad weather preventing IDEM projects’ sampling in other areas of the state. If the flow

2019 Reference Site Monitoring WP B-045-OWQ-WAP-PRB-19-W-R0
Date: July 19, 2019
7
is not dangerous for staff to enter the stream; barring any hazardous weather conditions; or unexpected physical barriers to access the site. Even if the weather conditions and stream flow are safe, sample collections for algal and biological communities may also be postponed at a particular site for one to four weeks due to scouring of the stream substrate or instream cover following a high water event resulting in nonrepresentative samples.Further explanation of site selection is explained in B.2.5 Sampling Methods in Section B. Measurement/Data Acquisition of this work plan. Develop the Analytical Approach All potential reference sites will be evaluated for aquatic life use support (ALUS) status. For assessment purposes in the Indiana Integrated Water Monitoring and Assessment Report, ALUS decisions will include independent evaluations of chemical and biological criteria as outlined in Indiana’s 2018 CALM (IDEM 2018b). The fish and macroinvertebrate assemblage will be evaluated at each site using the appropriate IBI. Specifically, a site will be considered nonsupporting for aquatic life use when IBI scores are less than 36. Given more recent data, assessment decisions will be reported in the 2022 Indiana Integrated Water Monitoring and Assessment Report resulting in stream segments being delisted for impaired biotic community (now fully supporting aquatic life use), or listed as nonsupporting for aquatic life use due to a change in water quality or habitat that has impaired the biotic community. Sites not supporting aquatic life use or sites violating the minimal allowable amount of disturbance will be rejected as reference sites due to chemical or physical alterations detected by current sampling efforts. To avoid circularity in deriving IBI calibrations, reference sites will not be chosen based on biological attributes (i.e., excellent IBI metrics or total scores) (U.S. EPA 2013). After 10 years, however, IDEM may discover additional reference sites through review of land use criteria, chemical, and in-stream physical habitat data for sites where biological assemblage information is obtained during additional projects between 2014 and 2024. IDEM’s intention is to use algal metrics, once determined, as part of nutrient criteria being developed for Indiana’s surface waters. Eventually, IDEM also plans to use algal metrics with macroinvertebrate and fish metrics for ALUS decisions. Given that ecological tolerances for many diatom species are known, changes in diatom community composition can be used to diagnose the environmental stressors affecting ecological health (Stevenson 1998; Stevenson and Pan 1999). Thus, periphyton IBI metrics have been developed and tested in many regions (Kentucky Department of Environmental Protection KDEP 1993; Hill 1997). The periphyton assemblage to include chlorphyll a and diatoms may be used to assess biological integrity of a waterbody without any other information. However, periphyton are most effective when used in conjunction with habitat and macroinvertebrate assessments, particularly because of the close relationship between periphyton and these elements of stream
2019 Reference Site Monitoring WP B-045-OWQ-WAP-PRB-19-W-R0
Date: July 19, 2019
8
ecosystems (Barbour et al. 1999). For this reason, algal sampling will be conducted at the same sites where macroinvertebrates, fish, habitat, chemical, and physical data will be collected as part of the Reference Site Monitoring Program.

2019 Reference Site Monitoring WP B-045-OWQ-WAP-PRB-19-W-R0
Date: July 19, 2019
9
Table 3. List of 2019 Reference Sites for the Lower White (05120202) and Lower East Fork White (05120208) Watersheds
AIMS Site Name Event ID Stream Name and Location CountyHydrologic Unit Code
(HUC)Latitude (DD)
Longitude (DD)
Drainage Area (mi2)
Gradient (ft/mi)
Site Status
WEL090-0013 19R112 Henderson Creek @ CR off of SR 446 Lawrence 051202080804 38.9619444 -86.3688889 13 16.8 ApprovedWEL090-0015 19R113 Wolf Creek @ CR 825 N Lawrence 051202080806 38.9763889 -86.4777778 1.5 42.2 ApprovedWEL040-010 19R114 Leatherwood Creek @ Cement Plant Rd Lawrence 051202081003 38.8541431 -86.4704723 36 14.04 ApprovedWWL-03-0029 19R116 Tributary of Richland Creek @ W Hendricks Rd Monroe 051202020301 39.1589273 -86.6475142 5.5 105.2 ApprovedWWL020-0054 19R117 Raccoon Creek @ Heddings Rd. Owen 051202020207 39.2048429 -86.7566831 23.2 12.7 ApprovedWWL020-0055 19R118 Fish Creek @ CR 550 S. Owen 051202020209 39.2124524 -86.9057538 54 3.1 ApprovedWWL-03-0015 19R119 Tributary of Richland Creek @ CR 525 N Greene 051202020302 39.1025935 -86.7232878 3.7 17.5 ApprovedWWL-03-0018 19R120 Camp Creek @ CR 515/460 Greene 051202020305 39.0950222 -86.8329276 3.0 12.1 ApprovedWEL-09-0004 19R122 Indian Creek @ E SR 54 Greene 051202080902 38.9613814 -86.6982947 43.82 4.94 ApprovedWWL-03-0022 19R124 Little Clifty Branch @ CR 875 E Greene 051202020306 38.9882975 -86.7790281 3.4 19.7 ApprovedWWL-03-0021 19R125 Ore Branch @ Private Drive Off of Ore Branch Rd Greene 051202020308 39.0272846 -86.8703551 3.1 24.8 ApprovedWWL-03-0033 19R126 Stalcup Branch @ CR 140 S Greene 051202020306 39.0011582 -86.8351621 10.2 17.8 ApprovedWWL-03-0010 19R129 Tributary of Black Ankle Creek @ CR 560 E Greene 051202020307 38.9453013 -86.8404815 2.2 20.8 ApprovedWWL-02-0003 19R132 Rattlesnake Creek @ Hyden Road Owen 051202020204 39.2822672 -86.8059042 21.6 8.3 ApprovedWWL-03-0036 19R133 Beech Creek @ CR 900 E Greene 051202020304 39.0644062 -86.7743589 13.8 12.3 Approved

2019 Reference Site Monitoring WP B-045-OWQ-WAP-PRB-19-W-R0
Date: July 19, 2019
10
Table 4. List of 2019 Reference Sites for the Upper White (05120201), Driftwood (05120204), and Flatrock-Haw (05120205) Watersheds
AIMS Site Name Event ID Stream Name and Location CountyHydrologic Unit
Code (HUC)Latitude
(DD)Longitude
(DD)Drainage Area (mi2)
Gradient (ft/mi)
Site Status
WWU100-0110 19R097 Honey Creek @ CR 850 N (Bridge) Henry 051202010801 40.05517 -85.49448 6.95 29.18 ApprovedWWU100-0101 19R098 Deer Creek @ CR 575 N or CR 625 N Henry 051202010803 40.02227 -85.53266 5.86 28.72 ApprovedWWU100-0099 19R099 Mud Creek @ CR 575 N (Bridge) Henry 051202010803 40.01328 -85.57018 3.09 33.4 ApprovedWWU100-0083 19R101 Fall Creek @ CR 200 E (Rangeline Rd Bridge) Madison 051202010804 40.01585 -85.63389 64.53 6.82 ApprovedWWU100-0089 19R102 Lick Creek @ Connecticut Ave/W 1025 S (br Madison 051202010807 39.95157 -85.85769 37.29 7.98 ApprovedWWU100-0075 19R103 Lick Creek @ CR 1000 S (Reformatory Rd Bri Madison 051202010805 39.95983 -85.72612 20.2 5.71 ApprovedWWU100-0069 19R104 Lick Creek @ CR 1050 S (Bridge) Madison 051202010807 39.95189 -85.77009 27.34 8.41 ApprovedWWU100-0063 19R105 Lick Creek @ CR 400 E (Bridge) Madison 051202010805 39.9753 -85.59548 1.56 11.3 ApprovedWED040-0003 19R106 Brandywine Creek @ SR 9 (Bridge) Shelby 051202040303 39.68694 -85.77389 65.8 4.9 ApprovedWED020-0023 19R107 Big Blue River @ N Morristown Road Shelby 051202040805 39.58169 -85.76206 299.75 4.21 ApprovedWED030-0028 19R108 Little Blue River @ German Road Shelby 051202040205 39.53976 -85.72694 100.41 4.67 ApprovedWEF050-0006 19R110 Lewis Creek @ SR 252 (bridge) Shelby 051202050503 39.36361 -85.85806 81.5 7.3 ApprovedWWU-14-0005 19R111 North Prong Stotts Creek @ 2530 Firestatio Morgan 051202011405 39.46689 -86.31262 21.9 11 ApprovedWWU100-0041 19R130 Fall Creek @ CR 850 N @ Dietrich Memorial Henry 051202010801 40.05524 -85.52735 16.26 6.65 ApprovedWWU100-0104 19R131 Fall Creek @ Rock Bridge @ CR 850 N Henry 051202010801 40.05516 -85.484 3.46 27.04 Approved

2019 Reference Site Monitoring WP B-045-OWQ-WAP-PRB-19-W-R0
Date: July 19, 2019
11
5. Specify Performance or Acceptance Criteria Good quality data are essential for minimizing decision error. By identifying errors in the sampling design; measurement; and laboratory for physical, chemical, and biological parameters, more confidence can be placed in IBI calibrations and biological threshold determinations as well as aquatic life use assessments.
Site specific aquatic life use assessments include program specific controls to identify the introduction of errors. These controls include water chemistry blanks and duplicates; biological site revisits or duplicates; and laboratory controls through verification of species identifications as described in field procedure manuals (IDEM 2002; Ohio Environmental Protection Agency OHEPA 2006) and standard operating procedures (SOPs, IDEM 1992a, 1992b, 1992c, 2010a, 2015b, 2018c, 2018d, 2019b). The QA/QC process detects deficiencies in the data collection as set forth in the for the Surface Water QAPP (IDEM 2017a). The QAPP requires all contract laboratories to adhere to rigorous standards during sample analyses and to provide good quality usable data. Chemists within the WAPB review the laboratory analytical results for quality assurance (QA). Any data which is “Rejected” due to analytical problems or errors will not be used for water quality assessment decisions. Any data flagged as “Estimated” may be used on a case-by-case basis. Criteria for acceptance or rejection of results as well as application of data quality flags is presented in the following Surface Water QAPP tables:
• Table D3-1 – Data Qualifiers and Flags • Table A7-1 – Precision and Accuracy Goals for Data Acceptability
by Matrix (Precision and accuracy goals with acceptance limits for applicable analytical methods)
• Table B2.1.1.8-2 – Field Parameters Further investigation will be conducted, in response to consistent “rejected” data, to determine the source of error. Field techniques, used during sample collection and preparation along with laboratory procedures, will be subject to evaluation by both the WAPB QA Manager and Project Manager to troubleshoot error introduced throughout the entire data collection process. Corrective actions will be implemented once the source of error is determined. 6. Develop the Plan for Obtaining Data Sampling locations in this project have been selected based on sites that were previously sampled from 2003—2013. Reference sites were least impacted by anthropogenic sources, and had good habitat and water chemistry results compared to other sites sampled over the 10-year period. Sampling locations may be near bridges or in rem27ote areas due to being a historical probabilistic monitoring site.
2019 Reference Site Monitoring WP B-045-OWQ-WAP-PRB-19-W-R0
Date: July 19, 2019
12
Indiana’s 2018 CALM requires at least three samples in order to complete an assessment for aquatic life use with water chemistry data. Sampling for water chemistry will occur in April, May, and September. The primary filter used in selecting reference sites is land use criteria:
• Percent of agricultural or urban areas • Impervious surface area • Human population density and distribution • Road density and crossings • Proportion of active mining • Proportion of protected lands • Proximity to permitted facilities, confined feeding operations, and
Superfund sites. In altered watersheds, chemical and in-stream physical habitat data may be used as a secondary filter to select reference sites and develop biological expectations for:
• “Least disturbed condition” (best available condition given widespread disturbance)
• “Minimally disturbed condition” (nearly absent human disturbance) • “Historical condition” (prior to major industrialization, urbanization,
and intense agricultural practices) (Stoddard et al. 2006) Ideally, reference sites should be sampled at least once every 10 years to monitor for changes in the biological expectations for “least disturbed condition” and possible revisions to biological criteria. Sampling at reference sites should include a minimum of two biological communities (fish, macroinvertebrates, or diatoms), habitat evaluations, and at least in-situ water chemistry. Ideally, additional samples for laboratory water chemistry parameters, algal biomass, and flow could be collected, as resources allow. The Indiana Department of Environmental Management (IDEM) Office of Water Quality (OWQ) worked with U.S. EPA and Tetra Tech in March 2015 to develop a framework and criteria for reference site selection (U.S. EPA Assistance Agreement I 96555711-1 IDEM). IDEM provided Tetra Tech with 1458 site locations previously sampled for fish or macroinvertebrates or both between 2003 and 2013, for possible selection as reference sites. Land use factors were the primary filter used by Tetra Tech to identify 324 potential reference sites. IDEM further narrowed the list by using in-stream chemical and physical data as a secondary filter. A minimum of 20 reference sites are required in each of the natural environmental gradient classifications (i.e., ecoregion, stream size, etc.) to ensure an adequate level of statistical confidence in the linear regression models developed from the data. The model outputs will then accurately indicate changes in biological assemblage structure, given certain explanatory variables. Increasing the number of reference sites, however,

2019 Reference Site Monitoring WP B-045-OWQ-WAP-PRB-19-W-R0
Date: July 19, 2019
13
reduces variability in calibrating the IBI and setting biological criteria thresholds (U.S. EPA 2013, Tetra Tech personal communication). Based on the spatial distribution of the sites and available resources, IDEM will conduct site reconnaissance and sampling of reference sites with the goal of at least 20 reference sites each year over the next 10 years to refine biological indices, water quality criteria, and possibly develop other assessment indicators and thresholds.

2019 Reference Site Monitoring WP B-045-OWQ-WAP-PRB-19-W-R0
Date: July 19, 2019
14
A.5 Training and Staffing Requirements Table 5. Project Roles, Experience, and Training
Role Required Training/Experience
Responsibilities Training References
Project Manager -Bachelor of Science Degree in biology or other closely related area plus four years of experience in aquatic ecosystems (Master’s Degree with two years aquatic ecosystems experience may substitute) -Database experience -Experience in project management and QA/QC procedures
-Establish Project in the Assessment Information Management System (AIMS) II database -Oversee development of Project Work Plan -Oversee entry and QC of field data -Oversee querying of data from AIMS II database to determine results not meeting aquatic life use Water Quality Criteria
-AIMS II Database User Guide IDEM 2017b -Surface Water QAPP 2017a -U.S. EPA 2006 QA Documents on developing Work Plans (QAPPs)
Field Crew Chief - Fish or Macroinvertebrate Community Sampling
-Bachelor of Science Degree in biology or other closely related area -At least one year of experience in sampling methodology and taxonomy of aquatic communities in the region -Annually review the Principles and Techniques of Electrofishing -Annually review relevant safety procedures -Annually review relevant SOP documents for field operations
-Completion of field data sheets -Taxonomic accuracy -Sampling efficiency and representation -Voucher specimen tracking -Overall operation of field crew when remote from central office -Adherence to safety and field SOP procedures by crew members -Ensure datasondes calibrated weekly, field sampling equipment is functioning properly, and all equipment loaded into vehicles prior to field sampling activities
-Barbour et al. 1999 -Hydrolab Corporation 2002 -IDEM 1992e, 2002, 2010a, 2010b, 2010c, 2015a, 2017a, 2018 2019a -Klemm et al. 1990-Plafkin et al. 1989 -Simon and Dufour 2005 -YSI 2006
Field Crew members - Fish or Macroinvertebrate Community Sampling
-Complete hands-on training for sampling methodology prior to field sampling activities -Review the Principles and Techniques of Electrofishing -Review relevant safety procedures -Review relevant SOP documents for field operations
-Follow all safety and SOP procedures while engaged in field sampling activities -Follow direction of Field Crew Chief while conducting field sampling activities
-Barbour et al. 1999 -Hydrolab Corporation 2002 -IDEM 2002, 2010a, 2010b, 2010c, 2015a, 2017a, 2018c, 2019a, 2019b -Klemm et al. 1990 -Plafkin et al. 1989 -Simon and Dufour 2005 -YSI 2006

2019 Reference Site Monitoring WP B-045-OWQ-WAP-PRB-19-W-R0
Date: July 19, 2019
15
Role Required Training/Experience
Responsibilities Training References
Field Crew Chief - Water Chemistry and Algal Sampling
-Bachelor of Science Degree in biology or other closely related area -At least one year of experience in sampling methodology -Annually review relevant safety procedures -Annually review relevant SOP documents for field operations
-Field data sheets complete -Sampling efficiency and representation -Overall operation of field crew when remote from central office -Adherence to safety and field SOP procedures by crew members -Ensure datasondes calibrated weekly, field sampling equipment is functioning properly, and all equipment loaded into vehicles prior to field sampling activities
-Hydrolab Corporation 2002 -IDEM 1997, 2002, 2010b, 2010c, 2015a, 2015b, 2017a, 2018d -YSI 2006
Field Crew Members - Water Chemistry and Algal Sampling
-Complete hands-on training for sampling methodology prior to field sampling activities -Review relevant safety procedures and SOP documents for field operations
-Follow all safety and SOP procedures while conducting field sampling activities -Follow direction of Field Crew Chief while conducting field sampling activities
-Hydrolab Corporation 2002 -IDEM 1997, 2002, 2010b, 2010c, 2015a, 2015b, 2017a, 2018d -YSI 2006
Laboratory Supervisor - Fish or Macroinvertebrate Community Sample Processing
-Bachelor of Science Degree in biology or other closely related area -At least one year of experience in taxonomy of aquatic communities in the region -Annually review relevant safety procedures -Annually review relevant SOP documents for laboratory operations
-Adherence to safety and SOP procedures by laboratory staff -Assist with identification of fish/macroinvertebrate specimens -Verify taxonomic accuracy of samples -Voucher specimen tracking -QC calculations on data sheets, check for completeness -Ensure data are entered into AIMS II correctly
-IDEM1992e, 2008, 2010b, 2010c, 2012, 2017a, 2018c -AIMS II Database User Guide 2017b
Laboratory Staff - Fish or Macroinvertebrate Community Sample Processing
-Complete hands-on training for laboratory sample processing methodology prior to laboratory sample processing activities -Annually review relevant safety procedures and relevant SOP documents for laboratory operations
-Adhere to safety and SOP procedures -Follow Laboratory Supervisor direction while processing samples -Identify fish/ macroinvertebrate specimens -Perform necessary calculations on data, enter field sheets
-IDEM1992e, 2008, 2010b, 2010c, 2012, 2017a, 2018c -AIMS II Database User Guide 2017b

2019 Reference Site Monitoring WP B-045-OWQ-WAP-PRB-19-W-R0
Date: July 19, 2019
16
Role Required Training/Experience
Responsibilities Training References
Laboratory Supervisor - Water Chemistry and Algal Sample Processing
-Bachelor of Science Degree in biology or other closely related area -Annually review relevant safety procedures -Annually review relevant SOP documents for field operations
-Adherence to safety and SOP procedures by laboratory staff -Identification of diatoms -Completion of laboratory data sheets -Check data for completeness -Perform all necessary calculations on the data -Ensure that data are entered into the AIMS II database
-IDEM 2010b, 2010c, 2012, 2015b, 2017a, - Barbour et al. 1999 -AIMS II Database User Guide 2017b
Quality Assurance Officer
-Bachelor of Science in chemistry or a related field of study -Familiarity with QA/QC practices and methodologies -Familiarity with the Surface Water QAPP and data qualification methodologies
-Ensure adherence to QA/QC requirements of Surface Water QAPP -Evaluate data collected by sampling crews for adherence to project Work Plan -Review data collected by field sampling crews for completeness and accuracy -Perform a data quality analysis of data generated by the project -Assign data quality levels based on the data quality analysis -Import data into the AIMS II database -Ensure that field sampling methodology audits are completed according to WAPB procedures
-IDEM 2017a, 2012 -U.S. EPA 2006 documentation on QAPP development and data qualification -AIMS II Database User Guide 2017b
Personnel Safety and Reference Manuals
-Basic First Aid and Cardiopulmonary Resuscitation (CPR) -Personal Protective Equipment (PPE) Policy
-Personal Flotation Devices (PFD)
-A minimum of 4 hours of in-service training provided by WAPB (IDEM 2010b) -IDEM 2008
-February 29, 2000 WAPB internal memorandum regarding use of approved PFDs
-Staff lacking 4 hours of in-service training or appropriate certification will be accompanied in the field at all times by WAPB staff that meet Health and Safety Training requirements
-When working on Boundary waters as defined by Indiana Code (IC) [IC 14-8-2-27] or between sunset and sunrise
2019 Reference Site Monitoring WP B-045-OWQ-WAP-PRB-19-W-R0
Date: July 19, 2019
17
Role Required Training/Experience
Responsibilities Training References
on any waters of the state, all personnel in the watercraft must wear a high intensity whistle and Safety of Life at Sea (SOLAS) certified strobe light.
B. MEASUREMENT AND DATA ACQUISITION B.1 Sampling Design and Site Locations
The reference site locations, proposed in this project, have been selected because they were previously sampled for fish and/or macroinvertebrates with habitat evaluations and some water chemistry results. After evaluating watershed characteristics (land use, pollution sources, road density, percent impervious surface, etc.) as well as habitat and chemistry results, these reference site locations were considered least impacted by anthropogenic sources. Site reconnaissance activities will be conducted in-house and through physical site visits. In-house activities include preparation and review of site maps and aerial photographs. Physical site visits include verification of accessibility, safety considerations, equipment needed to properly sample the site, and property owner consultations, if required. All information will be recorded on the IDEM Site Reconnaissance Form (Attachment 1) and entered into the AIMS II database. Precise coordinates for each site will be determined during the physical site visits or at the beginning of the sampling phase of this project, using a Trimble Juno™ SB Global Positioning System (GPS) or a Trimble Juno 3D GPS, both of which have an accuracy of two to five meters (IDEM 2015a). These coordinates will be entered into the AIMS ll database. Table 3 and Figure 1 provide location information for reference sites sampled in 2019 from the Lower White and Lower East Fork White Basins. Table 4 and Figure 2 provide location information for reference sites sampled in 2019 from the Upper White, Driftwood, and Flatrock-Haw Basins.

2019 Reference Site Monitoring WP B-045-OWQ-WAP-PRB-19-W-R0
Date: July 19, 2019
18
Figure 1. 2019 Reference Sites for the Upper White (05120201), Driftwood (05120204), and Flatrock-Haw (05120205) Basins

2019 Reference Site Monitoring WP B-045-OWQ-WAP-PRB-19-W-R0
Date: July 19, 2019
19
Figure 2. 2019 Reference Sites for the Lower White (05120202) and Lower East Fork White (05120208) Basins

2019 Reference Site Monitoring WP B-045-OWQ-WAP-PRB-19-W-R0
Date: July 19, 2019
20
B.2 Sampling Methods 1. Water Chemistry During three discrete sampling events, one team of two staff will collect water chemistry grab samples, record water chemistry field measurements, and record physical site descriptions on the IDEM Stream Sampling Field Data Sheet (Attachment 2). All water chemistry sampling will adhere to the Water Quality Surveys Section Field Procedure Manual 2.1 (IDEM 2002). 2. Field Parameter Measurements DO, pH, water temperature, specific conductance, and DO percent saturation will be measured with a Datasonde, during each sampling event regardless of the sample type being collected. Measurement procedures and operation of the Datasonde shall be performed according to the manufacturers’ manuals (Hydrolab Corporation 2002; YSI 2006) and Sections 2.10—2.13 of the Water Quality Surveys Section Field Procedure Manual (IDEM 2002). Turbidity will be measured with a Hach™ turbidity kit and the meter number written in the comments under the field parameter measurements. If a Hach™ turbidity kit is not available, the Datasonde measurement for turbidity will be recorded and noted in the comments. All field parameter measurements and weather codes will be recorded on the IDEM Stream Sampling Field Data Sheet (Attachment 2). A digital photo will also be taken upstream and downstream of the site during each sampling event (IDEM 2018d). 3. Algal Sampling In addition to standard water chemistry sampling, one team of two staff will collect chlorophyll a and pheophytin a from the seston community at sites with a drainage area greater than 1000 square miles and periphyton communities at all sites during the third round of water chemistry. Sampling for an average site that includes all of the above parameters will require approximately 2.5 hours of effort. The Algal Biomass Lab Data Sheet (Attachment 3) and Physical Description of Stream Site Form (Attachment 4) will be used to record information regarding substrates sampled for periphyton and physical parameters of the stream sampling area. See IDEM 2018d for a description of methods used in algal community sampling. 4. Laboratory Procedures for Diatom Identification and Enumeration See IDEM 2015b for a description of methods used in diatom identification and enumeration. 5. Fish Community Sampling The fish community sampling will be completed by teams of three to five staff. Sampling will be performed using various standardized electrofishing methodologies dependent upon the stream size and site accessibility. Fish assemblage assessments will be performed in a sampling reach of 15

2019 Reference Site Monitoring WP B-045-OWQ-WAP-PRB-19-W-R0
Date: July 19, 2019
21
times the average wetted width, with a minimum reach of 50 meters and a maximum reach of 500 meters (IDEM 2018c). An attempt will be made to sample all habitat types available within the sample reach to ensure adequate representation of the fish community present at the time of the sampling event. The possible list of electrofishers to be utilized include: the Smith-Root LR-24 or LR-20B Series backpack electrofishers; the Smith-Root model 1.5KVA electrofishing system; the Smith-Root model 2.5 Generator Powered Pulsator (GPP) electrofisher with RCB-6B junction box and rat-tail cathode cable; or Midwest Lake Electrofishing Systems (MLES) Infinity Control Box with MLES junction box and rat-tail cathode cable, assembled in a canoe (if parts of the stream are not wadeable, the system may require the use of a dropper boom array outfitted in a canoe or possibly a 12 foot Loweline boat; or for nonwadeable sites, the Smith-Root Type VI-A electrofisher assembled in a 16-foot Loweline boat (IDEM 1992a, 1992b, 1992c, 2018c). Sample collections during high flow or turbid conditions will be avoided due to 1) low collection rates which result in nonrepresentative samples and 2) safety considerations for the sampling team. Sample collection during late autumn will be avoided due to the cooling of water temperature, which may affect the responsiveness of some species to the electrical field. This lack of responsiveness can result in samples that are not representative of the stream’s fish assemblage (IDEM 2018c). Fish will be collected using dipnets with fiberglass handles and netting of 1/8-inch mesh bag. Fish collected in the sampling reach will be sorted by species into baskets and/or buckets. Young-of-the-year fish less than 20 millimeters (mm) total length will not be retained in the community sample (IDEM 2018c). For each field taxonomist (generally the crew leader), a complete set of fish vouchers are retained for any different species encountered during the summer sampling season. Vouchers may consist of either preserved specimens or digital images. Prior to processing fish specimens and completion of the Fish Collection Data Sheet (Attachment 5), one to two individuals per new species encountered will be preserved in 3.7% formaldehyde solution to serve as representative fish vouchers, if the fish specimens can be positively identified and the individuals for preservation are small enough to fit in a 2000 mL jar. If however, the specimens are too large to preserve, a photo of key characteristics (e.g., fin shape, size, body coloration) will be taken for later examination (IDEM 2018c). Also, prior to sampling, 10% of the sites will be randomly selected for revisiting and a few representative individuals of all species found at the site will be preserved or photographed to serve as vouchers. Taxonomic characteristics for possible species encountered in the basin of interest will be reviewed prior to field work. Fish specimens should also be preserved if they cannot be positively identified in the field (i.e., those that co-occur like the Striped and Common Shiners, or are difficult to identify when immature); individuals that appear to be hybrids or have unusual

2019 Reference Site Monitoring WP B-045-OWQ-WAP-PRB-19-W-R0
Date: July 19, 2019
22
anomalies; or dead specimens that are taxonomically valuable for undescribed taxa (e.g., Red Shiner or Jade Darter); life history studies; or research projects (IDEM 2018c). Data will be recorded for nonpreserved fish on the IDEM Fish Collection Data Sheet (Attachment 5) consisting of the following: number of individuals; minimum and maximum total length in millimeters (mm); mass weight in grams (g); and number of individuals with deformities eroded fins, lesions, tumors, and other anomalies (DELTs). Once the data is recorded, specimens are released within the sampling reach from which they were collected, when possible. Data will be recorded for preserved fish specimens following taxonomic identification in the laboratory (IDEM 2018c). 6. Macroinvertebrate Sampling The macroinvertebrate community sampling may be conducted immediately following the fish community sampling event or on a different date by crews of two to three staff. Samples are collected using a modification of the U.S. EPA Rapid Bioassessment Protocol multi-habitat (MHAB) approach using a D-frame dip net with 500 µm mesh (Plafkin et al. 1989; Barbour et al. 1999; Klemm et al. 1990; IDEM 2010a). The IDEM MHAB approach (IDEM 2010a) is composed of a 1-minute “kick” sample within a riffle or run (collected by disturbing one square meter of stream bottom substrate in a riffle or run habitat and collecting the dislodged macroinvertebrates within the dip net) and a 50 meter “sweep” sample of all available habitats (collected by disturbing habitat such as emergent vegetation, root wads, coarse particulate organic matter, depositional zones, logs, and sticks and collecting the dislodged macroinvertebrates within the dip net). The 50 meter length of riparian corridor that is sampled at each site will be defined using a tape measure or rangefinder. If the stream is too deep to wade, a boat will be used to sample the 50 meter zone along the shoreline with the best available habitat. The 1-minute “kick” and 50 meter “sweep” samples are combined in a bucket of water. the combined sample will be elutriated through a U.S. standard number 35 (500 µm) sieve a minimum of five times so that all rocks, gravel, sand, and large pieces of organic debris are removed from the sample. The remaining sample is then transferred from the sieve to a white plastic tray. The collector (while still on-site) will conduct a 15-minute pick of macroinvertebrates at a single organism rate endeavoring to pick for maximum organism diversity, and relative abundance through turning and examining the entire sample in the tray. The resulting picked sample will be preserved in 80% isopropyl alcohol; returned to the laboratory for identification at the lowest practical taxonomic level (usually genus or species level, if possible); and evaluated using the MHAB mIBI. Before leaving the site, an IDEM OWQ Macroinvertebrate Header Form (IDEM 2019a, Attachment 6) will be completed for the sample. In addition to the standard MHAB method of macroinvertebrate collection, three other macroinvertebrate sampling methods will be employed at each

2019 Reference Site Monitoring WP B-045-OWQ-WAP-PRB-19-W-R0
Date: July 19, 2019
23
reference site. These three additional sampling methods were developed to validate components of the MHAB method. Specifically the 15-minute field pick and use of a 50 meter sample zone instead of a sample zone that is a multiple of the stream width (i.e., 15 times the streams wetted width). These methods were first employed at randomly selected sites in the 2013 and 2014 sample seasons (IDEM 2014). Analysis of the previous samples may prove an alternate method is superior, at which point only that method and the MHAB method will be used at reference sites. The three alternate methods are: 1. Keeping the “unpicked” remainder of the MHAB sample after
completion of the 15-minute pick. The “unpicked” sample will be preserved and later subsampled in lab.
2. Collection of three “jabs” taken with a D-frame dipnet at each equally spaced transect. Transects are calculated by measuring the wetted width of the stream at the site location times 15 and divide by 10 (10 transects x 3 jabs = 30 jabs total).
3. Collection of two 0.25 square meter “kick” samples taken with a 0.5 meter wide bottom kick net at each transect. Samples are collected from alternating thirds of each transect. Transects are calculated by measuring the wetted width of the stream at the site location times 15 and divide by 10 (10 transects x 2 kicks of 0.25m2 = 5m2 of stream substrate).
At three reference sites, an additional duplicate set of all four sampling methods will be collected. The samples collected in 2019 will increase the total number of samples collected for the methods comparison study to 80 with 16 sets of duplicate samples. 7. Habitat Assessments Habitat assessments will be completed immediately following macroinvertebrate and fish community sample collections at each site using a slightly modified version of the Ohio Environmental Protection Agency (OHEPA) QHEI, 2006 edition (Rankin 1995; OHEPA 2006). A separate QHEI (Attachment 7) must be completed for these two sample types, since the sampling reach length may differ (i.e., 50 meters for macroinvertebrates and between 50 and 500 meters for fish). See IDEM 2019b for a description of the method used in completing the QHEI.
B.3 Analytical Methods Table 6 lists the field parameters with their respective test method and IDEM quantification limits. Table 7 lists the algal parameters with test method and IDEM quantification limits. Table 8 shows water chemistry sample container, preservative, and holding time requirements (all samples iced to 4 Degrees Celsius °C). Table 9 lists numerous parameters (priority metals, anions/physical chemistry, and nutrients/organic) with their respective test methods, IDEM reporting limits, and contract laboratory reporting limits. The IDEM OWQ Chain of Custody Form (Attachment 8) and the 2019 Reference Sites Water Sample

2019 Reference Site Monitoring WP B-045-OWQ-WAP-PRB-19-W-R0
Date: July 19, 2019
24
Analysis Request Form (Attachment 9) accompany each sample set through the analytical process. Diatoms will be collected in the field according to protocols described in IDEM 2018d.

2019 Reference Site Monitoring WP B-045-OWQ-WAP-PRB-19-W-R0
Date: July 19, 2019
25
Table 6. Field Parameters Showing Method and IDEM Quantification Limit
Parameters Method (SM=Standard Method)
IDEM Quantification Limit
DO (datasonde optical) ASTM D888-09 0.05 mg/L DO (datasonde) SM 4500-OG 0.03 mg/L DO (Winkler titration) SM 4500-OC 1 0.20 mg/L DO % Saturation (datasonde optical) ASTM D888-09 0.05 %
DO % Saturation (datasonde) SM 4500-OG 0.01 %
pH (datasonde) U.S. EPA 150.2 0.10 S.U. pH (field pH meter) SM 4500H-B 1 0.10 S.U. Specific Conductance (datasonde) SM 2510B 1.00 μmho/cm Temperature (datasonde) SM 2550B(2) 0.1 °C Temperature (field meter) SM 2550B(2) 1 0.1 °C Turbidity (datasonde) SM 2130B 0.02 NTU 2 Turbidity (Hach™ turbidity kit) EPA 180.1 0.05 NTU 2 1 Method used for Field Calibration Check 2 NTU = Nephelometric Turbidity Unit(s) Table 7. Algal Parameters Showing Method and USGS Quantification Limit
Algal Parameter Method IDEM Quantification Limit
Seston (Corrected) Chlorophyll a – Suspended U.S. EPA 445.0 TBD Seston Pheophytin a – Suspended U.S. EPA 445.0 TBD Seston (Uncorrected) Chlorophyll a – Suspended Modified U.S. EPA 445.0 TBD Periphyton (Corrected) Chlorophyll a – Attached U.S. EPA 445.0 TBD Periphyton Pheophytin a – Attached U.S. EPA 445.0 TBD Periphyton (Uncorrected) Chlorophyll a – Suspended Modified U.S. EPA 445.0 TBD
Table 8. Water Chemistry Sample Container, Preservative, and Holding Time Requirements
Parameter Container Preservative Holding 1Alkalinity as CaCO3* 1 L, plastic, narrow mouth None 14 days 2Ammonia-N** 1 L, Amber Glass Boston Round, narrow mouth H2SO4 < pH 2 28 days Chloride* 1 L, plastic, narrow mouth None 28 days Chemical Oxygen Demand** 1 L, Amber Glass Boston Round, narrow mouth H2SO4 < pH 2 28 days Hardness (as CaCO3*) Calculated
1 L, plastic, narrow mouth HNO3 < pH 2 6 months
Metals (Total & Dissolved) 1 L, plastic, narrow mouth HNO3 < pH 2 6 months Nitrate + Nitrite-N** 1 L, Amber Glass Boston Round, narrow mouth H2SO4 < pH 2 28 days Total Phosphorus** 1 L, Amber Glass Boston Round, narrow mouth H2SO4 < pH 2 28 days Solids (All Forms)* 1 L, plastic, narrow mouth None 7 days Sulfate* 1 L, plastic, narrow mouth None 28 days Total Kjeldahl Nitrogen** 1 L, Amber Glass Boston Round, narrow mouth H2SO4 < pH 2 28 days Total Organic Carbon** 1 L, Amber Glass Boston Round, narrow mouth H2SO4 < pH 2 28 days
1General chemistry includes all parameters noted with an *. 2Nutrients include all parameters noted with a **.

2019 Reference Site Monitoring WP B-045-OWQ-WAP-PRB-19-W-R0
Date: July 19, 2019
26
Table 9. Water Chemistry Parameters, Test Method, IDEM, and Laboratory Reporting Limits
Parameter Total Dissolved Test Method
IDEM requested Reporting
Limit (µg/L)
Pace Laboratory Reporting
Limit (µg/L)
Parameter Pace Test Method
IDEM requested Reporting
Limit (mg/L)
Pace Laboratory Reporting
Limit (mg/L)
Aluminum U.S. EPA 200.8 10 10 Alkalinity (as CaCO3) U.S. EPA 310.2 10 2Antimony U.S. EPA 200.8 1 1 Chloride U.S. EPA 300.0 1 0.25Arsenic U.S. EPA 200.8 2 1 Dissolved Solids SM 2540C 10 10Cadmium U.S. EPA 200.8 1 0.2 Hardness (as CaCO3) by calculation SM 2340B 0.4 1Calcium U.S. EPA 200.7 20 1,000 Sulfate U.S. EPA 300.0 0.05 0.25Chromium U.S. EPA 200.8 3 2 Total Solids SM 2540B 1 10Copper U.S. EPA 200.8 2 1 Total Suspended Solids SM 2540D 1 5Lead U.S. EPA 200.8 2 1Magnesium U.S. EPA 200.7 95 1,000Nickel U.S. EPA 200.8 1.5 0.5Selenium U.S. EPA 200.8 4 1Silver U.S. EPA 200.8 0.3 0.5Zinc U.S. EPA 200.8 5 3
Ammonia-N U.S. EPA 350.1 0.01 0.1Chemical Oxygen Demand (COD) U.S. EPA 410.4 3 10Nitrogen, Nitrate + Nitrite U.S. EPA 353.2 0.05 0.1Total Kjeldahl Nitrogen (TKN) U.S. EPA 351.2 0.1 0.5Total Organic Carbon (TOC) SM 5310C 1 1Total Phosphorus U.S. EPA 365.1 0.01 0.05
Priority Metals
Parameter Pace Test Method
Nutrients/Organic
Anions/Physical
IDEM requested Reporting
Limit (mg/L)
Pace Laboratory Reporting
Limit (mg/L)
SM: Standard Methods for the Examination of Water and Wastewater

2016 Reference Site Monitoring WP B-040-OWQ-WAP-PRB-19-W-R0
Date: July 19, 2019
27
B.4 Quality Control and Custody Requirements QA protocols will follow part B5 of the Surface Water QAPP (IDEM 2017a). 1. Water Chemistry Data Sample bottles and preservatives certified for purity will be used. Sample collection containers for each parameter, preservative, and holding time (Table 8) will adhere to U.S. EPA requirements for water chemistry testing. Field duplicates and matrix spike/matrix spike duplicates (MS/MSD) shall be collected at the rate of one per sample analysis set or one per every 20 samples, whichever is greater. Additionally, field blank samples will be taken at a rate of one per sample analysis set or one per every 20 samples, whichever is greater. The sample collection portion of the Chain of Custody forms will be completed in the field (Attachment 8). Sample collector will be responsible for signing off on Chain of Custody form and ensuring that the lab receiving the samples records the date, time and signs for the samples. All samples collected for water chemistry analysis will be processed by Pace Analytical Services, Inc. (Indianapolis, Indiana) following the specifications set forth in Request for Proposals 16-074 (IDEM 2016a). 2. Algal Community Data Excessive algal conditions will be recorded by staff if an algal bloom is observed on the waters’ surface or in the water column. Staff are not calibrated on this rating (i.e., the decision as to the severity of the bloom is based on best professional judgement), but an algal mat on the surface of the water or a bloom that gives the water the appearance of green paint would be justification for a decision of excessive algal conditions. To decrease the potential for cross contamination and bias of the algal samples, all equipment that has come in contact with the sample will be cleaned with detergent and rinsed with American Society for Testing and Materials (ASTM) D1193-91 Type III water after sampling has been completed at a given site. All sample labels must be accurately and thoroughly completed, including AIMS II database sample numbers, date, stream name, and sampling location. The sample collection portion of the Chain of Custody forms will be completed in the field (Attachment 8). The form will be completed when samples are transferred to the laboratory. Upon arrival to the laboratory, samples will be checked in by the laboratory manager. For the diatom samples, there will be another Chain of Custody form (Attachment 10) to document when the sample is removed from storage to be processed and made into a permanent mount (IDEM 2015b). Analysis methods for chlorophyll a and pheophytin a can be viewed in Table 7. Beginning in 2019, all samples collected for chlorophyll a and pheophytin a will be processed by the new IDEM WAPB Algal Laboratory. Two methods will be used for the determination of total chlorophyll a during this sampling season. The first is the traditional U.S. EPA Method 445.0, which determines a “corrected” total chlorophyll a concentration

2019 Reference Site Monitoring WP B-045-OWQ-WAP-PRB-19-W-R0
Date: July 19, 2019
28
fluorometrically by measuring both the initial chlorophyll a concentration followed by acidification to determine the pheophytin a concentration. The total corrected chlorophyll a concentration of a sample is determined quantitatively (equations 12.2 – 12.3 in U.S. EPA Method 445.0). The second method used will be the modified U.S. EPA Method 445.0, in which the “uncorrected” total chlorophyll a value is measured fluorometrically via a set of very narrow bandpass excitation and emission filters that are specific to chlorophyll a. No pheophytin a concentration is determined in the modified method, and this method is not impacted by other chlorophyll a degradation products which may be prevalent in inland waters. Method quantification limits for both methods will be determined using U.S. EPA Method 445.0 Section 9.0 (Quality Control) during laboratory set up prior to the 2019 sampling season. Blank filters will be run for periphyton and seston chlorophyll a. All chlorophyll a and pheophytin a filters will be processed in quadruplicate for QC purposes (four filters are processed from the same sample per analysis method). Ten percent of these replicate field samples will be analyzed at a separate laboratory (TBD). 3. QC of the diatom sampling, enumeration, and identification project will
be documented by QC checks of both field and laboratory data. See (IDEM 2015b) for description of QA/QC protocols used in diatom identification and enumeration. Fish Community Data
Fish community sampling revisits will be performed at a rate of 10 percent of the total fish community sites sampled, in this case, three for the project (IDEM 2018c). Revisit sampling will be performed with at least two weeks of recovery between the initial and revisit sampling events. The fish community revisit sampling and habitat assessment will be performed with either a partial or complete change in field team members (IDEM 2018c). The resulting IBI and QHEI total score between the initial visit and the revisit will be used to evaluate precision. The IDEM OWQ Chain of Custody Form (Attachment 8) is used to track samples from the field to the laboratory. All raw data are: 1) checked for completeness; 2) utilized to calculate derived data (i.e., total weight of all specimens of a taxon), which is entered into the AIMS II database; and 3) checked again for data entry errors. 4. Macroinvertebrate Community Data Sites at which duplicate macroinvertebrate field samples will be collected are randomly selected prior to the beginning of the field season and occur at a rate of 10 percent of the total macroinvertebrate community sites sampled, approximately 3 for the project. The macroinvertebrate community duplicate sample and corresponding habitat assessment will be performed by the same team member who performed the original sample, immediately after the initial sample is collected. This will result in a precision evaluation based on a 10% duplicate of samples collected. The IDEM OWQ COC form (Attachment 8) is used to track samples from

2019 Reference Site Monitoring WP B-045-OWQ-WAP-PRB-19-W-R0
Date: July 19, 2019
29
the field to the laboratory. Laboratory identifications and QA/QC of taxonomic work is maintained by the laboratory supervisor of the Probabilistic Monitoring Section of IDEM.
B.5 Field Parameter Measurements/Instrument Testing/Calibration The datasonde will be calibrated prior to each week’s sampling (IDEM 2002). Calibration results and drift values will be recorded, maintained, stored, and archived in log books located in the calibration laboratories at the Shadeland facility. The drift value is the difference between two successive calibrations. Field parameter calibrations will conform to the procedures as described in the instrument users’ manuals (Hydrolab Corporation 2002; YSI 2006). The DO component of the calibration procedure will be conducted using the air calibration method (IDEM 2002, page 74). The unit will be field checked for accuracy once during the week by comparison with a Winkler DO test (IDEM 2002, page 64), Hach™ turbidity, and a pH and temperature meter. Weekly calibration verification results will be recorded on the field calibrations portion of the Stream Sampling Field Data Sheet (Attachment 2) and entered into the AIMS II database. A Winkler DO test will also be conducted at sites where the DO concentration is 4.0 mg/L or less. In-situ water chemistry field data are collected in the field using calibrated or standardized equipment. Calculations may be done in the field or later at the office. Analytical results, which have limited QC checks, are included in this category. Detection limits and ranges have been set for each analysis (Table 6). QC checks are performed on information for field or laboratory results to estimate precision, accuracy, and completeness for the project, as described in the Surface Water QAPP (IDEM 2017a) Section C1.1 on page 176. A Nikon© differential interference contrast (DIC) microscope and Nikon© Elements D camera and imaging system will be used for identification and enumeration of diatoms. Branch staff calibrated the ocular reticle in the microscope. The ocular reticle was calibrated at each magnification with a stage micrometer. The calibration should be checked again if the microscope is moved to a new location.
C. ASSESSMENT AND OVERSIGHT C.1 External and Internal Checks Field and laboratory performance and system audits will be conducted to ensure good quality data. The field and laboratory performance checks include: precision measurements by relative percent difference (RPD) of field and laboratory duplicate (IDEM 2017a, pp. 56, 61—63), accuracy measurements by percent of recovery of MS/MSD samples analyzed in the laboratory (IDEM 2017a, pp. 58, 61—63), and completeness measurements by the percent of planned samples that are actually collected, analyzed, reported, and usable for the project (IDEM 2017a, page 58). Ten percent of diatom samples will be verified by the Department of Biological and Environmental Sciences of Georgia College and

2019 Reference Site Monitoring WP B-045-OWQ-WAP-PRB-19-W-R0
Date: July 19, 2019
30
State University (Milledgeville, Georgia) following the specifications set forth in (IDEM 2015b). Fish taxonomic identifications made by IDEM staff in the laboratory may be verified by regionally recognized non-IDEM freshwater fish taxonomists (e.g., Brant Fisher, Nongame Aquatic Biologist, Indiana DNR). Ten percent of macroinvertebrate samples (the initial samples taken at sites where duplicate samples were collected) will be sent off to Rithron Associates, Inc. (Missoula, MT) for verification by an outside taxonomist (IDEM 2010a). C.2 Audits
Field audits will be conducted biannually by staff of the IDEM WAPB to ensure that sampling activities adhere to approved SOPs. Audits are systematically conducted by WAPB QA staff to include all WAPB personnel that engage in field sampling activities. WAPB field staff involved with sample collection and preparation will be evaluated by QA staff trained in the associated sampling SOPs, and in the processes related to conducting an audit. QA staff will produce an evaluation report documenting each audit for review by those field staff audited as well as WAPB management. Corrective actions will be communicated to, and implemented by, field staff as a result of the audit process (IDEM 2017a, page 176).
C.3 Data Quality Assessment Levels The samples and various types of data collected by this program are intended to meet the QA criteria and rated DQA Level 3, as described in the Surface Water QAPP (IDEM 2017a, page 182).
C.4 Quality Assurance and Quality Control (QA/QC) Review Reports QA reports to management, and data validation and usability are also important components of the Surface Water QAPP, which ensures good quality data for this project.
D. DATA VALIDATION AND USABILITY A QA audit report will be submitted to the QA Manager and Project Manager for review of this project, should problems arise, need to be investigated, and corrected. As described in Section D of the Surface Water QAPP (IDEM 2017a), data are reduced (converted from raw analytical data into final results in proper reporting units); validated (qualified based on the performance of field and laboratory QC measures incorporated into the sampling and analysis procedures); and reported (described so as to completely document the calibration, analysis, QC measures, and calculations). These steps allow users to assess the data to ensure it meets the project data quality objectives. D.1. Data Handling and Associated QA/QC Activities
The various data qualifiers and flags that will be used for QA and validation of the data are found on pages 184—185 of the Surface Water QAPP (IDEM 2017a).
D.2. Data Usability

2019 Reference Site Monitoring WP B-045-OWQ-WAP-PRB-19-W-R0
Date: July 19, 2019
31
The environmental data collected and its usability are qualified per each lab or field result obtained and classified into one or more of the four categories: Acceptable Data, Enforcement Capable Results, Estimated Data, and Rejected Data as described on page 184 of the Surface Water QAPP (IDEM 2017a). Data collected in 2019 will be recorded in the AIMS II database and presented in three compilation summaries: • A general compilation of the 2019 Reference Site field and water
chemistry data prepared for use in the Indiana Integrated Water Monitoring and Assessment Report.
• A database report format containing biological results and habitat evaluations, which will be produced for inclusion in the Integrated Report as well as individual site folders.
• Laboratory bench sheets of the species taxa names and enumerations of all diatoms collected.
All data and reports will be made available to public and private entities that find the data useful.
D.3. Laboratory and Estimated Cost Laboratory analysis and data reporting for this project will comply with the Surface Water QAPP (IDEM 2017a); Request for Proposals 16-74 (see IDEM 2016a); and the IDEM Quality Management Plan (QMP) (IDEM 2018e). Analytical tests on the water chemistry parameters outlined in Table 9 will be performed by Pace Analytical Services in Indianapolis, Indiana. Algal samples will be collected by IDEM staff. Chlorophyll a and pheophytin a will be analyzed by the IDEM WAPB Algal Chlorophyll Laboratory staff. Diatom identification and enumeration will be performed by IDEM staff or an outside contractor. The Department of Biological and Environmental Sciences, Georgia College and State University will verifyi diatom taxa from ten percent of the sites sampled. All fish and macroinvertebrate samples will be collected and analyzed by IDEM staff. Ten percent of macroinvertebrate samples will be verified by Rhithron Associates, Inc. The anticipated budget for laboratory cost for the project is outlined in Table 10.
Table 10. Total Estimated Laboratory Cost for the Project.
Analysis Laboratory Estimated Cost
Water Chemistry
Pace Analytical Services 7726 Moller Road. Indianapolis, Indiana 46268
$43,803
Algal Biomass
IDEM WAPB Algal Laboratory 2525 Shadeland Avenue, Indianapolis, IN 46204
$11,000
Diatom Verification
Department of Biological and Environmental Sciences Georgia College and State University 320 S. Wayne St. Milledgeville, GA 31061
$750
Macroinvertebrate Identification
Rhithron Associates, Inc. 33 Fort Missoula Road $660

2019 Reference Site Monitoring WP B-045-OWQ-WAP-PRB-19-W-R0
Date: July 19, 2019
32
Missoula, Montana 59804 Total $50,880
2019 Reference Site Monitoring WP B-045-OWQ-WAP-PRB-19-W-R0
Date: July 19, 2019
33
E. REFERENCES (U.S. EPA 2006) Guidance on Systematic Planning Using the Data Quality
Objectives Process. EPA/240/B-06/001. U.S. EPA, Office of Environmental Information, Washington D.C.
(U.S. EPA 2013) Biological Assessment Program Review: Assessing Level of Technical Rigor to Support Water Quality Management. EPA 820-R-13-001. Office of Water, Washington, D.C. 144 pp.
[IC 14-8-2] (Indiana Code), Title 14 Natural and Cultural Resources, Article 8 General Provisions and Definitions, Chapter 2 Definitions.
[327 IAC 2] IAC (Indiana Administrative Code), Title 327 Water Pollution Control Division, Article 2. Water Quality Standards. Last updated March 14, 2018.
(IDEM 1992a) revision 1. Section 4, Standard Operating Procedures for Fish Collections, Use of Seines, Electrofishers, and Sample Processing. Biological Studies Section, Surveillance and Standards Branch, OWM, IDEM, Indianapolis, Indiana.*
(IDEM 1992b) revision 1. Section 11, Standard Operating Procedures-Appendices of Operational Equipment Manuals and Procedures. Biological Studies Section, Surveillance and Standards Branch, OWM, IDEM, Indianapolis, Indiana.*
(IDEM 1992c) revision 1. Section 2, Biological Studies Section Hazards Communications Manual (List of Contents). Biological Studies Section, Surveillance and Standards Branch, OWM, IDEM, Indianapolis, Indiana.*
(IDEM 1997) Water Quality Surveys Section Laboratory and Field Hazard Communication Plan Supplement. IDEM 032/02/018/1998, Revised October 1998. Assessment Branch, IDEM, Indianapolis, Indiana.*
(IDEM 2002) Water Quality Surveys Section Field Procedure Manual. Assessment Branch, IDEM, Indianapolis, Indiana.
(IDEM 2008) IDEM Personal Protective Equipment Policy, revised May 1, 2008. A-059-OEA-08-P-R0. IDEM, Indianapolis, Indiana.
(IDEM 2010a) Multi-habitat (MHAB) Macroinvertebrate Collection Technical Standard Operating Procedure. S-001-OWQ-W-BS-10-T-R0. Watershed Planning and Assessment Branch, Office of Water Quality, IDEM, Indianapolis, Indiana.
(IDEM 2010b) IDEM Health and Safety Training Policy, revised October 1, 2010. A-030-OEA-10-P-R2. IDEM, Indianapolis, Indiana.
(IDEM 2010c) IDEM Injury and Illness Resulting from Occupational Exposure Policy, revised October 1 2010. A-034-OEA-10-P-R2. IDEM, Indianapolis, Indiana.
(IDEM 2014) Sampling and Analysis Work Plan for the Probabilistic Monitoring Program Great Miami River Basin 2014. B-016-OWQ-W-XX-14-R0. Office

2019 Reference Site Monitoring WP B-045-OWQ-WAP-PRB-19-W-R0
Date: July 19, 2019
34
of Water Quality, Watershed Assessment and Planning Branch, Indianapolis, Indiana.*
(IDEM 2015a) Global Positioning System (GPS) Data Creation Technical Standard Operating Procedure. B-001-OWQ-WAP-XXX-15-T-R0. Office of Water Quality, Watershed Assessment and Planning Branch. Indianapolis, Indiana.
(IDEM 2015b) Processing and Identification of Diatom Samples Technical Standard Operating Procedure. B-002-OWQ-WAP-TGM-15-T-R0. Office of Water Quality, Watershed Assessment and Planning Branch. Indianapolis, Indiana.
(IDEM 2016a) “State of Indiana Request for Proposals 16-74, Solicitation for: Laboratory Analytical Services”, Indiana Department of Administration, Indianapolis, IN, February 26, 2016.*
(IDEM 2017a) Quality Assurance Project Plan (QAPP) for Indiana Surface Waters, (Rev. 4, Mar. 2017). B-001-OWQ-WAP-XX-17-Q-R4. Assessment Branch, OWQ, IDEM, Indianapolis, Indiana.
(IDEM 2017b) AIMS II Database User Guide. Watershed Assessment and Planning Branch. Office of Water Quality, Indiana Department of Environmental Management. Indianapolis, Indiana.*
(IDEM 2018a). Indiana Integrated Water Monitoring and Assessment Report 2018. Edited by Jody Arthur. Office of Water Quality, Indiana Department of Environmental Management, Indianapolis, Indiana.
(IDEM 2018b). Indiana’s 2018 Consolidated Assessment and Listing Methodology (CALM). Edited by Jody Arthur. Office of Water Quality, Indiana Department of Environmental Management, Indianapolis, Indiana.
(IDEM 2018c) Fish Community Field Collection Procedures. B-009-OWQ-WAP-XXX-18-T-R0. Office of Water Quality. Watershed Assessment and Planning Branch. Indianapolis, Indiana.
(IDEM 2018d). Phytoplankton and Periphyton Field Collection Procedures. B-004-OWQ-WAP-XX-18-T-R1. Office of Water Quality, Watershed Assessment and Planning Branch. Indianapolis, Indiana.
(IDEM 2018e). IDEM Agency Wide Quality Management Plan. IDEM, Indiana Government Center North, 100 N. Senate Ave., Indianapolis, Indiana, 46204.
(IDEM 2019a). Procedures for Completing the Macroinvertebrate Header Field Data Sheet. B-010-OWQ-WAP-XXX-19-T-R0. Office of Water Quality, Watershed Assessment and Planning Branch. Indianapolis, Indiana.
(IDEM 2019b). Procedures for Completing the Qualitative Habitat Evaluation Index. B-003-OWQ-WAP-XX-19-T-R1. Office of Water Quality, Watershed Assessment and Planning Branch. Indianapolis, Indiana.

2019 Reference Site Monitoring WP B-045-OWQ-WAP-PRB-19-W-R0
Date: July 19, 2019
35
(OHEPA 2006) Ohio Environmental Protection Agency (OHEPA). 2006. Methods for Assessing Habitat in Flowing Waters: Using the Qualitative Habitat Evaluation Index (QHEI). OHIO EPA Technical Bulletin EAS/2006-06-1. Revised by the Midwest Biodiversity Institute for State of Ohio Environmental Protection Agency, Division of Surface Water, Ecological Assessment Section, Groveport, Ohio.
(KDEP 1993) Kentucky Department of Environmental Protection (KDEP). 1993. Methods for assessing biological integrity of surface waters. Kentucky Department of Environmental Protection, Division of Water, Frankfort, Kentucky.
(Barbour et al. 1999) Barbour, M.T., J. Gerritsen, B.D. Snyder and J.B. Stribling. 1999. Rapid Bioassessment Protocols for Use in Streams and Wadeable Rivers: Periphyton, Benthic Macroinvertebrates and Fish, Second Edition. EPA/841/B-99/002. U.S. Environmental Protection Agency; Office of Water; Washington, D.C.
(Hill 1997) Hill, B. H. 1997. The use of periphyton assemblage data in an Index of Biotic Integrity. Bulletin of the North American Benthological Society 14, 158.*
(Klemm et al. 1990) Klemm, D.J., Lewis, P.A., Fulk, F. and Lazorchak, J.M. 1990. Macroinvertebrate Field and Laboratory Methods for Evaluating the Biological Integrity of Surface Waters. EPA/600/4-90/030. Environmental Monitoring Systems Laboratory, Monitoring Systems and Quality Assurance, Office of Research and Development, U.S. Environmental Protection Agency, Cincinnati, Ohio.
(Plafkin et al. 1989) Plafkin, J.L., Barbour, M.T., Porter, K.D., Gross, S.K. and Hughes, R.M. 1989. Rapid Bioassessment Protocols for Use in Streams and Rivers: Benthic Macroinvertebrates and Fish. EPA/440/4-89/001. Assessment and Watershed Protection Division, U.S. Environmental Protection Agency, Washington, D.C.
(Rankin 1995) Rankin, E.T. 1995. Habitat Indices in Water Resource Quality Assessments. pp. 181—208, Chapter 13, Biological Assessment and Criteria: Tools for the Risk-based Planning and Decision Making, edited by Wayne S. Davis and Thomas P. Simon, Lewis Publishers, Boca Raton, Florida.*
(Simon and Dufour 2005) Simon, T.P. and Dufour, R.L. 2005. Guide to appropriate metric selection for calculating the Index of Biotic Integrity (IBI) for Indiana Large and Great Rivers, Inland Lakes, and Great Lakes nearshore. U.S. Department of the Interior, Fish and Wildlife Service, Bloomington Field Office, Bloomington, Indiana.
(Stevenson 1998) Stevenson, R. J. 1998. Diatom indicators of stream and wetland stressors in a risk management framework. Environmental Monitoring and Assessment 51:107—118.*

2019 Reference Site Monitoring WP B-045-OWQ-WAP-PRB-19-W-R0
Date: July 19, 2019
36
(Stevenson and Pan 1999) Stevenson, R. J. and Pan, Y. 1999. Assessing ecological conditions in rivers and streams with diatoms. Pages 11—40 in E. F. Stoermer and J. P. Smol, editors. The Diatoms: Applications to the Environmental and Earth Sciences. Cambridge University Press, Cambridge, UK.*
(Stoddard et al. 2006) Stoddard, J. L., D. P. Larsen, C. P. Hawkins, R. K. Johnson, and R. H. Norris. 2006. Setting expectations for the ecological condition of streams: the concept of reference condition. Ecological Applications 16(4):1267—1276.*
(Hydrolab Corporation 2002) Hydrolab Corporation. 2002, Revision C. Quanta Water Quality Monitoring System Operating Manual. Loveland, Colorado.
(YSI 2006) YSI Incorporated. 2006, revision b. 6-Series Environmental Monitoring Systems Manual, Yellow Springs, Ohio.
*Document may be inspected at the Watershed and Assessment Branch office, located at 2525 North Shadeland Avenue, Indianapolis, IN.

2019 Reference Site Monitoring WP B-045-OWQ-WAP-PRB-19-W-R0
Date: July 19, 2019
37
F. DISTRIBUTION LIST Electronic Distribution Only:
Name Organization Kristen Arnold IDEM/OWQ/WAPB/Technical and Logistical Services
Section Jody Arthur IDEM/OWQ/WAPB/Technical E7 James Bailey Office of Program Support Timothy Bowren IDEM/OWQ/WAPB/Technical and Logistical Services
Section Josh Brosmer IDEM/OWQ/WAPB/Watershed Planning and Restoration
Section Angela Brown IDEM/OWQ/WAPB/Watershed Planning and Restoration
Section Todd Davis IDEM/OWQ/WAPB/Probabilistic Monitoring Section Raissa Espejo IDEM/OWQ/WAPB/Probabilistic Monitoring Section Jessica Faust IDEM/OWQ/WAPB/Watershed Planning and Restoration
Section Tim Fields IDEM/OWQ/WAPB/Probabilistic Monitoring Section Kevin Gaston IDEM/OWQ/WAPB/Probabilistic Monitoring Section Maddie Genco IDEM/OWQ/WAPB/Targeted Monitoring Section Kassia Groszewski IDEM/OWQ/WAPB/Targeted Monitoring Section Kathleen Hagan IDEM/OWQ/WAPB/Watershed Planning and Restoration
Section Paul Higginbotham IDEM/OWQ/Deputy Assistant Commissioner Charles Hostetter IDEM/OWQ/WAPB/Technical and Logistical Services
Section David Jordan IDEM/OWQ/WAPB/Technical and Logistical Services
Section Kalina Manoylov Georgia College and State University/Department of
Biological and Environmental Sciences Paul McMurray IDEM/OWQ/WAPB/Probabilistic Monitoring Section Martha Clark Mettler IDEM/OWQ/Assistant Commissioner Marylou Renshaw IDEM/OWQ/WAPB/Branch Chief Michelle Ruan IDEM/OWQ/WAPB/Probabilistic Monitoring Section Stacey Sobat IDEM/OWQ/WAPB/Probabilistic Monitoring Section Jim Stahl IDEM/OWQ/WAPB/Technical E7 Amanda Studor Bond IDEM/OWQ/WAPB/Targeted Monitoring Section Cyndi Wagner IDEM/OWQ/WAPB/Targeted Monitoring Section Kayla Werbianskyj IDEM/OWQ/WAPB/Targeted Monitoring Section Scott Zello-Dean IDEM/OWQ/WAPB/Probabilisitic Monitoring Section

2019 Reference Site Monitoring WP B-045-OWQ-WAP-PRB-19-W-R0
Date: July 19, 2019
38
Attachment 1 IDEM Site Reconnaissance Form

2019 Reference Site Monitoring WP B-045-OWQ-WAP-PRB-19-W-R0
Date: July 19, 2019
39
Attachment 2 IDEM Stream Sampling Field Data Sheet
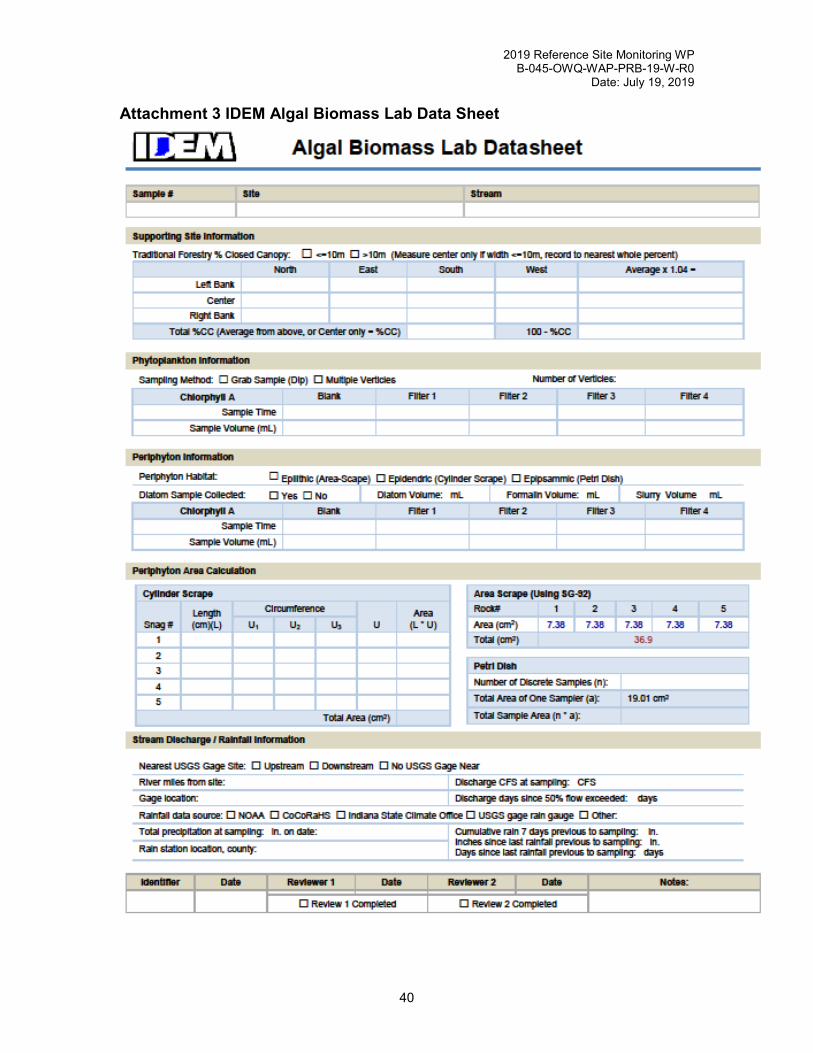
2019 Reference Site Monitoring WP B-045-OWQ-WAP-PRB-19-W-R0
Date: July 19, 2019
40
Attachment 3 IDEM Algal Biomass Lab Data Sheet

2019 Reference Site Monitoring WP B-045-OWQ-WAP-PRB-19-W-R0
Date: July 19, 2019
41
Attachment 4 IDEM Physical Description of Stream Site Form (front)

2019 Reference Site Monitoring WP B-045-OWQ-WAP-PRB-19-W-R0
Date: July 19, 2019
42
Attachment 4 IDEM Physical Description of Stream Site Form (back)

2019 Reference Site Monitoring WP B-045-OWQ-WAP-PRB-19-W-R0
Date: July 19, 2019
43
Attachment 5 IDEM Fish Collection Data Sheet (front)

2019 Reference Site Monitoring WP B-045-OWQ-WAP-PRB-19-W-R0
Date: July 19, 2019
44
Attachment 6 IDEM OWQ Macroinvertebrate Header Form
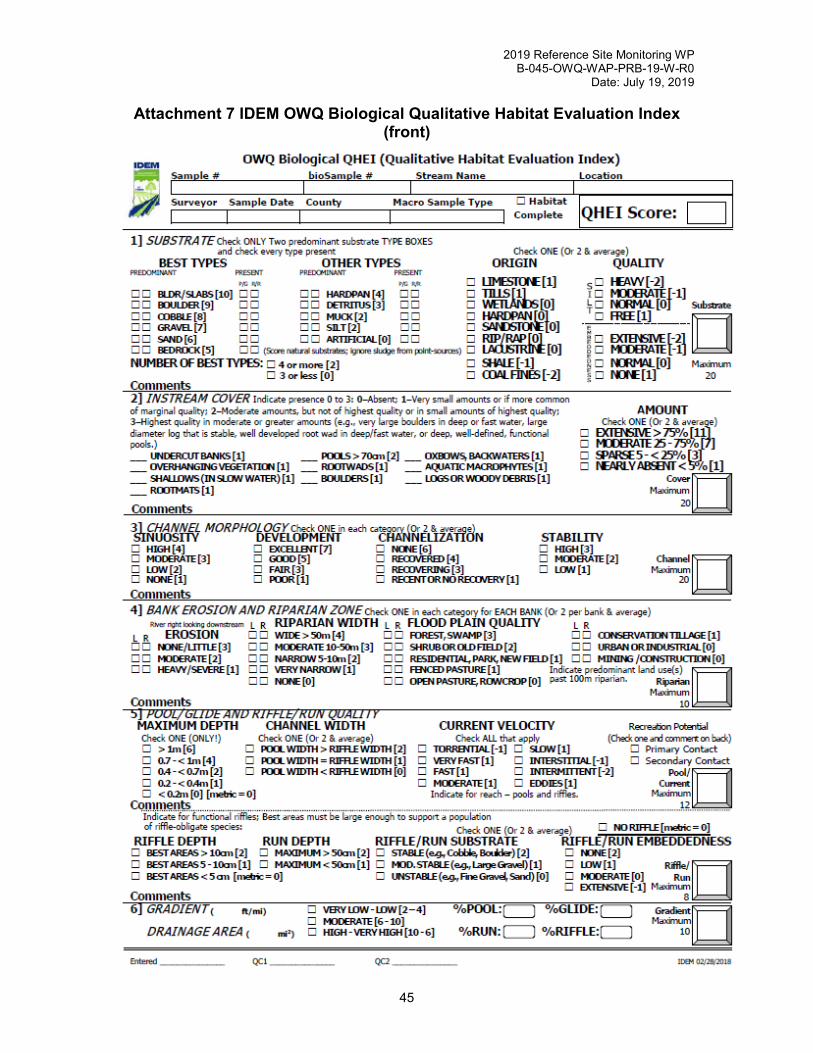
2019 Reference Site Monitoring WP B-045-OWQ-WAP-PRB-19-W-R0
Date: July 19, 2019
45
Attachment 7 IDEM OWQ Biological Qualitative Habitat Evaluation Index (front)

2019 Reference Site Monitoring WP B-045-OWQ-WAP-PRB-19-W-R0
Date: July 19, 2019
46
Attachment 7 (continued) IDEM OWQ Biological QHEI (back)

2019 Reference Site Monitoring WP B-045-OWQ-WAP-PRB-19-W-R0
Date: July 19, 2019
47
Attachment 8 IDEM OWQ Chain of Custody Form

2019 Reference Site Monitoring WP B-045-OWQ-WAP-PRB-19-W-R0
Date: July 19, 2019
48
Attachment 9 2019 Reference Sites Water Sample Analysis Request Form

2019 Reference Site Monitoring WP B-045-OWQ-WAP-PRB-19-W-R0
Date: July 19, 2019
49
Attachment 10 Biological Samples Laboratory Chain of Custody Form

2019 Reference Site Monitoring WP B-045-OWQ-WAP-PRB-19-W-R0
Date: July 19, 2019
50
Appendix 1 List of IDEM Documents and SOPs used in the Development of the 2019 Reference Site Monitoring Program Sampling and Analysis Work Plan. (IDEM 1992a) revision 1. Section 4, Standard Operating Procedures for Fish
Collections, Use of Seines, Electrofishers, and Sample Processing. Biological Studies Section, Surveillance and Standards Branch, OWM, IDEM, Indianapolis, Indiana.*
(IDEM 1992b), revision 1. Section 11, Standard Operating Procedures-Appendices of Operational Equipment Manuals and Procedures. Biological Studies Section, Surveillance and Standards Branch, OWM, IDEM, Indianapolis, Indiana.*
(IDEM 1992c), revision 1. Section 2, Biological Studies Section Hazards Communications Manual (List of Contents). Biological Studies Section, Surveillance and Standards Branch, OWM, IDEM, Indianapolis, Indiana.*
(IDEM 1997) Water Quality Surveys Section Laboratory and Field Hazard Communication Plan Supplement. IDEM 032/02/018/1998, Revised October 1998. Assessment Branch, IDEM, Indianapolis, Indiana.*
(IDEM 2002) Water Quality Surveys Section Field Procedure Manual. Assessment Branch, IDEM, Indianapolis, Indiana.
(IDEM 2008) IDEM Personal Protective Equipment Policy, revised May 1, 2008. A-059-OEA-08-P-R0. IDEM, Indianapolis, Indiana.
(IDEM 2010a) Multi-habitat (MHAB) Macroinvertebrate Collection Technical Standard Operating Procedure. S-001-OWQ-W-BS-10-T-R0. Watershed Planning and Assessment Branch, Office of Water Quality, IDEM, Indianapolis, Indiana.
(IDEM 2010b) IDEM Health and Safety Training Policy, revised October 1, 2010. A-030-OEA-10-P-R2. IDEM, Indianapolis, Indiana.
(IDEM 2010c) IDEM Injury and Illness Resulting from Occupational Exposure Policy, revised October 1 2010. A-034-OEA-10-P-R2. IDEM, Indianapolis, Indiana.
(IDEM 2015a) Global Positioning System (GPS) Data Creation Technical Standard Operating Procedure. B-001-OWQ-WAP-XXX-15-T-R0. Office of Water Quality, Watershed Assessment and Planning Branch. Indianapolis, Indiana.
(IDEM 2015b) Processing and Identification of Diatom Samples Technical Standard Operating Procedure. B-002-OWQ-WAP-TGM-15-T-R0. Office of Water Quality, Watershed Assessment and Planning Branch. Indianapolis, Indiana.
(IDEM 2017a) Quality Assurance Project Plan (QAPP) for Indiana Surface Waters, (Rev. 4, Mar. 2017). B-001-OWQ-WAP-XX-17-Q-R4. Assessment Branch, OWQ, IDEM, Indianapolis, Indiana.
(IDEM 2017b) AIMS II Database User Guide. Watershed Assessment and Planning Branch. Office of Water Quality, Indiana Department of Environmental Management. Indianapolis, Indiana.*
(IDEM 2018a). Indiana Integrated Water Monitoring and Assessment Report 2018. Edited by Jody Arthur. Office of Water Quality, Indiana Department of Environmental Management, Indianapolis, Indiana.

2019 Reference Site Monitoring WP B-045-OWQ-WAP-PRB-19-W-R0
Date: July 19, 2019
51
(IDEM 2018b). Indiana’s 2018 Consolidated Assessment and Listing Methodology (CALM). Edited by Jody Arthur. Office of Water Quality, Indiana Department of Environmental Management, Indianapolis, Indiana.
(IDEM 2018c) Fish Community Field Collection Procedures. B-009-OWQ-WAP-XXX-18-T-R0. Office of Water Quality. Watershed Assessment and Planning Branch. Indianapolis, Indiana.
(IDEM 2018d). Phytoplankton and Periphyton Field Collection Procedures. B-004-OWQ-WAP-XX-18-T-R1. Office of Water Quality, Watershed Assessment and Planning Branch. Indianapolis, Indiana.
(IDEM 2018e). IDEM Agency Wide Quality Management Plan. IDEM, Indiana Government Center North, 100 N. Senate Ave., Indianapolis, Indiana, 46204.
(IDEM 2019a). Procedures for Completing the Macroinvertebrate Header Field Data Sheet. B-010-OWQ-WAP-XXX-19-T-R0. Office of Water Quality, Watershed Assessment and Planning Branch. Indianapolis, Indiana.
(IDEM 2019b). Procedures for Completing the Qualitative Habitat Evaluation Index. B-003-OWQ-WAP-XX-19-T-R1. Office of Water Quality, Watershed Assessment and Planning Branch. Indianapolis, Indiana.
*This document may be inspected at the Watershed and Assessment Branch office, located at 2525 North Shadeland Avenue, Indianapolis, IN.

2019 Reference Site Monitoring WP B-045-OWQ-WAP-PRB-19-W-R0
Date: July 19, 2019
52
Appendix 2 IDEM Fish Community Assessments for Aquatic Life Use IDEM collects fish along with other data (chemical parameters, nutrients, macroinvertebrate, and habitat) to monitor the health of streams and rivers in Indiana. There are many advantages of using fish for monitoring stream health:
• Many fish have life spans of greater than three years, allowing detection of degradation in habitat or water chemistry over time which will alter the expected fish community structure.
• The knowledge of fish life history, feeding, and reproductive behavior is well known and can be used to detect changes in water chemistry or habitat alterations.
• Identification of fish species can usually be made in the field so that fish are returned to the stream and time utilized for laboratory identifications kept minimal.
The Indiana Administrative Code [327 IAC 2-1-3(a)(2); 327 IAC 2-1.5-5(a)(2)] has narrative biological criteria that states “all waters, except those designated as limited use, will be capable of supporting a well-balanced, warm water aquatic community.” The water quality standard definition of a “well-balanced aquatic community” is “an aquatic community that is diverse in species composition, contains several different trophic levels, and is not composed mainly of pollution tolerant species” [327 IAC 2-1-9(59)]. To measure whether or not the fish community meets this definition, IDEM uses an Index of Biotic Integrity (IBI), which is composed of 12 fish community characteristics chosen based on what part of the state you are sampling (ecoregion) and the size of stream (drainage area). The 12 different characteristics can score a 0, 1, 3, or 5, each of which represents a deviation from expected fish community structure (i.e. 5 = no deviation from expectations, 1 = severe deviation from expected fish community structure). The total score can range from 0 (no fish) to 60 (excellent, comparable to “least impacted” conditions). Indiana expects streams to score at least 36 out of 60 to meet aquatic life use water quality standards. The chart below, modified from a table developed by Karr et al. 1986, uses total IBI score, integrity class and attributes to define the fish community characteristics in Indiana streams and rivers.
Total IBI Score Integrity Class Attributes 53—60 Excellent Comparable to “least
impacted” conditions, exceptional assemblage of species.
45—52 Good Decreased species richness (intolerant species in particular), sensitive species present.
36—44 Fair Intolerant and sensitive species absent, skewed trophic structure.
23—35 Poor Top carnivores and many expected species absent or rare, omnivores and tolerant species dominant.
12—22 Very Poor Few species and individuals present, tolerant species dominant, diseased fish frequent.
<12 No Fish No fish captured during sampling.
Karr, J.R., K.D. Fausch, P.L. Angermeier, P.R. Yant, and I.J Schlosser. 1986. Assessing biological integrity in running waters: a method and its rationale. Illinois Natural History Survey Special Publication 5. 28 p.
Some examples of metrics and fish specimens for the Index of Biotic Integrity (IBI) looking at species composition, trophic levels, and tolerance to water pollution or habitat disturbance. 1. Number of Species (generally more species = better quality stream)

2019 Reference Site Monitoring WP B-045-OWQ-WAP-PRB-19-W-R0
Date: July 19, 2019
53
2. Number of Darter, Madtom, Sculpin Species (species require high dissolved oxygen and clean rocky substrates so higher number = better quality stream) Examples: rainbow darter, brindled madtom, mottled sculpin
% Large River Individuals (species require habitats typical in great rivers in terms of bottom substrates, current velocity, backwater areas, etc., so higher percentage = better quality river) Examples: chestnut lamprey, channel catfish, bullhead minnow, silver chub
3. % Headwater Individuals (species in small streams occupying permanent habitat with low environmental stress so greater percentage = better quality stream) Examples: western blacknose dace, southern redbelly dace, fantail darter
Number of Sunfish or Centrarchidae Species (species occupy pools which act as “sinks” for potential pollutants and silt so fewer number of these species = low quality stream) Examples: rock bass, bluegill, largemouth bass
4. Number of Sucker or Round Body Sucker Species (species do not tolerate habitat and water quality degradation so more = better quality stream) Examples: black redhorse, northern hog sucker
Number of Minnow Species (generally more minnow species = better quality stream) Examples: spotfin shiner, silverjaw minnow, hornyhead chub
5. Number of Sensitive Species (species sensitive to pollution so more species = better quality stream) Examples: greenside darter, smallmouth bass, longear sunfish
6. % Tolerant Individuals (species tolerant to pollution so greater percentage = low quality stream) Examples: yellow bullhead, green sunfish, central mudminnow
7. % Omnivore/Detritivore Individuals (species that consume at least 25% plant and 25% animal material which makes them opportunistic feeders when other food sources are scarce; thus, greater percentage = lower quality stream) Examples: bluntnose minnow, white sucker, gizzard shad
8. % Insectivore/Invertivore Individuals (species whose diet is mainly benthic insects so the metric is a reflection of the food source; thus, lower percentage = lower quality stream) Examples: blackstripe topminnow, emerald shiner, logperch
9. % Carnivore Individuals (species whose diet is carnivorous and also reflects the availability of the food source; too high or too low percentage of carnivores = lower quality stream and imbalance of trophic levels) Examples: spotted bass, grass pickerel
% Pioneer Individuals (species that are first to colonize a stream after environmental disturbance so higher percentage of pioneer individuals = lower quality stream) Examples: creek chub, central stoneroller, johnny darter
10. Number of Individuals (generally more individuals = better quality stream)
11. % Simple Lithophilic Individuals (species that require clean gravel or cobble for successful reproduction since they simply broadcast their eggs on the substrate, fertilize, and provide no parental care; thus, heavy siltation or environmental disturbance will result in a lower percentage of simple lithophilic species = lower quality stream) Examples: bigeye chub, striped shiner, orangethroat darter
12. % Individuals with Deformities, Eroded Fins, Lesions, and Tumors (DELT’s) (diseased individuals with external anomalies as a result of bacterial, fungal, viral, and parasitic infections, chemical pollutants, overcrowding, improper diet, and other environmental degradation. Percentages should be absent or very low naturally so higher percentage = low quality stream) Examples: deformed blackstripe topminnow, creek chub with tumors

2019 Reference Site Monitoring WP B-045-OWQ-WAP-PRB-19-W-R0
Date: July 19, 2019
54
Appendix 3 Calculating IDEM Macroinvertebrate Index of Biotic Integrity (mIBI) The purpose of this document is to describe the laboratory processing and data analysis procedures used by the Indiana Department of Environmental Management (IDEM) to calculate the macroinvertebrate Index of Biotic Integrity (mIBI). Standard Operating Procedures (SOPs) are being developed to describe these processes but it may be some time before they are finalized. An SOP describing the methods used by IDEM to collect macroinvertebrate samples with a multi-habitat (MHAB) sampling method was recently completed (available at http://monitoringprotocols.pbworks.com/f/S-001-OWQ-W-BS-10-S-R0.pdf). The index period for collection of macroinvertebrate samples with the MHAB sampling method is July 15 to October 30. The entire sample is processed in the laboratory as subsampling has already been performed in the field. All macroinvertebrate individuals are counted with the exception of empty snail and clam shells, microcrustaceans (Ostracoda, Branchiopoda, Copepoda), larval and pupal insect exuviae, and terrestrial insects (including the terrestrial adults of aquatic insect larvae); invertebrate specimens missing their head are also excluded. The level of taxonomic resolution used in the identification of macroinvertebrates may depend in large part on the condition (instar and physical condition) of the specimens and the availability of taxonomic resources that are comprehensive and appropriate for Indiana's fauna. Specimens are generally identified to the “lowest practical" taxonomic level.
• Oligochaeta (aquatic worms, Hirudinea and Branchiobdellida), Planaria and Acari are only identified to family or a higher level.
• Freshwater snails and clams are identified to genus. • Freshwater crustacea are identified to genus (Amphipoda and Isopoda) or species (Decapoda). • Aquatic insects are identified to family (Collembola and several Dipteran families). • Genus and species (all other insects).
The following table lists insect genera that are often identified to species (and may contain multiple species in a sample) and taxonomic resources commonly used by IDEM biologists for their identification (full citations for these resources are listed in the Taxonomic References at the end of this document. Ephemeroptera: Baetidae: Baetis (separate B. intercalaris and B. flavistriga with Moriharra and McCafferty 1979, leave everything else at Baetis) Caenidae: Caenis: Provonsha 1990 Heptageniidae: Mccaffertium (formerly Stenonema subgenus Mccaffertium): Bednarik and McCafferty 1979 Odonata: Gomphidae: Dromogomphus: Westfall and Tennessen 1979 Coenagrionidae: Argia and Enallagma: Westfall and May 1996 Hemiptera: Corixidae: Trichocorixa and Palmacorixa: Hungerford 1948, Hilsenhoff 1984 Megaloptera: Corydalidae: Chauliodes and Nigronia: Rasmussen and Pescador 2002 Coleoptera: Haliplidae: Peltodytes: Brigham 1996 Dytiscidae: Neoporus, Heterosternuta, Laccophilus, Coptotomus: Larson et al. 2000 Hydrophilidae: Tropisternus, Berosus, Enochrus: Hilsenhoff 1995A and 1995B Elmidae: Stenelmis, Dubiraphia, Optioservus: Hilsenhoff and Schmude, Hilsenhoff 1982 Trichoptera: Philopotamidae: Chimarra: Hilsenhoff 1982 Leptoceridae: Nectopsyche: Glover and Floyd 2004 Hydropsychidae: Hydropsyche: Schuster and Etnier 1978 Diptera: Chironomidae: Ablabesmyia: Roback 1985 (subgenus/ species group) Polypedilum: Maschwitz and Cook 2000 (subgenus/ species group) Cricotopus/Orthocladius: Merritt et al 2007 (subgenus/ species group)

2019 Reference Site Monitoring WP B-045-OWQ-WAP-PRB-19-W-R0
Date: July 19, 2019
55
After all organisms in the sample have been identified to the lowest practical taxon, those taxa are then associated with their corresponding tolerance, functional feeding group and habit values (found in the spreadsheet "Indiana Macroinvertebrate Attributes"). Organisms without a tolerance value, functional feeding group, or habit are not included in the calculations for those specific metrics (this may become more evident while looking at the metric example provided). For taxa metrics, all of the taxa listed for a specific group (EPT, Diptera) are counted, regardless of level of identification (i.e., if there were 4 taxa under the Chironomidae family (1 family level ID, 1 Cricotopus genus level ID, and 2 distinct species level IDs under the Cricotopus genus) this would be considered 4 taxa). The metrics are then calculated as follows: 1 - Total Number of Taxa: Numerical count of all identified taxa in the sample 2 - Total Number of Individuals: Numerical count of the number of individual specimens in the sample 3 - Total Number of EPT Taxa: Numerical count of all Ephemeroptera, Plecoptera and Trichoptera taxa in the sample 4 - Total Number of Diptera Taxa: Numerical count of all Diptera taxa in the sample 5 - % Orthocladiinae + Tanytarsini of Chironomidae: Number of individuals in the chironomid subfamily Orthocladiinae and tribe Tanytarsini divided by the total number of Chironomidae in the sample 6 - % Noninsect (minus crayfish): Number of individuals, except for crayfish, that are not in the Class Insecta (Isopoda, Amphipoda, Acari, snails, freshwater clams, Oligochaeta, Nematoda, Nematomorpha) divided by the total number of individuals in the sample 7 - % Intolerant: Number of individuals with a tolerance value of 0—3 divided by the total number of individuals in the sample 8 - % Tolerant: Number of individuals with a tolerance value of 8—10 divided by the total number of individuals in the sample 9 - % Predators: Number of individuals with a functional feeding group designation of "Predator" divided by the total number of individuals in the sample 10 - % Shredders + Scrapers: Combined number of individuals in the functional feeding groups "Shredder" and "Scraper" divided by the total number of individuals in the sample 11 - % Collector-Filterers: Number of individuals in the functional feeding group "Collector-Filterer" divided by the total number of individuals in the sample 12 - % Sprawlers: Number of individuals with a habit specificity of "Sprawler" divided by the total number of individuals in the sample These metric values are then scored as a 1, 3, or 5 according to the criteria in the following table:
Metric 1 3 5 Number of Taxa < 21 ≥ 21 and <41 ≥ 41 Number of Individuals < 129 ≥ 129 and < 258 ≥ 258 Number of EPT Taxa Drainage Area: < 5 mi2 < 2 ≥ 2 and < 4 ≥ 4 Drainage Area: ≥ 5 and < 50 mi2 < 4 ≥ 4 and < 8 ≥ 8 Drainage Area: ≥ 50 mi2 < 6 ≥ 6 and < 12 ≥ 12 % Orthocladiinae + Tanytarsini of Chironomidae ≥ 47 ≥ 24 and < 47 < 24 % Noninsects Minus Crayfish ≥ 35 ≥ 18 and < 35 < 18 Number of Diptera Taxa < 7 ≥ 7 and < 14 ≥ 14 % Intolerant < 15.9 ≥ 15.9 and < 31.8 ≥ 31.8 % Tolerant ≥ 25.3 ≥ 12.6 and < 25.3 < 12.6 % Predators < 18 ≥ 18 and < 36 ≥ 36 % Shredders + Scrapers < 10 ≥ 10 and < 20 ≥ 20 % Collector-Filterers ≥ 20 ≥ 10 and < 20 < 10 % Sprawlers < 3 ≥ 3 and < 6 ≥ 6

2019 Reference Site Monitoring WP B-045-OWQ-WAP-PRB-19-W-R0
Date: July 19, 2019
56
Most scoring classifications are the same regardless of stream drainage area; the exception is the "Number of EPT Taxa" metric which increases with increasing drainage area. After all metrics have been scored, the individual metric scores are summed and the total is the mIBI score for that particular site. Scores less than 36 are considered impaired while those greater than or equal to 36 are unimpaired. Example of Derivation of Metric Scores for the Macroinvertebrate Index of Biotic Integrity
TAXA NAME FEED GRP TOL HAB/BHV # OF IND Heptagenia SC 3 1 Leucrocuta SC 2 cn 1 Acerpenna pygmaea OM 2 sw 1 Baetis flavistriga GC 3 sw 1 Callibaetis GC 6 sw 1 Ephemera simulans 1 Ischnura verticalis PR 1 Berosus peregrinus SH 6 sw 1 Dubiraphia GC 5 cn 1 Macronychus glabratus OM 3 cn 1 Ceratopsyche bronta 5 1 Pycnopsyche SH 3 sp 1 Chrysops GC 5 1 Procladius PR 7 sp 1 Paraphaenocladius GC sp 1 Lirceus GC 8 cr 1 Ferrissia rivularis SC 6 1 Physella SC 8 1 Corbicula fluminea FC 6 1 NAIDIDAE GC 8 1 Acariformes 4 1 Maccaffertium pulchellum SC 2 2 Tricorythodes GC 3 sw 2 Boyeria vinosa PR 4 cb 2 Rheumatobates PR sk 2 Trepobates PR 2 Stenelmis SC 5 cn 2 Polypedilum flavum 2 Stictochironomus OM 4 bu 2 Caenis latipennis GC 3 Palmacorixa nana PI 4 sw 3 Cheumatopsyche FC 3 cn 3 Orconectes GC 4 3 Hetaerina americana PR 4 Ancyronyx variegatus OM 4 5 Baetis intercalaris OM 3 sw 6 Peltodytes duodecimpunctata 6 Trepobates inermis 7 Dubiraphia minima 7 Hyalella azteca GC 8 cr 9 Polypedilum illinoense 7 16 Stenelmis sexlineata 18 Grand Total 127

2019 Reference Site Monitoring WP B-045-OWQ-WAP-PRB-19-W-R0
Date: July 19, 2019
57
Metrics Metric Values Metric Scores Total Number of Taxa 42 3 Total Abundance of Individuals 127 1 Number of EPT Taxa 13 5 % Orthocladinae + Tanytarsinii of Chironomidae 4.55 5 % Noninsects - Crayfish 11.81 5 Number of Diptera Taxa 6 1 % Intolerant Taxa (Score 0—3) 14.96 1 % Tolerant Taxa (Score 8—10) 9.45 5 % Predators 9.45 1 % Shredders + Scrapers 7.87 1 % Collector-Filterers 3.15 5 % Sprawlers 2.36 1 mIBI Score 34
Taxonomic References Bednarik A.F. and W.P. McCafferty. 1979. Biosystematic revision of the genus Stenonema
Ephemeroptera: Heptageniidae). Canadian Bulletin of Fisheries and Aquatic Sciences 201: 1—73.
Brigham, W.L. 1996. Key to adult Peltodytes of the U.S. and Canada (Coleoptera: Haliplidae).
Glover, J.B. and M. A. Floyd. 2004. Larvae of the genus Nectopsyche (Trichoptera:Leptoceridae) in eastern North America, including a new species from North Carolina. Journal of the North American Benthological Society 23(3) 526—541.
Hilsenhoff WL. 1982. Using a biotic index to evaluate water quality in streams. Department of Natural Resources, Technical Bulletin 132, Madison, Wisconsin.
Hilsenhoff, W.L. 1984. Aquatic Hemiptera of Wisconsin. Great Lakes Entomologist 17: 29—50.
Hilsenhoff, W.L. 1995. Aquatic Hydrophilidae and Hydraenidae of Wisconsin (Coleoptera). I. Introduction, key to genera of adults, and distribution, habitat, life cycle, and identification of species of Helophorus Fabricius, Hydrochus Leach, and Berosus Leach (Hydrophilidae), and Hydraenidae. The Great Lakes Entomologist 28(1): 25—53.
Hilsenhoff, W.L. 1995. Aquatic Hydrophilidae and Hydraenidae of Wisconsin (Coleoptera). II. Introduction, key to genera of adults, and distribution, habitat, life cycle, and identification of species of Hydrobini and Hydrophili (Hydrophilidae: Hydrohilinae). The Great Lakes Entomologist 28(2): 97—126.
Hilsenhoff, W.L. and K.L. Schmude. 1992. Riffle beetles of Wisconsin (Coleoptera: Dryopidae, Elmidae, Lutrochidae, Psepheniidae) with notes on distribution, habitat, and identification. The Great Lakes Entomologist 25(3): 191—213.
Hungerford H.B. 1948. The Corixidae of the Western Hemisphere (Hemiptera). Reprint of The University of Kansas Science Bulletin 32:1—827, reprinted (1977) by Entomological Reprint Specialists: Los Angeles, California.
Larson, D.J., Y. Alarie, and R.E. Roughley. 2000. Predaceous Diving Beetles (Coleoptera: Dytiscidae) of the Nearctic Region, with emphasis on the fauna of Canada and Alaska. NRC Research Press, Ottawa.
Maschwitz, D.E. and E. F. Cook. 2000. Revision of the Nearctic Species of the Genus Polypedilum Kieffer (Diptera: Chironomidae) in the Subgenera P. (Polypedilum) Kieffer and P. (Urespedilum) Oyewo and Saether. Ohio Biological Survey Bulletin (New Series) 12(3). 135 pp.
Morihara D.K. and McCafferty W.P. 1979. The Baetis larvae of North America (Ephemeroptera: Baetidae). Transactions of the American Entomological Society 105:139—221.
2019 Reference Site Monitoring WP B-045-OWQ-WAP-PRB-19-W-R0
Date: July 19, 2019
58
Provonsha A.V. 1990. A revision of the genus Caenis in North America (Ephemeroptera: Caenidae). Transactions of the American Entomological Society 116:801—884.
Rasmussen, A.K. and M.L. Pescador. 2002. A Guide to the Megaloptera and Aquatic Neuroptera of Florida. http://publicfiles.dep.state.fl.us/dear/labs/biology/biokeys/megaloptera.pdf
Roback, S.S. 1985. The immature chironomids of the eastern United States VI - genus Ablabesmyia. Proceedings of the Academy of Natural Sciences of Philadelphia 137(2): 153—212.
Schuster, G.A. and D.A. Etnier. 1978. Manual for the Identification of the Larvae of the Caddisfly Genera Hydropsyche Pictet and Symphitopsyche Ulmer in Eastern and Central North America (Trichoptera:Hydropsychidae) EPA -600-4-78-060
Westfall, M.J., Jr. and M.L. May. 2006. Damselflies of North America (Revised Edition).
Westfall, M.J. Jr. and K.J. Tennessen. 1979. Taxonomic clarification within the genus Dromogomphus Selys (Odonata: Gomphidae). Florida Entomologist 62(3). 266—273.
If you have further questions regarding the IDEM mIBI please contact:
Paul D. McMurray, Jr. Environmental Manager Indiana Department of Environmental Management Office of Water Quality, Watershed Assessment and Planning Branch Probabilistic Monitoring Section 100 N. Senate Ave. MC 65-40-2 Shadeland Indianapolis, IN 46204-2251 317-308-3210 [email protected]