2020-2024 pa statewide comprehensive outdoor recreation
TRANSCRIPT

2020-2024 PA Statewide
Comprehensive Outdoor
Recreation Plan:
Public Survey
Final Report
Submitted to:
Pennsylvania Department of Conservation
and Natural Resources
Prepared by:
Center for Survey Research
Penn State Harrisburg
August 2019

TABLE OF CONTENTS
EXECUTIVE SUMMARY.............................................................................. 1
INTRODUCTION ......................................................................................... 3
Data Analysis Notes........................................................................................... 3
METHODOLOGY ......................................................................................... 3
Institutional Review Board ................................................................................. 3
Instrument Development ................................................................................... 3
Data Collection ................................................................................................. 4
Survey Response ................................................................................................ 4
Data Preparation and Analysis Notes ................................................................. 4
Study Limitations ............................................................................................... 4
RESULTS ....................................................................................................... 5
Respondent Profile ............................................................................................ 5
Participation in Outdoor Activities ..................................................................... 7
Facility Investment Priorities ............................................................................ 12
Outdoor Recreation and Conservation Funding Priorities................................. 17
Information Seeking ......................................................................................... 18
Technology Utilization ..................................................................................... 19
Attitudes Toward Outdoor Recreation ............................................................ 21
Help Participating in Outdoor Recreation in PA................................................ 23
APPENDIX A – MAP AND LIST OF SURVEY REGIONS.................................. 31
APPENDIX B – SURVEY INSTRUMENT .......................................................... 32
APPENDIX C – PARTICIPATION IN OUTDOOR ACTIVITIES: OTHER, PLEASE
SPECIFY RESPONSES .................................................................... 38
APPENDIX D – INTEREST IN OUTDOOR RECREATIONAL ACTIVITIES:
OPEN-ENDED RESPONSES .......................................................... 43
APPENDIX E – COMMUNITY FACILITY INVESTMENT PREFERENCES IN
NEXT FIVE YEARS, BY SURVEY YEAR .......................................... 48
APPENDIX F – USING TECHNOLOGY TO AID IN OUTDOOR RECREATION:
RE-CODED OPEN-ENDED RESPONSES....................................... 52

Center for Survey Research ii Penn State Harrisburg
LIST OF FIGURES
Figure 1. Gender......................................................................................................................... 5
Figure 2. Age................................................................................................................................ 5 Figure 3. Race / Ethnicity .......................................................................................................... 6
Figure 4. Region .......................................................................................................................... 6
Figure 5. Participation in Outdoor Activities in the Last Year ...................................... 7 Figure 6. Participation in Outdoor Activities in the Last Year:
Other, Please Specify............................................................................................ 8
Figure 7. Participation in Outdoor Activities in the Last Year, by Gender ................ 9 Figure 8. Participation in Outdoor Activities in the Last Year, by Age .................... 10
Figure 9. Participation in Outdoor Activities in the Last Year,
by County Population Density........................................................................ 11 Figure 10. Outdoor Recreational Activity Interest ........................................................ 11
Figure 11. Community Facility Investment Preferences in Next Five Years,
by Survey Year .................................................................................................... 13 Figure 12. Community Facility Investment Preferences in Next Five Years,
Means by Survey Year ....................................................................................... 14
Figure 13. Community Facility Investment Preferences in Next Five Years, by Gender ............................................................................................................ 15
Figure 14. Community Facility Investment Preferences in Next Five Years, by Region .............................................................................................................. 16
Figure 15. Outdoor Recreation and Conservation Funding Priorities ..................... 17
Figure 16. Seeking Information on Outdoor Recreation in PA .................................. 18 Figure 17. Using Technology to Aid in Outdoor Recreation...................................... 19
Figure 18. Using Technology to Aid in Outdoor Recreation:
Other, Please Specify......................................................................................... 20 Figure 19. Using Technology to Aid in Outdoor Recreation, by Gender ............... 20
Figure 20. Using Technology to Aid in Outdoor Recreation, by Age ...................... 21
Figure 21. Attitudes Toward Outdoor Recreation........................................................ 22 Figure 22. Attitudes Toward Outdoor Recreation, by Age ........................................ 23
Figure 23. Help Participating in Outdoor Recreation in PA:
Open-Ended Responses ................................................................................... 30

Center for Survey Research 1 Penn State Harrisburg
EXECUTIVE SUMMARY
The 2020-2024 PA Statewide Comprehensive Outdoor Recreation Plan: Public Survey was
conducted by the Center for Survey Research (CSR) at Penn State Harrisburg at the request of the
Pennsylvania Department of Conservation and Natural Resources (DCNR). The survey was
designed to evaluate the opinions and experiences of Pennsylvanians who engage in outdoor
recreation throughout the Commonwealth. A total of 8,676 respondents from across Pennsylvania
completed the web survey between May 15 and July 1, 2019; 54.1% were male, 64.6% were between
the ages of 35 and 64, and 93.2% were non-Hispanic and white.
Looking at participation in outdoor activities, respondents most-often indicated that they
participated in hiking (72.0%) and walking or running (71.4%), while more than half said that they
visited historic sites or nature centers (60.5%), did scenic driving (59.3%), camped (50.9%), or
watched birds or wildlife (50.8%). More women than men indicated that they participated in walking
or running, wildlife watching or bird watching, swimming, picnicking, visiting historic sites or nature
centers, night sky viewing, and playing at or visiting playgrounds. Conversely, more men than
women indicated that they participated in hunting, fishing, and motorized trail use.
Respondents were also asked to provide one outdoor recreational activity that they currently do not
do but would like to try. The most common responses were kayaking or canoeing, rock climbing,
motorized trail use, stand-up paddleboarding, bicycling, cross country skiing or snowshoeing,
fishing, camping, ziplining, backpacking, hunting, and hiking. The single activity mentioned more
frequently than any other activity was kayaking.
Community or regional trail systems were identified as the highest priority for facility investment
over the next five years, which aligns with the results from the 2014 survey. Community or regional
parks replaced opportunities for/access to water-based recreation as the second-highest priority,
although water-based recreation and outdoor environmental educational/nature facilities were close
behind. Overall, results were similar to the 2014 survey, but respondents indicated a higher level of
priority for most items in the 2019 survey. There were exceptions for action sports parks and
opportunities for hunting and/or fishing, both of which saw decreases in overall investment priority
between 2014 and 2019.
Respondents were divided over what they considered to be their highest funding priorities for
outdoor recreation and conservation efforts in Pennsylvania. Roughly even numbers of respondents
chose acquire and protect open space, maintain existing park and recreation areas, and protect
wildlife and fish habitat as their top priorities. These three were followed by build more greenways
and trails, build walking paths and bicycle lanes, and restore damaged rivers and streams, each of
which saw similar numbers of responses.

Center for Survey Research 2 Penn State Harrisburg
Respondents overwhelmingly turned to search engines or specific web sites on the internet to seek
information on outdoor recreation in Pennsylvania, while some respondents primarily turned to
social media, friends or relatives, maps or brochures, and smart phone apps. Looking at how
respondents use technology to aid in their outdoor recreation, 80.5% said that they use the Internet
to find places to go or read reviews, 44.2% use GPS and 41.4% post their experiences to social
media sites. Additionally, 29.4% use a fitness tracker, such as a Fitbit. More men indicated that they
use GPS to navigate through their outdoor experience, while more women indicated that they use a
fitness tracker or social media. More respondents between the ages of 18 to 34 than those 65 or
older said that they use a fitness tracker, use GPS to navigate through their outdoor experience, use
technology-based games or apps that use the outdoors as their setting such as geocaching or
Pokémon Go, and post their outdoor recreation experiences to social media sites like Facebook,
Instagram, YouTube, or Twitter.
Nearly nine out of 10 respondents were concerned that youth are not spending enough time
outdoors (88.7%) and said that outdoor recreation is an essential part of their lives (88.4%), while
80.7% said that they like to participate more in outdoor activities, and 78.1% said that they
participate in such activities to improve their health. One-half (53.9%) were also worried about how
a changing climate is going to impact their future outdoor experiences.
When given the opportunity to share the single most-important thing that parks and outdoor
recreation agencies or organizations could do to help them participate in outdoor recreation in
Pennsylvania, respondents shared a wide range of suggestions and concerns. Common topics
included maintenance, general trail use, motorized trail use, technology, conservation, activities and
programming, education, support of sportsmen and nature enthusiasts, access and affordability,
communication, accessibility and ADA compliance, and safety.

Center for Survey Research 3 Penn State Harrisburg
INTRODUCTION
The 2020-2024 PA Statewide Comprehensive Outdoor Recreation Plan: Public Survey was
conducted by the Center for Survey Research (CSR) at Penn State Harrisburg at the request of the
Pennsylvania Department of Conservation and Natural Resources (DCNR). The survey was
designed to evaluate the opinions and experiences of Pennsylvanians who engage in outdoor
recreation throughout the Commonwealth.
At the conclusion of the data collection period, a total of 8,676 respondents had completed the web
survey. All data were collected between May 15 and July 1, 2019.
Data Analysis Notes
The following notes should be taken into account when reviewing the final dataset:
1. Because the survey was open-access and is not a random sample, the final dataset is
considered to be representative only of the respondents who chose to participate.
2. While some results are included from the 2014 iteration of the survey for comparison
purposes, all data are from the 2019 administration of the survey unless otherwise indicated.
3. Percentages may not total to 100% due to the exclusion of ‘Don’t know’ responses.
4. See Appendix A of the report for a map and list of the regions.
5. See Appendix B for the survey instrument used in data collection.
METHODOLOGY
Institutional Review Board
The study protocol and survey instrument were submitted to Penn State University’s Office for
Research Protections and were subsequently approved as non-research under study number
00011522 by Penn State University’s Office for Research Protections.
Instrument Development
During April and May 2019, the CSR project team worked with DCNR to develop and refine a
survey instrument for collecting data from Pennsylvanians who engage in outdoor recreation.
Portions of the survey instrument were adapted from a previous survey that was administered in
2014.
The instrument was then programmed using Qualtrics web survey software. Qualtrics’ online survey
platform allows for complex question patterns and automatic skipping when appropriate to create a
seamless flow from one question to the next for respondents.

Center for Survey Research 4 Penn State Harrisburg
Data Collection
Surveys were self-administered through Qualtrics Online Survey Platform. Survey responses were
collected through CSR’s Qualtrics web survey account between May 15 and July 1, 2019.
Distribution of the survey link was the responsibility of DCNR. DCNR partnered with various
organizations to share the survey link through various distribution lists. Due to the open access
nature of this survey, the sample is not considered to be randomly selected; consequently, results are
considered to be representative only of those who chose to participate.
Survey Response
Due to the open access nature of the survey, the total number of invited respondents is unknown.
Therefore, it is not possible to calculate a response rate for this survey.
Data Preparation and Analysis Notes
All completed survey data were extracted from Qualtrics into Statistical Package for the Social
Sciences (SPSS) software. Data were verified for accuracy of variable coding, and verbatim text was
edited and re-coded into additional categories for analysis purposes before final review by the senior
staff of the Center for Survey Research. A survey dataset was created in SPSS for Windows version
25.0.
Study Limitations
Because the survey was open access, the total number of invited respondents is unknown. In
addition, this non-random sampling method prevents the use of traditional statistical methods,
meaning that a margin of error cannot be calculated for the survey. The results are only
representative of those who chose to participate. Finally, CSR did not receive a completed survey
from every possible respondent. Because the answers from these non-respondents could be
different from those who did participate, non-response bias exists.
Center for Survey Research 5 Penn State Harrisburg
RESULTS
Respondent Profile
In total, 8,676 respondents provided data to at least some questions in the survey. A few questions
were asked to develop a profile of the respondents completing the survey. The following section
describes the respondent profile by gender, age, race/ethnicity, and Pennsylvania region.
Just over half of respondents were male (54.1%; n = 8,676), while 44.8% were female, 0.5%
identified as something else, and 0.5% did not respond, as seen in the following figure.
Figure 1. Gender
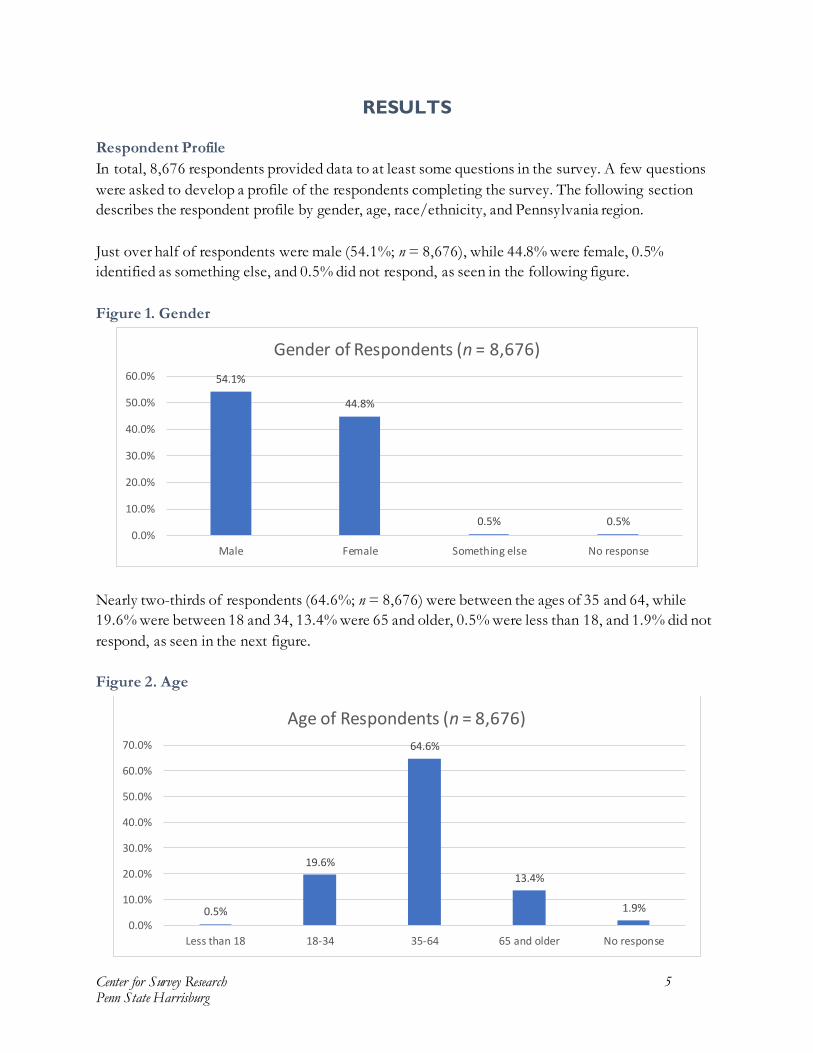
Nearly two-thirds of respondents (64.6%; n = 8,676) were between the ages of 35 and 64, while
19.6% were between 18 and 34, 13.4% were 65 and older, 0.5% were less than 18, and 1.9% did not
respond, as seen in the next figure.
Figure 2. Age
54.1%
44.8%
0.5% 0.5%0.0%
10.0%
20.0%
30.0%
40.0%
50.0%
60.0%
Male Female Something else No response
Gender of Respondents (n = 8,676)
0.5%
19.6%
64.6%
13.4%
1.9%
0.0%
10.0%
20.0%
30.0%
40.0%
50.0%
60.0%
70.0%
Less than 18 18-34 35-64 65 and older No response
Age of Respondents (n = 8,676)

Center for Survey Research 6 Penn State Harrisburg
The vast majority of respondents (93.2%: n = 8,676) were white non-Hispanics, while 0.9% were
Hispanic, 0.5% were black or African American, 2.2% were some other non-Hispanic race, and
3.2% did not respond, as seen in the next figure.
Figure 3. Race / Ethnicity
Respondents were distributed throughout Pennsylvania, with 19.8% coming from the Central region
(n = 8,676), 19.2% from the Southwest, 18.8% from the South Central, 16.0% from the Southeast,
13.4% from the Northeast, and 12.4% from the Northern regions, while 0.4% did not provide their
county, as seen in the next figure. See Appendix A for a map and list of survey regions.
Figure 4. Region
0.9%
93.2%
0.5% 2.2% 3.2%
0.0%
10.0%
20.0%
30.0%
40.0%
50.0%
60.0%
70.0%
80.0%
90.0%
100.0%
Hispanic White, non-Hispanic
Black or AfricanAmerican, non-
Hispanic
Something else,non-Hispanic
No response
Race / Ethnicity of Respondents (8,676)
19.8%
13.4%12.4%
18.8%
16.0%
19.2%
0.4%
0.0%
5.0%
10.0%
15.0%
20.0%
25.0%
Central Northeast Northern South Central Southeast Southwest No response
Region of Respondents (n = 8,676)

Center for Survey Research 7 Penn State Harrisburg
Participation in Outdoor Activities
Respondents were asked to indicate all of the outdoor activities that they participated in during the
last year. Respondents most-often indicated that they participated in hiking (72.0%; n = 8,632) and
walking or running (71.4%), while more than half said that they visited historic sites or nature
centers (60.5%), did scenic driving (59.3%), camped (50.9%), or watched birds or wildlife (50.8%).
Just 0.2% did not participate in any outdoor activities in the last year, as seen in the next figure.
Figure 5. Participation in Outdoor Activities in the Last Year
72.0%
71.4%
60.5%
59.3%
50.9%
50.8%
46.4%
45.8%
44.8%
41.3%
39.3%
39.2%
32.9%
32.1%
28.2%
23.5%
16.7%
13.6%
10.3%
0.2%
0.0% 10.0% 20.0% 30.0% 40.0% 50.0% 60.0% 70.0% 80.0%
Hiking
Walking / running
Visiting historic sites or nature centers
Scenic driving
Camping
Wildlife watching / bird watching
Kayaking / canoeing
Picnicking
Bicycling
Fishing
Night sky viewing
Swimming
Hunting
Lawn games (e.g., cornhole, bocce, horseshoes)
Playing at / visiting playgrounds
Motorized trail use (ATV / dirt bike riding, snowmobiling)
Motorized boating
Team or organized sports (e.g. basketball, soccer,baseball, tennis)
Other, please specify:
None of these / I did not participate in any outdooractivities in the last year
Which of the following outdoor activities did you participate in during the last year? Please select all that apply. (n = 8,632)

Center for Survey Research 8 Penn State Harrisburg
In addition, one-in-10 respondents provided some activity other than those listed. The most
common Other responses (mentioned by more than 0.5% of respondents) included horseback
riding, disc golf, skiing, and climbing. The following word cloud provides a visual summary of
common responses. The larger the word, the more common that it appeared in responses. See
Appendix C for a complete list of Other responses provided.
Figure 6. Participation in Outdoor Activities in the Last Year: Other, Please Specify
There were several differences in responses by gender. More women (n = 3,891) than men (n =
4,694) indicated that they participated in walking or running (83.4% versus 61.4%, respectively) ,
wildlife watching or bird watching (56.6% versus 45.8%), swimming (46.3% versus 33.2%),
picnicking (56.1% versus 37.2%), visiting historic sites or nature centers (69.0% versus 53.3%), night
sky viewing (45.5% versus 33.9%), and playing at or visiting playgrounds (35.9% versus 21.8%).
Conversely, more men than women indicated that they participated in hunting (47.9% versus
14.9%), fishing (51.3% versus 29.4%), and motorized trail use (32.8% versus 12.4%), as seen in the
next figure.

Center for Survey Research 9 Penn State Harrisburg
Figure 7. Participation in Outdoor Activities in the Last Year, by Gender
Differences in outdoor activity participation in the last year were also seen by age. More individuals
between the ages of 18 and 34 (n = 1,697) than those 65 and older (1,165) indicated that they
participated in hiking (80.5% versus 60.5%, respectively), motorized trail use (26.8% versus 11.9%),
swimming (47.4% versus 24.3%), kayaking or canoeing (54.4% versus 32.1%), camping (62.8%
versus 28.9%), lawn games (46.0% versus 15.8%), team or organized sports (19.4% versus 5.1%),
and playing at or visiting playgrounds (34.5% versus 16.5%). More of those 65 or older participated
in wildlife watching or bird watching than those 18 to 34 (62.1% versus 46.0%), as seen in the next
figure.
61.4%
47.9%
51.3%
45.8%
32.8%
33.2%
37.2%
53.3%
33.9%
21.8%
83.4%
14.9%
29.4%
56.6%
12.4%
46.3%
56.1%
69.0%
45.5%
35.9%
0.0% 10.0% 20.0% 30.0% 40.0% 50.0% 60.0% 70.0% 80.0% 90.0%
Walking / running
Hunting
Fishing
Wildlife watching / bird watching
Motorized trail use (ATV / dirt bike riding,snowmobiling)
Swimming
Picnicking
Visiting historic sites or nature centers
Night sky viewing
Playing at / visiting playgrounds
Which of the following outdoor activities did you participate in during the last year? Please select all that apply. By
Gender.
Male (n = 4,694) Female (n = 3,891)

Center for Survey Research 10 Penn State Harrisburg
Figure 8. Participation in Outdoor Activities in the Last Year, by Age
Finally, more respondents who lived in rural counties (n = 4,020) than urban counties (n = 4,622)
indicated that they participated in hunting (42.9% versus 24.3%, respectively), fishing (47.0% versus
36.4%), and motorized trail use (30.9% versus 17.0%), as seen in the next figure.
80.5%
46.0%
26.8%
47.4%
54.4%
62.8%
46.0%
19.4%
34.5%
71.9%
50.1%
25.0%
39.9%
47.0%
52.2%
31.6%
13.6%
28.8%
60.5%
62.1%
11.9%
24.3%
32.1%
28.9%
15.8%
5.1%
16.5%
0.0% 10.0% 20.0% 30.0% 40.0% 50.0% 60.0% 70.0% 80.0% 90.0%
Hiking
Wildlife watching / bird watching
Motorized trail use (ATV / dirt bike riding, snowmobiling)
Swimming
Kayaking / canoeing
Camping
Lawn games (e.g., cornhole, bocce, horseshoes)
Team or organized sports (e.g. basketball, soccer,baseball, tennis)
Playing at / visiting playgrounds
Which of the following outdoor activities did you participate in during the last year? Please select all that apply. By Age.
18-34 (n = 1,697) 35-64 (n = 5,609) 65 and older (n = 1,165)

Center for Survey Research 11 Penn State Harrisburg
Figure 9. Participation in Outdoor Activities in the Last Year, by County Population Density
Respondents were also asked to provide one outdoor recreational activity that they currently do not
do but would like to try. A total of 3,798 respondents provided a response, and 21.7% of those
respondents said that they would like to try kayaking. Looking at all respondents, the most
common responses were kayaking or canoeing (9.6% of all survey respondents; n = 8,676), rock
climbing (3.5%), motorized trail use (3.1%), stand-up paddleboarding (2.8%), bicycling (2.7%), cross
country skiing or snowshoeing (2.7%), fishing (2.3%), camping (1.9%), ziplining (1.3%), backpacking
(1.2%), hunting (1.2%), and hiking (1.2%). The following word cloud provides a visual summary of
common responses. The larger the word, the more common that it appeared in responses. See
Appendix D for a complete list of responses provided.
Figure 10. Outdoor Recreational Activity Interest
42.9%47.0%
30.9%
24.3%
36.4%
17.0%
0.0%
10.0%
20.0%
30.0%
40.0%
50.0%
Hunting Fishing Motorized trail use (ATV / dirtbike riding, snowmobiling)
Which of the following outdoor activities did you participate in during the last year? Please select all that
apply. By County Population Density.
Rural (n = 4,020) Urban (n = 4,622)

Center for Survey Research 12 Penn State Harrisburg
Facility Investment Priorities
Respondents were then asked to rate the level of priority their local community should place on
investing in various facilities or infrastructure in the next five years, with 1 being the lowest priorit y
and 5 being the highest priority. Choices of 4 and 5 were then combined to provide an indication of
the proportion of respondents indicating that they believe their local community should place a high
priority on the particular type of facility investment over the next five years. Nearly four-fifths of
respondents (79.3%; n = 8,069 – 8,345) gave a high priority to Community or regional trail systems,
compared to 72.7% who said so in 2014 (n = 6,536 – 6,652). About three-fifths gave high priorities
to Community or regional parks (62.8% in 2019 versus 59.3% in 2014), Outdoor environmental
educational/nature facilities (62.4% versus 45.7%), and Opportunities for/access to water-based
recreation (60.7% versus 60.9%), while about half gave high priorities to Inclusive
programs/facilities for persons with disabilities (55.3%), Neighborhood parks (54.9% versus 51.1%),
and Opportunities for hunting and/or fishing (46.8% versus 59.1%). It should be noted that the
Sports fields and Sports courts items were asked as one item, Team sports facilities, in 2014, so the
results are not directly comparable. In addition, the Inclusive programs/facilities for persons with
disabilities and the Pavilions, amphitheaters, or other outdoor public spaces like plazas items were
not asked in 2014.
Scores were also averaged on a scale of 1 to 5 to develop an overall mean assessment of the extent
to which respondents believed that their local community should place on investing in the various
facility types over the next five years. As with before, there were items that appeared in the 2019
survey that did not appear in the 2014 survey. The overall mean score for all items was 3.17 (n =
8,069 – 8,345); for comparison purposes, the mean score for items that appeared in both the 2014
and 2019 surveys was 3.25 for the 2019 responses and 3.17 (n = 6,536 – 6,652) for 2014 responses.
Priority orders were similar to the previous discussion, but this provided a better indication of how
priorities of certain items changed from 2014 to 2019. The mean scores for all items was slightly
higher in 2019, but there were some outlying items. Items that outperformed the increase in mean
score from 2014 to 2019 included Outdoor environmental educational/nature facilities (3.76 out of
5 in 2019 versus 3.32 in 2014), Swimming pools/water play parks (2.96 versus 2.70), Community or
regional trail systems (4.23 versus 4.00), and Trails/parks for motorized activities (2.72 versus 2.53).
Items that were lower in 2019 as compared to 2014 included Opportunities for hunting and/or
fishing (3.29 in 2019 versus 3.66 in 2014), Action sports parks (2.37 versus 2.58), and Mountain bike
trails (3.05 versus 3.06).
The next figures show all combined 4 and 5 responses and the mean scores out of five to this
question by survey year. See Appendix E for a complete set of responses by individual item rating.

Center for Survey Research 13 Penn State Harrisburg
Figure 11. Community Facility Investment Preferences in Next Five Years, by Survey Year
79.3%
62.8%
62.4%
60.7%
55.3%
54.9%
46.8%
43.2%
38.8%
36.8%
34.5%
34.1%
32.9%
24.6%
23.1%
21.7%
19.2%
72.7%
59.3%
45.7%
60.9%
51.1%
59.1%
40.7%
33.7%
38.3%
26.1%
28.8%
21.7%
25.9%
0.0% 10.0% 20.0% 30.0% 40.0% 50.0% 60.0% 70.0% 80.0% 90.0%
Community or regional trail systems
Community or regional parks
Outdoor environmental educational/nature facilities
Opportunities for/access to water-based recreation (e.g.,boating, kayaking)
Inclusive programs/facilities for persons with disabilities (ADAAccess)
Neighborhood parks
Opportunities for hunting and/or fishing
Playgrounds
Community gardens
Mountain bike trails
Swimming pools/water play parks
Pavilions, amphitheaters, or other outdoor public space likeplazas
Trails/parks for motorized activities
Off-leash dog parks
Sports fields (e.g., soccer, baseball, lacrosse)
Sports courts (e.g., basketball, tennis, pickleball)
Action sports parks (e.g., skate parks, pump tracks)
Please rate the level of priority your local community should place on investing in each of the following facilities/infrastructure over the next
five years, 1 = Lowest priority and 5 = Highest priority: Percent Selecting 4 and 5 Combined, by Survey Year
2019 (n = 8,069 - 8,345) 2014 (n = 6,536 - 6,652)

Center for Survey Research 14 Penn State Harrisburg
Figure 12. Community Facility Investment Preferences in Next Five Years, Means by Survey Year
4.23
3.76
3.76
3.72
3.59
3.55
3.29
3.22
3.05
3.04
2.98
2.96
2.72
2.58
2.54
2.53
2.37
4.00
3.64
3.32
3.69
3.45
3.66
3.19
3.06
2.90
2.70
2.53
2.42
2.58
0.00 0.50 1.00 1.50 2.00 2.50 3.00 3.50 4.00 4.50
Community or regional trail systems
Community or regional parks
Outdoor environmental educational/nature facilities
Opportunities for/access to water-based recreation (e.g.,boating, kayaking)
Inclusive programs/facilities for persons with disabilities (ADAAccess)
Neighborhood parks
Opportunities for hunting and/or fishing
Playgrounds
Mountain bike trails
Community gardens
Pavilions, amphitheaters, or other outdoor public space likeplazas
Swimming pools/water play parks
Trails/parks for motorized activities
Sports fields (e.g., soccer, baseball, lacrosse)
Sports courts (e.g., basketball, tennis, pickleball)
Off-leash dog parks
Action sports parks (e.g., skate parks, pump tracks)
Please rate the level of priority your local community should place on investing in each of the following facilities/infrastructure over the next five years, 1 = Lowest priority and 5 = Highest priority: Mean Score out
of 5, by Survey Year
2019 (n = 8,069 - 8,345) 2014 (n = 6,536 - 6,652)

Center for Survey Research 15 Penn State Harrisburg
There were several notable differences in respondents’ indications of how their local communities
should prioritize investing in facilities by gender. The responses with the biggest gender gaps
are bolded below. More women (n = 3,627 – 3,767) than men (n = 4,399 – 4534) gave scores of 4
or 5 to Playgrounds (51.6% for women versus 36.3% for men), Neighborhood parks (66.1% for
women versus 45.4% for men), Community or regional parks (73.9% versus 53.4%), Community
or regional trail systems (85.3% versus 74.3%), Outdoor environmental educational/nature facilities
(71.6% versus 54.7%), Community gardens (53.8% for women versus 26.1% for men),
Swimming pools/water play parks (44.7% versus 26.3%), and Inclusive programs/facilities for
persons with disabilities (64.4% versus 47.6%). In comparison, more men gave scores of 4 or 5 to
Opportunities for hunting and/or fishing (56.4% for men versus 35.4% for women) and
Trails/parks for motorized activities (40.3% versus 23.9%), as seen in the next figure.
Figure 13. Community Facility Investment Preferences in Next Five Years, by Gender
36.3%
45.4%
53.4%
74.3%
54.7%
26.1%
26.3%
56.4%
40.3%
47.6%
51.6%
66.1%
73.9%
85.3%
71.6%
53.8%
44.7%
35.4%
23.9%
64.4%
0.0% 10.0% 20.0% 30.0% 40.0% 50.0% 60.0% 70.0% 80.0% 90.0%
Playgrounds
Neighborhood parks
Community or regional parks
Community or regional trail systems
Outdoor environmental educational/nature facilities
Community gardens
Swimming pools/water play parks
Opportunities for hunting and/or fishing
Trails/parks for motorized activities
Inclusive programs/facilities for persons with disabilities (ADAAccess)
Please rate the level of priority your local community should place on investing in each of the following facilities/infrastructure over the next
five years, 1 = Lowest priority and 5 = Highest priority: Percent Selecting 4 and 5 Combined, by Gender
Male (n = 4,399 - 4,534) Female (n = 3,627 - 3,767)

Center for Survey Research 16 Penn State Harrisburg
There were also differences in respondents’ indications of how their local communities should
prioritize investing in facilities by region. More respondents in the Northern region (n = 1,021 –
1,034) and Central region (n = 1,619 – 1,637) gave scores of 4 or 5 to Trails/parks for motorized
activities (46.1% and 42.1%, respectively) than those in Northeast (32.3%; n = 1,105 – 1,111),
Southwest (30.1%; n = 1,579 – 1,597), South Central (28.9%; n = 1,559 – 1,575), and Southeast
(19.1%; n = 1,305 – 1,339) regions. In contrast, more of those in the Southwest and Southeast
regions favored Community and regional parks (68.9% and 74.0% provided scores of 4 or 5,
respectively) and Neighborhood parks (63.1% and 66.5%, respectively) than those in the Northern
(55.8% for Community or regional parks and 45.9% for Neighborhood parks) and Central regions
(53.5% and 47.0%, respectively). Furthermore, fewer respondents in the Southeast region gave a
score of 4 or 5 to Opportunities for hunting and/or fishing (33.5%) than those in other regions,
which ranged from 46.4% in the Northeast region to 54.7% in the Northern region, as seen in the
next figure.
Figure 14. Community Facility Investment Preferences in Next Five Years, by Region
47.0%
53.5%
53.6%
42.1%
51.7%
59.8%
46.4%
32.3%
45.9%
55.8%
54.7%
46.1%
52.5%
62.9%
46.5%
28.9%
66.5%
74.0%
33.5%
19.1%
63.1%
68.9%
46.7%
30.1%
0.0% 10.0% 20.0% 30.0% 40.0% 50.0% 60.0% 70.0% 80.0%
Neighborhood parks
Community or regional parks
Opportunities for hunting and/or fishing
Trails/parks for motorized activities
Please rate the level of priority your local community should place on investing in each of the following facilities/infrastructure over the next
five years, 1 = Lowest priority and 5 = Highest priority: Percent Selecting 4 and 5 Combined, by Region
Southwest (n = 1,579 - 1,597) Southeast (n = 1,305 - 1,339) South Central (n = 1,559 - 1,575)
Northern (n = 1,021 - 1,034) Northeast (n = 1,105 - 1,111) Central (n = 1,619 - 1,637)

Center for Survey Research 17 Penn State Harrisburg
Outdoor Recreation and Conservation Funding Priorities
Next, respondents were asked to indicate their highest priority for funding outdoor recreation and
conservation efforts in Pennsylvania. About one-fifth (19.1%; n = 8,440) selected Acquire and
protect open space (as undeveloped, conserved land), while close behind were Maintain existing
park and recreation areas (17.9%) and Protect wildlife and fish habitat (16.5%). About one-in-10
selected Build more greenways and trails (11.5%), Build walking paths and bicycle lanes and trails
between places of work, parks, schools, and shopping areas (11.4%), and Restore damaged rivers
and streams (10.9%). Rounding out the responses were 6.7% who selected Acquire additional land
and water areas for developed recreation, 3.7% who selected Provide environmental and
conservation programs, and 2.5% who said Provide recreation programs and parks and recreation
areas, as seen in the next figure. The only difference seen by demographic sub-group was that more
urban residents selected Acquire and protect open space (23.9%; n = 4,539) than rural residents
(13.4%; n = 3,912).
Figure 15. Outdoor Recreation and Conservation Funding Priorities
19.1%
17.9%
16.5%
11.5%
11.4%
10.9%
6.7%
3.7%
2.5%
0.0% 5.0% 10.0% 15.0% 20.0% 25.0%
Acquire and protect open space (as undeveloped,conserved land)
Maintain existing park and recreation areas
Protect wildlife and fish habitat
Build more greenways and trails
Build walking paths and bicycle lanes and trails betweenplaces of work, parks, schools, and shopping areas
Restore damaged rivers and streams
Acquire additional land and water areas for developedrecreation
Provide environmental and conservation programs
Provide recreation programs at parks and recreationareas
From the following list, which one do you consider the HIGHEST PRIORITY for funding outdoor recreation and conservation
efforts in Pennsylvania? (n = 8,440)

Center for Survey Research 18 Penn State Harrisburg
Information Seeking
When asked what respondents use most when seeking information on outdoor recreation in
Pennsylvania, respondents overwhelmingly selected the Internet, which included search engines and
specific web sites (63.9%; n = 8,579). Other responses included social media (12.2%),
Friends/relatives/word of mouth (7.0%), Maps/brochures (5.4%), Mobile/smart phone apps
(5.3%), Visitor or welcome centers (1.9%), Newspaper/magazine articles (1.4%), Travel guides/tour
books (1.0%), Emails/text messages (0.8%), Community newsletters (0.4%), and Television/radio
(0.3%). Just 0.3% of respondents said that they do not seek information on outdoor recreation, as
seen in the next figure. More respondents between the ages of 18-34 indicated that they turn to
Social media most often (15.6%; n = 1,691) than those 65 and older (6.1%; n = 1,153), but there
were no other notable demographic differences.
Figure 16. Seeking Information on Outdoor Recreation in PA
63.9%
12.2%
7.0%
5.4%
5.3%
1.9%
1.4%
1.0%
0.8%
0.4%
0.3%
0.3%
0.0% 10.0% 20.0% 30.0% 40.0% 50.0% 60.0% 70.0%
Internet (e.g., search engines/Google or specific websites)
Social media (e.g., Facebook/Twitter/Instagram/YouTube)
Friends/relatives/word of mouth
Maps/brochures
Mobile/smart phone apps
Visitor or welcome centers
Newspaper/magazine articles
Travel guides/tour books
Emails/text messages
Community newsletters
None / I do not seek information on outdoor recreation
Television/radio
When seeking information on outdoor recreation in Pennsylvania, which do you use the MOST? (n = 8,579)

Center for Survey Research 19 Penn State Harrisburg
Technology Utilization
Next, respondents were asked to indicate all sources of technology they use to aid in their outdoor
recreation. Just 4.8% (n = 8,632) indicated that they do not use technology to aid in outdoor
recreation, while an overwhelming 80.5% said that they use the Internet to find places to go or to
read reviews. About two-in-five said that they Use GPS to navigate through their outdoor
experience (44.2%) or to Post outdoor recreation experiences to social media sites (41.4%). In
addition, 29.4% said that they Use a fitness tracker (like a Fitbit). About one-in-12 said that they Use
technology-based games or apps that use the outdoors as their setting (such as geocaching or
Pokémon Go; 8.4%) and Use apps that help them find people to join an outing (such as Meet Up;
8.2%), as seen in the next figure.
Figure 17. Using Technology to Aid in Outdoor Recreation
In addition, 3.4% of respondents mentioned some technology other than those listed. The most
common Other responses (mentioned by more than 0.1% of respondents) included an App or site
designed to enhance a specific experience (such as plant/animal identification, hunting/fishing, etc.),
a Trail app or site, a Fitness app or site (such as Strava), a Camera for recording or photos (such as a
trail cam or GoPro), an App developed for their local area, or a Weather app. The following word
80.5%
44.2%
41.4%
29.4%
8.4%
8.2%
4.8%
3.4%
0.0% 10.0% 20.0% 30.0% 40.0% 50.0% 60.0% 70.0% 80.0% 90.0%
I use the Internet to find places to go or read reviews
I use GPS to navigate through my outdoor experience
I post my outdoor recreation experiences to social mediasites like Facebook, Instagram, YouTube, or Twitter
I use a fitness tracker (like a Fitbit)
I use technology-based games or apps that use theoutdoors as their setting (e.g., geocaching, Pokémon Go)
I use apps that help me find people to join an outing (e.g.,Meet Up)
None / I do not use technology to aid in outdoorrecreation
Other, please specify:
How do you use technology to aid in your outdoor recreation? Please select all that apply. (n = 8,632)

Center for Survey Research 20 Penn State Harrisburg
cloud provides a visual summary of common responses. The larger the word, the more common
that it appeared in responses. See Appendix F for a complete list of Other responses provided.
Figure 18. Using Technology to Aid in Outdoor Recreation: Other, Please Specify
Technology use varied by gender and age. More men (n = 4,694) than women (n = 3,891) said that
they Use GPS to navigate through their outdoor experience (49.4% versus 37.8%, respectively). In
contrast, more women than men said that they Use a fitness tracker (37.3% versus 23.1%,
respectively) and Post their outdoor recreation experiences to social media sites like Facebook,
Instagram, YouTube, or Twitter (48.2% versus 35.8%) as seen in the next figure.
Figure 19. Using Technology to Aid in Outdoor Recreation, by Gender
23.1%
49.4%
35.8%37.3% 37.8%
48.2%
0.0%
10.0%
20.0%
30.0%
40.0%
50.0%
60.0%
I use a fitness tracker (like a Fitbit) I use GPS to navigate through myoutdoor experience
I post my outdoor recreationexperiences to social media sites like
Facebook, Instagram, YouTube, orTwitter
How do you use technology to aid in your outdoor recreation? Please select all that apply. By Gender.
Male (n = 4,694) Female (n = 3,891)

Center for Survey Research 21 Penn State Harrisburg
Unsurprisingly, more respondents between the ages of 18 to 34 (n = 1,697) than those 65 or older (n
= 1,165) said that they Use a fitness tracker (35.2% versus 20.0%, respectively), Use GPS to navigate
through their outdoor experience (53.4% versus 32.6%), Use technology-based games or apps that
use the outdoors as their setting, such as geocaching or Pokémon Go (12.0% versus 3.8%), and Post
their outdoor recreation experiences to social media sites like Facebook, Instagram, YouTube, or
Twitter (53.7% versus 20.9%), as seen in the next figure.
Figure 20. Using Technology to Aid in Outdoor Recreation, by Age
Attitudes Toward Outdoor Recreation
Respondents were then asked to indicate their level of agreement with a series of statements about
outdoor recreation on a scale from 1 through 5, where 1 represented Strongly Disagree and 5
represented Strongly Agree. Scores of 4 and 5 were coded to indicate strong agreement with each
statement. Nearly nine out of 10 respondents (n = 8,419 – 8,560) selected 4 or 5 for “I am
concerned that our youth are not spending enough time outdoors” (88.7%) and “Outdoor
recreation is an essential part of my life” (88.4%). About four out of five gave strong ratings to “I
would like to participate more in outdoor activities” (80.7%) and “I participate in outdoor recreation
to improve my health” (78.1%). In contrast, just half (53.9%) indicated strong agreement with “I
worry about how a changing climate is going to impact my future outdoor experiences” and less
than one-third (30.0%) did so with “Having access to organized guided outdoor recreation programs
35.2%
53.4%
12.0%
53.7%
29.7%
44.0%
8.3%
42.4%
20.0%
32.6%
3.8%
20.9%
0.0% 10.0% 20.0% 30.0% 40.0% 50.0% 60.0%
I use a fitness tracker (like a Fitbit)
I use GPS to navigate through my outdoorexperience
I use technology-based games or apps that use theoutdoors as their setting (e.g., geocaching,
Pokémon Go)
I post my outdoor recreation experiences to socialmedia sites like Facebook, Instagram, YouTube, or
How do you use technology to aid in your outdoor recreation? Please select all that apply. By Age.
18-34 (n = 1,697) 35-64 (n = 5,609) 65 and older (n = 1,165)

Center for Survey Research 22 Penn State Harrisburg
would increase my participation in outdoor recreation,” as seen in the next figure. The items were
also given mean scores out of 5, but these scores provided no additional information than what was
seen in the above analysis.
Figure 21. Attitudes Toward Outdoor Recreation
There were notable differences in attitudes toward outdoor recreation by gender, county density,
and age. More women (65.0%; n = 3,823) than men (44.6%; n = 4,614), more respondents in urban
counties (46.0%; n = 4,548) than rural counties (30.8%; n = 3,944), and more respondents between
the ages of 18 and 34 (64.6%; n = 1,683) than those 35 to 64 (50.4%; n = 5,515) selected 4 or 5 for
“I worry about how a changing climate is going to impact my future outdoor experiences .
Interestingly, more respondents 65 or older selected 4 or 5 for this statement (55.4%) than between
the ages of 36 and 64.
More respondents between the ages of 18 and 34 (87.7%; n = 1,687) than those 65 or older (69.3%;
n = 1,126) answered 4 or 5 for “I would like to participate more in outdoor activities,” while those
between the ages of 35 and 64 were somewhere in the middle (80.9%; n = 5,535), as seen in the next
figure.
30.0%
53.9%
78.1%
80.7%
88.4%
88.7%
0.0% 10.0% 20.0% 30.0% 40.0% 50.0% 60.0% 70.0% 80.0% 90.0%100.0%
Having access to organized guided outdoor recreationprograms would increase my participation in outdoor
recreation.
I worry about how a changing climate is going to impact myfuture outdoor experiences.
I participate in outdoor recreation to improve my health.
I would like to participate more in outdoor activities.
Outdoor recreation is an essential part of my life.
I am concerned that our youth are not spending enough timeoutdoors.
Please rate your level of agreement with each of the following statements on a scale from 1 to 5, where 1 is Strongly Disagree and 5
is Strongly Agree. Percent Selecting 4 and 5. (n = 8,419 - 8,560)

Center for Survey Research 23 Penn State Harrisburg
Figure 22. Attitudes Toward Outdoor Recreation, by Age
Help Participating in Outdoor Recreation in PA
Finally, respondents were given an open-ended question asking them to indicate the single most-
important thing that parks and outdoor recreation agencies/organizations could do to help them
participate in outdoor recreation in Pennsylvania. Altogether, 7,093 respondents answered the
question. A random sample of 1,000 respondents was selected to use in analyzing results and
identifying common topics. Common topics included maintenance needs, general and motorized
trail use, technology, conservation, activities and programming, education, support of sportsmen and
nature enthusiasts, access and affordability, communication, accessibility and ADA compliance, and
safety. These topics are discussed in detail below. Overall, the most-common topics mentioned by
respondents related to maintenance and trail needs. Topics are ordered with the most-common
topics appearing first, and the least-common topics appearing last.
Maintenance Needs
• Many of the respondents’ comments related to a desire to continue existing maintenance
activities or to improve maintenance on facilities, parks, trails, and waterways. Some
respondents indicated that these spaces were well-maintained, going as far as to say that
Pennsylvania’s parks are better managed than other states’ parks, while many others felt that
there was room for improvement.
• In addition to maintenance, cleanliness was discussed by some respondents, particularly
regarding outdoor trash/litter, wildlife habitat improvement, and the cleanliness and upkeep
of restroom facilities, especially in state parks. Respondents requested more trash and
64.6%
87.7%
50.4%
80.9%
55.4%
69.3%
0.0%
10.0%
20.0%
30.0%
40.0%
50.0%
60.0%
70.0%
80.0%
90.0%
100.0%
I worry about how a changing climate is going to impactmy future outdoor experiences.
I would like to participate more in outdoor activities.
Please rate your level of agreement with each of the following statements on a scale from 1 to 5, where 1 is Strongly Disagree
and 5 is Strongly Agree. Percent Selecting 4 and 5. By Age.
18-34 (n = 1,683 - 1,687) 35-64 (n = 5,515 - 5,535) 65 and older (n = 1,126 - 1,131)

Center for Survey Research 24 Penn State Harrisburg
recycling receptacles and better-stocked restrooms. Some respondents indicated that they
attempt to learn about how well-maintained facilities are before they decide to visit them.
• Respondents offered a number of possible solutions and ideas to the maintenance issues
they perceived. They included providing more funding and staffing for maintenance, finding
more cost-effective collective maintenance solutions, developing more partnerships to get
other groups and community members involved with maintenance, and creating more
organized clean-up days.
• Some respondents were adamant that providers should avoid creating new infrastructure
until current maintenance needs are met. A desire for more funding was a common request.
General Trail Use
• Trails were mentioned by a substantial proportion of respondents. Many respondents were
interested in developing more trails that connect different areas. Respondents saw
opportunity in using trails to connect communities, increase tourism, and promote economic
development. Specifically, some respondents felt that connecting trails with small towns
could increase local spending. Some also indicated that trails should have better integration
with living spaces (e.g., river walks, canal sites, etc.).
• Many respondents want trails that tailor to their particular sport or interest. The major
challenge here is finding a way to balance the variety of conflicting interests. Some
respondents want trails for hiking only, others for biking only, some for horseback riding,
and some for multi-use. Mountain bikers would like to have trails opened up to mountain
bike use, while some want trails for bicycles, but not mountain bikes. In addition, many
expressed an interest in finding ways to allow safe use by multiple contingencies. Despite
interest in having trails for their own uses, many users still want ways to use trails that are
less travelled, as overuse makes it difficult for people to relax and get away.
• There was a contrast between two conflicting priorities in terms of trail use. Some are vocal
about wanting new trails developed, while others are adamant that new trails should not be
developed until current trails can be properly maintained. Those who want new trails
mentioned trails for hiking that had more variety in trail difficulty. There was also significant
interest in expanding rails-to-trails initiatives, particularly for multi-use trails.
• In addition to the need for better trail maintenance and blazing, some respondents also
indicated a need for better marking and signage. Some respondents cited poor signage as a
reason why they might avoid trying a new trail. Others would like to have more information
about trails online, including trail difficulty, lengths, access points, and elevation profiles.
They would also like better maps with more detail.

Center for Survey Research 25 Penn State Harrisburg
Motorized Trail Use
• Many respondents discussed the need to expand access for motorized activities on trails.
Some mentioned that they travel out of state to use trails. Others mentioned that there are
opportunities for regional economic development and income generation. Many also
stressed that Pennsylvania’s investment is less than that of other states. As with general trail
use, there was great interest in having trails that connect various communities and regions.
• Many groups are in competition for trail access, and most want trails for their own use.
Licensed motorcycles would like to have access to ATV and snowmobile trails, and ATVs
would like to have access to joint-use roads.
• Fairness was another common theme. Some motorized users were concerned that they pay
money for licenses and have limited access, while others pay nothing and get more access.
They sought better distribution of public resources.
• There was a vocal contingent of respondents interested in expanding ATV trail access,
including dual sport bikes and trails dedicated to more than just ATVs to include side-by-
sides and UTVs.
• Many respondents indicated that the enthusiasts of their respective sports would be willing
to put in effort to bring these ideas to fruition. There was an emphasis that many are looking
for a legal way to enjoy their respective sports, and many mentioned that they would be
willing to pay an access fee.
• Lacking access to use of private land was another common theme, particularly among
snowmobilers. They indicated that other states provide more support, both financially and
through other means, such as through the support of statewide general liability policies,
which can encourage private landowners to allow trails to pass through their properties.
• Some were adamant that they did not want motorized vehicles on their trails; they felt
strongly that these activities should require permits and be restricted. Others went as far as
to say that motorized vehicles should be banned from public land.
Technology
• Many respondents were interested in using technology to improve their recreational
experiences. A common request was to find better ways to make fragmented information
available online through a single, coordinated resource that includes information about
facilities, parks, trails, etc. offered by various groups and levels of government. Some
respondents acknowledged that this would be a monumental task, particularly given the
work needed to coordinate and maintain the database. However, respondents indicated a
desire to be able to find information about available resources in one place. Some
respondents who did not grow up in Pennsylvania also indicated that it is difficult to know
what is available; they rely on web-based resources to learn about what they can do.
• Specific suggestions for improving existing resources included having a searchable directory
that is sortable by distance, making web sites more mobile-friendly, allowing users to leave

Center for Survey Research 26 Penn State Harrisburg
reviews, and improving address listings so that GPS apps provide better navigation to the
sites.
• Some respondents also expressed concerns about the lack of detail provided on existing web
sites. For example, recreationists would like to know more about hours of access, the
availability of rental equipment, any associated costs, parking availability, handicap
accessibility, level of difficulty for trails, etc. One respondent requested a maps app that
could help them check trail and waterway conditions for planning their trips. Respondents
indicated that having advanced information is particularly useful for people with children, as
it is difficult to take advantage of available resources without adequate information.
• Respondents also talked about the ways in which mapping could improve their experiences.
Some respondents wished that existing maps would be updated more frequently, noting that
they are sometimes incorrect. Others indicated that PDFs of maps are not usually user-
friendly. Other suggestions included working with local providers to improve maps or using
drones to produce aerial footage of trails for planning purposes.
• Social media was another common theme cited by respondents. Respondents wanted to see
a better social media presence, possibly in the form of regional Facebook groups. They were
also interested in encouraging more active social media use and sharing to help others learn
about recreational and educational opportunities through their networks.
Conservation
• Improving and maintaining conservation efforts was another theme shared by many
respondents. Most commonly, respondents expressed a need to maintain open space and
promote greenspace. Specific suggestions here included establishing partnerships to solidify
mutual public space interests and finding ways to strategically prevent private development.
Respondents also suggested acquiring more state forest land and state park land and
expanding wild areas, which would allow application of federal rules.
• Many responses also related to pollution and protection of existing managed space,
especially through protection of undeveloped areas, wildlife habitats, waterways, and air
quality. Many respondents expressed concerns about pollution done by individuals,
companies, and fracking; they would like to see stricter litter and pollution prevention laws
and better enforcement of existing laws. Some respondents also expressed concerns that
pollution is more common among more casual recreationists, and that better education is
needed to prevent pollution done by those sharing the space.
• Some respondents also talked about the need for better management of wildlife and deer
populations. Respondents mentioned that some areas were over-hunted, while other non-
deer populations were under-hunted.
• Finally, respondents also discussed the effects of climate change on Pennsylvania’s natural
environment. Some indicated a need for programs and activities that challenge guests to
conserve in their daily lives and teach them ways to mitigate the effects of climate change.

Center for Survey Research 27 Penn State Harrisburg
Activities and Programming
• Comments about activities and programming fell mostly into two categories: suggestions for
types of activities and programming, and suggestions for how to improve participation.
• Suggestions for activities or programming respondents wanted to see more often included
lessons for beginner recreationalists, historical and nature programs, water activities,
community events, yoga in the park, winter recreation opportunities, organized hikes, habitat
improvement projects, pickleball courts, disc golf courses, and dog-friendly spaces or
activities.
• Some respondents would like to see more events in general. They mentioned low- or no-cost
guided adventures and educational programs for adults. Many respondents were interested in
participating in guided activities.
• Several comments related to youth sports and programs, particularly on the need to make
these activities more accessible for low-income families. Additional suggestions in this area
included partnering with youth programs, such as scouting, homeschool, or other school
groups, possibly with reduced or eliminated fees.
• Suggestions for improving activities and programs included more variety in activities offered,
more organized hikes, transportation in urban areas to help people get to recreational areas,
events targeted to underserved populations (e.g., people of color and seniors), and more
variability in the times offered. Several respondents mentioned that many activities and
programs are offered during traditional working hours. They would like to see hours be
made available in the evenings or weekends.
• Another suggestion offered was to create more social opportunities. Some would like to see
events that bring people out who are not typically drawn to nature, like food truck festivals
and outdoor concerts. Others mentioned hosting geocaching events or creating community
gardens to connect people in urban areas.
Education
• Some respondents indicated that better educational efforts would benefit their overall
experience. They would like to see more efforts to help others understand the value of
conserved land and recreational facilities.
• Some indicated that more educational efforts are needed to improve youth appreciation of
natural resources. Such efforts could also include information about how to keep nature
clean and act as good stewards.
• Other respondents mentioned a lack of educational programs geared toward adults. Some
respondents would like to have more programming to help them learn about wildlife, while
others would like to see educational efforts aimed at improving fitness levels within their
communities.

Center for Survey Research 28 Penn State Harrisburg
Support of Sportsmen and Nature Enthusiasts
• Sportsmen and nature enthusiasts reported wishing that their needs were better met, partially
because they were such avid recreationalists. Some indicated that they are willing to step up
to help clean up and preserve their spaces, while others are not.
• Hunters would like more areas for hunting, while anglers would like better stocking of fish.
Many hunters complained that there was a proliferation of posted land, making it difficult
for them to find spaces to hunt. Many hunters would also like the opportunity to hunt on
Sundays; however, some respondents complained that Sunday hunting would be
disadvantageous, as they rely on Sundays as a safe time to enjoy undeveloped space.
• Avid recreationalists also mentioned the need to stop the proliferation of trails, which they
see as a form of developed space.
• Those who used camping sites regularly would like to see more restrictions preventing dogs
from being on campsites. They expressed concerns that the noise prevents them from
sleeping and makes relaxation difficult. On the other hand, some respondents indicated a
desire to have more places to recreate with their pets.
Access and Affordability
• Some respondents were concerned about the costs associated with recreation, which they
perceive as preventing people from enjoying the outdoors. Some would like to see a
reduction in camping fees and the costs associated with visiting recreational areas , while
others would like to see reduced fees for programming events. Others mentioned that they
want to ensure that access to public land remains free, as too much land is becoming private.
• Another suggestion for reducing costs involved providing more access to rental equipment.
Respondents noted the steep start-up equipment costs associated with some outdoor
activities; having access to rental equipment would enable more people to try activities out
before committing to equipment purchases.
• Physical access was also a concern from respondents, who noted that they would like to see
improved parking access and better integration of public transportation with access points.
Some also mentioned that they would like to have facilities and services that were closer to
their homes.
Communication
• Better communication about events and available resources would help recreationalists plan
and participate more often. They would like to see better promotion of existing resources,
events, and facilities, both in terms of breadth of channel delivery and more advance notice.
• Respondents also mentioned wanting better communication of seasonal activities, such as
when flowers are in-bloom and when specific animals will be migrating.
• Some respondents mentioned a need for recreation guides that better describe what is
available. Some preferred that these guides would be online, while others preferred paper

Center for Survey Research 29 Penn State Harrisburg
versions. Campers requested resources that would describe local activities and restaurants
available near campsites.
• Some would like to know how they can better participate in activities such as clean-up days
and conservation events. Respondents mentioned that they believe that such events would
have more participation if people were asked to participate.
Accessibility and ADA Compliance
• Respondents requested improved access for the increasing number of disabled and elderly
recreationalists. Areas of improvement included access to programs, trails, hunting, and
fishing.
• Some respondents specifically requested more boardwalk style trails, which could help
improve wheelchair access.
Safety
• Respondents discussed a number of ways in which improvements to safety could help them
in their outdoor recreation. Women, in particular, were concerned about having safe spaces
to walk, run, or hike. One possible solution was to have special events more often or
targeted toward women so that they do not have to fear going alone.
• More generally, respondents would like to see more security patrols to protect people and to
prevent vandalism. Some mentioned having more police or rangers and a need for better
enforcement of rules and regulations.
• Other, more specific concerns were shared as well. They included stricter leash laws and
better enforcement of pet control, safer playground equipment, and ways to prevent tick
bites.
• Some respondents also desire better trail maintenance to promote safe use. Some also
mentioned that they see danger in using multi-use trails and on-road bike lanes.
The next figure depicts a word cloud of responses, showing common words that appeared
throughout respondents’ answers. The larger the word, the more common that it appeared in the
responses.

Center for Survey Research 30 Penn State Harrisburg
Figure 23. Help Participating in Outdoor Recreation in PA: Open-Ended Responses

Center for Survey Research 31 Penn State Harrisburg
APPENDIX A – MAP AND LIST OF SURVEY REGIONS
Northern Central Northeast
Bradford Bedford Berks
Cameron Blair Carbon
Clarion Cambria Lackawanna
Crawford Centre Lehigh
Elk Clearfield Luzerne
Erie Clinton Monroe
Forest Columbia Northampton
Jefferson Fulton Pike
McKean Huntingdon Schuylkill
Mercer Juniata Wayne
Potter Lycoming
Sullivan Mifflin
Susquehanna Montour
Tioga Northumberland
Venango Snyder
Warren Somerset
Wyoming Union
Southwest South Central Southeast
Allegheny Adams Bucks
Armstrong Cumberland Chester
Beaver Dauphin Delaware
Butler Franklin Montgomery
Fayette Lancaster Philadelphia
Greene Lebanon
Indiana Perry
Lawrence York
Washington
Westmoreland

Center for Survey Research 32 Penn State Harrisburg
APPENDIX B – SURVEY INSTRUMENT
2020-2024 PA Statewide Comprehensive
Outdoor Recreation Plan: Public Survey
Intro. Do you enjoy spending time in Pennsylvania’s local and state parks and forests and on our trails and rivers? A few minutes of your time could really help us understand how and why you enjoy outdoor recreation. Survey results will help the Pennsylvania Department of Conservation and Natural Resources (DCNR) and our partners determine outdoor recreation programs and funding priorities for Pennsylvania’s next five-year outdoor recreation plan. This survey should take less than 10 minutes. DCNR is administering it in cooperation with the Center for Survey Research at Penn State Harrisburg. If you have questions about the survey, please contact Gretchen Leslie, DCNR senior advisor at [email protected]. Thank you for helping us understand your interest in outdoor recreation!

Center for Survey Research 33 Penn State Harrisburg
County. In what county do you live? Programming note: Insert dropdown list of 67 PA Counties + Don’t know and Do not
live in PA. Respondents who do not live in PA will skip to the end of the survey. Re-code to region
1. Which of the following outdoor activities did you participate in during the last year?
Please select all that apply. Programming note: Rotate responses
___Walking/running ___Hiking
___Bicycling ___Hunting
___Fishing ___Wildlife Watching/Bird watching ___Motorized trail use (ATV/dirt bike riding, snowmobiling)
___Swimming ___Picnicking
___Motorized boating ___Kayaking/canoeing ___Scenic driving
___Visiting historic sites or nature centers ___Camping
___Lawn games (e.g., cornhole, bocce, horseshoes) ___Night sky viewing ___Team or organized sports (e.g. basketball, soccer, baseball, tennis)
___Playing at/Visiting playgrounds ___Other, please list__________________________________
___None of these / I did not participate in any outdoor activities in the last year
2. What is one outdoor recreational activity that you don’t currently do, but would like to try?____________________________
• Add a selectable option for None / There are no outdoor recreational activities I would like to try
• Don’t know / Not sure

Center for Survey Research 34 Penn State Harrisburg
3. Please rate the level of priority your local community should place on investing in the following facilities/infrastructure over the next five years (1 = your lowest priority for investment to 5 = being your highest priority for investment. Programming note: Rotate items 1- Lowest priority, 2, 3, 4, 5- Highest priority, Don’t know, Not applicable
• Playgrounds
• Neighborhood parks
• Community or regional parks
• Sports fields (e.g., soccer, baseball, lacrosse)
• Sports courts (e.g., basketball, tennis, pickleball)
• Community or regional trail systems
• Outdoor environmental educational/nature facilities
• Community gardens
• Swimming pools/water play parks
• Opportunities for/access to water-based recreation (e.g., boating, kayaking)
• Opportunities for hunting and/or fishing
• Off-leash dog parks
• Mountain bike trails
• Action sports parks (e.g., skate parks, pump tracks)
• Trails/parks for motorized activities
• Inclusive programs/facilities for persons with disabilities (ADA Access)
• Pavilions, amphitheaters, or other outdoor public space like plazas
4. From the following list, which one do you consider the highest priority for funding
outdoor recreation and conservation efforts in Pennsylvania? (pick one)
Programming note: Rotate responses ___Acquire and protect open space (as undeveloped, conserved land) ___Acquire additional land and water areas for developed recreation ___Maintain existing park and recreation areas ___Provide environmental and conservation programs ___Provide recreation programs at parks and recreation areas ___Protect wildlife fish and habitat ___Build more greenways and trails ___Restore damaged rivers and streams ___Build walking paths and bicycle lanes and trails between places of work, parks, schools, and shopping areas ___Don’t know / Not sure

Center for Survey Research 35 Penn State Harrisburg
5. When seeking information on outdoor recreation in Pennsylvania, which do you use the MOST? (pick one) Programming note: Rotate responses
___Visitor or welcome centers ___Newspaper/magazine articles
___Friends/relatives/word of mouth ___Travel guides/tour books
___Maps/brochures ___Emails/text messages ___Television/radio
___Internet (e.g., search engines/Google or specific web sites) ___Social media (e.g., Facebook/Twitter/Instagram/YouTube)
___Community newsletters ___Mobile/smart phone apps ___Don’t know / Not sure
___None/ I do not seek information on outdoor recreation
6. How do you use technology to aid in your outdoor recreation? Please select all that apply. Programming note: Rotate responses
___I use a fitness tracker (like a Fitbit) ___I use GPS to navigate through my outdoor experience ___I use technology-based games or apps that use the outdoors as their setting (e.g.,
geocaching, Pokémon Go) ___I post my outdoor recreation experiences to social media sites like Facebook,
Instagram, YouTube, or Twitter ___I use the Internet to find places to go or read reviews ___I use apps that help me find people to join an outing (e.g., Meet Up)
Other, please specify_________________________________________________ ___None/ I do not use technology to aid in outdoor recreation

Center for Survey Research 36 Penn State Harrisburg
7. Please rate your level of agreement with each of the following statements on a scale
from 1 to 5, where 1 is Strongly Disagree and 5 is Strongly Agree.
Programming note: Rotate questions
• Having access to organized guided outdoor recreation programs would increase my
participation in outdoor recreation.
• I worry about how a changing climate is going to impact my future outdoor experiences.
• I am concerned that our youth are not spending enough time outdoors.
• I participate in outdoor recreation to improve my health.
• I would like to participate more in outdoor activities.
• Outdoor recreation is an essential part of my life.
8. What is the single most important thing that parks and outdoor recreation agencies/organizations could do to help you participate in outdoor recreation in Pennsylvania? _____________________________________________________________
Demographic questions
Gender. Which of the following best describes your gender?
• Male
• Female
• Something else
AGE. What is your age? [Text box]
What is your age? Recode – Broad
• 18-34 years
• 35-64 years
• 65 years and older
Ethnicity. Do you consider yourself to be Hispanic or Latino?
• Yes
• No
• Don’t know/Not sure

Center for Survey Research 37 Penn State Harrisburg
Race. Which of the following best describes your race? You can select all that apply.
• White
• Black or African American
• American Indian or Alaska Native
• Asian
• Native Hawaiian or Pacific Islander
• Something else: _________
• Don’t know/not sure
Which of the following best describes your race? Recode
• White alone
• Black or African American alone
• Something else
Zip. What is your zip code? ____________________

Center for Survey Research 38 Penn State Harrisburg
APPENDIX C – PARTICIPATION IN OUTDOOR ACTIVITIES:
OTHER, PLEASE SPECIFY RESPONSES
Response Number % of All Respondents
Horseback riding 226 2.6 Disc golf 86 1.0
Skiing 72 0.8
Climbing 68 0.8 Photography 35 0.4
Geocaching 27 0.3
Target shooting 23 0.3 Foraging 19 0.2
Pet recreation 18 0.2
Paddleboarding 16 0.2 Dualsporting 12 0.1
Golf 12 0.1
Gardening 11 0.1 Sailing 11 0.1
Mushing 10 0.1
Snowmobiling 9 0.1 Trapping 9 0.1
Plant viewing/identification 8 0.1
Water tubing 7 0.1 Orienteering 6 0.1
Trail maintenance 6 0.1
Yoga/meditation 6 0.1 Kite flying 4 0.0
Climbing, skiing 3 0.0
Dogsledding 3 0.0 Snowshoeing 3 0.0
Training dogs 3 0.0
Ziplining 3 0.0 Botanizing 2 0.0
Climbing, caving 2 0.0
Disc golf, geocaching 2 0.0 Education for children 2 0.0
Firewood procurement 2 0.0
Grilling 2 0.0 Metal detecting 2 0.0
Orienteering, geocaching 2 0.0
Pickleball 2 0.0 Rollerblading 2 0.0
Search and rescue 2 0.0
Shed hunting 2 0.0

Center for Survey Research 39 Penn State Harrisburg
Skateboarding 2 0.0 Surfing 2 0.0
Visiting gardens 2 0.0
Whitewater rafting 2 0.0 Attend educational activities offered (example, hike led by Park Ranger to ID spring epnohemeraks)
1 0.0
Attending Groundhog Day 1 0.0
Attending informational classes 1 0.0 Beach 1 0.0
Beautifying public spaces 1 0.0
Beekeeping, disc golf 1 0.0 Blacksmith workshops 1 0.0
Botanizing, birding, photography 1 0.0
Bushcrafting 1 0.0 Caving 1 0.0
Chess instruction 1 0.0
Classes at local county park 1 0.0 Clean up state forest trails 1 0.0
Clean up streams and trails 1 0.0
Climbing, disc golf 1 0.0 Climbing, photography 1 0.0
Climbing, SCUBA diving 1 0.0
Climbing, skateboarding, skiing 1 0.0 Climbing, skateboarding, skiing, snowboarding, rafting, ziplining 1 0.0
Climbing, skiing, Frisbee golf 1 0.0
Climbing, skiing, Pet recreation 1 0.0 Climbing, whitewater rafting, skiing, cross country skiing 1 0.0
Collecting trash at local and state parks 1 0.0
Craft shows, festivals 1 0.0 Drag racing 1 0.0
Drawing, painting, photography, plant study 1 0.0
Drone flying 1 0.0 Educational classes 1 0.0
Farmers markets 1 0.0
Farming 1 0.0 Festivals, farmers markets 1 0.0
Field trials - birddogs 1 0.0
Fireworks 1 0.0 Float planes and backcountry flying. 1 0.0
Foraging, dog sledding. 1 0.0
Foraging, forest bathing 1 0.0 Foraging, Frisbee golf 1 0.0
Foraging, photography 1 0.0
Forest husbandry: removing invasive plants and renewing woodland. 1 0.0 Forest management and trail cleaning 1 0.0
Free Forest School 1 0.0

Center for Survey Research 40 Penn State Harrisburg
Game preserve 1 0.0 Gardening, hammocking, slacklining, climbing, river floating, snowboarding, crosscountry skiing, snowshoeing
1 0.0
Gardening, photography, horseback riding 1 0.0
Gardening, propagating native species and removing invasive species. Educational programs, dyeing with natural dyes from plants. Art making: sketching, plein air painting, printmaking with leaves, using natural materials (twigs, grasses, etc.) in art.
1 0.0
Gardening, clean-up day 1 0.0
Geocaching, climbing 1 0.0
Girl Scouts 1 0.0 Golf, disc golf 1 0.0
Golf; sailing 1 0.0
Great place to find peace and relaxation 1 0.0 Hammocking 1 0.0
Handicapped facilities 1 0.0
Hiking trail maintenance 1 0.0 Horseback riding, sailing 1 0.0
Horseback riding, Skiing, snowshoeing 1 0.0
Horseback riding, snowboarding, skiing, yoga 1 0.0 Hunting dog training 1 0.0
I am in an electric wheelchair. I use the accessible trails at Wildwood 1 0.0
Ice fishing 1 0.0 Ice skating 1 0.0
Interpretive programs 1 0.0
Just being outside and enjoying nature 1 0.0 Kite flying, Frisbee, slacklining 1 0.0
Kite flying, sailing 1 0.0
Laying out by the lake relaxing/reading/enjoying weather 1 0.0 Learning about native non-invasive plants at a preserve 1 0.0
Mushroom and antler sheds and arrowhead hunting 1 0.0
Nature programs/events 1 0.0 Nature study/environmental change 1 0.0
Organized community volunteer cleanups in waterways & public lands.
1 0.0
Organized group activities 1 0.0 Organizing and participation in volunteer maintenance and cleanup 1 0.0
Organizing wilderness-based races and events 1 0.0
Orienteering, disc golf 1 0.0 Outdoor cultural events, including concerts and festivals; open air/farmers markets
1 0.0
Outdoor how-to events 1 0.0
Outdoor live music/outdoor movie night 1 0.0 Outdoor roller skating 1 0.0
Overlanding 1 0.0
Paddle boarding, horseback riding 1 0.0

Center for Survey Research 41 Penn State Harrisburg
Paddleboarding, pet recreation 1 0.0 Paddleboarding, skiing 1 0.0
Painted rock hunting 1 0.0
Pet recreation, foraging 1 0.0 Photography, graduate level environmental studies, foraging, plant viewing/identification
1 0.0
Photography, snorkeling 1 0.0
Picnics 1 0.0 Plant viewing/identification, horseback riding, frog/toad catch/release
1 0.0
Plant viewing/identification, photography 1 0.0
Planting trees in public places 1 0.0 Plein air painting 1 0.0
Plogging 1 0.0
Range 1 0.0 Reading by a lake or body of water, nature landscape photography 1 0.0
Recording sound in nature 1 0.0
Recreational aircraft use 1 0.0 Recreational seaplane ops 1 0.0
Reenactment 1 0.0
Research and education in ecology and horticulture; sailing 1 0.0 Rock hunting 1 0.0
Rock/ice climbing, snowboarding 1 0.0
Sailing, backpacking 1 0.0 SCUBA diving 1 0.0
Search and rescue training 1 0.0
Seasonal events 1 0.0 Skateboarding, snowboarding 1 0.0
skating 1 0.0
Skiing, climbing, caving, SCUBA, snowshoeing 1 0.0 Skiing, conservation activities 1 0.0
Skiing, rock climbing, outdoor concerts 1 0.0
Skiing, Snowboarding 1 0.0 Skiing, snowboarding, and mountain biking 1 0.0
Skiing, snowboarding, rock climbing 1 0.0
Skiing, snowshoeing 1 0.0 Skiing, surfing 1 0.0
Skiing, target shooting 1 0.0
Skipping rocks 1 0.0 Snorkeling 1 0.0
Snow sports 1 0.0
Snowboarding, photography 1 0.0 Snowshoeing, climbing 1 0.0
Snowshoeing, cross country skiing, disc golf, ice skating, backpacking 1 0.0
Snowsports, cross country skiing, golf, Frisbee golf 1 0.0 Social gatherings 1 0.0

Center for Survey Research 42 Penn State Harrisburg
State park beaches! Just beaching 1 0.0 Summits on the Air (SOTA) 1 0.0
Target shooting, climbing 1 0.0
Trail cams 1 0.0 Trapping, foraging 1 0.0
Trapping, trail building, firefighting, rock climbing 1 0.0
Tree planting 1 0.0 Tree planting, methane research 1 0.0
Viewing the old growth of trees. 1 0.0
Vista viewing 1 0.0 Volunteer at mountain bike racing events 1 0.0
Volunteer cleanups and tree planting 1 0.0
Volunteer search and rescue training 1 0.0 Volunteer trail maintenance 1 0.0
Volunteering for the Lancaster Conservancy 1 0.0
Volunteering PISP 1 0.0 Water rescue training, Search and Rescue training, wildland fire training, Jeep Club Rides, snowshoeing, skiing, rollerblading, ice skating, paddleboard, aviation
1 0.0
Waterskiing, wakeboarding, water tubing 1 0.0
Wheelchair trails 1 0.0 Whitewater rafting, rock climbing/bouldering 1 0.0
Whitewater rafting, ziplining 1 0.0
Working on trails. 1 0.0 Ziplining, gardening, lawn care 1 0.0
Total 896 10.3

Center for Survey Research 43 Penn State Harrisburg
APPENDIX D – INTEREST IN OUTDOOR RECREATIONAL
ACTIVITIES: OPEN-ENDED RESPONSES
What is one outdoor recreational activity that you don't currently do, but would like to try? Open-ended response
First response Frequency Percent Valid Percent
Cumulative Percent
Archery 31 0.4 0.8 0.8
Backpacking / trekking 98 1.1 2.6 3.4
Bicycling 227 2.6 6.0 9.4
Boating (unspecified) 79 0.9 2.1 11.5
Camping 140 1.6 3.7 15.1
Cross country skiing / snowshoeing 227 2.6 6.0 21.1
Disc golf 63 0.7 1.7 22.8
Fishing 187 2.2 4.9 27.7
Foraging 5 0.1 0.1 27.8
Gardening 3 0.0 0.1 27.9
Geocaching 34 0.4 0.9 28.8
Golfing 8 0.1 0.2 29.0
Guided nature walks 8 0.1 0.2 29.2
Hanggliding 42 0.5 1.1 30.3
Hiking 96 1.1 2.5 32.9
Horseback riding 49 0.6 1.3 34.1
Hunting 98 1.1 2.6 36.7
Ice climbing 7 0.1 0.2 36.9
Ice fishing 12 0.1 0.3 37.2
Kayaking / canoeing 825 9.5 21.7 59.0
Kiteboarding 11 0.1 0.3 59.2
Lawn games 9 0.1 0.2 59.5
Motorized boating 43 0.5 1.1 60.6
Motorized trail use 261 3.0 6.9 67.5
Night sky viewing / stargazing 51 0.6 1.3 68.8
Orienteering 35 0.4 0.9 69.7
Other 73 0.8 1.9 71.7
Paddleboating 5 0.1 0.1 71.8

Center for Survey Research 44 Penn State Harrisburg
Paragliding 13 0.1 0.3 72.1
Parasailing 7 0.1 0.2 72.3
Park events 3 0.0 0.1 72.4
Pet recreation 4 0.0 0.1 72.5
Pickleball 12 0.1 0.3 72.8
Plant viewing / identification 12 0.1 0.3 73.1
Playing at / visiting playgrounds 2 0.0 0.1 73.2
Rock climbing 288 3.3 7.6 80.8
Ropes course 1 0.0 0.0 80.8
Sailing 42 0.5 1.1 81.9
Skateboarding / Roller blading 5 0.1 0.1 82.0
Skiing / snowboarding 42 0.5 1.1 83.1
Skydiving 36 0.4 0.9 84.1
Snorkeling / SCUBA 25 0.3 0.7 84.8
Spelunking 11 0.1 0.3 85.0
Stand-up paddleboarding 225 2.6 5.9 91.0
Surfing 8 0.1 0.2 91.2
Survival skills 4 0.0 0.1 91.3
Swimming 18 0.2 0.5 91.8
Target shooting 8 0.1 0.2 92.0
Team or organized sports 16 0.2 0.4 92.4
Trapping 9 0.1 0.2 92.6
Visiting historic sites or nature centers 4 0.0 0.1 92.7
Walking / running 27 0.3 0.7 93.4
Water tubing 25 0.3 0.7 94.1
Waterskiing / wakeboarding 17 0.2 0.4 94.5
Watersports 6 0.1 0.2 94.7
Whitewater rafting 40 0.5 1.1 95.8
Wildlife photography 7 0.1 0.2 95.9
Wildlife watching / bird watching 31 0.4 0.8 96.8
Windsurfing 8 0.1 0.2 97.0
Yoga / meditation 5 0.1 0.1 97.1
Ziplining 110 1.3 2.9 100.0
Total 3798 43.8 100.0

Center for Survey Research 45 Penn State Harrisburg
No response 4878 56.2
Total 8676 100.0
Second response Frequency Percent Valid Percent
Cumulative Percent
Archery 2 0.0 1.0 1.0
Backpacking / trekking 4 0.0 2.0 3.0
Bicycling 6 0.1 3.0 6.1
Camping 20 0.2 10.2 16.2
Cross country skiing / snowshoeing 9 0.1 4.6 20.8
Disc golf 2 0.0 1.0 21.8
Fishing 11 0.1 5.6 27.4
Foraging 10 0.1 5.1 32.5
Geocaching 2 0.0 1.0 33.5
Golfing 1 0.0 0.5 34.0
Guided nature walks 1 0.0 0.5 34.5
Hanggliding 4 0.0 2.0 36.5
Hiking 7 0.1 3.6 40.1
Horseback riding 3 0.0 1.5 41.6
Hunting 7 0.1 3.6 45.2
Kayaking / canoeing 7 0.1 3.6 48.7
Motorized boating 6 0.1 3.0 51.8
Motorized trail use (ATV / dirt bike riding / snowmobiling)
7 0.1 3.6 55.3
Night sky viewing / stargazing 4 0.0 2.0 57.4
Orienteering 1 0.0 0.5 57.9
Other 6 0.1 3.0 60.9
Parasailing 1 0.0 0.5 61.4
Pet recreation 1 0.0 0.5 61.9
Pickleball 1 0.0 0.5 62.4
Plant viewing / identification 5 0.1 2.5 65.0
Playing at / visiting playgrounds 1 0.0 0.5 65.5
Rock climbing 13 0.1 6.6 72.1
Ropes course 5 0.1 2.5 74.6
Skiing / snowboarding 1 0.0 0.5 75.1

Center for Survey Research 46 Penn State Harrisburg
Skydiving 3 0.0 1.5 76.6
Snorkeling / SCUBA 3 0.0 1.5 78.2
Spelunking 1 0.0 0.5 78.7
Stand-up paddleboarding 14 0.2 7.1 85.8
Surfing 1 0.0 0.5 86.3
Swimming 3 0.0 1.5 87.8
Target shooting 1 0.0 0.5 88.3
Team or organized sports 3 0.0 1.5 89.8
Walking / running 3 0.0 1.5 91.4
Water tubing 3 0.0 1.5 92.9
Watersports 1 0.0 0.5 93.4
Whitewater rafting 2 0.0 1.0 94.4
Wildlife watching / bird watching 4 0.0 2.0 96.4
Yoga / meditation 3 0.0 1.5 98.0
Ziplining 4 0.0 2.0 100.0
Total 197 2.3 100.0 No response 8479 97.7
Total 8676 100.0
Third response Frequency Percent Valid Percent
Cumulative Percent
Archery 2 0.0 7.4 7.4
Backpacking / trekking 2 0.0 7.4 14.8
Bicycling 1 0.0 3.7 18.5
Fishing 2 0.0 7.4 25.9
Foraging 1 0.0 3.7 29.6
Geocaching 1 0.0 3.7 33.3
Hiking 2 0.0 7.4 40.7
Horseback riding 1 0.0 3.7 44.4
Ice skating 1 0.0 3.7 48.1
Kayaking / canoeing 1 0.0 3.7 51.9
Motorized trail use (ATV / dirt bike riding / snowmobiling)
1 0.0 3.7 55.6
Other 3 0.0 11.1 66.7
Rock climbing 2 0.0 7.4 74.1

Center for Survey Research 47 Penn State Harrisburg
Stand-up paddleboarding 1 0.0 3.7 77.8
Team or organized sports 1 0.0 3.7 81.5
Walking / running 1 0.0 3.7 85.2
Watersports 1 0.0 3.7 88.9
Whitewater rafting 1 0.0 3.7 92.6
Wildlife watching / bird watching 1 0.0 3.7 96.3
Ziplining 1 0.0 3.7 100.0
Total 27 0.3 100.0 No response 8649 99.7
Total 8676 100.0
Fourth response Frequency Percent Valid Percent
Cumulative Percent
Camping 1 0.0 25.0 25.0
Cutting timber 1 0.0 25.0 50.0
Rock climbing 1 0.0 25.0 75.0
Wildlife watching / bird watching 1 0.0 25.0 100.0
Total 4 0.0 100.0 No response 8672 100.0
Total 8676 100.0

Center for Survey Research 48 Penn State Harrisburg
APPENDIX E – COMMUNITY FACILITY INVESTMENT
REFERENCES IN NEXT FIVE YEARS, BY SURVEY YEAR
Please rate the level of priority your local community should place on investing in each of the following facilities / infrastructure over the next five years:
2019 2014
# % Mean # % Mean
Playgrounds 1- Lowest priority for investment
870 10.7%
3.22
616 9.4%
3.19
2 1324 16.2% 1068 16.3%
3 2443 29.9% 2196 33.6%
4 2146 26.3% 1759 26.9%
5- Highest priority for investment
1385 17.0% 901 13.8%
Total 8168 100.0% 6540 100.0%
Neighborhood parks
1- Lowest priority for investment
606 7.3%
3.55
428 6.5%
3.45
2 1003 12.2% 838 12.7%
3 2112 25.6% 1950 29.6%
4 2283 27.7% 2069 31.5%
5- Highest priority for investment
2245 27.2% 1292 19.6%
Total 8249 100.0% 6577 100.0%
Community or regional parks
1- Lowest priority for investment
395 4.8%
3.76
320 4.9%
3.64
2 727 8.8% 652 9.9%
3 1944 23.6% 1697 25.9%
4 2509 30.5% 2303 35.1%
5- Highest priority for investment
2660 32.3% 1585 24.2%
Total 8235 100.0% 6557 100.0%
Sports fields (e.g., soccer, baseball, lacrosse)
1- Lowest priority for investment
1985 24.3%
2.58
- -
-
2 1943 23.8% - -
3 2347 28.8% - -
4 1303 16.0% - -
5- Highest priority for investment
584 7.2% - -
Total 8162 100.0% - -

Center for Survey Research 49 Penn State Harrisburg
Sports courts (e.g., basketball, tennis, pickleball)
1- Lowest priority for investment
1980 24.3%
2.54
- -
-
2 2048 25.2% - -
3 2343 28.8% - -
4 1271 15.6% - -
5- Highest priority for investment
499 6.1% - -
Total 8141 100.0% - -
Community or regional trail systems
1- Lowest priority for investment
201 2.4%
4.23
253 3.8%
4.00
2 364 4.4% 383 5.8%
3 1166 14.0% 1171 17.7%
4 2223 26.6% 2096 31.6%
5- Highest priority for investment
4391 52.6% 2723 41.1%
Total 8345 100.0% 6626 100.0%
Outdoor environmental educational/nature facilities
1- Lowest priority for investment
392 4.7%
3.76
529 8.0%
3.32
2 817 9.8% 1017 15.4%
3 1908 23.0% 2031 30.8%
4 2445 29.5% 1836 27.9%
5- Highest priority for investment
2733 32.9% 1173 17.8%
Total 8295 100.0% 6586 100.0%
Community gardens
1- Lowest priority for investment
1360 16.6%
3.04
1147 17.5%
2.90
2 1518 18.5% 1388 21.2%
3 2133 26.0% 1796 27.5%
4 1783 21.8% 1359 20.8%
5- Highest priority for investment
1398 17.1% 847 13.0%
Total 8192 100.0% 6537 100.0%
Swimming pools/water play parks
1- Lowest priority for investment
1359 16.5%
2.96
1340 20.5%
2.70
2 1596 19.4% 1587 24.2%
3 2433 29.6% 1916 29.2%
4 1707 20.7% 1137 17.4%
5- Highest priority for investment
1136 13.8% 572 8.7%
Total 8231 100.0% 6552 100.0%

Center for Survey Research 50 Penn State Harrisburg
Opportunities for/access to water-based recreation (e.g., boating, kayaking)
1- Lowest priority for investment
324 3.9%
3.72
365 5.5%
3.69
2 771 9.4% 678 10.2%
3 2146 26.0% 1556 23.4%
4 2607 31.6% 2098 31.5%
5- Highest priority for investment
2395 29.1% 1955 29.4%
Total 8243 100.0% 6652 100.0%
Opportunities for hunting and/or fishing
1- Lowest priority for investment
1296 15.8%
3.29
723 10.9%
3.66
2 1250 15.2% 808 12.1%
3 1811 22.1% 1187 17.8%
4 1476 18.0% 1230 18.5%
5- Highest priority for investment
2364 28.8% 2703 40.6%
Total 8197 100.0% 6651 100.0%
Off-leash dog parks
1- Lowest priority for investment
2430 30.0%
2.53
2146 32.8%
2.42
2 1735 21.4% 1491 22.8%
3 1949 24.0% 1488 22.7%
4 1178 14.5% 848 13.0%
5- Highest priority for investment
820 10.1% 570 8.7%
Total 8112 100.0% 6543 100.0%
Mountain bike trails
1- Lowest priority for investment
1102 13.5%
3.05
947 14.4%
3.06
2 1586 19.5% 1292 19.6%
3 2455 30.2% 1822 27.7%
4 1744 21.4% 1450 22.0%
5- Highest priority for investment
1246 15.3% 1066 16.2%
Total 8133 100.0% 6577 100.0%
Action sports parks (e.g., skate parks, pump tracks)
1- Lowest priority for investment
2561 31.7%
2.37
1793 27.4%
2.58
2 2022 25.1% 1527 23.4%
3 1940 24.0% 1522 23.3%
4 995 12.3% 997 15.3%
5- Highest priority for investment
551 6.8% 697 10.7%
Total 8069 100.0% 6536 100.0%

Center for Survey Research 51 Penn State Harrisburg
Trails/parks for motorized activities
1- Lowest priority for investment
2677 32.5%
2.72
2460 37.4%
2.53
2 1519 18.5% 1243 18.9%
3 1328 16.1% 980 14.9%
4 824 10.0% 712 10.8%
5- Highest priority for investment
1884 22.9% 1181 18.0%
Total 8232 100.0% 6576 100.0%
Inclusive programs/facilities for persons with disabilities (ADA Access)
1- Lowest priority for investment
463 5.7%
3.59
- -
-
2 879 10.9% - -
3 2267 28.1% - -
4 2368 29.3% - -
5- Highest priority for investment
2093 25.9% - -
Total 8070 100.0% - -
Pavilions, amphitheaters, or other outdoor public space like plazas
1- Lowest priority for investment
1159 14.0%
2.98
- -
-
2 1706 20.7% - -
3 2573 31.2% - -
4 1745 21.1% - -
5- Highest priority for investment
1072 13.0% - -
Total 8255 100.0% - -

Center for Survey Research 52 Penn State Harrisburg
APPENDIX F – USING TECHNOLOGY TO AID IN OUTDOOR
RECREATION: RE-CODED OPEN-ENDED RESPONSES
How do you use technology to aid in your outdoor recreation?
Other, please specify: Re-coded Responses
Frequency Percent
Valid Percent
Cumulative Percent
App developed for my local area (e.g., county or Pennsylvania)
12 0.1 4.2 4.2
App or site designed to enhance a specific experience (e.g., plant/animal identification, hunting/fishing, etc.)
101 1.2 35.3 39.5
Camera for recording or photos (e.g., trail cam or GoPro)
20 0.2 7.0 46.5
Cell phone for help or emergencies 3 0.0 1.0 47.6
Cyclocomputer 5 0.1 1.7 49.3
Fitness app / site (e.g., Strava) 27 0.3 9.4 58.7
Ham radio 1 0.0 0.3 59.1
Heart monitor 1 0.0 0.3 59.4
I use email to collaborate events - I have used forum based in the past as well.
1 0.0 0.3 59.8
Laser range finder 1 0.0 0.3 60.1
Listen to music or podcasts 3 0.0 1.0 61.2
Odometer 1 0.0 0.3 61.5
Personal locator beacon 2 0.0 0.7 62.2
Rangefinders 1 0.0 0.3 62.6
Roll chart 1 0.0 0.3 62.9
Satellite scouting 1 0.0 0.3 63.3
Sonar/fish finder 1 0.0 0.3 63.6
SpotGen tracking device for emergencies 1 0.0 0.3 64.0
Trail app or site 78 0.9 27.3 91.3
UDisc 10 0.1 3.5 94.8
Use internet for buying hunting licenses 1 0.0 0.3 95.1
Wearable tech (e.g., smart watch) 2 0.0 0.7 95.8
Weather app 12 0.1 4.2 100.0
Total 286 3.3 100.0 No response 8390 96.7
Total 8676 100.0