2020 in ows deeloped economies
TRANSCRIPT
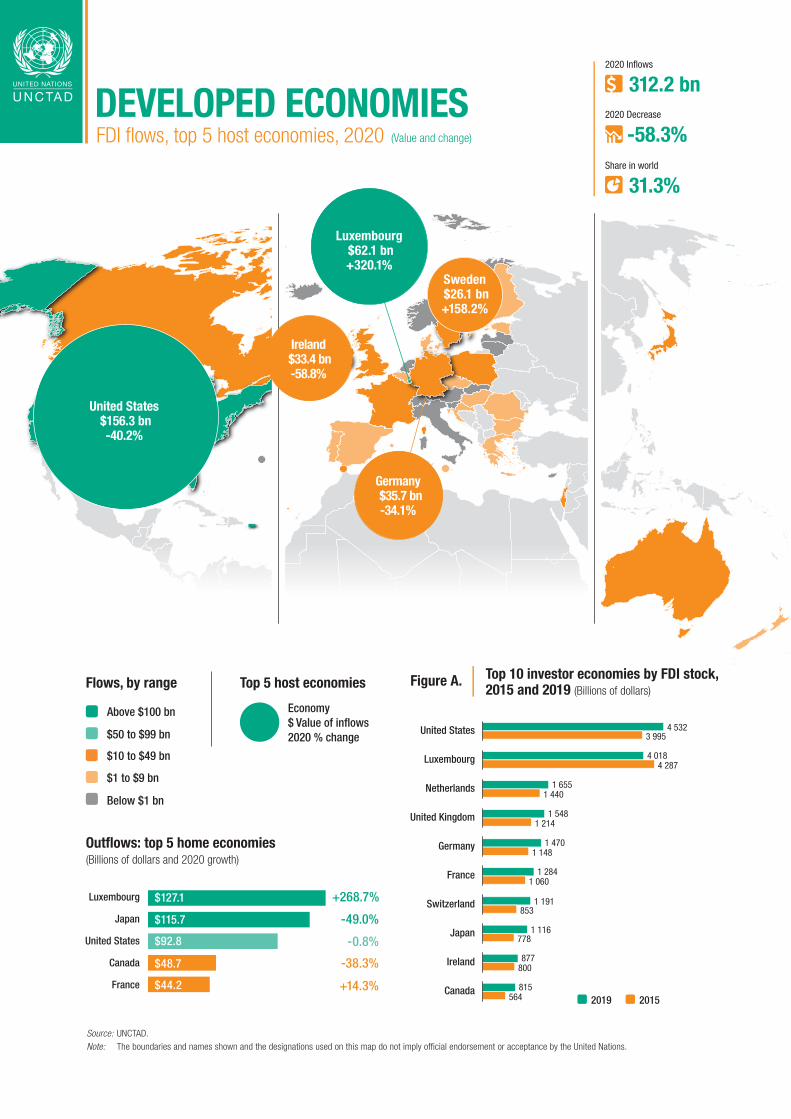
$127.1
$115.7
$92.8
$48.7
$44.2
-49.0%
-0.8%
-38.3%
+14.3%
Out�ows: top 5 home economies (Billions of dollars and 2020 growth)
2020 Decrease
2020 In�ows
Share in world
312.2 bn
31.3%
+268.7%
-58.3%
Luxembourg
Japan
United States
Canada
France
Top 10 investor economies by FDI stock,2015 and 2019 (Billions of dollars)
Figure A.
2015 2019
4 532
4 018
1 655
1 548
1 470
1 284
1 191
1 116
877
815
3 995
4 287
1 440
1 214
1 148
1 060
853
778
800
564
United States
Luxembourg
Netherlands
United Kingdom
Germany
France
Switzerland
Japan
Ireland
Canada
Sweden $26.1 bn+158.2%
Ireland $33.4 bn-58.8%
United States $156.3 bn
-40.2%
Germany $35.7 bn-34.1%
Luxembourg $62.1 bn+320.1%
Top 5 host economies
Economy$ Value of in�ows2020 % change
Flows, by range
Above $100 bn
$50 to $99 bn
$10 to $49 bn
$1 to $9 bn
Below $1 bn
DEVELOPED ECONOMIESFDI �ows, top 5 host economies, 2020 (Value and change)
Source: UNCTAD.
Note: The boundaries and names shown and the designations used on this map do not imply official endorsement or acceptance by the United Nations.

HIGHLIGHTS• In� ows halved, heavily affected by � nancial transactions• Global FDI share plummeted to the lowest on record • Developed economies are leading the recovery
Share in world totalOther developed countriesNorth America Other developed EuropeEuropean Union
68.0 53.3 57.9 49.3 48.9 31.3
Figure B. FDI in�ows, 2007–2009 and 2018–2020 (Billions of dollars and per cent)
Figure C. FDI out�ows, 2007–2009 and 2018–2020(Billions of dollars and per cent)
0
700
1 400
2007 2008 2009 2018 2019 2020
85.2 80.5 76.1 49.5 64.0 46.9
0
1 000
2 000
2007 2008 2009 2018 2019 2020
Table C. Announced international project � nance deals, 2019–2020 Table D. SDG sectors: green� eld and project
� nance, selected trends, 2019–2020
Table A. Net cross-border M&A sales, 2019–2020 Table B. Announced green� eld projects,
2019–2020
Sector/industry
Value(Millions of dollars) Number
2019 2020 2019 2020
Total 423 539 378 888 5 802 5 225
Primary 33 507 48 365 590
Manufacturing 218 440 202 966 1 319 946
Services 171 592 175 874 4 118 3 689
Top industries by value
Food, beverages and tobacco 18 757 82 744 131 101
Information and communication 20 428 66 752 1 130 1 112
Pharmaceuticals 96 183 44 043 155 175
Electronics and electrical equipment 20 113 38 090 239 159
Utilities 2 119 26 708 153 142
Trade 14 071 19 739 463 405
Sector/industry
Value(Millions of dollars) Number
2019 2020 2019 2020
Total 242 684 175 411 543 587
Top industries by number
Renewable energy 112 121 96 319 387 439
Telecommunication 8 454 23 949 17 33
Transport infrastructure 38 633 16 964 21 27
Oil and gas 27 919 8 111 33 23
Energy 15 767 5 734 33 22
Sector/industry
Value(Millions of dollars) Number
2019 2020 2019 2020
Total 345 740 289 048 10 331 8 376
Primary 5 180 7 424 55 34
Manufacturing 147 242 99 647 4 432 3 216
Services 193 317 181 978 5 844 5 126
Top industries by value
Energy 52 506 58 231 272 319
Information and communication 36 924 48 260 2 145 1 998
Construction 42 634 25 868 357 275
Electronics and electrical equipment 28 452 25 650 604 516
Trade 12 564 16 157 434 434
Automotive 18 756 14 844 501 332
Sector/industry
Value(Millions of dollars) Number
2019 2020 2019 2020
Infrastructure 62 853 46 647 71 82
Renewable energy 112 121 96 319 387 439
WASH 423 81 16 7
Food and agriculture 8 789 9 695 316 261
Health 12 554 14 253 496 407
Education 641 260 52 32
$127.1
$115.7
$92.8
$48.7
$44.2
-49.0%
-0.8%
-38.3%
+14.3%
Out�ows: top 5 home economies (Billions of dollars and 2020 growth)
2020 Decrease
2020 In�ows
Share in world
312.2 bn
31.3%
+268.7%
-58.3%
Luxembourg
Japan
United States
Canada
France
Top 10 investor economies by FDI stock,2015 and 2019 (Billions of dollars)
Figure A.
2015 2019
4 532
4 018
1 655
1 548
1 470
1 284
1 191
1 116
877
815
3 995
4 287
1 440
1 214
1 148
1 060
853
778
800
564
United States
Luxembourg
Netherlands
United Kingdom
Germany
France
Switzerland
Japan
Ireland
Canada
Sweden $26.1 bn+158.2%
Ireland $33.4 bn-58.8%
United States $156.3 bn
-40.2%
Germany $35.7 bn-34.1%
Luxembourg $62.1 bn+320.1%
Top 5 host economies
Economy$ Value of in�ows2020 % change
Flows, by range
Above $100 bn
$50 to $99 bn
$10 to $49 bn
$1 to $9 bn
Below $1 bn
DEVELOPED ECONOMIESFDI �ows, top 5 host economies, 2020 (Value and change)