2020 north american industrial outlook
TRANSCRIPT

2020 NORTH AMERICAN INDUSTRIAL OUTLOOK

2020 INDUSTRIAL QUICK STATS
459.9MSF
ABSORPTION
573.4MSF
SUPPLY6.8%
ASKING RENT INCREASE
5%VACANCY
CONTENTSIndustrial Market 04Economy 09Trade 12Capital Markets 15
• The forecast for North American industrial absorption in 2020-2021 is a healthy 459.9 million square feet (msf). New supply—which finally surpassed demand in 2019—will continue to do so over the next two years. Supply levels are projected to reach 573.4 msf from 2020 to 2021. Nonetheless, vacancy will remain anchored around the 5% mark, ending 2021 at 5.2%—an uptick of 60-bps from year-end 2019. Asking rents are expected to increase by 6.8% and reach a new nominal high of USD $6.95 psf by year-end 2021— up from USD $6.51 psf in 2019.
• Over the next couple of years, we expect the North American industrial market to remain one of the leading product types to watch. Economic indicators, with strong links to industrial fundamentals, point to continued growth in both 2020 and 2021. Robust consumer spending supported by stable inflation, wage growth and low unemployment bode well for industrial demand, not to mention structural changes related to eCommerce.
• As the world faces a new decade, eyes will be on policy developments—fiscal, monetary and trade—as well as the health of consumers, the key pillar of the economic engine moving forward. Both global and North American economic growth moderated in 2019, and more moderation in North America is expected in 2020. Trade policy remains the most fluid aspect of the near-term outlook. Positive developments that emerged recently included the ratification of USMCA in the U.S. Congress and the agreement on a Phase One deal between the U.S. and China.
• Industrial has been the investors’ darling in recent years, and there is no indication of this love affair coming to an end any time soon. According to the 2020 PwC/ULI Emerging Trends in Real Estate survey report, industrial remains the most attractive property type both for investment and development. Over the next several years, we expect underlying industrial market liquidity to continue to grow as investors seek to deploy record levels of capital with an increasingly favorable allocation directed towards industrial assets.
EXECUTIVE SUMMARY
For a deep dive into local market fundamentals click here.
NORTH AMERICAN INDUSTRIAL OUTLOOK 2019
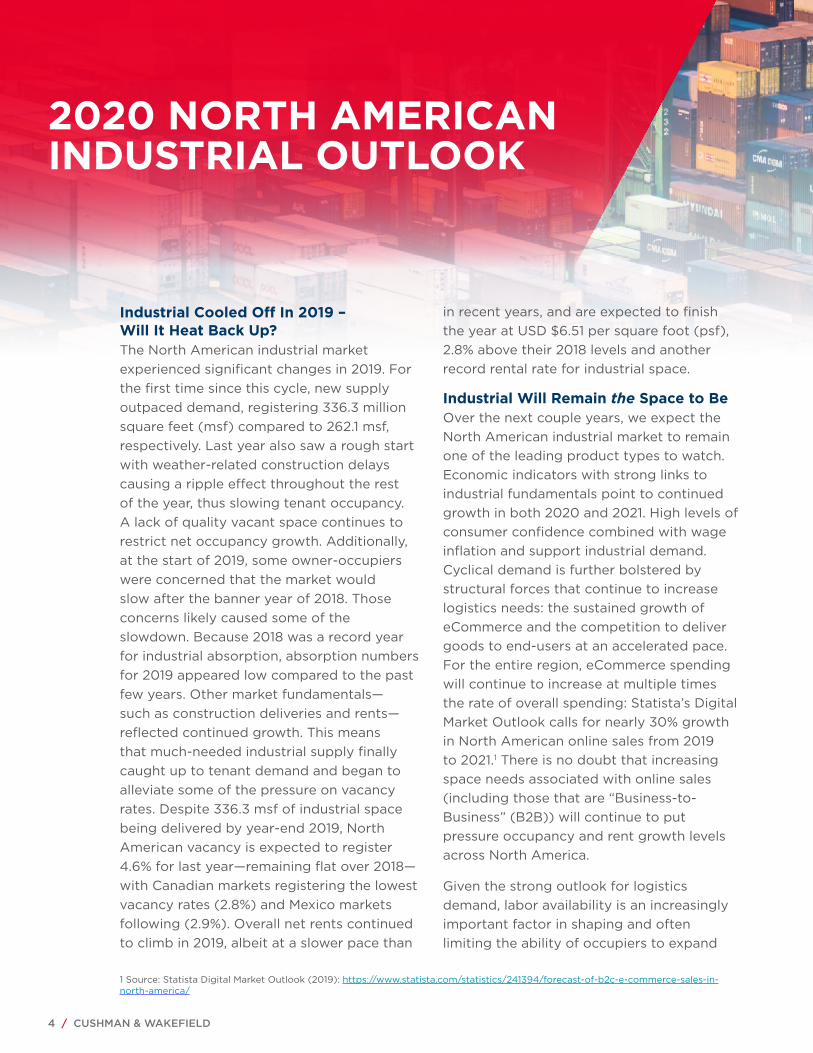
Industrial Cooled Off In 2019 – Will It Heat Back Up?The North American industrial market experienced significant changes in 2019. For the first time since this cycle, new supply outpaced demand, registering 336.3 million square feet (msf) compared to 262.1 msf, respectively. Last year also saw a rough start with weather-related construction delays causing a ripple effect throughout the rest of the year, thus slowing tenant occupancy. A lack of quality vacant space continues to restrict net occupancy growth. Additionally, at the start of 2019, some owner-occupiers were concerned that the market would slow after the banner year of 2018. Those concerns likely caused some of the slowdown. Because 2018 was a record year for industrial absorption, absorption numbers for 2019 appeared low compared to the past few years. Other market fundamentals—such as construction deliveries and rents—reflected continued growth. This means that much-needed industrial supply finally caught up to tenant demand and began to alleviate some of the pressure on vacancy rates. Despite 336.3 msf of industrial space being delivered by year-end 2019, North American vacancy is expected to register 4.6% for last year—remaining flat over 2018—with Canadian markets registering the lowest vacancy rates (2.8%) and Mexico markets following (2.9%). Overall net rents continued to climb in 2019, albeit at a slower pace than
1 Source: Statista Digital Market Outlook (2019): https://www.statista.com/statistics/241394/forecast-of-b2c-e-commerce-sales-in-north-america/
in recent years, and are expected to finish the year at USD $6.51 per square foot (psf), 2.8% above their 2018 levels and another record rental rate for industrial space.
Industrial Will Remain the Space to Be Over the next couple years, we expect the North American industrial market to remain one of the leading product types to watch. Economic indicators with strong links to industrial fundamentals point to continued growth in both 2020 and 2021. High levels of consumer confidence combined with wage inflation and support industrial demand. Cyclical demand is further bolstered by structural forces that continue to increase logistics needs: the sustained growth of eCommerce and the competition to deliver goods to end-users at an accelerated pace. For the entire region, eCommerce spending will continue to increase at multiple times the rate of overall spending: Statista’s Digital Market Outlook calls for nearly 30% growth in North American online sales from 2019 to 2021.1 There is no doubt that increasing space needs associated with online sales (including those that are “Business-to-Business” (B2B)) will continue to put pressure occupancy and rent growth levels across North America.
Given the strong outlook for logistics demand, labor availability is an increasingly important factor in shaping and often limiting the ability of occupiers to expand
4 / CUSHMAN & WAKEFIELD
2020 NORTH AMERICAN INDUSTRIAL OUTLOOK

NORTH AMERICAN INDUSTRIAL OUTLOOK 2020 / 5
capacity. Labor markets in North America are tight—and getting tighter. Finding available and appropriately skilled warehouse labor at modest wages will remain a challenge during 2020 and 2021. Labor typically accounts for 50% or more of traditional warehouse operating costs, so the relationship between labor supply and location is an important factor. As headcounts in modern fulfillment centers rise, local labor market conditions will increasingly be prioritized in site selection. Occupiers will look and compete for sites with sufficient labor supply to keep headcounts at sustainable levels.
Over the next decade, total population growth across the continent is expected to slow as the populace ages, particularly in Canada and the U.S. This will increase the importance of immigration in both countries as an avenue to augment the workforce. Mexico City, New York, Los Angeles, Chicago, Miami, Atlanta, Toronto, Dallas, Philadelphia and Houston will remain the most populated North American cities in 2020. Given the trend toward urban and suburban densification, distribution markets that support the flow of goods to the largest cities and primary industrial markets2 will benefit from their proximity. Examples include Phoenix, Central and Northern New Jersey and the Pennsylvania I-81/I-78 Distribution Corridor. The fastest population growth is projected to occur in certain secondary U.S. and Canadian cities
2 Primary industrial markets include Atlanta, Chicago, Dallas/Fort Worth, Inland Empire, Los Angeles, New Jersey and the Pennsylvania I-81/I-78 Distribution Corridor.
including Orlando, Raleigh, Austin, Las Vegas, Calgary, Phoenix, Atlanta, Charlotte, and Edmonton. These cities’ populations will grow nearly three times faster than that of the average North American city. As these cities’ populations increase, so will demand for industrial real estate.
Does the Market Still Want More Space? The forecast for North American industrial absorption in 2020-2021 is a healthy 459.9 msf. New supply—which finally surpassed demand in 2019—will continue to do so over the next two years. Supply levels are projected to reach 573.4 msf of new industrial product from 2020 to 2021. Nonetheless, North American vacancy will remain anchored around the 5% mark, ending 2021 at 5.2%—an increase of 60 basis points (bps) over year-end 2019. Despite the forecasted uptick, North American vacancy will remain 100 bps below the 10-year average of 6.2% (2011-2021). Average net asking rents are expected to increase by 6.8%—from USD $6.51 psf at year-end 2019 to USD $6.95 psf at year-end 2021. Natural supply-side constraints, such as onerous municipal approval processes, will continue to contain supply side growth in Canada where overall net rents will remain the highest in North America at USD $8.07 psf.
Economic growth, global trade and the continued buildout of eCommerce, third-party logistics (3PL) last-mile facilities,

NORTH AMERICAN INDUSTRIAL OUTLOOK 2020
6 / CUSHMAN & WAKEFIELD
1 Dallas/Ft. Worth, TX 45.1
2 Inland Empire, CA 42.2
3 Atlanta, GA 30.1
4 Chicago, IL 27.1
5PA I-81/I-78 Corridor, PA 21.3
NORTH AMERICA AS A % OF INVENTORY
Source: The CoStar Group (for select markets only), Cushman & Wakefield Research
fulfillment centers and bulk warehouses will buttress demand for industrial real estate. For a seventh consecutive year, net absorption in the U.S. will eclipse 200 msf in 2020; we anticipate this streak will extend through 2021. In Canada, industrial markets will continue their longest uninterrupted period of positive net absorption. Canadian industrial markets are forecast to register 35.9 msf of net absorption in 2020-2021. Toronto and Vancouver are expected to account for over 63% of Canadian occupancy growth, but Montreal will experience the fastest growth relative to its existing inventory over the same period.
New leasing activity in Mexico City continues to be strong. But with one of the lowest vacancy rates among North American markets in 2019, it will be difficult to register strong occupancy gains absent new construction deliveries coming to
-1.5%
-1.0%
-0.5%
0.0%
0.5%
1.0%
1.5%
2.0%
2.5%
3.0%
3.5%
2007 2008 2009 2010 2011 2012 2013 2014 2015 2016 2017 2018 2019F 2020F 2021F
Absorption as % of Inventory Deliveries as a % of Inventory
NET ABSORPTION (MSF)2020-2021
RANK MARKET MSF
TOP 5 MARKETS FOR DEMAND

NORTH AMERICAN INDUSTRIAL OUTLOOK 2020 / 7
market. This is also true for the other main industrial markets in Mexico such as Monterrey, Tijuana and Ciudad Juarez which had significant decreases in availability rates throughout 2019.
Mexico will benefit from the completion of the U.S.-Mexico-Canada Agreement (USMCA). negotiations. This trade agreement will replace the North American Free Trade Agreement (NAFTA) and includes many updates that will bring certainty to trade across the three countries. It upholds the previous focus to develop North American chain values that help the entire region compete against the rest of the world. For Mexico, stricter rules will translate into a more specialized role for its automotive and home appliances industries. At the same time, those rules will also bring an upside for electronics, medical devices and aerospace supply chains in which China has been an important competitor. Under the new rules, Mexico is likely to gain a significant edge. Still, there are signs that many Asian firms are developing plans to increase their investments in Mexico in order to stay competitive in the North American market.
Also, the peak of a demographic bonus will take place in the coming years for Mexico. Paired with many USMCA labor provisions, this could help increase real wages in Mexico. The combination of increased trade, strong working age population growth and rising real wages will drive relevant growth in logistics activity. In contrast to the U.S. where supply surpassed demand in 2019, Mexico City and some border cities such as Tijuana and Ciudad Juarez will remain undersupplied. Over the next two years, Mexico City’s net absorption is forecast to total 6.5 msf and 7.6 msf in new deliveries. In Canadian markets, supply only just passed demand in 2019 due to new supply in the Toronto market. Major markets in Canada will also remain undersupplied in the coming years.
Keep an Eye on SupplyNorth American industrial markets are expected to deliver approximately 573.4 msf of new product by year-end 2021. Over 90% of the space delivered will be in the U.S. where the market has been strapped for quality product over the past few years. With record low vacancy rates and strong demand, the development pipeline will remain elevated in primary industrial markets, port-proximate markets (both intermodal and maritime) and in markets with dense or fast-growing populations. Up until Q1 2019, supply had not outpaced demand; but this trend has started to change, and investors have begun to question whether the U.S. is entering a period of overbuilding while Canadian markets and Mexico City remain stable.
The short answer is no, at least through 2020. The amount of space that has been under construction in North America exceeded 330 msf throughout 2019—the largest amount of space ever under construction, and the majority of the space was in the U.S. The amount of space that is speculative, however, is significantly less than in 2007-2008. Consequently, although more
TOP 5 MARKETS FOR SUPPLYDELIVERIES (MSF)2020-2021
1 Dallas/Ft. Worth, TX 46.3
2 Inland Empire CA 45.7
3 Atlanta, GA 34.9
4 Chicago, IL 32.3
5PA I-81/I-78 Corridor, PA 26.5
RANK MARKET MSF

NORTH AMERICAN INDUSTRIAL OUTLOOK 2019
supply is being delivered than ever before, less of that space is speculative as a percent of total construction deliveries.
North American demand is expected to trail supply by about 54.2 msf in 2021, causing vacancy rates to rise modestly from their current record low levels. Mexico City will see a 70-bps bump in vacancy from 2019 to year-end 2021, bringing the rate to 3.4%— still among historic lows for the city. Canadian markets will see a 60-bps increase in vacancy due to their more- robust pipeline of 43.6 msf that is expected to deliver over the next two years. Vacancy in the U.S. will be between these two rates, with a 60-bps increase from 2019 ending 2021 at 5.4% after bringing 522.3 msf of industrial space to market from 2020 to year-end 2021. Most markets across the three countries are still starved for quality space, and as more supply enters the market, rental rates are expected to continue increasing albeit at a slightly slower pace. With more options to choose from, tenants can afford to be a bit more selective about where they choose to
occupy, forcing landlords to slow increases in rental rates to remain competitive.
Rents Will Reach New HighsNorth American industrial asking rents are expected to increase by 6.8% and reach a new nominal high of USD $6.95 psf by year-end 2021—up from USD $6.51 psf in 2019. Across North American industrial markets, seven markets are forecast to register more than 10% rent growth from 2020 to 2021, with the top three being Canadian: Toronto (27.9%), Montreal (25.0%) Vancouver (21.9%), Las Vegas and Ottawa (12.1%), Providence (11.1%) and Boston (10.4%). All but four markets tracked for this report will see positive rent growth through 2021. Other North American cities that will post some of the strongest rent growth will be those with the highest demand such as Dallas/Fort Worth, Inland Empire, Atlanta, Chicago, PA I/80-I-78 Distribution Corridor, Indianapolis and Central New Jersey. But also expect to see higher rents among supply constrained markets, especially those close to ports (both inland and maritime) such as Los
NORTH AMERICAN SUPPLY AND DEMAND
8 / CUSHMAN & WAKEFIELD
0.0%
2.0%
4.0%
6.0%
8.0%
10.0%
12.0%
-200
-100
0
100
200
300
400
New Supply (MSF) Net Absorption (MSF) Vacancy (%)
Source: Cushman & Wakefield Research
MSF
Angeles, Seattle, San Francisco Peninsula and Orange County. The markets being fed by the West and East Coast ports or the intermodal hubs in the middle of the country are where U.S. rent growth will be strongest.
ECONOMYGlobal growth downshifts, but economy remains in “Drive”
As the world faces the new decade, eyes will be on policy developments—fiscal, monetary and trade—as well as on the health of consumers, the key pillar of the economic engine moving forward. Both global and North American economic growth moderated in 2019, and more moderation in North America expected in 2020. But headline figures mask important underlying trends. The production economy has weakened whereas the services economy has remained largely intact. Notably, with
3 Source: IMF World Economic Outlook (October 2019): https://www.imf.org/en/Publications/WEO/Issues/2019/10/01/world-econom-ic-outlook-october-2019
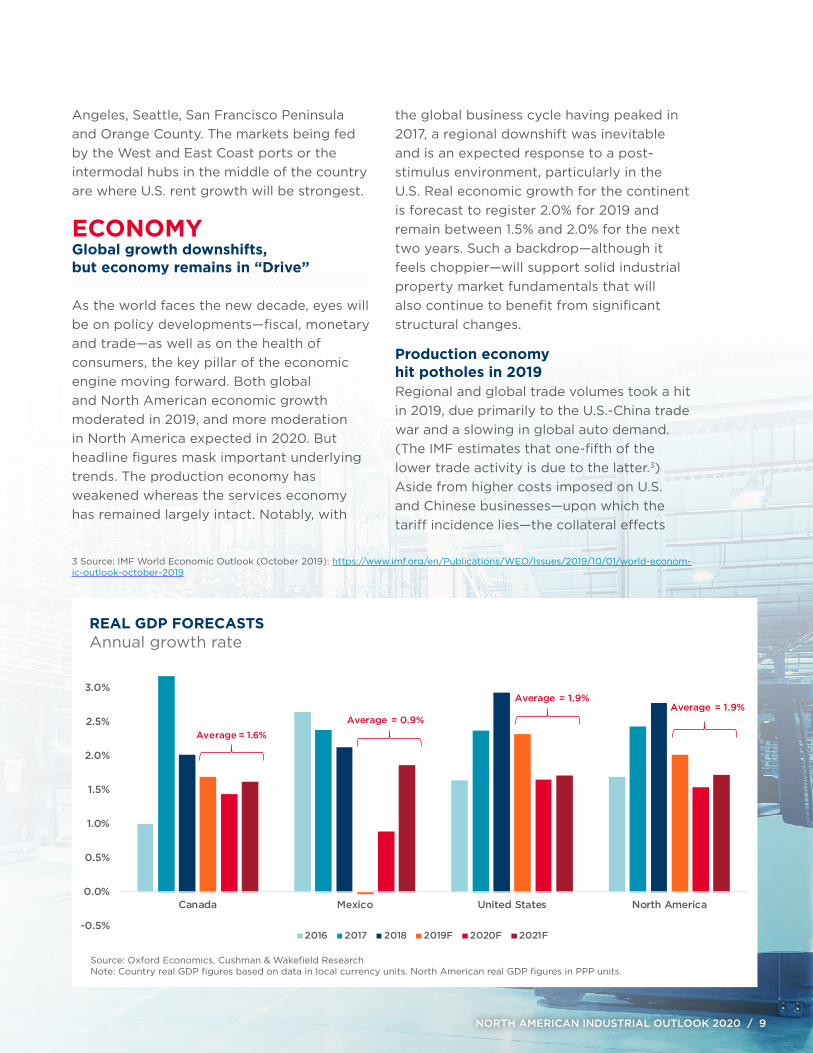
the global business cycle having peaked in 2017, a regional downshift was inevitable and is an expected response to a post-stimulus environment, particularly in the U.S. Real economic growth for the continent is forecast to register 2.0% for 2019 and remain between 1.5% and 2.0% for the next two years. Such a backdrop—although it feels choppier—will support solid industrial property market fundamentals that will also continue to benefit from significant structural changes.
Production economy hit potholes in 2019Regional and global trade volumes took a hit in 2019, due primarily to the U.S.-China trade war and a slowing in global auto demand. (The IMF estimates that one-fifth of the lower trade activity is due to the latter.3) Aside from higher costs imposed on U.S. and Chinese businesses—upon which the tariff incidence lies—the collateral effects
REAL GDP FORECASTSAnnual growth rate
-0.5%
0.0%
0.5%
1.0%
1.5%
2.0%
2.5%
3.0%
3.5%
Canada Mexico United States North America
2016 2017 2018 2019F 2020F 2021F
Average = 0.9%
Average = 1.9%Average = 1.9%
Source: Oxford Economics, Cushman & Wakefield ResearchNote: Country real GDP figures based on data in local currency units. North American real GDP figures in PPP units.
NORTH AMERICAN INDUSTRIAL OUTLOOK 2020 / 9
Average = 1.6%
-0.5%
0.0%
0.5%
1.0%
1.5%
2.0%
2.5%
3.0%
3.5%
Canada Mexico United States North America
2016 2017 2018 2019F 2020F 2021F
Average = 0.9%
Average = 1.9%Average = 1.9%

NORTH AMERICAN INDUSTRIAL OUTLOOK 2020
10 / CUSHMAN & WAKEFIELD
have manifested themselves in the form of elevated levels of uncertainty. Manufacturing, linked to exports, and investment therefore weakened throughout 2019, with few countries immune.
An increasing number of industries have pulled back on investment as they transition to “wait and see” mode. But in North America, the reasons extend beyond trade tensions and less rosy global conditions. In Mexico, a new government regime imposed fiscal austerity. That action contributed to the country’s deteriorating sentiment and general stagnation in 2019 and, importantly, the declines registered in fixed investment. (Combined with a pullback in federal spending, this led the country into a brief technical recession in the first half of 2019). In Canada and the U.S., small businesses and manufacturers lack confidence in future economic conditions, be they good or bad, and CEOs in general are reporting lower capital spending plans and lower levels of optimism. For both these countries, slower
global momentum has contributed to less investment in capital and equipment. Higher home prices, and in Canada household indebtedness, have prevented residential investment from being a major source of growth. In the U.S., an upcoming presidential election may cause firms to postpone decision-making given the divergent candidate positions.
But, early indications suggest smoother roads lie aheadThese trends should prove temporary as the North American production economy slowly rebounds over the next two years—with 2020 largely a transition year. Some PMI global data has begun to improve and some positive strides have been made on trade. Nominal and real trade volumes are generally expected to be flat this year before accelerating in 2021 amid an improving global backdrop and greater levels of policy certainty. This should support greater investment in capital and industrial equipment which are key pillars of the region’s manufacturing base. Less clear
BUSINESS CONFIDENCE DOWNSurvey of Business Confidence: Total (Diffusion Index, NSA)
-40
-30
-20
-10
0
10
20
30
40
50
60
200
3
200
3
200
3
200
4
200
4
200
5
200
5
200
6
200
6
200
7
200
7
200
8
200
8
200
9
200
9
200
9
2010
2010
2011
2011
2012
2012
2013
2013
2014
2014
2014
2015
2015
2016
2016
2017
2017
2018
2018
2019
2019
Global Business Confidence North American Business Confidence
U.S.-China trade war
begins
Great Recession
Source: Moody’s Analytics

NORTH AMERICAN INDUSTRIAL OUTLOOK 2020 / 11
is the outlook for auto demand which continues to face regulatory and other policy changes abroad; however, Oxford Economics is calling for continued growth in auto sales4—both in North America and China (the largest auto market in the world).
Consumers remain the fuel of the economic engineThe divergence between the production and services economies has emerged as a central reason why thriving labor markets may translate into different stories across the North American landscape. The good news is that all three countries have had unemployment rates below levels associated with full employment since the start of 2018 and labor markets are expected to remain tight over the coming years. From 2011 through 2018, 28 million more North Americans became employed and job growth is expected to hit 3.2 million in 2019. Oxford Economics anticipates another 2.3 million payroll gains in the region over the next two years, with a slower pace of growth attributed mainly to a lack of available workers.
Generally tight labor markets are good news for consumers. Wage growth, which has accelerated in Canada and Mexico in 2019 and remained anchored, but hovering at 3%, in the U.S. bodes well for consumer spending. This is particularly true for Canada and the U.S.—which together possess 90% of the region’s spending power—when paired with consumer confidence. But because some of the income gains in Canada will be directed to debt repayment and Mexico’s consumers are less confident (and therefore will also tend to save more and spend less), the additional impetus to consumer demand in these countries will be restrained. In the U.S., real consumer spending is likely to moderate slightly to a 2.5% to 3% growth rate range over the coming two years.
4 Source: Oxford Economics, based on PPP exchange rates, constant 2015-dollar terms.
TRENDS TO WATCH
INDUSTRIAL MARKETNew leasing activity will be driven in large part by leasing among traditional and online retailers as well as 3PL logistics providers as consumers demand for goods at a grander and faster scale.
In contrast to the previous nine years during which U.S. industrial demand outpaced supply, new supply will outpace overall demand. New supply will place upward pressure on headline vacancy with the rate rising 10-to-20 basis points, providing much needed quality space to the market
Some of the hottest and most talked about facilities types in the industrial world will include: cold-storage facilities, in-fill/last mile facilities, and multistory warehouses

12 / CUSHMAN & WAKEFIELD
Global synchronized easing beginsWhile the political environment has weighed on Mexican consumer sentiment, the sluggish pace of the Mexican economy in 2019 has allowed high levels of inflation to dissipate, creating space for the country’s central bank—Banxico—to ease monetary conditions further. Indeed, Banxico isn’t alone: most major central banks around the world are now using accommodative monetary policy. Both Banxico and the Federal Reserve’s Federal Open Market Committee (FOMC) lowered target overnight rates multiple times in 2019, with the main difference being that Banxico’s current rate of 7.25% is still restrictive. This is likely to remain the case, although many expect that Banxico will ease monetary policy further over the next two years. In the U.S., the FOMC has indicated it may enter a “pause” period and tolerate inflation more patiently than during its recent tightening cycle. The Bank of Canada, despite seeing pockets of weakness in the Canadian economy, has held its target rate at 1.75% since the end of 2018 but has leaned more dovish in recent meetings. With significant tightening in policy off the table for the near term and global pressure from negative rates in Japan and Europe, the cost of capital should remain anchored and favorable across the U.S. and Canada. In turn, this will be largely supportive of real estate investment.
The pivot in monetary policy reflects the transition from global synchronized growth in 2017 to a global synchronized slowdown in 2019. This was precipitated by the reemergence of downside risks, with the U.S.-China trade war considered the largest by the National Association of Business Economists.5 Indeed, the IMF estimates that the U.S.-China trade war has already lowered global real GDP growth by 80 bps, with 2019 slated to be the slowest year of the global business cycle, growing at 3%.6
5 Source: National Association of Business Economics, December 2019 Outlook Survey6 Source: IMF World Economic Outlook (October 2019): https://www.imf.org/en/Publications/WEO/Issues/2019/10/01/world-economic-outlook-october-2019
TRENDS TO WATCH
ECONOMYGlobal synchronized central bank easing is likely to continue in early 2019. Expect the Fed to “pause”, Banxico to further ease, and the Bank of Canada to lean dovish (but remain cautious of rate cuts do to high residential prices and debt).
Volatility will return as financial market adjust to a slower pace of growth and other news, such as those associated with Mexico’s structural reform and, the U.S. presidential election and other ongoing trade negotiations.

NORTH AMERICAN INDUSTRIAL OUTLOOK 2019 / 13
AVERAGE TARIFF RATES
0
5
10
15
20
25
Jan-
18
Feb
-18
Mar
-18
Apr
-18
May
-18
Jun-
18
Jul-
18
Aug
-18
Sep
-18
Oct
-18
Nov
-18
Dec
-18
Jan-
19
Feb
-19
Mar
-19
Apr
-19
May
-19
Jun-
19
Jul-
19
Aug
-19
Sep
-19
Oct
-19
Nov
-19
Dec
-19
Jan-
20
Feb
-20
China's tariff on U.S. exports U.S. tariff on Chinese exports
Source: Peterson Institute for International Economics Note: Tariff rates shown are those at the end of each respective month. In some cases, average tariffs rates varied throughout a given month.
TRADE Trade uncertainty is almost certainTrade policy remains the most fluid aspect of the near-term outlook. Positive developments that emerged towards the end of 2019 included the progress of ratification of USMCA7 in the U.S. Congress and the agreement on a Phase One deal between the U.S. and China. Still, since early 2018, trade disputes have created significant disruption for firms relying on global markets for the production or final sale of goods. For example, prior to the U.S.-China trade war, less than 1% of Chinese exports to the U.S. were targeted with tariffs, and the average tariff on those goods was 3.1%.8 By year-end 2019, nearly two-thirds of Chinese exports to the U.S. were subject to tariffs and the
7 See Cushman & Wakefield’s 2019 North American Industrial Outlook for a high-level overview of the agreements: http://www.cush-manwakefield.us/en/research-and-insight/2019/northamerican-industrialoutlook8 Source: Peterson Institute for International Economics, https://www.piie.com/blogs/trade-and-investment-policy-watch/phase-one-china-deal-steep-tariffs-are-new-normal
average tariff rate was just under 21%. Not surprisingly, bilateral trade flows between the two countries have slowed significantly. According to the IMF, exports from China to the U.S. from January to August 2019 are down by 19.5% and 27.4% compared to the same timeframe in 2017 and 2018, respectively: exports from the U.S. to China are down by 12.5% and 16%, respectively.
Greater uncertainty, slowing global growth, and increased protectionism have contributed have contributed to a worldwide pullback in trade, with investment—particularly in intermediate and capital goods, which tend to be heavily traded—also muted. According to the CPB World Trade Monitor, global trade volumes declined on a year-over-year basis for most of 2019, although to a much lesser extent than

NORTH AMERICAN INDUSTRIAL OUTLOOK 2020
14 / CUSHMAN & WAKEFIELD
bilateral U.S.-China flows. Ultimately, goods flow through various forms of transportation and warehouse/distribution facilities. Some build-up of inventories prior to tariff implementation helped to blunt the impact so far, but more caution and, in some cases, higher prices are likely to dampen net new demand for some types of occupiers in the near-term. The Phase One deal between the U.S. and China reached in December 2019 and signed in January 2020 is a promising development although it lessened only some tariffs (largely on consumer goods). It is unlikely that existing tariffs (largely on capital and industrial equipment and intermediate goods) will be removed entirely any time soon since they are largely viewed as leverage for future negotiations.9 A partial offset to the effects of the U.S.-China
9 For more detail, see Cushman & Wakefield’s Instant Insights: http://www.cushmanwakefield.us/en/research-and-insight/2019/us-chi-na-trade-war-update
trade war is that the IMF anticipates global economic growth to accelerate in 2020-2021, and with it, the World Trade Organization forecasts an uptick in trade flows.
Within North America, USMCA has made some progress. Having been ratified by each country’s president in November 2018 and by the Mexican Congress in June 2019, the U.S. House of Representatives passed a modified version in December 2019. The U.S. Senate passed that bill in January 2020 and President Trump signed it shortly thereafter. Its changes were focused mainly on enforcement mechanisms of the treaty’s provisions (e.g., labor and environmental standards). It is anticipated that Canada and Mexico—which will need to ratify the modifications—will approve it in the coming
WORLD TRADE ACTIVITY (YR/YR % CHANGE)Trade Volume Index (2010=100)
Source: CPB World Trade Monitor
-20
-15
-10
-5
0
5
10
15
20
Jan-
01
Aug
-01
Mar
-02
Oct
-02
May
-03
Dec
-03
Jul-
04
Feb
-05
Sep
-05
Apr
-06
Nov
-06
Jun-
07
Jan-
08
Aug
-08
Mar
-09
Oct
-09
May
-10
Dec
-10
Jul-
11
Feb
-12
Sep
-12
Apr
-13
Nov
-13
Jun-
14
Jan-
15
Aug
-15
Mar
-16
Oct
-16
May
-17
Dec
-17
Jul-
18
Feb
-19
Sep
-19
Trade Volume Index (Yr/Yr % Change)

NORTH AMERICAN INDUSTRIAL OUTLOOK 2020 / 15
months. USMCA is largely viewed as having bipartisan support and few truly fundamental changes when compared to NAFTA. However, when and if the modernized deal becomes law, investors and firms will have greater levels of certainty, particularly in Mexico and Canada whose economies are much more export-oriented.
Despite the bumps in the road associated with trade, industrial real estate markets have remained extremely tight, even the face of somewhat softer demand. This caveat is important because the fundamentals will continue to support an investor-favorable atmosphere, especially for those focused on the long-term structural advantages industrial assets will provide.
CAPITAL MARKETSINDUSTRIAL INVESTORS: WHOLE LOTTA LOVEBroad-based, rising demand for industrial assetsIndustrial has been investors’ darling in recent years, and there is no indication of this love affair coming to an end any time soon. According to the 2020 PwC/ULI Emerging Trends in Real Estate survey report, industrial remains the most attractive property type both for investment and development.10 In particular, more than half of respondents to the PwC/ULI survey recommend further acquisitions of fulfillment properties.11
Investors have backed up their reported sentiment with their dollars. In 2019, industrial transactions constituted 18.7% of total U.S. transaction activity—up from just 9.8% in 2014, before the current industrial boom began, and 11.2% in 2008, the peak of the previous cycle. Industrial appetite has increased across investor groups, most notably institutional and public vehicle investors.
10 PWC Emerging Trends in Real Estate 2020, pg. 48 11 Ibid., pg 50
TRENDS TO WATCH
TRADEThe U.S. Congress, Canadian Parliament and Mexican Congress are likely to ratify the USMCA agreement in early 2020, formally replacing NAFTA for the first time in 25 years.
Although President Trump and China are likely to continue negotiations, elevated uncertainty is expected to persist. With key issues unresolved, a Phase Two deal may remain elusive.
A major regulatory change to the shipping industry—called IMO1 2020—will elevate uncertainty for the industry this year. Low sulfur energy prices could rise (even sharply) and other techniques to meet the standards may present additional hurdles for global trade flows.
1 International Maritime Organization

NORTH AMERICAN INDUSTRIAL OUTLOOK 2020
16 / CUSHMAN & WAKEFIELD
Momentum remained strong in 2019. Transaction volume increased 17% year-over-year (YoY), driven by a growing single-asset transaction market (+15% YoY) and record portfolio sales (+147% YoY).
Transaction activity was strongest for warehouse product ($77B / +13% YoY) but flex product sales ($24B / +36% YoY) increased the most proportionally. Within the warehouse segment, large (over 500,000 sf) and medium (100,000-to-300,000 sf) facilities continued to make up the majority of sales. Nonetheless, volumes increased across size segments. The strongest relative growth lay at the extremes of size distribution: sales of assets under 50,000 sf (typically urban in-fill distribution facilities) rose 23% YoY while large warehouse sales (over 500,000 sf) rose 16%.
Liquidity continued to grow across market tiers. Gateway metros continued to attract a significant share (40%) of transaction activity; however, liquidity was even greater in the secondary markets for a second year in a row, reflecting investors’ willingness to explore new markets in search of industrial opportunities. There were no losers in this competition as volumes increased across market tiers in the first three quarters of 2019.
Over the next several years, we expect underlying industrial market liquidity to continue to grow. Single-asset sales should continue to increase, although we expect some moderation from the 2015-2019 third-quarter average annual growth rate of 11.8% to decline to a range of 5.0% to 8.0% in 2020-2021. The precise level of transaction activity will depend on the number of large portfolio and M&A deals, which is inherently volatile. The combination of a highly competitive acquisition market and the desire of large capital groups to quickly
TRENDS TO WATCH
CAPITAL MARKETSThe focus on smaller, urban distribution facilities as well as large, modern logistics facilities, particularly in major and top secondary markets will continue.
There are some tactical opportunities in Class B product which is benefiting from extremely tight market conditions, but this product is also at most risk when new supply delivers.
If the economic expansion continues, then expect more elevated returns, and if the economy softens, then there should be at best modest adjustment to cap rates and operating fundamentals as a result of the strong secular tailwinds underlying the asset class.

NORTH AMERICAN INDUSTRIAL OUTLOOK 2020 / 17
add scale to their industrial portfolios has supported large portfolio acquisitions (e.g., Blackstone-GLP) and M&A (e.g., Prologis-Liberty Property Trust) over the last several years, and we expect this to continue albeit not indefinitely as the extent of consolidation must hit a wall at some point.
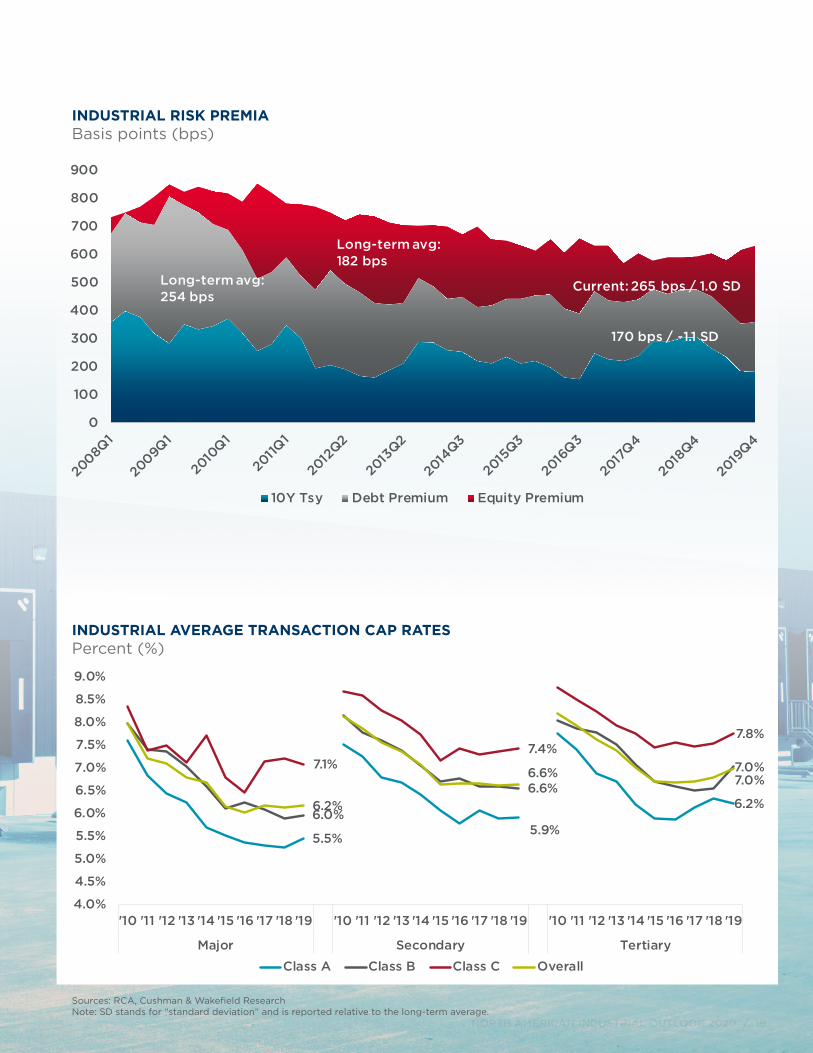
Cap Rates at all-time lows, but spreads remain attractiveStrong investor demand has combined with red hot fundamentals, particularly NOI growth, to drive cap rates to record lows. During the previous cycle, industrial cap rates bottomed at 7.0% in 2006 based on national transaction data from Real Capital Analytics. During the Great Recession, cap rates peaked at 8.4% in 2009. Since then, cap rates have compressed 222 bps to just 6.2%. The decline in cap rates has been broad-based across market tier, class and product subtypes. Within the warehouse
segment, the largest facilities (over 500,000 sf) and the smallest (under 50,000 sf) are trading at the lowest yields. Cap rates are even lower than the figures suggest in capacity-constrained markets such as Los Angeles, New York/Northern New Jersey, San Francisco, Seattle and Miami.
While cap rates are low relative to history, they remain attractive to investors. Considering that vacancy is unlikely to rise meaningfully even in the event of economic softening due to the secular demand from demographics and changing consumer habits, low rates are even more attractive on a risk-adjusted basis. Moreover, interest rates declined significantly in 2019, and this has translated into lower financing costs. Accordingly, while cap rates are at all-time lows, the excess yield that investors earn after subtracting financing costs was 273 bps as of Q4 2019—89 bps above the
INDUSTRIAL SHARE OF ACQUISITION ACTIVITYPercent of total (%)
Source: RCA, Cushman & Wakefield Research
11%9%
13%11% 12%
31%
9%7%
19%
5% 5%
14%
11%10%
19%
2008 2014 2019 2008 2014 2019 2008 2014 2019 2008 2014 2019 2008 2014 2019
Private Institutional Public Foreign Overall

NORTH AMERICAN INDUSTRIAL OUTLOOK 2020
18 / CUSHMAN & WAKEFIELD
long-term average. The last time the equity premium was this high was late-2014—near the beginning of the current industrial investment boom. We expect this to sustain current low cap rates but see further broad-based cap rate compression as unlikely. However, there could be some pockets of compression in select secondary markets with strong demographics and higher yields compared to the major industrial markets.
Industrial is the top-performing asset class, and it will remain soIndustrial has been the top performing asset class for several years running—and there are no indications of a slowdown. Since 2010, quarterly industrial total returns have averaged 12.9% annualized compared to 9.7% for non-industrial product types,
according to NCREIF data. Warehouse returns have been and continue to be even stronger. Returns have been strong across market tiers compared to other property types, but over the course of the current cycle, the gateway metros have distinctly outperformed other markets with a cumulative total return of 250% since 2010 compared to 198% for secondary markets.
Industrial will continue to offer investors a “heads I win, tails I win” exposure for their portfolios. If the economic expansion continues, expect more elevated returns; if the economy softens, there should be, at best, modest adjustment to cap rates and operating fundamentals as a result of the strong secular tailwinds underlying the asset class.
NORTH AMERICAN INDUSTRIAL OUTLOOK 2020 / 19
INDUSTRIAL RISK PREMIABasis points (bps)
INDUSTRIAL AVERAGE TRANSACTION CAP RATESPercent (%)
Sources: RCA, Cushman & Wakefield Research Note: SD stands for “standard deviation” and is reported relative to the long-term average.
5.5%5.9%
6.2%6.0%
6.6%
7.0%7.1%7.4%
7.8%
6.2%
6.6% 7.0%
4.0%
4.5%
5.0%
5.5%
6.0%
6.5%
7.0%
7.5%
8.0%
8.5%
9.0%
'10 '11 '12 '13 '14 '15 '16 '17 '18 '19 '10 '11 '12 '13 '14 '15 '16 '17 '18 '19 '10 '11 '12 '13 '14 '15 '16 '17 '18 '19
Major Secondary Tertiary
Class A Class B Class C Overall
0
100
200
300
400
500
600
700
800
900
10Y Tsy Debt Premium Equity Premium
170 bps / -1.1 SD
Current: 265 bps / 1.0 SD
Long-term avg:182 bps
Long-term avg:254 bps

TOP 50 MARKETS FOR SUPPLYDELIVERIES (MSF)2020-2021
INDEX
20 / CUSHMAN & WAKEFIELD
Source: Cushman & Wakefield Research, The CoStar Group
*2020-2021 figures are derived from CoStar’s forecasts.
1 Dallas/Ft. Worth, TX 46.3
2 Inland Empire, CA 45.7
3 Atlanta, GA 34.9
4 Chicago, IL 32.3
5 PA I81/I78 Corridor, PA 26.5
6 Indianapolis, IN 20.0
7 Toronto, ON 19.6
8 Houston, TX 14.6
9 Columbus, OH* 13.8
10 Central NJ 13.7
11 Memphis, TN* 12.5
12 Phoenix, AZ 12.2
13 Kansas City, MO 11.4
14 Vancouver, BC 11.3
15 St. Louis, MO 11.0
16 Cincinnati, OH* 11.0
17 Charlotte, NC 8.8
18 Baltimore, MD 8.4
19 Las Vegas, NV* 8.4
20 Savannah, GA* 8.0
21 Louisville, KY* 8.0
22 Mexico City, MX 7.6
23 Denver, CO 7.6
24 Los Angeles, CA 6.1
25 Silicon Valley, CA 5.9
26 Northern NJ 5.8
27 Nashville, TN 4.4
28 Detroit, MI* 4.4
29 Montreal, QC 4.3
30 Richmond, VA* 4.2
31 Charleston, SC* 4.0
32 Greenville, SC* 3.8
33 Salt Lake City, UT* 3.6
34 Tampa, FL 3.5
35 Philadelphia, PA 3.4
36 Fort Lauderdale, FL 3.4
37 Reno, NV* 3.3
38 Central Valley, CA* 3.1
39 Calgary, AB 3.1
40 Minneapolis, MN 3.0
41 Orlando, FL 2.5
42 Sacramento, CA 2.4
43 Edmonton, AB 2.4
44 Oakland, CA 2.2
45 San Diego, CA 2.2
46 Seattle, WA 1.8
47 Jacksonville, FL 1.7
48 Milwaukee, WI* 1.7
49 Miami, FL 1.7
50 Portland, OR 1.5
RANK MARKET MSF RANK MARKET MSF

Source: Cushman & Wakefield Research, The CoStar Group
*2020-2021 figures are derived from CoStar’s forecasts.
1 Dallas/Ft. Worth, TX 45.1
2 Inland Empire, CA 42.2
3 Atlanta, GA 30.1
4 Chicago, IL 27.1
5 PA I81/I78 Corridor, PA 21.3
6 Indianapolis, IN 15.3
7 Central NJ 13.2
8 Houston, TX 12.7
9 Toronto, ON 12.6
10 Vancouver, BC 10.2
11 Los Angeles, CA 9.7
12 Kansas City, MO 9.1
13 Memphis, TN* 8.4
14 Columbus, OH* 8.2
15 Montreal, QC 8.1
16 Savannah, GA* 7.1
17 Mexico City, MX 6.5
18 Phoenix, AZ 5.9
19 Charleston, SC* 5.7
20 Charlotte, NC 5.6
21 Las Vegas, NV* 5.5
22 Louisville, KY* 5.5
23 Reno, NV* 5.0
24 Cincinnati, OH* 4.6
25 Northern NJ 4.5
26 Baltimore, MD 4.0
27 Seattle, WA 3.8
28 Greenville, SC* 3.7
29 Denver, CO 3.7
30 Nashville, TN 3.6
31 Central Valley, CA* 3.5
32 Tampa, FL 3.5
33 Minneapolis, MN 3.5
34 St. Louis, MO 3.4
35 Philadelphia, PA 3.3
36 Fort Lauderdale, FL 3.2
37 Silicon Valley, CA 3.2
38 Sacramento, CA 2.8
39 Richmond, VA* 2.6
40 Edmonton, AB 2.6
41 Orlando, FL 2.5
42 Calgary, AB 2.4
43 Detroit, MI* 2.3
44 Salt Lake City, UT* 2.2
45 Jacksonville, FL 2.0
46 Lakeland, FL* 2.0
47 Tulsa, OK* 1.8
48 San Francisco Peninsula, CA 1.8
49 Oakland, CA 1.8
50 Orange County, CA 1.5
NORTH AMERICAN INDUSTRIAL OUTLOOK 2019 / 21
RANK MARKET MSF RANK MARKET MSF
TOP 50 MARKETS FOR DEMANDNET ABSORPTION (MSF)2020-2021

TOP 50 MARKETS FOR RELATIVE DEMAND & SUPPLYDELIVERIES AS % OF INVENTORY
1 Savannah, GA* 12.3%
2 PA I81/I78 Corridor, PA 8.7%
3 Inland Empire, CA 7.9%
4 Indianapolis, IN 7.2%
5 Las Vegas, NV* 7.1%
6 Mexico City, MX 6.6%
7 Charleston, SC* 6.1%
8 Dallas/Ft. Worth, TX 6.0%
9 Lakeland, FL* 5.6%
10 Atlanta, GA 5.5%
11 Tampa, FL 5.4%
12 Columbus, OH* 5.3%
13 Vancouver, BC 5.2%
14 Richmond, VA* 5.2%
15 Kansas City, MO 5.0%
16 Memphis, TN* 5.0%
17 Louisville, KY* 4.8%
18 Fort Lauderdale, FL 4.5%
19 Charlotte, NC 4.5%
20 Reno, NV* 4.4%
21 St. Louis, MO 4.4%
22 Baltimore, MD 3.9%
23 Central NJ 3.9%
24 Cincinnati, OH* 3.7%
25 Phoenix, AZ 3.7%
26 Raleigh/Durham, NC* 3.6%
27 Tulsa, OK* 3.5%
28 Minneapolis, MN 3.5%
29 San Francisco Peninsula, CA 3.4%
30 SF North Bay, CA* 3.3%
31 Houston, TX 3.2%
32 Salt Lake City, UT* 3.2%
33 Calgary, AB 3.1%
34 Denver, CO 3.0%
35 Austin, TX* 3.0%
36 Central Valley, CA* 3.0%
37 Orlando, FL 2.8%
38 Philadelphia, PA 2.8%
39 DC Suburbs, VA* 2.8%
40 Chicago, IL 2.6%
41 Edmonton, AB 2.5%
42 Nashville, TN 2.5%
43 San Antonio, TX* 2.5%
44 Toronto, ON 2.5%
45 Sacramento, CA 2.5%
46 Jacksonville, FL 2.3%
47 Silicon Valley, CA 2.3%
48 Fort Myers/Naples, FL* 2.3%
49 Greenville, SC* 2.2%
50 Northern NJ 2.0%
INDEX
22 / CUSHMAN & WAKEFIELD
Source: Cushman & Wakefield Research, The CoStar Group
*2020-2021 figures are derived from CoStar’s forecasts.

Source: Cushman & Wakefield Research, The CoStar Group
*2020-2021 figures are derived from CoStar’s forecasts.
NORTH AMERICAN INDUSTRIAL OUTLOOK 2019 / 23
TOP 50 MARKETS FOR RELATIVE DEMAND & SUPPLYNET ABSORPTION AS % OF INVENTORY
1 Savannah, GA* 10.8%
2 Charleston, SC* 7.5%
3 Inland Empire, CA 7.3%
4 PA I81/I78 Corridor, PA 7.0%
5 Lakeland, FL* 6.0%
6 Dallas/Ft. Worth, TX 5.8%
7 Mexico City, MX 5.6%
8 Indianapolis, IN 5.5%
9 Reno, NV* 5.3%
10 Atlanta, GA 4.8%
11 Vancouver, BC 4.7%
12 Las Vegas, NV* 4.7%
13 Tampa, FL 4.3%
14 Kansas City, MO 4.0%
15 Central NJ 3.7%
16 Fort Lauderdale, FL 3.5%
17 Memphis, TN* 3.4%
18 Louisville, KY* 3.3%
19 San Francisco Peninsula, CA 3.2%
20 Columbus, OH* 3.2%
21 Tulsa, OK* 3.1%
22 Minneapolis, MN 3.0%
23 Richmond, VA* 2.9%
24 Charlotte, NC 2.8%
25 Fort Myers/Naples, FL* 2.8%
26 Houston, TX 2.8%
27 Central Valley, CA* 2.6%
28 Montreal, QC 2.4%
29 Chicago, IL 2.2%
30 Raleigh/Durham, NC* 2.2%
31 Philadelphia, PA 2.1%
32 Edmonton, AB 2.0%
33 Orlando, FL 2.0%
34 Sacramento, CA 1.9%
35 Seattle, WA 1.9%
36 Baltimore, MD 1.8%
37 Calgary, AB 1.8%
38 Greenville, SC* 1.8%
39 Jacksonville, FL 1.8%
40 Phoenix, AZ 1.8%
41 Nashville, TN 1.7%
42 SF North Bay, CA* 1.6%
43 Toronto, ON 1.6%
44 Northern NJ 1.6%
45 Salt Lake City, UT* 1.6%
46 Cincinnati, OH* 1.6%
47 Denver, CO 1.5%
48 West Palm Beach, FL 1.5%
49 Austin, TX* 1.4%
50 St. Louis, MO 1.3%

© 2020 Cushman & Wakefield. All rights reserved. The information contained within this report is gathered from multiple sources believed to be reliable. The information may contain errors or omissions and is presented without any warranty or representations as to its accuracy.
ABOUT CUSHMAN & WAKEFIELD
Cushman & Wakefield (NYSE: CWK) is a leading global real estate services firm that delivers exceptional value for real estate occupiers and owners. Cushman & Wakefield is among the largest real estate services firms with approximately 51,000 employees in 400 offices and 70 countries. In 2018, the firm had revenue of $8.2 billion across core services of property, facilities and project management, leasing, capital markets, valuation and other services. To learn more, visit www.cushmanwakefield.com or follow @CushWake on Twitter.
Revathi GreenwoodAmericas Head of [email protected]
cushmanwakefield.com
CONTRIBUTORS
Carolyn Salzer Americas Head of Logistics & Industrial [email protected]
Bethany Clark Senior Managing Director, Strategy & Operations - Logistics & Industrial Services, [email protected]
David BitnerAmericas Head of Capital Markets [email protected]
Rebecca Rockey Global Head of [email protected]
FOR MORE INFORMATION
Tray AndersonLogistics & Industrial Services Lead, [email protected]
Stuart BarronNational Director of Research, Canadian [email protected]
Jose Luis Rubi Market Research Manager, Mexican [email protected]