2020 spring / summer · demonstration of portfolio premium portfolio dispositions 2016 portfolio...
TRANSCRIPT
2020 – SPRING / SUMMER
STAG Industrial, Inc. 2
FORWARD-LOOKING STATEMENTS & DEFINITIONS
Forward-Looking Statements
This presentation contains certain forward-looking statements within the meaning of Section 27A of the Securities Act of 1933, as amended, and Section 21E of the
Securities Exchange Act of 1934, as amended. STAG Industrial, Inc. (STAG) intends such forward-looking statements to be covered by the safe harbor provisions for
forward-looking statements contained in the Private Securities Litigation Reform Act of 1995 and includes this statement for purposes of complying with these safe
harbor provisions. Forward-looking statements, which are based on certain assumptions and describe STAG’s future plans, strategies and expectations, are generally
identifiable by use of the words “believe,” “will,” “expect,” “intend,” “anticipate,” “estimate,” “should”, “project” or similar expressions. You should not rely on forward-
looking statements since they involve known and unknown risks, uncertainties and other factors that are, in some cases, beyond STAG’s control and which could
materially affect actual results, performances or achievements. Factors that may cause actual results to differ materially from current expectations include, but are not
limited to, the risk factors discussed in STAG’s most recent Annual Report on Form 10-K for the year ended December 31, 2019, as updated by the Company’s
subsequent reports filed with the Securities and Exchange Commission. Accordingly, there is no assurance that STAG’s expectations will be realized. Except as
otherwise required by the federal securities laws, STAG disclaims any obligation or undertaking to publicly release any updates or revisions to any forward-looking
statement contained herein (or elsewhere) to reflect any change in STAG’s expectations with regard thereto or any change in events, conditions or circumstances on
which any such statement is based.
Defined Terms, Including Non-GAAP Measurements
Please refer to the Definitions section near the end of these materials for definitions of capitalized terms used herein, including, among others, Annualized Base Rental
Revenue, Capitalization Rate and Retention, as well as non-GAAP financial measures, such as Adjusted EBITDAre, Cash NOI, and Core FFO. These materials
provide reconciliations of non-GAAP financial measures to net income (loss) in accordance with GAAP. None of the non-GAAP financial measures is intended as an
alternative to net income (loss) in accordance with GAAP as a measure of the Company’s financial performance.
Additional information is also available on the Company’s website at www.stagindustrial.com
STAG Industrial, Inc. 3
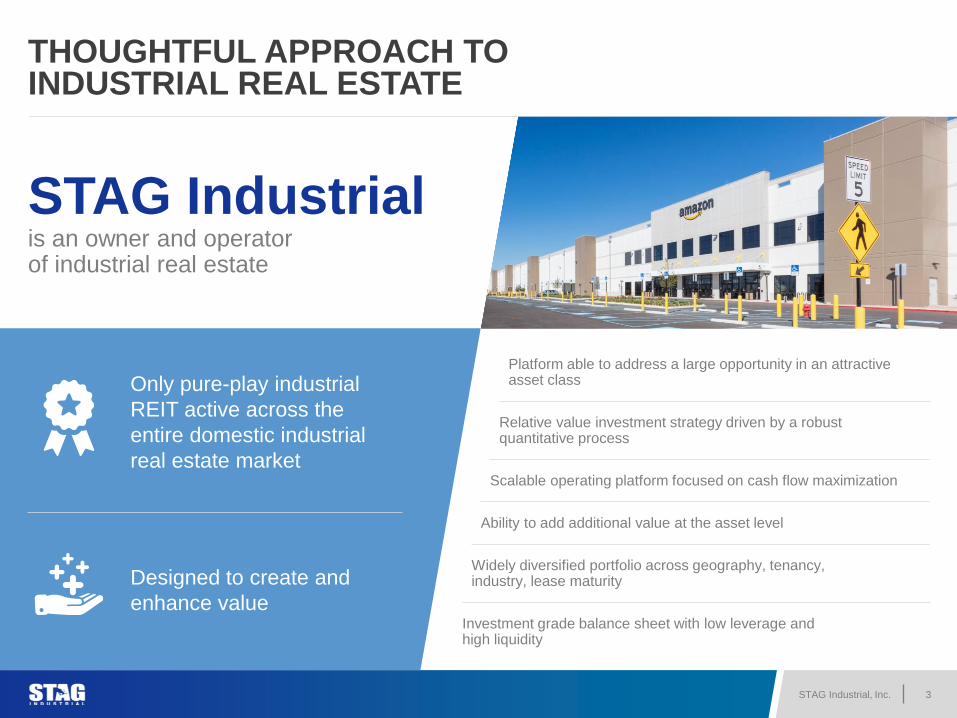
STAG Industrial is an owner and operator of industrial real estate
THOUGHTFUL APPROACH TO INDUSTRIAL REAL ESTATE
Only pure-play industrial
REIT active across the
entire domestic industrial
real estate market
Designed to create and
enhance value
Platform able to address a large opportunity in an attractive asset class
Relative value investment strategy driven by a robust quantitative process
Scalable operating platform focused on cash flow maximization
Ability to add additional value at the asset level
Widely diversified portfolio across geography, tenancy, industry, lease maturity
Investment grade balance sheet with low leverage and high liquidity
STAG Industrial, Inc. 4
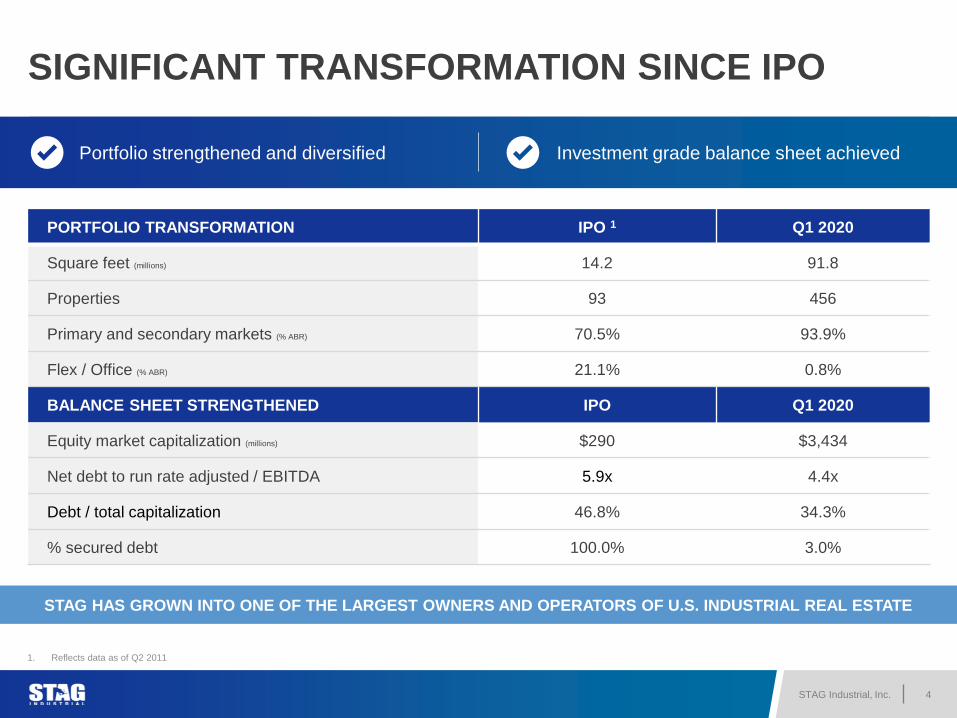
SIGNIFICANT TRANSFORMATION SINCE IPO
PORTFOLIO TRANSFORMATION IPO 1 Q1 2020
Square feet (millions) 14.2 91.8
Properties 93 456
Primary and secondary markets (% ABR) 70.5% 93.9%
Flex / Office (% ABR) 21.1% 0.8%
BALANCE SHEET STRENGTHENED IPO Q1 2020
Equity market capitalization (millions) $290 $3,434
Net debt to run rate adjusted / EBITDA 5.9x 4.4x
Debt / total capitalization 46.8% 34.3%
% secured debt 100.0% 3.0%
STAG HAS GROWN INTO ONE OF THE LARGEST OWNERS AND OPERATORS OF U.S. INDUSTRIAL REAL ESTATE
1. Reflects data as of Q2 2011
Portfolio strengthened and diversified Investment grade balance sheet achieved
STAG Industrial, Inc. 5
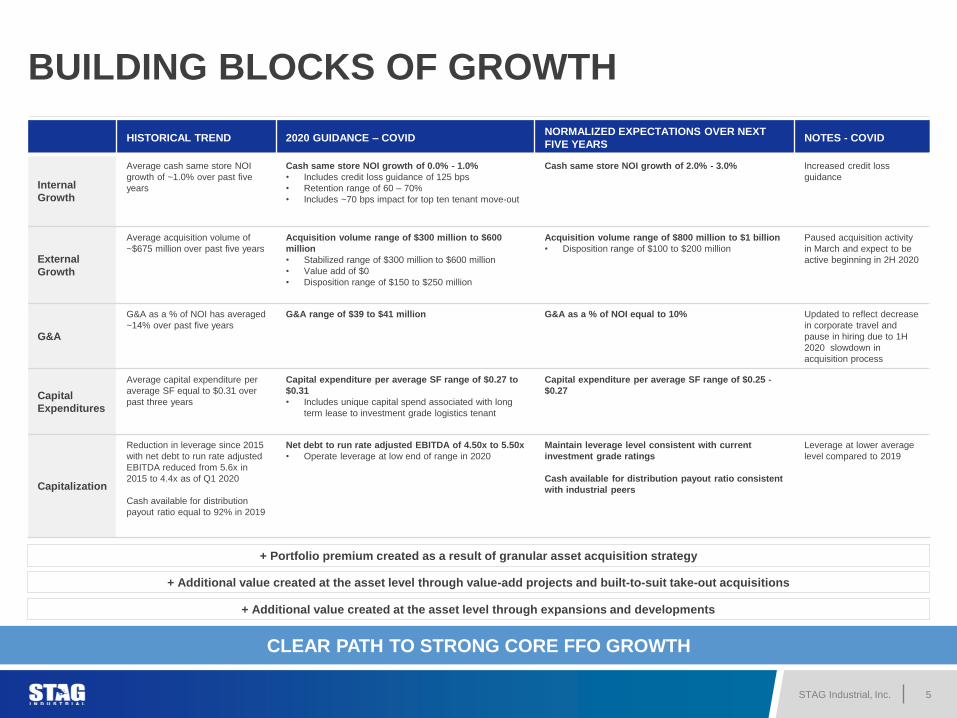
BUILDING BLOCKS OF GROWTH
HISTORICAL TREND 2020 GUIDANCE – COVIDNORMALIZED EXPECTATIONS OVER NEXT
FIVE YEARSNOTES - COVID
Internal
Growth
Average cash same store NOI
growth of ~1.0% over past five
years
Cash same store NOI growth of 0.0% - 1.0%
• Includes credit loss guidance of 125 bps
• Retention range of 60 – 70%
• Includes ~70 bps impact for top ten tenant move-out
Cash same store NOI growth of 2.0% - 3.0% Increased credit loss
guidance
External
Growth
Average acquisition volume of
~$675 million over past five years
Acquisition volume range of $300 million to $600
million
• Stabilized range of $300 million to $600 million
• Value add of $0
• Disposition range of $150 to $250 million
Acquisition volume range of $800 million to $1 billion
• Disposition range of $100 to $200 million
Paused acquisition activity
in March and expect to be
active beginning in 2H 2020
G&A
G&A as a % of NOI has averaged
~14% over past five years
G&A range of $39 to $41 million G&A as a % of NOI equal to 10% Updated to reflect decrease
in corporate travel and
pause in hiring due to 1H
2020 slowdown in
acquisition process
Capital
Expenditures
Average capital expenditure per
average SF equal to $0.31 over
past three years
Capital expenditure per average SF range of $0.27 to
$0.31
• Includes unique capital spend associated with long
term lease to investment grade logistics tenant
Capital expenditure per average SF range of $0.25 -
$0.27
Capitalization
Reduction in leverage since 2015
with net debt to run rate adjusted
EBITDA reduced from 5.6x in
2015 to 4.4x as of Q1 2020
Cash available for distribution
payout ratio equal to 92% in 2019
Net debt to run rate adjusted EBITDA of 4.50x to 5.50x
• Operate leverage at low end of range in 2020
Maintain leverage level consistent with current
investment grade ratings
Cash available for distribution payout ratio consistent
with industrial peers
Leverage at lower average
level compared to 2019
CLEAR PATH TO STRONG CORE FFO GROWTH
+ Portfolio premium created as a result of granular asset acquisition strategy
+ Additional value created at the asset level through value-add projects and built-to-suit take-out acquisitions
+ Additional value created at the asset level through expansions and developments
STAG Industrial, Inc. 6
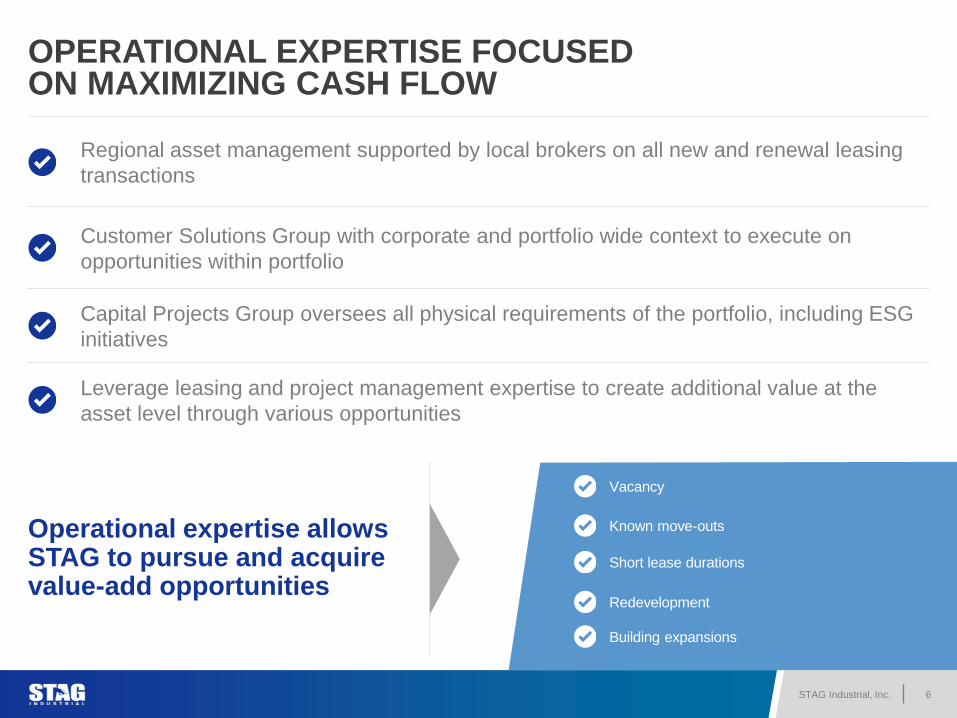
OPERATIONAL EXPERTISE FOCUSED ON MAXIMIZING CASH FLOW
Regional asset management supported by local brokers on all new and renewal leasing
transactions
Capital Projects Group oversees all physical requirements of the portfolio, including ESG
initiatives
Customer Solutions Group with corporate and portfolio wide context to execute on
opportunities within portfolio
Leverage leasing and project management expertise to create additional value at the
asset level through various opportunities
Operational expertise allows STAG to pursue and acquire value-add opportunities
Vacancy
Known move-outs
Short lease durations
Building expansions
Redevelopment
STAG Industrial, Inc. 7
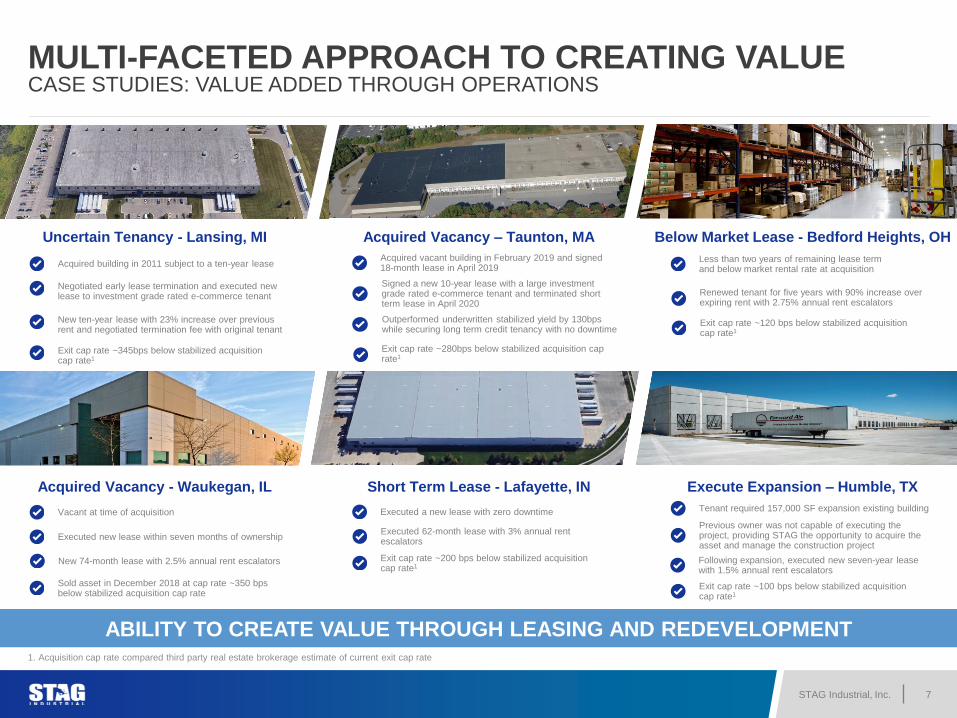
MULTI-FACETED APPROACH TO CREATING VALUECASE STUDIES: VALUE ADDED THROUGH OPERATIONS
Uncertain Tenancy - Lansing, MI Acquired Vacancy – Taunton, MA Below Market Lease - Bedford Heights, OH
Acquired building in 2011 subject to a ten-year lease
Negotiated early lease termination and executed new lease to investment grade rated e-commerce tenant
Exit cap rate ~345bps below stabilized acquisition cap rate1
Acquired vacant building in February 2019 and signed 18-month lease in April 2019
Signed a new 10-year lease with a large investment grade rated e-commerce tenant and terminated short term lease in April 2020
Outperformed underwritten stabilized yield by 130bps while securing long term credit tenancy with no downtime
Renewed tenant for five years with 90% increase over expiring rent with 2.75% annual rent escalators
Less than two years of remaining lease term and below market rental rate at acquisition
Acquired Vacancy - Waukegan, IL Short Term Lease - Lafayette, IN Execute Expansion – Humble, TX
Vacant at time of acquisition
Executed new lease within seven months of ownership
Executed a new lease with zero downtime Tenant required 157,000 SF expansion existing building
Previous owner was not capable of executing the project, providing STAG the opportunity to acquire the asset and manage the construction project
ABILITY TO CREATE VALUE THROUGH LEASING AND REDEVELOPMENT1. Acquisition cap rate compared third party real estate brokerage estimate of current exit cap rate
Sold asset in December 2018 at cap rate ~350 bps below stabilized acquisition cap rate
Exit cap rate ~100 bps below stabilized acquisition cap rate1
New ten-year lease with 23% increase over previous rent and negotiated termination fee with original tenant
Exit cap rate ~200 bps below stabilized acquisition cap rate1
Exit cap rate ~280bps below stabilized acquisition cap rate1
New 74-month lease with 2.5% annual rent escalators
Executed 62-month lease with 3% annual rent escalators
Following expansion, executed new seven-year lease with 1.5% annual rent escalators
Exit cap rate ~120 bps below stabilized acquisition cap rate1
STAG Industrial, Inc. 8
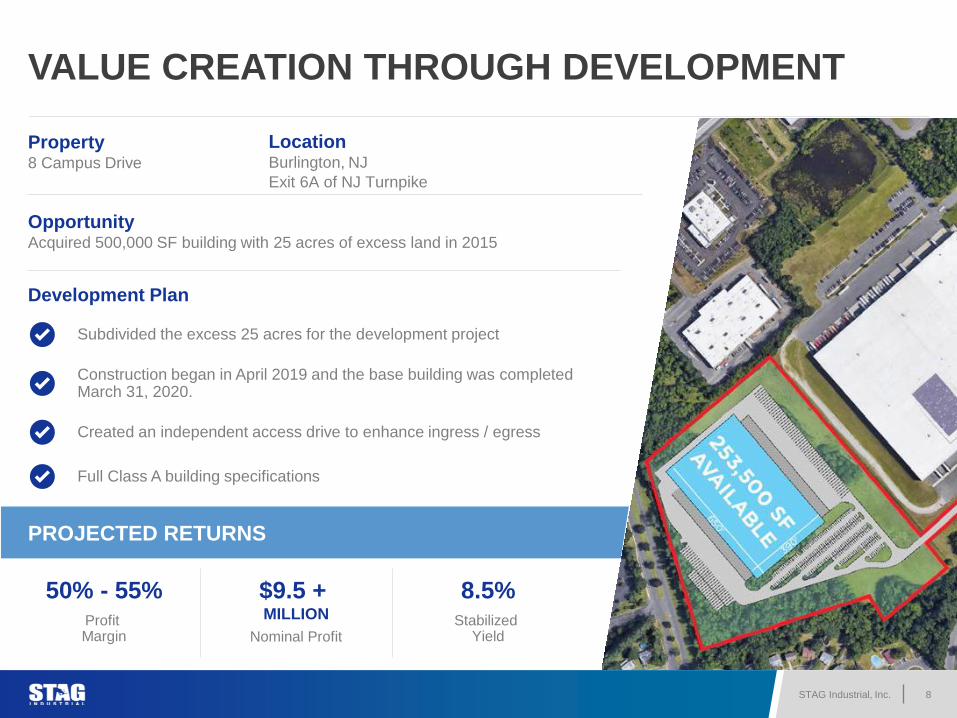
VALUE CREATION THROUGH DEVELOPMENT
Property8 Campus Drive
LocationBurlington, NJ
Exit 6A of NJ Turnpike
OpportunityAcquired 500,000 SF building with 25 acres of excess land in 2015
Development Plan
Subdivided the excess 25 acres for the development project
Construction began in April 2019 and the base building was completed March 31, 2020.
Created an independent access drive to enhance ingress / egress
Full Class A building specifications
PROJECTED RETURNS
50% - 55%Profit Margin
$9.5 + MILLION
Nominal Profit
8.5%Stabilized
Yield
STAG Industrial, Inc. 9
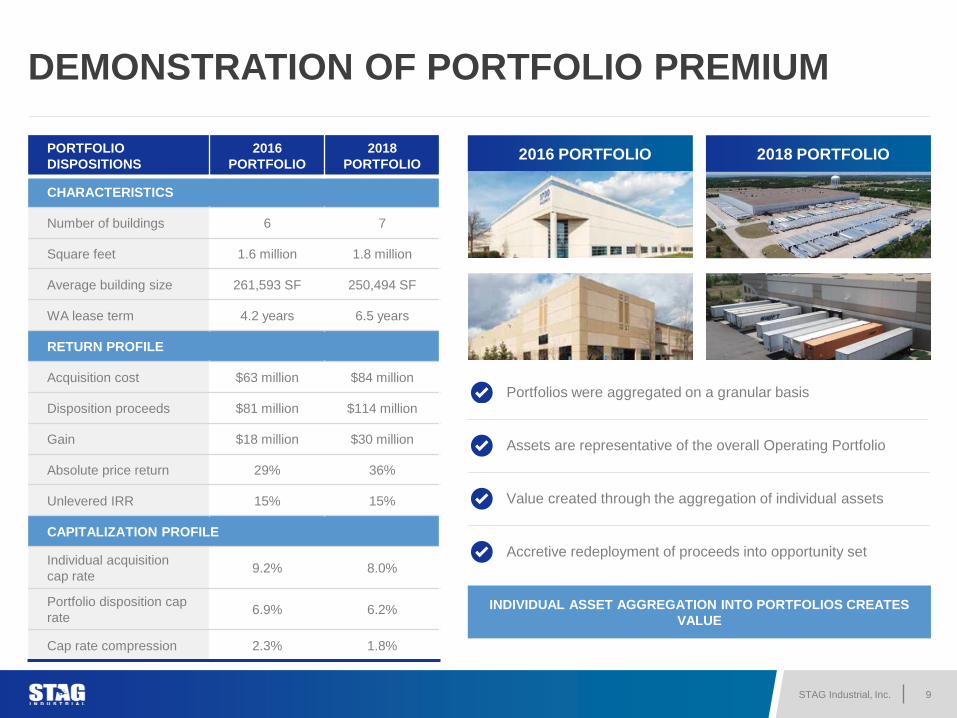
DEMONSTRATION OF PORTFOLIO PREMIUM
PORTFOLIO
DISPOSITIONS
2016
PORTFOLIO
2018
PORTFOLIO
CHARACTERISTICS
Number of buildings 6 7
Square feet 1.6 million 1.8 million
Average building size 261,593 SF 250,494 SF
WA lease term 4.2 years 6.5 years
RETURN PROFILE
Acquisition cost $63 million $84 million
Disposition proceeds $81 million $114 million
Gain $18 million $30 million
Absolute price return 29% 36%
Unlevered IRR 15% 15%
CAPITALIZATION PROFILE
Individual acquisition
cap rate9.2% 8.0%
Portfolio disposition cap
rate6.9% 6.2%
Cap rate compression 2.3% 1.8%
INDIVIDUAL ASSET AGGREGATION INTO PORTFOLIOS CREATES
VALUE
Portfolios were aggregated on a granular basis
Assets are representative of the overall Operating Portfolio
Value created through the aggregation of individual assets
Accretive redeployment of proceeds into opportunity set
2016 PORTFOLIO 2018 PORTFOLIO
STAG Industrial, Inc. 10
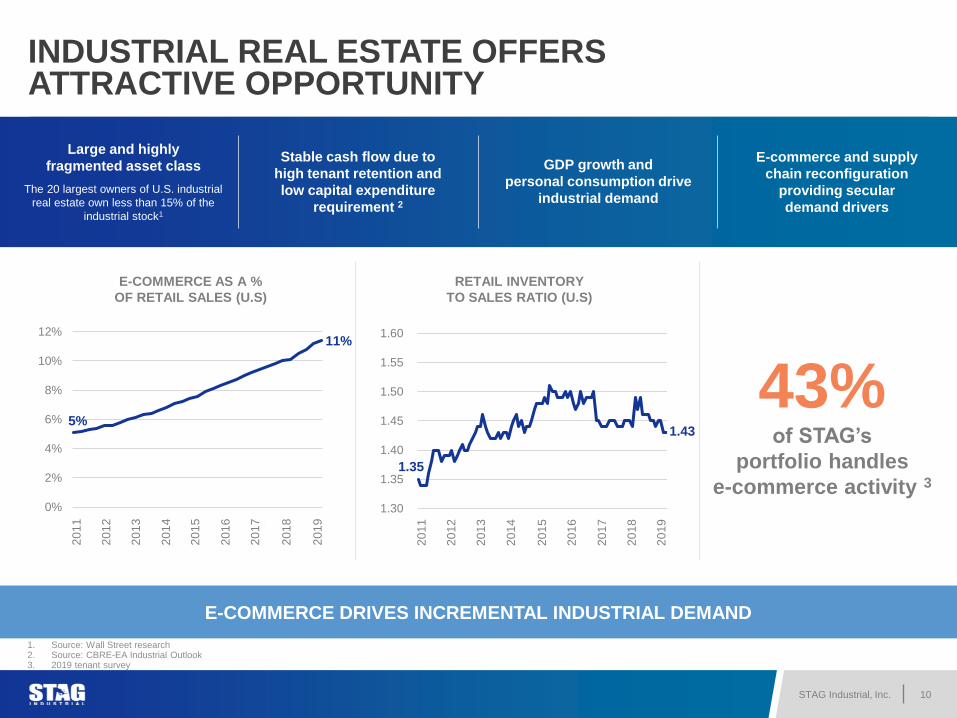
INDUSTRIAL REAL ESTATE OFFERS ATTRACTIVE OPPORTUNITY
E-COMMERCE AS A %
OF RETAIL SALES (U.S)
43%of STAG’s
portfolio handles
e-commerce activity 3
Large and highly
fragmented asset class
The 20 largest owners of U.S. industrial
real estate own less than 15% of the
industrial stock1
Stable cash flow due to
high tenant retention and
low capital expenditure
requirement 2
GDP growth and
personal consumption drive
industrial demand
E-commerce and supply
chain reconfiguration
providing secular
demand drivers
1. Source: Wall Street research2. Source: CBRE-EA Industrial Outlook3. 2019 tenant survey
E-COMMERCE DRIVES INCREMENTAL INDUSTRIAL DEMAND
1.30
1.35
1.40
1.45
1.50
1.55
1.60
11
12
13
14
15
16
17
18
19
0%
2%
4%
6%
8%
10%
12%
11
12
13
14
15
16
17
18
19
20
11
RETAIL INVENTORY
TO SALES RATIO (U.S)
20
12
20
13
20
14
20
15
20
16
20
17
20
18
20
19
20
11
20
12
20
13
20
14
20
15
20
16
20
17
20
18
20
19
5%
11%
1.35
1.43
STAG Industrial, Inc. 11
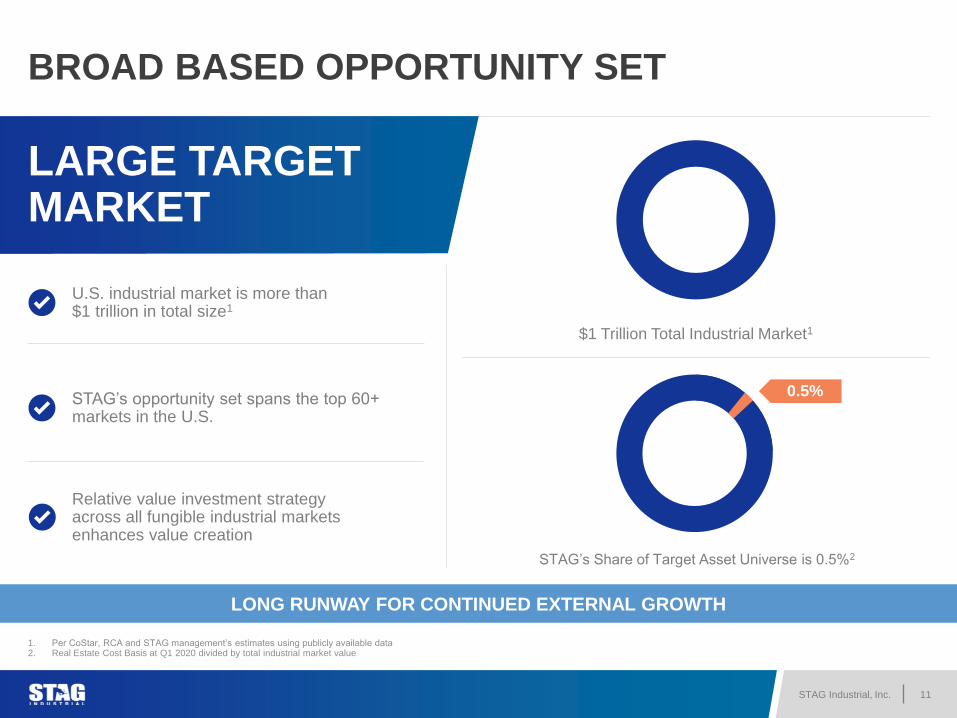
BROAD BASED OPPORTUNITY SET
LARGE TARGET MARKET
1. Per CoStar, RCA and STAG management’s estimates using publicly available data2. Real Estate Cost Basis at Q1 2020 divided by total industrial market value
U.S. industrial market is more than$1 trillion in total size1
STAG’s opportunity set spans the top 60+ markets in the U.S.
LONG RUNWAY FOR CONTINUED EXTERNAL GROWTH
Relative value investment strategy across all fungible industrial markets enhances value creation
$1 Trillion Total Industrial Market1
STAG’s Share of Target Asset Universe is 0.5%2
0.5%
STAG Industrial, Inc. 12
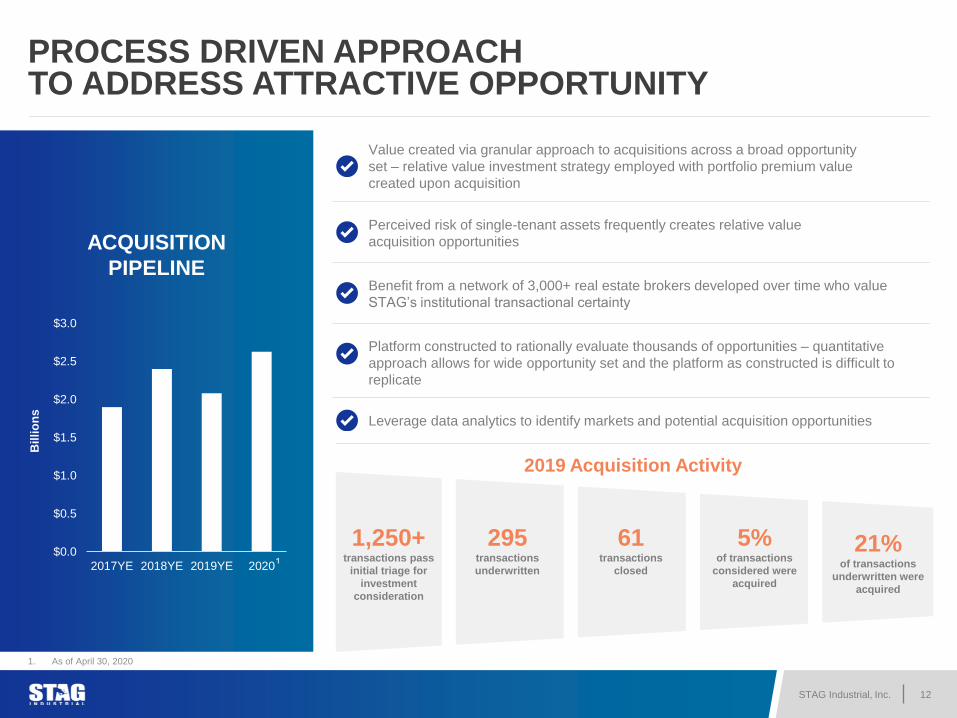
PROCESS DRIVEN APPROACH TO ADDRESS ATTRACTIVE OPPORTUNITY
Value created via granular approach to acquisitions across a broad opportunity
set – relative value investment strategy employed with portfolio premium value
created upon acquisition
Perceived risk of single-tenant assets frequently creates relative value
acquisition opportunities
Benefit from a network of 3,000+ real estate brokers developed over time who value
STAG’s institutional transactional certainty
Platform constructed to rationally evaluate thousands of opportunities – quantitative
approach allows for wide opportunity set and the platform as constructed is difficult to
replicate
Leverage data analytics to identify markets and potential acquisition opportunities
ACQUISITION
PIPELINE
$0.0
$0.5
$1.0
$1.5
$2.0
$2.5
$3.0
2017YE 2018YE 2019YE 2020
Billi
on
s
1,250+transactions pass
initial triage for
investment
consideration
295transactions
underwritten
61transactions
closed
5%of transactions
considered were
acquired
21%of transactions
underwritten were
acquired
2019 Acquisition Activity
1. As of April 30, 2020
STAG Industrial, Inc. 13
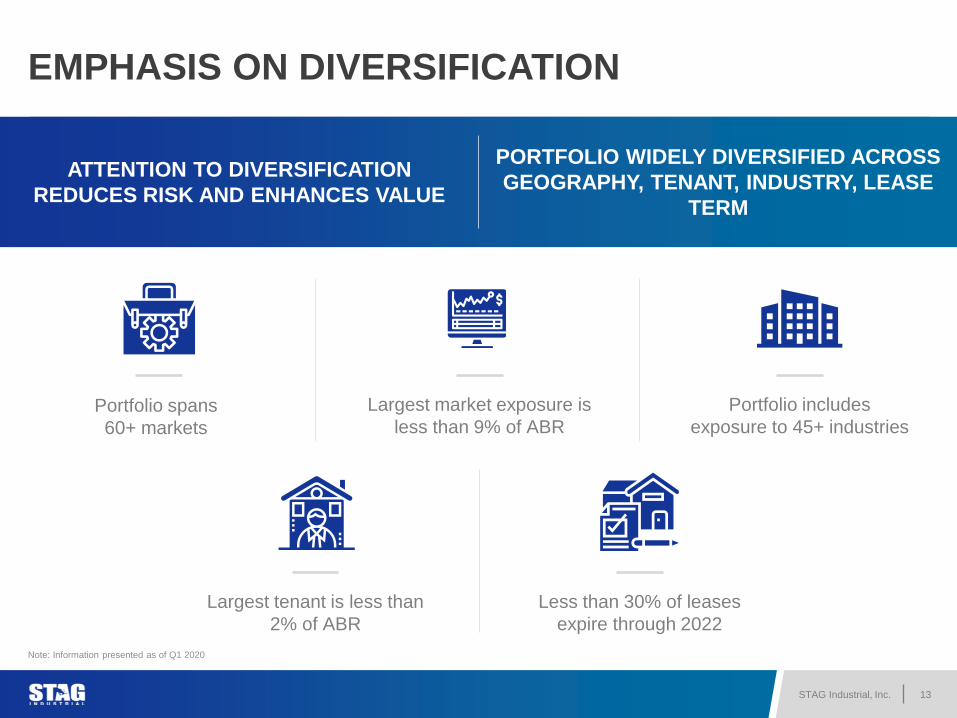
EMPHASIS ON DIVERSIFICATION
ATTENTION TO DIVERSIFICATION
REDUCES RISK AND ENHANCES VALUE
PORTFOLIO WIDELY DIVERSIFIED ACROSS
GEOGRAPHY, TENANT, INDUSTRY, LEASE
TERM
Portfolio spans
60+ markets
Largest market exposure is
less than 9% of ABR
Portfolio includes
exposure to 45+ industries
Largest tenant is less than
2% of ABR
Less than 30% of leases
expire through 2022
Note: Information presented as of Q1 2020
STAG Industrial, Inc. 14
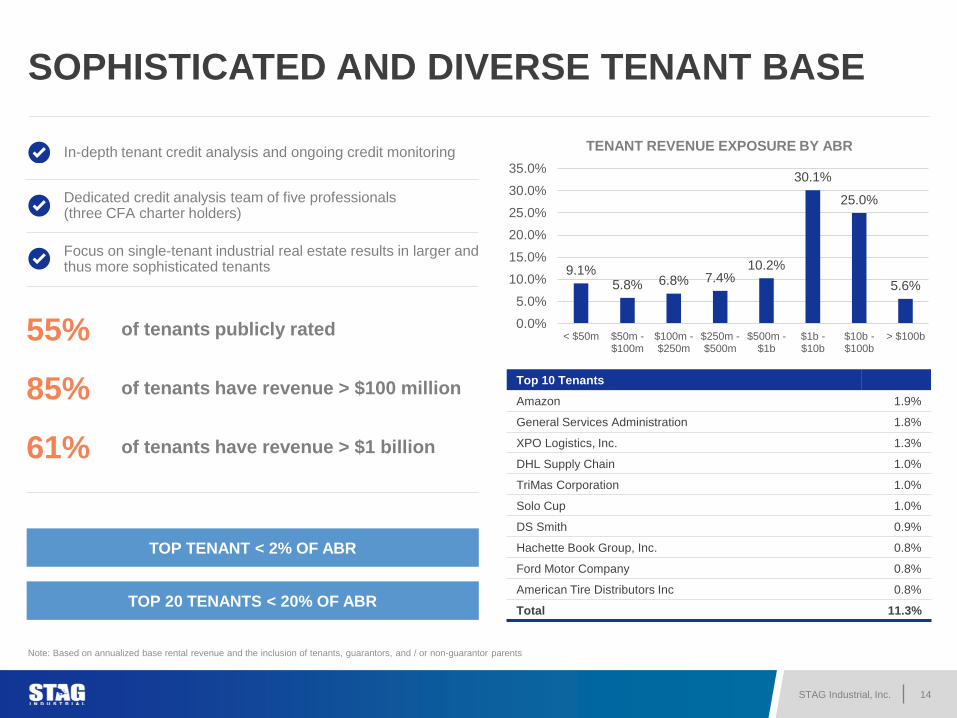
SOPHISTICATED AND DIVERSE TENANT BASE
9.1%5.8% 6.8% 7.4%
10.2%
30.1%
25.0%
5.6%
0.0%
5.0%
10.0%
15.0%
20.0%
25.0%
30.0%
35.0%
< $50m $50m -$100m
$100m -$250m
$250m -$500m
$500m -$1b
$1b -$10b
$10b -$100b
> $100b
TENANT REVENUE EXPOSURE BY ABRIn-depth tenant credit analysis and ongoing credit monitoring
Dedicated credit analysis team of five professionals (three CFA charter holders)
Focus on single-tenant industrial real estate results in larger and thus more sophisticated tenants
55% of tenants publicly rated
85% of tenants have revenue > $100 million
61% of tenants have revenue > $1 billion
TOP 20 TENANTS < 20% OF ABR
TOP TENANT < 2% OF ABR
Top 10 Tenants
Amazon 1.9%
General Services Administration 1.8%
XPO Logistics, Inc. 1.3%
DHL Supply Chain 1.0%
TriMas Corporation 1.0%
Solo Cup 1.0%
DS Smith 0.9%
Hachette Book Group, Inc. 0.8%
Ford Motor Company 0.8%
American Tire Distributors Inc 0.8%
Total 11.3%
Note: Based on annualized base rental revenue and the inclusion of tenants, guarantors, and / or non-guarantor parents
STAG Industrial, Inc. 15
Weighted Avg
Interest Rate
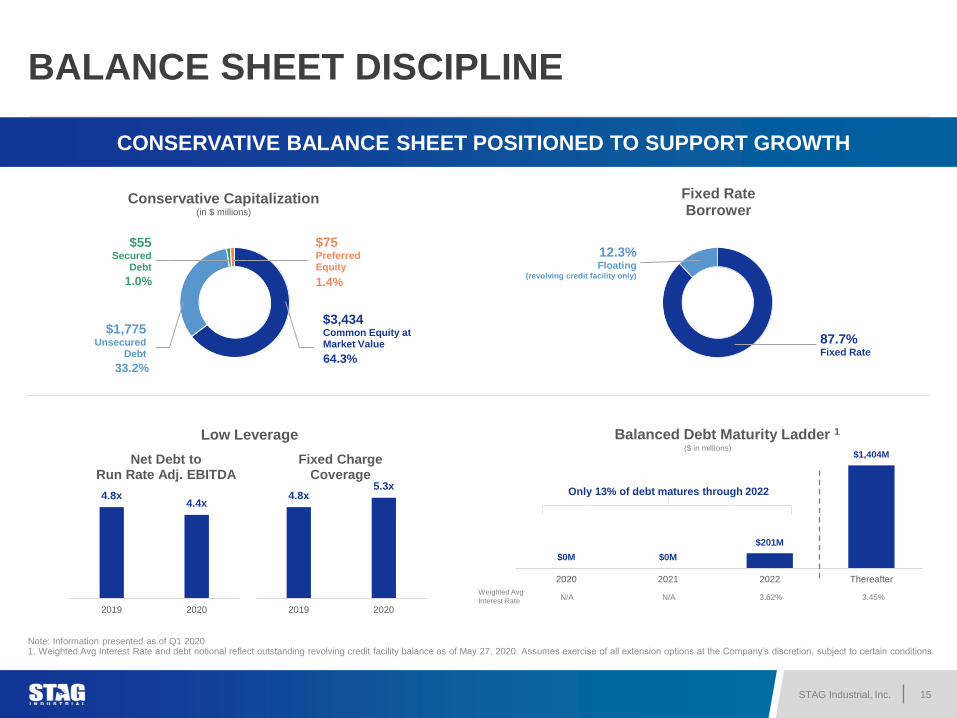
BALANCE SHEET DISCIPLINE
CONSERVATIVE BALANCE SHEET POSITIONED TO SUPPORT GROWTH
87.7%Fixed Rate
12.3%Floating
(revolving credit facility only)
Fixed RateBorrower
-
4.8x4.4x
2019 2020
Net Debt toRun Rate Adj. EBITDA
4.8x5.3x
2019 2020
Fixed ChargeCoverage
$0M $0M
$201M
$1,404M
2020 2021 2022 Thereafter
Balanced Debt Maturity Ladder 1
N/A
Only 13% of debt matures through 2022
3.62% 3.45%N/A
($ in millions)
Note: Information presented as of Q1 20201. Weighted Avg Interest Rate and debt notional reflect outstanding revolving credit facility balance as of May 27, 2020. Assumes exercise of all extension options at the Company’s discretion, subject to certain conditions.
Low Leverage
$3,434Common Equity at Market Value
$1,775Unsecured
Debt
$75PreferredEquity
$55Secured
Debt
Conservative Capitalization(in $ millions)
33.2%
1.0%
64.3%
1.4%

STAG Industrial, Inc. 16
COMPELLING VALUATION
FFO MULTIPLE1
IMPLIED CAP RATE1
13.3xSTAG
25.1xPeer Average2
7.0%STAG
4.6%Peer Average2
Growing Income
Value Creation
Internal growth with long history of success managing portfolio
External growth with large opportunity set and robust investment pipeline
Attractive asset class that is difficult to aggregate
Granular investment approach to identify relative value
Value add opportunities at asset level
• Reposition under-leased assets
• Redevelopment
• Development
ATTRACTIVE VALUATION COMPARED TO INDUSTRIAL REIT PEERS
Low Risk
Widely diversified portfolio across geography, tenancy, industry, lease maturity
Investment grade balance sheet with low leverage and high level of liquidity
Aggregation creates portfolio premium
Established built-to-suit takeout partner to developers nationwide
1. Information presented as of May 5, 2020 (Closing Share Price as of May 4, 2020); FFO multiple incorporates published 2020 SNL Consensus FFO; implied cap rate per Wall Street research2. Peers consist of DRE, EGP, FR, PLD, TRNO, REXR
STAG Industrial, Inc. 17
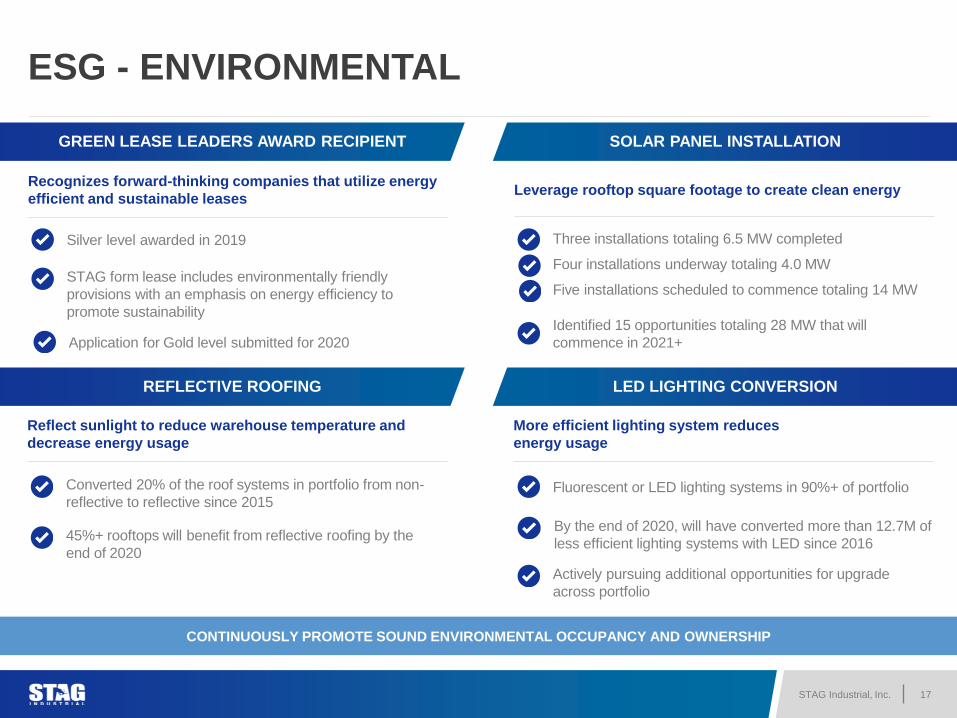
CONTINUOUSLY PROMOTE SOUND ENVIRONMENTAL OCCUPANCY AND OWNERSHIP
ESG - ENVIRONMENTAL
REFLECTIVE ROOFING LED LIGHTING CONVERSION
GREEN LEASE LEADERS AWARD RECIPIENT SOLAR PANEL INSTALLATION
Recognizes forward-thinking companies that utilize energy
efficient and sustainable leases
Silver level awarded in 2019
STAG form lease includes environmentally friendly
provisions with an emphasis on energy efficiency to
promote sustainability
Leverage rooftop square footage to create clean energy
Three installations totaling 6.5 MW completed
Four installations underway totaling 4.0 MW
Five installations scheduled to commence totaling 14 MW
Identified 15 opportunities totaling 28 MW that will
commence in 2021+
Reflect sunlight to reduce warehouse temperature and
decrease energy usage
Converted 20% of the roof systems in portfolio from non-
reflective to reflective since 2015
45%+ rooftops will benefit from reflective roofing by the
end of 2020
More efficient lighting system reduces
energy usage
Fluorescent or LED lighting systems in 90%+ of portfolio
By the end of 2020, will have converted more than 12.7M of
less efficient lighting systems with LED since 2016
Actively pursuing additional opportunities for upgrade
across portfolio
Application for Gold level submitted for 2020
STAG Industrial, Inc. 18
ESG - SOCIAL AND GOVERNANCE
Our Charitable Action Committee is
a proud supporter of Boston-based
nonprofit organizations
Focus on efforts benefiting children and young adults
Support provided through donations and significant
volunteering
SOCIAL RESPONSIBILITY
GOVERNANCE
Diverse board with lead independent director
Shareholder friendly bylaws including majority voting and
shareholder ability to amend bylaws
Alignment of management compensation with
total shareholder return
Stock ownership guidelines for executives and directors
Currently supporting various local efforts to get safely
through Covid-19
STAG Industrial, Inc. 19
APPENDIX
STAG Industrial, Inc. 20
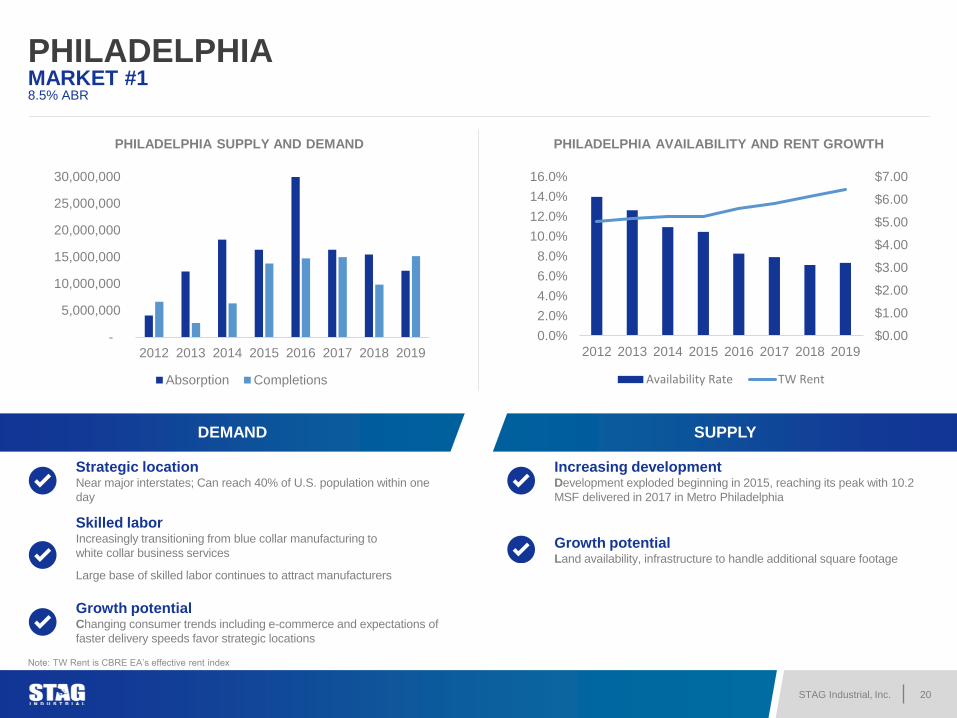
PHILADELPHIAMARKET #18.5% ABR
Strategic locationNear major interstates; Can reach 40% of U.S. population within one
day
Skilled laborIncreasingly transitioning from blue collar manufacturing to
white collar business services
Large base of skilled labor continues to attract manufacturers
Growth potential Changing consumer trends including e-commerce and expectations of
faster delivery speeds favor strategic locations
Increasing development Development exploded beginning in 2015, reaching its peak with 10.2
MSF delivered in 2017 in Metro Philadelphia
Growth potentialLand availability, infrastructure to handle additional square footage
PHILADELPHIA SUPPLY AND DEMAND PHILADELPHIA AVAILABILITY AND RENT GROWTH
DEMAND SUPPLY
-
5,000,000
10,000,000
15,000,000
20,000,000
25,000,000
30,000,000
2012 2013 2014 2015 2016 2017 2018 2019
Absorption Completions
$0.00
$1.00
$2.00
$3.00
$4.00
$5.00
$6.00
$7.00
0.0%
2.0%
4.0%
6.0%
8.0%
10.0%
12.0%
14.0%
16.0%
2012 2013 2014 2015 2016 2017 2018 2019
Availability Rate TW Rent
Note: TW Rent is CBRE EA’s effective rent index
STAG Industrial, Inc. 21
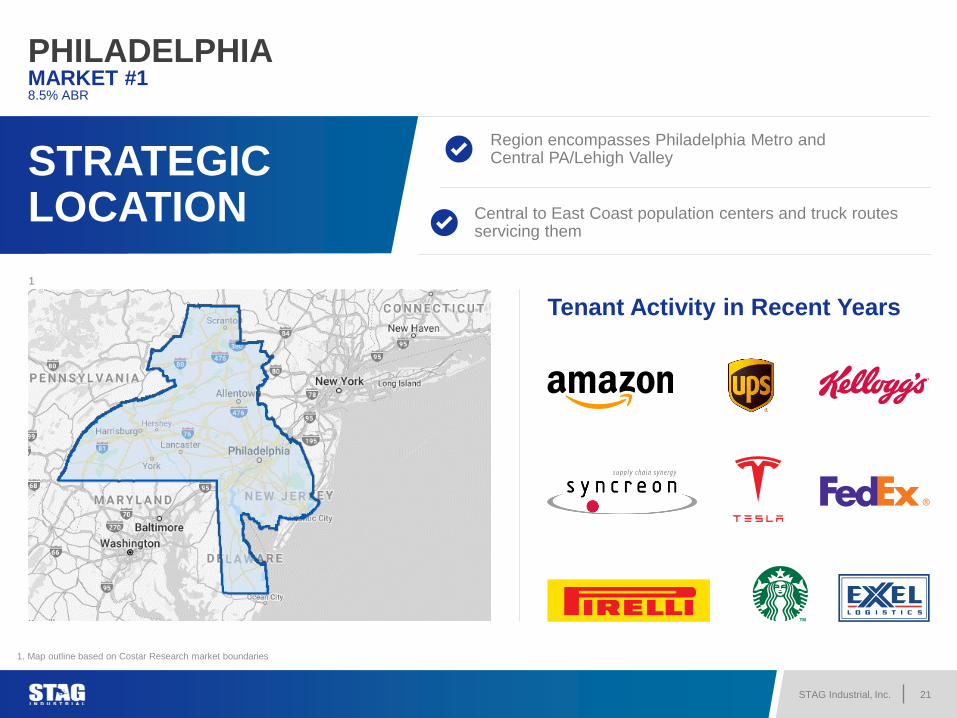
PHILADELPHIAMARKET #18.5% ABR
STRATEGIC LOCATION
Region encompasses Philadelphia Metro and Central PA/Lehigh Valley
Central to East Coast population centers and truck routes servicing them
Tenant Activity in Recent Years
1. Map outline based on Costar Research market boundaries
1
STAG Industrial, Inc. 22
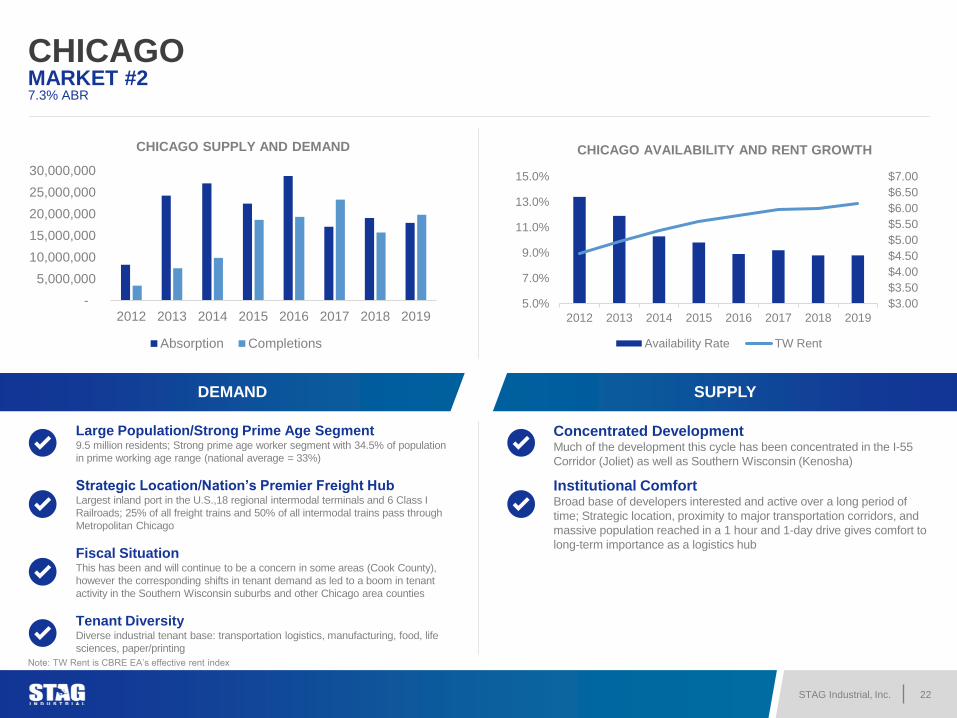
CHICAGOMARKET #27.3% ABR
DEMAND SUPPLY
Concentrated DevelopmentMuch of the development this cycle has been concentrated in the I-55
Corridor (Joliet) as well as Southern Wisconsin (Kenosha)
Large Population/Strong Prime Age Segment9.5 million residents; Strong prime age worker segment with 34.5% of population
in prime working age range (national average = 33%)
Strategic Location/Nation’s Premier Freight HubLargest inland port in the U.S.,18 regional intermodal terminals and 6 Class I
Railroads; 25% of all freight trains and 50% of all intermodal trains pass through
Metropolitan Chicago
Fiscal SituationThis has been and will continue to be a concern in some areas (Cook County),
however the corresponding shifts in tenant demand as led to a boom in tenant
activity in the Southern Wisconsin suburbs and other Chicago area counties
Institutional Comfort Broad base of developers interested and active over a long period of
time; Strategic location, proximity to major transportation corridors, and
massive population reached in a 1 hour and 1-day drive gives comfort to
long-term importance as a logistics hub
Tenant DiversityDiverse industrial tenant base: transportation logistics, manufacturing, food, life
sciences, paper/printing
-
5,000,000
10,000,000
15,000,000
20,000,000
25,000,000
30,000,000
2012 2013 2014 2015 2016 2017 2018 2019
CHICAGO SUPPLY AND DEMAND
Absorption Completions
5.0%
7.0%
9.0%
11.0%
13.0%
15.0%
2012 2013 2014 2015 2016 2017 2018 2019
$3.00
$3.50
$4.00
$4.50
$5.00
$5.50
$6.00
$6.50
$7.00
CHICAGO AVAILABILITY AND RENT GROWTH
Availability Rate TW Rent
Note: TW Rent is CBRE EA’s effective rent index
STAG Industrial, Inc. 23
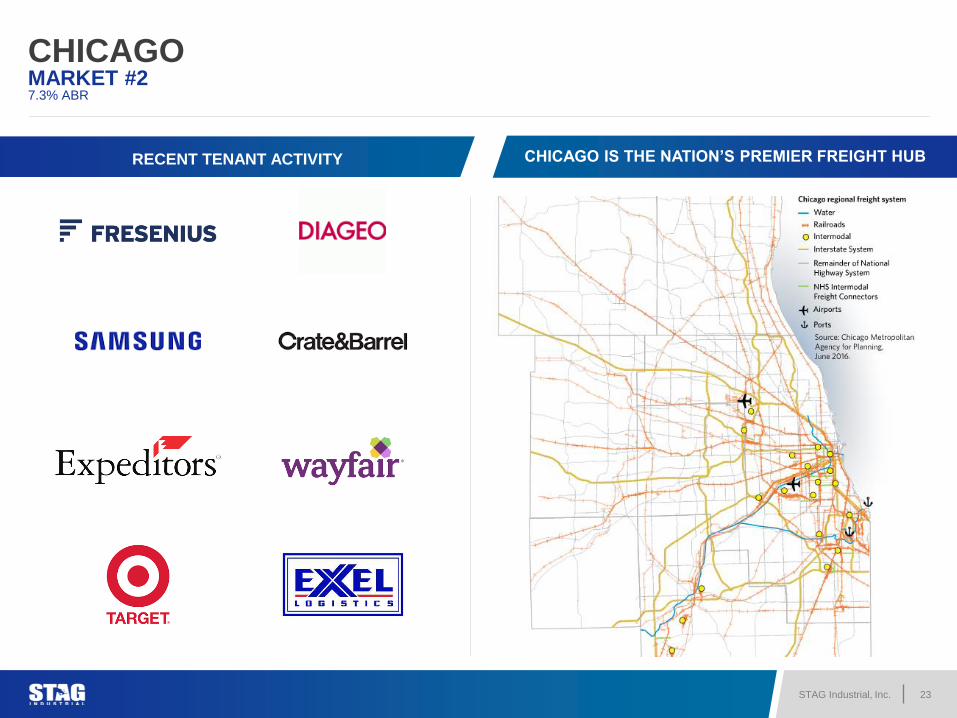
CHICAGOMARKET #27.3% ABR
RECENT TENANT ACTIVITY CHICAGO IS THE NATION’S PREMIER FREIGHT HUB
STAG Industrial, Inc. 24
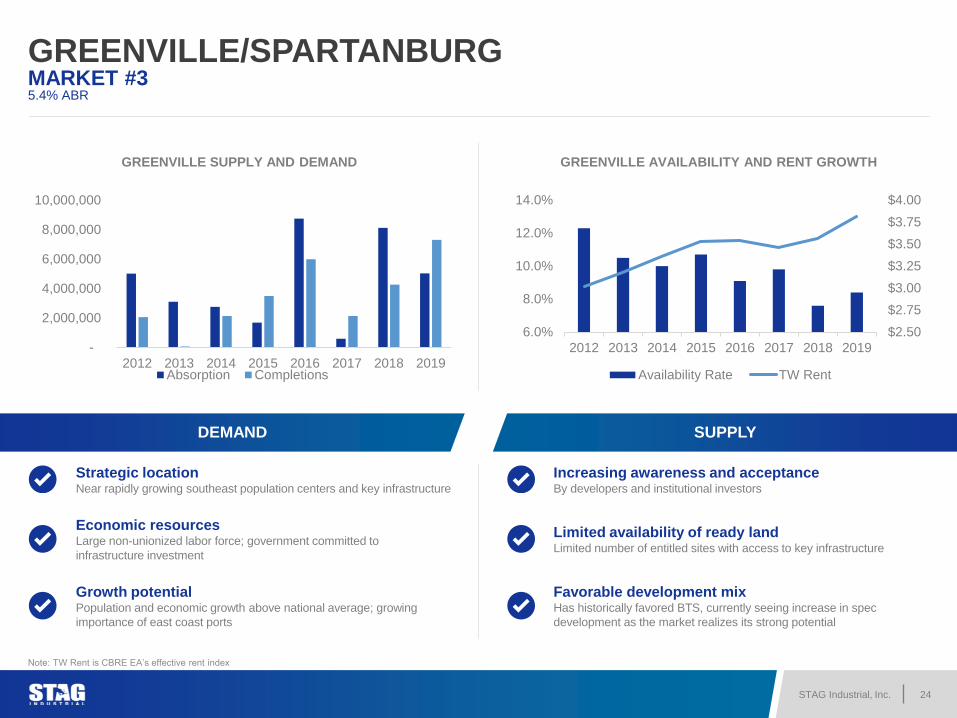
GREENVILLE/SPARTANBURGMARKET #35.4% ABR
DEMAND SUPPLY
GREENVILLE SUPPLY AND DEMAND GREENVILLE AVAILABILITY AND RENT GROWTH
Strategic locationNear rapidly growing southeast population centers and key infrastructure
Increasing awareness and acceptanceBy developers and institutional investors
Economic resources Large non-unionized labor force; government committed to
infrastructure investment
Limited availability of ready land Limited number of entitled sites with access to key infrastructure
Growth potential Population and economic growth above national average; growing
importance of east coast ports
Favorable development mix Has historically favored BTS, currently seeing increase in spec
development as the market realizes its strong potential
-
2,000,000
4,000,000
6,000,000
8,000,000
10,000,000
2012 2013 2014 2015 2016 2017 2018 2019Absorption Completions
6.0%
8.0%
10.0%
12.0%
14.0%
2012 2013 2014 2015 2016 2017 2018 2019
$2.50
$2.75
$3.00
$3.25
$3.50
$3.75
$4.00
Availability Rate TW Rent
Note: TW Rent is CBRE EA’s effective rent index
STAG Industrial, Inc. 25
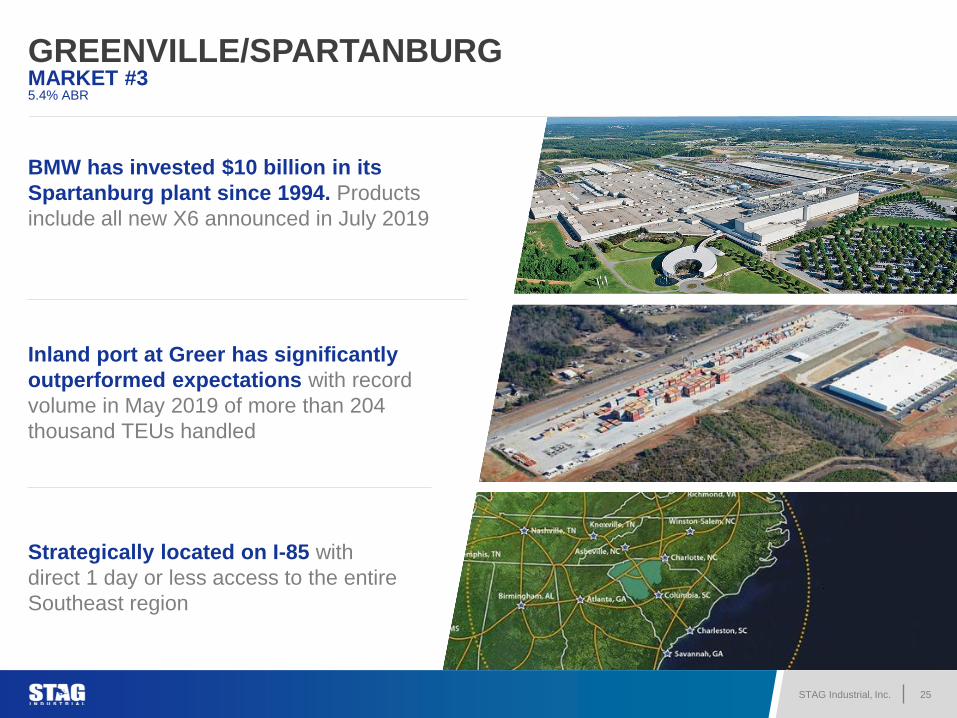
GREENVILLE/SPARTANBURGMARKET #35.4% ABR
BMW has invested $10 billion in its
Spartanburg plant since 1994. Products
include all new X6 announced in July 2019
Inland port at Greer has significantly
outperformed expectations with record
volume in May 2019 of more than 204
thousand TEUs handled
Strategically located on I-85 with
direct 1 day or less access to the entire
Southeast region
STAG Industrial, Inc. 26
NON-GAAP FINANCIAL MEASURES & OTHER DEFINITIONS
Acquisition Capital Expenditures: We define Acquisition Capital Expenditures as Recurring and Non-Recurring Capital Expenditures identified at the time of acquisition.
Acquisition Capital Expenditures also include new lease commissions and tenant improvements for space that was not occupied under the Company's ownership.
Annualized Base Rental Revenue: We define Annualized Base Rental Revenue as the monthly base cash rent for the applicable property or properties (which is
different from rent calculated in accordance with GAAP for purposes of our financial statements), multiplied by 12. If a tenant is in a free rent period, the annualized rent is
calculated based on the first contractual monthly base rent amount multiplied by 12.
Cash Available for Distribution: Cash Available for Distribution represents Core FFO, excluding non-rental property depreciation and amortization, straight-line rent
adjustments, non-cash portion of interest expense, non-cash compensation expense, and deducts capital expenditures reimbursed by tenants, recurring and non-recurring
capital expenditures, and leasing commissions and tenant improvements.
Cash Available for Distribution should not be considered as an alternative to net income (determined in accordance with GAAP) as an indication of our performance, and
we believe that to understand our performance further, these measurements should be compared with our reported net income or net loss in accordance with GAAP, as
presented in our consolidated financial statements.
Cash Available for Distribution excludes, among other items, depreciation and amortization and capture neither the changes in the value of our buildings that result from
use or market conditions of our buildings, all of which have real economic effects and could materially impact our results from operations, the utility of these measures as
measures of our performance is limited. In addition, our calculation of Cash Available for Distribution may not be comparable to similarly titled measures disclosed by
other REITs.
Cash Capitalization Rate: We define Cash Capitalization Rate as calculated by dividing (i) the Company’s estimate of year one cash net operating income from the
applicable property’s operations stabilized for occupancy (post-lease-up for vacant properties), which does not include termination income, solar income, miscellaneous
other income, capital expenditures, general and administrative costs, reserves, tenant improvements and leasing commissions, credit loss, or vacancy loss, by (ii) the
GAAP purchase price plus estimated Acquisition Capital Expenditures. These Capitalization Rate estimates are subject to risks, uncertainties, and assumptions and are
not guarantees of future performance, which may be affected by known and unknown risks, trends, uncertainties, and factors that are beyond our control, including those
risk factors contained in our Annual Report on Form 10-K for the year ended December 31, 2019.
Cash Rent Change: We define Cash Rent Change as the percentage change in the base rent of the lease commenced during the period compared to the base rent of
the Comparable Lease for assets included in the Operating Portfolio. The calculation compares the first base rent payment due after the lease commencement date
compared to the base rent of the last monthly payment due prior to the termination of the lease, excluding holdover rent. Rent under gross or similar type leases are
converted to a net rent based on an estimate of the applicable recoverable expenses.
Earnings before Interest, Taxes, Depreciation, and Amortization for Real Estate (EBITDAre), Adjusted EBITDAre, Annualized Adjusted EBITDAre, and Run
Rate Adjusted EBITDAre: We define EBITDAre in accordance with the standards established by the National Association of Real Estate Investment Trusts (“NAREIT”).
EBITDAre represents net income (loss) (computed in accordance with GAAP) before interest expense, interest and other income, tax, depreciation and amortization,
gains or losses on the sale of rental property, and loss on impairments. Adjusted EBITDAre further excludes transaction costs, termination income, solar income, revenue
associated with one-time tenant reimbursements of capital expenditures, straight-line rent adjustments, non-cash compensation expense, amortization of above and
below market leases, net, gain (loss) on involuntary conversion, loss on extinguishment of debt, and other non-recurring items.
STAG Industrial, Inc. 27
NON-GAAP FINANCIAL MEASURES & OTHER DEFINITIONS
We define Annualized Adjusted EBITDAre as Adjusted EBITDAre multiplied by four.
We define Run Rate Adjusted EBITDAre as Adjusted EBITDAre plus incremental Adjusted EBITDAre adjusted for a full period of acquisitions and dispositions. Run Rate
Adjusted EBITDAre does not reflect the Company’s historical results and does not predict future results, which may be substantially different.
EBITDAre, Adjusted EBITDAre, and Run Rate Adjusted EBITDAre should not be considered as an alternative to net income (determined in accordance with GAAP) as an
indication of our performance, and we believe that to understand our performance further, EBITDAre, Adjusted EBITDAre, and Run Rate Adjusted EBITDAre should be
compared with our reported net income or net loss in accordance with GAAP, as presented in our consolidated financial statements. We believe that EBITDAre, Adjusted
EBITDAre, and Run Rate Adjusted EBITDAre are helpful to investors as supplemental measures of the operating performance of a real estate company because they are
direct measures of the actual operating results of our properties. We also use these measures in ratios to compare our performance to that of our industry peers.
Fixed Charge Coverage Ratio: We define the Fixed Charge Coverage Ratio as Adjusted EBITDAre divided by cash interest expense, preferred dividends paid and
principal payments.
Funds from Operations (FFO) and Core FFO: We define FFO in accordance with the standards established by the National Association of Real Estate Investment
Trusts (“NAREIT”). FFO represents net income (loss) (computed in accordance with GAAP), excluding gains (or losses) from sales of depreciable operating property,
gains (losses) from sales of land, impairment write-downs of depreciable real estate, real estate related depreciation and amortization (excluding amortization of deferred
financing costs and fair market value of debt adjustment) and after adjustments for unconsolidated partnerships and joint ventures. Core FFO excludes transaction costs,
amortization of above and below market leases, net, loss on extinguishment of debt, gain (loss) on involuntary conversion, gain (loss) on swap ineffectiveness, and non-
recurring other expenses.
None of FFO or Core FFO should be considered as an alternative to net income (determined in accordance with GAAP) as an indication of our performance, and we
believe that to understand our performance further, these measurements should be compared with our reported net income or net loss in accordance with GAAP, as
presented in our consolidated financial statements. We use FFO as a supplemental performance measure because it is a widely recognized measure of the performance
of REITs. FFO may be used by investors as a basis to compare our operating performance with that of other REITs. We and investors may use Core FFO similarly as
FFO.
However, because FFO and Core FFO exclude, among other items, depreciation and amortization and capture neither the changes in the value of our buildings that result
from use or market conditions of our buildings, all of which have real economic effects and could materially impact our results from operations, the utility of these
measures as measures of our performance is limited. In addition, other REITs may not calculate FFO in accordance with the NAREIT definition as we do, and,
accordingly, our FFO may not be comparable to such other REITs’ FFO. Similarly, our calculation of Core FFO may not be comparable to similarly titled measures
disclosed by other REITs.
Liquidity: We define Liquidity as the amount of aggregate undrawn nominal commitments the Company could immediately borrow under the Company’s unsecured debt
instruments, consistent with the financial covenants, plus unrestricted cash balances.
Location Classification: We define primary markets as the markets which have approximately 220 million or more in net rentable square footage. We define secondary
industrial markets as the markets which each have net rentable square footage ranging from approximately 27 million to approximately 220 million. We define tertiary
markets as markets with less than 27 million square feet of net rentable square footage.
STAG Industrial, Inc. 28
NON-GAAP FINANCIAL MEASURES & OTHER DEFINITIONS
Market: We define Market as the market defined by CoStar based on the building address. If the building is located outside of a CoStar defined market, the city and state
is reflected.
Net operating income (NOI), Cash NOI, and Run Rate Cash NOI: We define NOI as rental income, including reimbursements, less property expenses, which excludes
depreciation, amortization, loss on impairments, general and administrative expenses, interest expense, interest income, transaction costs, gain (loss) on involuntary
conversion, loss on extinguishment of debt, gain on sales of rental property, and other expenses.
We define Cash NOI as NOI less straight-line rent adjustments and less amortization of above and below market leases, net.
We define Run Rate Cash NOI as Cash NOI plus Cash NOI adjusted for a full period of acquisitions and dispositions, less cash termination income, solar income and
revenue associated with one-time tenant reimbursements of capital expenditures. Run Rate Cash NOI does not reflect the Company’s historical results and does not
predict future results, which may be substantially different.
We consider NOI, Cash NOI and Run Rate Cash NOI to be appropriate supplemental performance measures to net income because we believe they help us, and
investors understand the core operations of our buildings. None of these measures should be considered as an alternative to net income (determined in accordance with
GAAP) as an indication of our performance, and we believe that to understand our performance further, these measurements should be compared with our reported net
income or net loss in accordance with GAAP, as presented in our consolidated financial statements. Further, our calculations of NOI, Cash NOI and Run Rate NOI may
not be comparable to similarly titled measures disclosed by other REITs.
Non-Recurring Capital Expenditures: We define Non-Recurring Capital Expenditures as capital items for upgrades or items that previously did not exist at a building or
capital items which have a longer useful life, such as roof replacements. Non-Recurring Capital Expenditures funded by parties other than the Company or capital
expenditures reimbursed by tenants in lump sum and Acquisition Capital Expenditures are excluded.
Occupancy Rate: We define Occupancy Rate as the percentage of total leasable square footage for which either revenue recognition has commenced in accordance
with GAAP or the lease term has commenced as of the close of the reporting period, whichever occurs earlier.
Operating Portfolio: We define the Operating Portfolio as all warehouse and light manufacturing assets that were acquired stabilized or have achieved Stabilization. The
Operating Portfolio excludes non-core flex/office assets, assets contained in the Value Add Portfolio, and assets classified at held for sale.
Pipeline: We define Pipeline as a point in time measure that includes all of the transactions under consideration by the Company’s acquisitions group that have passed
the initial screening process. The pipeline also includes transactions under contract and transactions with non-binding LOIs.
Real Estate Cost Basis: We define Real Estate Cost Basis as the book value of rental property and deferred leasing intangibles, exclusive of the related accumulated
depreciation and amortization.
Recurring Capital Expenditures: We define Recurring Capital Expenditures as capital items required to sustain existing systems and capital items which generally have
a shorter useful life. Recurring Capital Expenditures funded by parties other than the Company are excluded.
STAG Industrial, Inc. 29
NON-GAAP FINANCIAL MEASURES & OTHER DEFINITIONS
Renewal Lease: We define a Renewal Lease as a lease signed by an existing tenant to extend the term for 12 months or more, including (i) a renewal of the same space
as the current lease at lease expiration, (ii) a renewal of only a portion of the current space at lease expiration, or (iii) an early renewal or workout, which ultimately does
extend the original term for 12 months or more.
Retention: We define Retention as the percentage determined by taking Renewal Lease square footage commencing in the period divided by square footage of leases
expiring in the period for assets included in the Operating Portfolio.
Same Store: We define Same Store properties as properties that were in the Operating Portfolio for the entirety of the comparative periods presented. Same Store GAAP
NOI and Same Store Cash NOI exclude termination fees, solar income, and revenue associated with one-time tenant reimbursements of capital expenditures.
Stabilization: We define Stabilization for assets under development or redevelopment to occur as the earlier of achieving 90% occupancy or 12 months after completion.
Stabilization for assets that were acquired and immediately added to the Value Add Portfolio occurs under the following:
• if acquired with less than 75% occupancy as of the acquisition date, Stabilization will occur upon the earlier of achieving 90% occupancy or 12 months from the
acquisition date;
• if acquired and will be less than 75% occupied due to known move-outs within two years of the acquisition date, Stabilization will occur upon the earlier of
achieving 90% occupancy after the known move-outs have occurred or 12 months after the known move-outs have occurred.
Value Add Portfolio: We define the Value Add Portfolio as properties that meet any of the following criteria:
• less than 75% occupied as of the acquisition date;
• will be less than 75% occupied due to known move-outs within two years of the acquisition date;
• out of service with significant physical renovation of the asset;
• development.
Weighted Average Lease Term: We define Weighted Average Lease Term as the contractual lease term in years as of the lease start date weighted by square footage.
Weighted Average Lease Term related to acquired assets reflects the remaining lease term in years as of the acquisition date weighted by square footage.