2020 surface water monitoring overview - mass.gov
TRANSCRIPT

1
2020 SURFACE WATER MONITORING OVERVIEW (CN 542.0)
Introduction
The Massachusetts Department of Environmental Protection (MassDEP) Watershed Planning Program (WPP) plans and implements surface water quality monitoring for the state to support various Clean Water Act (CWA) objectives, including reporting on the condition of waters of the state. This report provides a brief overview of the surface water quality monitoring performed in 2020. Information pertaining to the individual components of WPP’s Surface Water Monitoring Program is presented at https://www.mass.gov/service-details/water-quality-monitoring-program#1.
The main programmatic objectives of the WPP surface water quality monitoring program are as follows:
Collect chemical, physical, and biological data to assess the degree to which designated uses, such as aquatic life, primary and secondary contact recreation, fish consumption, and aesthetics, are supported in the waters of the Commonwealth;
Collect data to support analysis and development of total maximum daily loads
(TMDLs) and other plans to reduce pollutant loads to waters of the Commonwealth;
Screen fish tissue in selected waterbodies for select contaminants (metals, PCBs and organochlorine pesticides) to support public health risk assessments;
To the extent feasible, locate pollution sources and promote and facilitate timely
correction;
Identify and assess new and emerging water contaminants of concern;
Collect water quality data to evaluate for trends in parameter concentrations and/or loads;
Collect data to support the establishment or revision of surface water quality standards
and policies; and
Measure the effectiveness of water quality management projects or programs such as the effectiveness of implementing TMDLs or watershed-based plans.
Quality assurance is maintained for WPP’s watershed monitoring program to ensure

2
implementation of an effective and efficient sampling design, to meet programmatic goals and to provide data meeting specific data quality objectives. The U.S. Environmental Protection Agency (USEPA) has approved a comprehensive Quality Assurance Program Plan (QAPP) that applies to the generation and use of surface water quality data by WPP for a five-year period (2020 – 2024). This five-year program QAPP is annually supplemented by project-specific Sampling and Analysis Plans (SAPs), which provide detailed information regarding individual project organization, tasks, background, sampling design and non-direct measurements. More information pertaining to the WPP’s Quality Management Program and the 2020 – 2024 QAPP can be found at https://www.mass.gov/guides/water-quality-monitoring-quality-management-program. The WPP had intended to initiate a new seven-year rotating watershed schedule for targeted assessment monitoring in 2020. However, the Covid-19 virus pandemic led to its postponement until 2021. A revised monitoring plan was developed that could be implemented while adhering to safety guidelines developed for WPP field and laboratory operations during the Covid-19 pandemic. The 2020 monitoring program primarily focused on: 1) Macroinvertebrate sampling to support ongoing biocriteria development activities; and 2) Monitoring of candidate streams for potential designation as cold water fishery resources in the surface water quality standards (SWQS). In addition to these 2020 monitoring activities, long-term monitoring continued in Mount Hope Bay and the Taunton and Connecticut watersheds. Monitoring activities aimed at assessing the impacts of road salt application on surface waters were also continued. These, as well as additional monitoring activities performed in 2020, are described in more detail below.
Monitoring Project Descriptions Biocriteria Development Monitoring (Filling Data Gaps): The WPP is currently developing biocriteria (multimetric indices of biotic integrity) for streams using benthic macroinvertebrate communities. The implementation of biocriteria increases the accuracy and precision of aquatic life use assessments and improves water quality goal-setting processes. Multimetric indices were developed recently for two regions of Massachusetts: the “Western Highlands” and the “Central Hills”. After completing the initial phases of the biocriteria development, it was apparent that gaps existed in the Massachusetts macroinvertebrate dataset that, if filled, would support efforts to refine and improve the accuracy of the biocriteria indices. Biocriteria development monitoring in 2020 focused on high-gradient streams in the “Western Highlands” with high levels of human disturbance. Existing human disturbance gradients were used to select approximately 85 candidate sites meeting the defined disturbance criteria. Macroinvertebrate samples were collected from a total of 71 of the selected sites between July 1 and September 30. Habitat assessments and field observations were also made at each site. Macroinvertebrate samples were delivered to a contractor for processing and taxonomic identifications. The data from this monitoring effort will be used to better characterize the macroinvertebrate communities in highly disturbed streams in the “Western Highlands” and to refine the calibration of the multimetric index for that region. In addition, the data will be used to assess the aquatic life use support status for the sampled streams. A complete list of the sites sampled in 2020 is presented in Appendix A.
Cold Water Fisheries Resource Assessments to Support Surface Water Quality Standards Designations: The WPP has developed protocols for designating cold water fisheries (CWF) in the SWQS. For a particular surface water or segment, fish population data can be used to support proposed Cold Water designation in the SWQS. Temperature and DO data can also be used in the absence of fish population data. Working primarily from the Division of Fisheries and Wildlife’s (DFW) Cold Water Fisheries Resource (CFR) List, the WPP

3
identified water bodies that may have been undesignated or under documented CWF as candidates for field verification in 2020. A total of 61 stream sites in northeastern and central Massachusetts were selected for assessment (see Appendix B). Sondes and data loggers were deployed for up to two months in July and August to obtain continuous temperature and dissolved oxygen data from each site. During that same time, and extending into mid-September, fish population assessments were performed once at each site. Streams that qualify as CWF will be designated as such in the next regulatory review of the SWQS. Fish Toxics Monitoring: The Fish Toxics Monitoring Program is a cooperative effort between MassDEP (WPP and Office of Research and Standards), the Massachusetts Department of Public Health (DPH), and the Department of Fish and Game (DFG). The goal of this monitoring is to provide data for the assessment of the risk to human consumers associated with the consumption of freshwater fish, and most of the fish are collected from waters requested by the public. Fish sampling was performed at four sites in 2020 at the recommendation of the Inter-agency Fish Toxics Committee (Table 1). Edible fillets from fish collected at all four waterbodies were analyzed for the presence of mercury, arsenic, cadmium, and selenium. Samples from Bush Pond were also analyzed for PCB and organochlorine pesticides. If necessary, fish consumption advisories will be issued by DPH. Table 1. 2020 fish toxics monitoring sites.
Watershed
Waterbody (Municipality)
Analytes
Housatonic Plunkett Reservoir (Hinsdale) Hg, As, Cd, Se
Housatonic Ashmere Lake (Hinsdale) Hg, As, Cd, Se
Charles Bush Pond (Norfolk) Hg, As, Cd, Se, PCB arochlors, organochlorine pesticides, % lipids
Islands Hummock Pond (Nantucket) Hg, As, Cd, Se
Lake Monitoring in the Mystic River Watershed: In collaboration with the USEPA, the WPP established a monitoring program in 2019 at three nutrient-impaired lakes in the Mystic River Watershed to provide a more recent assessment of their designated use support status (i.e., Aquatic Life, Recreational, and Aesthetic uses) and to support the calibration of a Lake Loading Response Model (LLRM) as a step toward developing phosphorus TMDLs for these ponds. Horn Pond (Woburn), Spy Pond (Arlington) and Wedge Pond (Winchester) were originally scheduled to be sampled in 2020 but the surveys were postponed due to the Covid-19 pandemic. The work carried out in 2020 was a bathymetry survey of each pond. It is anticipated that water quality monitoring will resume at these three ponds in 2021. Monitoring the Effects on Water Quality of Road-Salt Application: WPP continued to monitor seasonal chloride levels in selected waters at risk of contamination by chlorides originating from road salt application. Continuous conductivity loggers were deployed at twelve sites in the upper Blackstone River Watershed from November/December 2019 through September 2020 (Table 2). This monitoring also included the collection of chloride grab samples to continue to verify and fine-tune (as needed) the accuracy of the specific conductance-chloride regression model developed by WPP. Chloride data will also be used for assessment and may, in the future, support the development of TMDLs for waters impaired by chlorides.

4
Table 2. 2020 chloride and conductivity monitoring sites.
Site ID
Waterbody Name (Municipality)
Latitude
Longitude
Bla01 Weasel Brook (Worcester) 42.30797 -71.80025
Bla02 Poor Farm Brook (Worcester) 42.30648 -71.76585
Bla03 Big Bummet Brook (Grafton) 42.23671 -71.70492
Bla04 Quinsigamond River (Grafton) 42.20836 -71.69757
Bla05 Blackstone River (Grafton) 42.17691 -71.68828
Bla06 Cold Spring Brook (Sutton) 42.17551 -71.72817
Bla07 Singletary Brook (Millbury) 42.18283 -71.76597
Bla08 Unnamed tributary to Indian Lake (Worcester) 42.30793 -71.81955
Bla09 Dark Brook I – Southeast (Auburn) 42.20398 -71.83572
Bla10 Unnamed tributary to Dark Brook (Auburn) 42.19019 -71.84583
Bla11 Dark Brook II - Northwest (Auburn) 42.20659 -71.85269
Bla12 Tatnuck Brook (Worcester) 42.26230 -71.84823
Participation in the Northeast Regional Monitoring Network (RMN): In collaboration with its regional offices, states, tribes, and other entities, the USEPA has established Regional Monitoring Networks (RMNs). The goal of the RMNs is to help EPA and their partners collect current, baseline biological, thermal, and hydrologic data from freshwater wadeable streams. Over time, these data can help facilitate a better understanding of relationships between biological, thermal, and hydrologic data, ecosystem responses and recovery from extreme weather events, and effects of climate change and regional phenomena such as drought and pollutant/nutrient deposition on aquatic ecosystems. As part of the Northeast RMN, MassDEP has established five sites in Massachusetts which have been designated for long-term monitoring for temperature regimes, flow characteristics, and stream macroinvertebrate communities (Table 3). Since 2012 MassDEP has been collecting air and water time-series temperature data, as well as annual macroinvertebrate kick-samples. Time-series streamflow data are obtained from Brown’s and Parkers brooks by the Massachusetts Division of Ecological Restoration. Flow data are available for the other three streams from USGS gages located at or near the RMN sampling sites. Table 3. Northeast Regional Monitoring Network (RMN) sites in Massachusetts
Site ID Watershed Waterbody Description Latitude Longitude
CR01ACC Deerfield Cold River Approximately 70 meters upstream/north of South County Road, Florida.
42.6669
-73.0302
HRCC Farmington Hubbard Brook
Approximately 245 meters upstream/northwest of West Hartland Road, Granville.
42.0654
-72.9675
BB01CC Quinebaug Browns Brook Approximately 645 meters upstream from May Brook Road, Holland
42.0348
-72.1616
WSR01CC Chicopee West Branch Swift River
Approximately 195 meters upstream from Cooleyville Road Extension, Shutesbury
42.4647
-72.3845

5
Table 3. Northeast Regional Monitoring Network (RMN) sites in Massachusetts
Site ID Watershed Waterbody Description Latitude Longitude
PBCC Chicopee Unnamed, known as Parkers Brook
Approximately 160 meters west (downstream) of Coldbrook Road, Oakham (due south of Route 122)
42.3943
-72.0492
Field and Lab Support for the Assessment and Management of Cyanobacteria Blooms: MassDEP provided technical expertise and laboratory support for the investigation of potentially toxic algae (cyanobacteria) blooms. Staff biologists performed cyanobacteria counts and identifications on water samples to determine whether cell counts exceeded MassDPH advisory levels for recreational waters. Only two waterbodies were investigated in 2020 (see Table 4). Table 4. Waterbodies for which MassDEP staff performed cyanobacteria cell counts (C) and
taxonomic identifications (ID) in 2020.
Waterbody
Municipality
Number of
sampling
events
Sample
Processing
East Monponsett Pond Halifax/Hanson 9 C, ID
West Monponsett Pond Halifax/Hanson 2 C, ID
Assessment Monitoring of the Merrimack River Mainstem and Tidal Reaches: Working collaboratively with MassDEP, the USGS performed water quality surveys of the mainstem and tidal reaches of the Merrimack River in Massachusetts to fill data gaps and support water quality assessment and management decision-making. Data will be used to complete updated assessments for four freshwater and two tidal river assessment units (AU) and to evaluate locations in the Merrimack River estuary for potential longer-term seasonal deployment of continuous water quality monitoring equipment. Water samples were collected monthly from May through September at 13 monitoring sites and analyzed for nutrients and chlorophyll-a. During each sampling event, vertical profile data were obtained at 0.5 m increments at each site using multiprobe sensors that recorded depth, temperature, pH, specific conductance, dissolved oxygen, turbidity, salinity and chlorophyll relative fluorescence. Finally, sensor arrays were deployed for two separate one-month intervals at ten of the monitoring sites. Sensors were configured to measure dissolved oxygen and temperature near the surface and bottom at 15-minute intervals. Sampling site locations and variables measured for this monitoring effort are summarized in tables 5 and 6, respectively.
Table 5. Description of sites and corresponding assessment units (AU) surveyed as part of the MassDEP/USGS collaborative monitoring program for the mainstem and tidal reaches of the Merrimack River in Massachusetts.
USGS ID
Site Description
MassDEP AU
010965305 Merrimack River near Tyngsborough Bridge, Tyngsborough MA84A-01
01096568 Merrimack River at Lowell Motor Boat Club, Lowell MA84A-01
010965985 Merrimack River near Aiken Street Bridge, Lowell MA84A-02 01100220 Merrimack River near power lines, Methuen MA84A-03 01100475 Merrimack River at Bashara Boat House, Lawrence MA84A-03 01100671 Merrimack River downstream Stanley Island, Haverhill MA84A-04

6
Table 5. Description of sites and corresponding assessment units (AU) surveyed as part of the MassDEP/USGS collaborative monitoring program for the mainstem and tidal reaches of the Merrimack River in Massachusetts.
01100806 Merrimack River near power lines, Merrimac MA84A-05 01100823 Merrimack River at Goodwin Creek Marina, Amesbury MA84A-06 01100871 Merrimack River at Bridge Marina, Salisbury MA84A-06 01100873 Merrimack River estuary near Buoy 16, Newburyport MA84A-06 01100874 Merrimack River estuary near Lunt Rock, Salisbury* MA84A-06 01100875 Merrimack River estuary near Salisbury Beach State Park* MA84A-06 01100877 Merrimack River estuary near Plum Island, Newburyport* MA84A-06
*Continuous temperature and dissolved oxygen sensor arrays were not deployed at these sites.
Table 6. Sampling frequency of water quality variables measured as part of the MassDEP/USGS collaborative monitoring program for the mainstem and tidal reaches of the Merrimack River in Massachusetts.
Sample
Type Variable
Sample Frequency
Discrete
Vertical depth profiles (sensor depth, temperature, pH, specific conductance, dissolved oxygen, turbidity, salinity and chlorophyll relative fluorescence)
Monthly (May - September)
Nutrients [Ammonia-nitrogen, Nitrate+Nitrite nitrogen, Nitrite-nitrogen, Total particulate nitrogen, Total nitrogen (filtered), Total phosphorus (filtered and unfiltered), Orthophosphate]
Monthly (May - September)
Total particulate carbon Monthly (May - September)
Chlorophyll a Monthly (May - September)
One-month Continuous (surface and bottom)
Dissolved oxygen Twice
Temperature Twice
Barometric pressure (estuarine sites) Twice
Specific conductance Twice
Monitoring to Estimate Contaminant Loadings: Massachusetts’ long-term monitoring strategy identifies, as one of its key monitoring objectives, monitoring to support the development, implementation and evaluation of pollution control strategies, and indicates that “limited fixed-site monitoring may be required to quantify pollutant loadings.” In 2017-2018 the USGS installed a flow monitoring station in the Connecticut River near Northfield, MA (USGS Station 01161280) and initiated weekly water-quality sampling to provide data for the estimation of nutrient loads entering Massachusetts from upstream sources. In addition, the water-quality sampling frequency was increased to weekly at the USGS monitoring station in the Connecticut River at Thompsonville CT (USGS Station 01184000) to refine estimates of nutrient loads leaving Massachusetts. Funded collaboratively by the Springfield Water and Sewer Commission, MassDEP, and USGS, this monitoring study will increase understanding of the nutrient contributions from Massachusetts to Long Island Sound. Additionally, since 2018, MassDEP has been collaborating with USGS and funding water-quality sampling at existing USGS flow gage stations located near the confluence of each of the Deerfield, Millers, Chicopee and Westfield rivers with the Connecticut River. Monitoring these locations will assist in prioritizing areas for nitrogen load reductions and making informed nutrient management decisions.

7
MassDEP has also been collaborating with USGS and funding water-quality sampling in the Taunton River Watershed (at existing USGS flow gage stations in the Taunton, Threemile, Mill, and Segreganset rivers) to quantify nutrient loadings to the lower Taunton River and Mount Hope Bay (see Monitoring Water Quality in Mount Hope Bay below). Finally, plans are in development to initiate a sampling network in 2021 to estimate contaminant loadings in the Merrimack River Watershed to inform updated water quality assessments and to support future calibration and verification of simulation models to be used in TMDL development. Monitoring Water Quality in Mount Hope Bay: MassDEP maintains two YSI marine water quality monitoring buoys in the Massachusetts portion of Mount Hope Bay (MHB) that are part of the more extensive Narragansett Bay Fixed-Site Monitoring Network (NBFSMN) currently administered by the Rhode Island Department of Environmental Management (RIDEM) and the University of Rhode Island Graduate School of Oceanography (URI). Data from the MHB buoys are helping to define ambient water quality conditions for dissolved oxygen, nitrate-nitrogen, algal abundance, temperature, and other parameters. Specifically, the data may be used to assess trends over time, identify impaired waters, assess the effectiveness of management decisions (i.e., wastewater treatment facilities (WWTF) upgrades, TMDL efforts, and stormwater management), and support refinement, calibration, and validation of water quality models. During the deployment of the buoys (May-November) grab water samples were collected for chemical analysis every two weeks at each buoy location within one meter of the deployed sensors. Instantaneous grab sample data will be compared to corresponding sensor data to validate the accuracy of sensor measurements. MassDEP’s long-term plan for the buoys is to continue collecting continuous, real-time data seasonally in coastal systems to address data gaps and aid management decisions. Massachusetts Coastal Condition Assessment (MCCA): The EPA encourages states to adopt networks of randomly selected sampling sites that will allow for statistically unbiased assessments that can be applied at larger scales (e.g., statewide). During 2011 – 2015 the WPP surface water monitoring program carried out probabilistic monitoring and assessment surveys of Massachusetts' shallow streams. This was followed by a statistically-valid (probabilistic) sampling program for Massachusetts’ lakes and ponds from 2016 – 2018. In 2019, a probabilistic monitoring network was designed with the overall goal of providing an unbiased assessment of the condition of Massachusetts coastal and estuarine waters. Known as the Massachusetts Coastal Condition Assessment, or MCCA, this network was designed to obtain the data needed to assess a waterbody’s level of attainment of a single designated use: “suitable habitat for Fish, other Aquatic Life and Wildlife” (i.e., Aquatic Life). The random sampling design allows for the determination, with a known statistical confidence, of the percentage of coastal waters that are supporting and not supporting this use. Additionally, the MCCA will establish a baseline to measure trends in conditions through future surveys. The MCCA is administered collaboratively by the Massachusetts Department of Environmental Protection (MassDEP) and the Massachusetts Bays National Estuary Partnership (MassBays). MassBays serves as the field project lead to manage the collection and analysis of field samples and data for the MCCA. A total of 90 coastal and estuarine sites will be monitored from 2020 – 2023. Field surveys began in 2020 with a pilot study consisting of 15 sampling sites (Table 7). A contractor was selected to perform sample collection and record ambient data at each site once per month from June through September. During each sampling event field crews recorded ambient environment conditions, collected water column profile data, and collected water samples from each site. Sediment samples for chemical analyses and the assessment of the

8
benthic infauna community were collected once at each site. The presence/absence of eelgrass was surveyed once in July at all 15 stations. Water quality and ecological variables measured at each MCCA monitoring site are listed along with their sampling frequencies in Table 8.
Table 7. Location of coastal and estuarine sampling sites included in the 2020 MCCA Pilot Study. Ctrl+Click on the Site ID to follow link to site map.
Site ID General Location Latitude Longitude
MAP2E-015 Nahant Bay 42.445780 -70.930086
MAP2E-019 Salem Sound 42.532229 -70.795811
MAP2E-023 Nahant Bay 42.433383 -70.909717
MAP2E-028 Magnolia Point 42.572127 -70.712727
MAP2E-030 Salem Sound 42.535147 -70.894588
MAP2E-093 Plymouth Bay 41.936000 -70.550864
MAP2E-097 Plymouth Bay 41.946614 -70.609555
MAP2E-101 Plymouth Bay 41.980740 -70.605467
MAP2E-105 Duxbury Bay 42.039644 -70.649977
MAP2E-113 Plymouth Bay 42.000959 -70.616377
MAP2E-186 Wild Harbor 41.637399 -70.650415
MAP2E-190 Sippican Harbor 41.668567 -70.728566
MAP2E-194 Wareham River 41.741721 -70.701577
MAP2E-202 Phinney Harbor 41.709491 -70.629730
MAP2E-206 Aucoot Cove 41.672874 -70.758260
Table 8. Sampling frequency of water quality and ecological variables measured at each of fifteen coastal and estuarine sites during the 2020 MCCA Pilot Study.
Medium Variable
Sample Frequency
Water
Vertical profile (Temperature, Salinity, Dissolved oxygen, pH, Turbidity)
Monthly (June, July, August)
Light attenuation/PAR Monthly (June, July, August)
Water clarity/Secchi depth Monthly (June, July, August)
Nutrients (Total phosphorus, Orthophosphate, Total nitrogen, Dissolved inorganic nitrogen, Total Kjeldahl nitrogen)
Monthly (June, July, August)
Chlorophyll a Monthly (June, July, August)
Sediment
Grain size Once (July)
Total organic carbon Once (July)
Chemistry (metals, mercury, PAHs, PCBs, organochlorine pesticides)
Once (July)
Toxicity (estuarine amphipod, Leptocheirus plumulosus) Once (July)
Biological Benthic macroinvertebrates Once (August)
Submerged aquatic vegetation Once (July)
9
Pleasant Bay TMDL Effectiveness Monitoring Study: MassDEP retained a contractor to carry out benthic invertebrate sampling in Pleasant Bay (Brewster/Chatham/Harwich/Orleans) in September 2020 as part of a post-TMDL assessment of the ecological health of the bay. The data will be used to re-evaluate habitat conditions after TMDL implementation activities including wastewater treatment system upgrades and sewer system construction which resulted in the reduction of nitrogen loading in the watershed. The monitoring study was designed to verify that the 2018 Marine Benthic Monitoring Guidance documents developed by MassDEP will produce quality benthic data that 1) will allow coastal communities to assess current embayment health, 2) are comparable between assessments and embayments, and 3) will aid in future management decisions. The sampling plan included 34 benthic grab sampling locations, sediment grain size analysis, total organic carbon, digital video and photographs of the bottom, and water quality measurement profiles (water temperature, DO, salinity, and pH). PFAS Sampling in Rivers and Streams in Massachusetts: Through a joint-funded project with MassDEP, USGS performed water sampling for the analysis of twenty-four (24) individual per- and polyfluoroalkyl substances (PFAS) at 64 river sites in Massachusetts. Samples were collected upstream and downstream from the effluent discharges of 25 municipal or institutional wastewater treatment facilities and from 15 additional stream locations, including sites downstream of industrial or populated areas, as well as sites in less developed watersheds where sources of PFAS were unlikely to be present. To minimize the potential effects from stormwater runoff, sample collection targeted base-flow (dry-weather, low-flow) conditions. The study comprised three rounds of sample collection yielding approximately 192 environmental samples and 50 QC samples (blanks and replicates). Monitoring sites are presented in Appendix C.
Summary
This document presents a brief overview of the surface water monitoring performed by the WPP in 2020. Several laboratories and contractors process and analyze the water and biological samples collected. The WPP will continue to work with these laboratories to receive the data and complete a rigorous data validation process to ensure that the prescribed data quality objectives are met. Final data will be published on MassDEP’s website. Planning is currently underway for monitoring in 2021.

10
Appendices
Appendix A. This table presents the 71 stream sites sampled in 2020 by personnel of MassDEP’s Watershed Planning Program in an effort to expand the dataset on macroinvertebrate communities occurring at highly disturbed streams in the “Western Highlands” region of Massachusetts. Ctrl+Click on the Site ID to follow link to site map.
Site ID Waterbody Name Watershed Town Latitude Longitude
WH006 MBr. Westfield River Westfield Huntington 42.25952 -72.87692
WH007 Kinderhook Creek Hudson Hancock 42.53896 -73.33335
WH014 NBr. Manhan River Connecticut Westhampton 42.29980 -72.74344
WH017 Town Brook Housatonic Lanesborough 42.52846 -73.23374
WH019 Wahconah Falls Brook Housatonic Dalton 42.48544 -73.13995
WH020 Wahconah Falls Brook Housatonic Dalton 42.48612 -73.13700
WH021 Daniels Brook Housatonic Pittsfield 42.49002 -73.27497
WH022 Wahconah Falls Brook Housatonic Dalton 42.48481 -73.14801
WH024 Onota Brook Housatonic Pittsfield 42.46445 -73.25494
WH025 EBr. Housatonic River Housatonic Pittsfield 42.46801 -73.20036
WH026 EBR. Housatonic River Housatonic Dalton 42.46874 -73.18213
WH027 Barton Brook Housatonic Pittsfield 42.46355 -73.19819
WH032 SWBr. Housatonic River Housatonic Pittsfield 42.44115 -73.29898
WH033 Jacoby Brook Housatonic Pittsfield 42.43969 -73.30244
WH034 SWBr. Housatonic River Housatonic Pittsfield 42.43973 -73.29343
WH035 WBr. Housatonic River Housatonic Pittsfield 42.44614 -73.26206
WH036 WBr. Housatonic River Housatonic Pittsfield 42.45148 -73.26239
WH037 WBr. Housatonic River Housatonic Pittsfield 42.44115 -73.26013
WH038 SWBr. Housatonic River Housatonic Pittsfield 42.44013 -73.27120
WH039 SWBr. Housatonic River Housatonic Pittsfield 42.44177 -73.27824
WH040 SWBr. Housatonic River Housatonic Pittsfield 42.43478 -73.30530
WH047 Cone Brook Housatonic West Stockbridge 42.34831 -73.36513
WH049 Larrywaug Brook Housatonic Stockbridge 42.31372 -73.33185
WH050 Goose Pond Brook Housatonic Lee 42.29402 -73.23964
WH056 Green River Housatonic Great Barrington 42.19072 -73.39965
WH057 Green River Housatonic Great Barrington 42.17855 -73.37814
WH058 Green River Housatonic Great Barrington 42.16376 -73.36525
WH061 Konkapot River Housatonic Sheffield 42.05408 -73.33427
WH064 Konkapot River Housatonic New Marlborough 42.07602 -73.28281
WH065 WBr. Housatonic River Housatonic Pittsfield 42.46396 -73.25323
WH066 WBr. Housatonic River Housatonic Pittsfield 42.46668 -73.25056
WH067 WBr. Housatonic River Housatonic Pittsfield 42.46930 -73.24925
WH068 WBr. Housatonic River Housatonic Pittsfield 42.47441 -73.24602
WH069 WBr. Housatonic River Housatonic Pittsfield 42.48250 -73.24689
WH070 EBr. Housatonic River Housatonic Pittsfield 42.43706 -73.24775

11
Appendix A. This table presents the 71 stream sites sampled in 2020 by personnel of MassDEP’s Watershed Planning Program in an effort to expand the dataset on macroinvertebrate communities occurring at highly disturbed streams in the “Western Highlands” region of Massachusetts. Ctrl+Click on the Site ID to follow link to site map.
Site ID Waterbody Name Watershed Town Latitude Longitude
WH071 EBr. Housatonic River Housatonic Pittsfield 42.44077 -73.24808
WH072 EBr. Housatonic River Housatonic Pittsfield 42.44270 -73.24646
WH077 Housatonic River Housatonic Lee 42.31370 -73.24689
WH078 Housatonic River Housatonic Lee 42.32296 -73.24216
WH079 Housatonic River Housatonic Lee 42.29378 -73.24161
WH080 Housatonic River Housatonic Lee 42.30338 -73.25068
WH081 Housatonic River Housatonic Lee 42.28337 -73.24086
WH082 Willow Brook Housatonic Lee 42.28337 -73.24729
WH084 Seekonk Brook Housatonic Great Barrington 42.21348 -73.39197
WH088 Onota Brook Housatonic Pittsfield 42.46968 -73.25650
WH089 SWBr. Housatonic River Housatonic Pittsfield 42.43994 -73.28895
WH091 Glen Brook Deerfield Leyden 42.67868 -72.62892
WH093 Hinsdale Brook Deerfield Shelburne 42.63169 -72.65607
WH095 Clesson Brook Deerfield Buckland 42.60170 -72.77793
WH096 Dragon Brook Deerfield Shelburne 42.57791 -72.68462
WH097 UBr. Clesson Brook Deerfield Ashfield 42.55487 -72.80962
WH098 South River Deerfield Ashfield 42.51072 -72.77398
WH100 South River Deerfield Conway 42.51623 -72.74638
WH103 Hemlock Brook Hudson Williamstown 42.72550 -73.20740
WH104 Hoosic River Hudson Williamstown 42.72871 -73.20692
WH105 Hoosic River Hudson Williamstown 42.73027 -73.21564
WH106 Hemlock Brook Hudson Williamstown 42.71939 -73.20967
WH109 Hoosic River Hudson North Adams 42.70404 -73.17363
WH110 Hoosic River Hudson North Adams 42.69984 -73.16141
WH111 Paull Brook Hudson Williamstown 42.70385 -73.17689
WH112 Green River Hudson Williamstown 42.67436 -73.23235
WH113 WBr. Green River Hudson Williamstown 42.66013 -73.24149
WH115 Hoosic River Hudson Adams 42.63996 -73.10859
WH119 Green River Hudson Williamstown 42.71029 -73.19413
WH120 Green River Hudson Williamstown 42.70560 -73.19925
WH121 Green River Hudson Williamstown 42.69107 -73.20127
WH122 Hoosic River Hudson North Adams 42.70298 -73.12374
WH123 Sweet Brook Hudson Williamstown 42.68585 -73.23118
WH124 Unnamed Tributary Hudson Adams 42.60745 -73.12563
WH125 EBr. Housatonic River Housatonic Hinsdale 42.44764 -73.13050
WH200 Hoosic River Hudson North Adams 42.69678 -73.14003

12
Appendix B. This table presents the 61 stream sites sampled in 2020 by personnel of MassDEP’s Watershed Planning Program in an effort to verify cold water fisheries (CWF) for designation in the Massachusetts Surface Water Quality Standards (SWQS).
Waterbody Name Watershed Latitude Longitude
Fox Brook Blackstone 42.02820 -71.54040
Round Top Brook Blackstone 42.00792 -71.70506
Emerson Brook Blackstone 42.04626 -71.63013
Rock Meadow Brook Blackstone 42.09246 -71.59144
Miscoe Brook (1) Blackstone 42.12288 -71.59914
Miscoe Brook (2) Blackstone 42.22538 -71.65267
Steamburg Brook Blackstone 42.10853 -71.69456
UNT to Wellman Brook Blackstone 42.07256 -71.70276
Axtell Brook Blackstone 42.22356 -71.68764
Coal Mine Brook Blackstone 42.29070 -71.76730
Poor Farm Brook Blackstone 42.30650 -71.76600
Sewall Brook Blackstone 42.32472 -71.74141
Tatnuck Brook Blackstone 42.26072 -71.84794
Silver Spring Brook Blackstone 42.30550 -71.87770
Mill Brook Boston Harbor 42.18920 -71.24016
Purgatory Brook Boston Harbor 42.20928 -71.18480
Dix Brook Charles 42.06030 -71.42140
Seaverns Brook Charles 42.34154 -71.26663
Cherry Brook Charles 42.38896 -71.29708
Fuller Brook Chicopee 42.16320 -72.53470
UNT to Higher Brook Chicopee 42.18858 -72.45233
Broad Brook (2) Chicopee 42.21049 -72.40260
Blodgett Mill Brook Chicopee 42.17390 -72.25330
O'Neil Brook Chicopee 42.22285 -72.22523
Meadow Brook Chicopee 42.28937 -72.12806
Sucker Brook (2) Chicopee 42.29793 -72.11710
Sevenmile River Chicopee 42.26514 -72.00530
Cranberry River Chicopee 42.21653 -72.00015
Turkey Hill Brook Chicopee 42.27080 -71.98280
Fivemile River Chicopee 42.33886 -72.03408
Maynard Brook Chicopee 42.33175 -72.05032
Murdock Brook Chicopee 42.21659 -72.37554
Chaffee Brook Chicopee 42.33666 -72.36874
UNT to Quabbin (Dickey Brook) Chicopee 42.44412 -72.37156
Prescott Brook Chicopee 42.36452 -72.32489
Giles Brook Chicopee 42.50354 -72.31803

13
Appendix B. This table presents the 61 stream sites sampled in 2020 by personnel of MassDEP’s Watershed Planning Program in an effort to verify cold water fisheries (CWF) for designation in the Massachusetts Surface Water Quality Standards (SWQS).
Manning Brook Chicopee 42.51855 -72.31728
East Branch Swift River Chicopee 42.43775 -72.20826
UNT to East Branch Swift River (McManus Brook)
Chicopee 42.45200 -72.16650
Muddy Brook Chicopee 42.35630 -72.23090
Danforth Brook (2) Chicopee 42.31551 -72.20667
Fish Brook Chicopee 42.31604 -72.18082
Moose Brook Chicopee 42.41375 -72.14289
Pratt Brook Chicopee 42.37749 -72.10762
Burrow Brook Chicopee 42.37476 -72.08738
Natty Pond Brook Chicopee 42.45145 -72.02946
East Branch Ware River Chicopee 42.41615 -72.00791
UNT to East Branch Ware River Chicopee 42.44674 -71.93977
Run Brook Concord 42.38603 -71.43967
Dugan Brook Concord 42.44790 -71.37850
Wickett Brook Millers 42.55699 -72.42509
Shingle Swamp Brook Millers 42.55640 -72.30080
Lawrence Brook Millers 42.68350 -72.17190
Rich Brook Millers 42.62957 -72.16371
Thousand Acre Brook Millers 42.60698 -72.16342
Chickering Brook Millers 42.55493 -72.12750
Bailey Brook Millers 42.58925 -72.03684
Asnebumskit Brook Nashua 42.35240 -71.89120
Pearl Hill Brook Nashua 42.58519 -71.77108
Baker Brook Nashua 42.56351 -71.76140
Catacoonamug Brook Nashua 42.56710 -71.69660
14
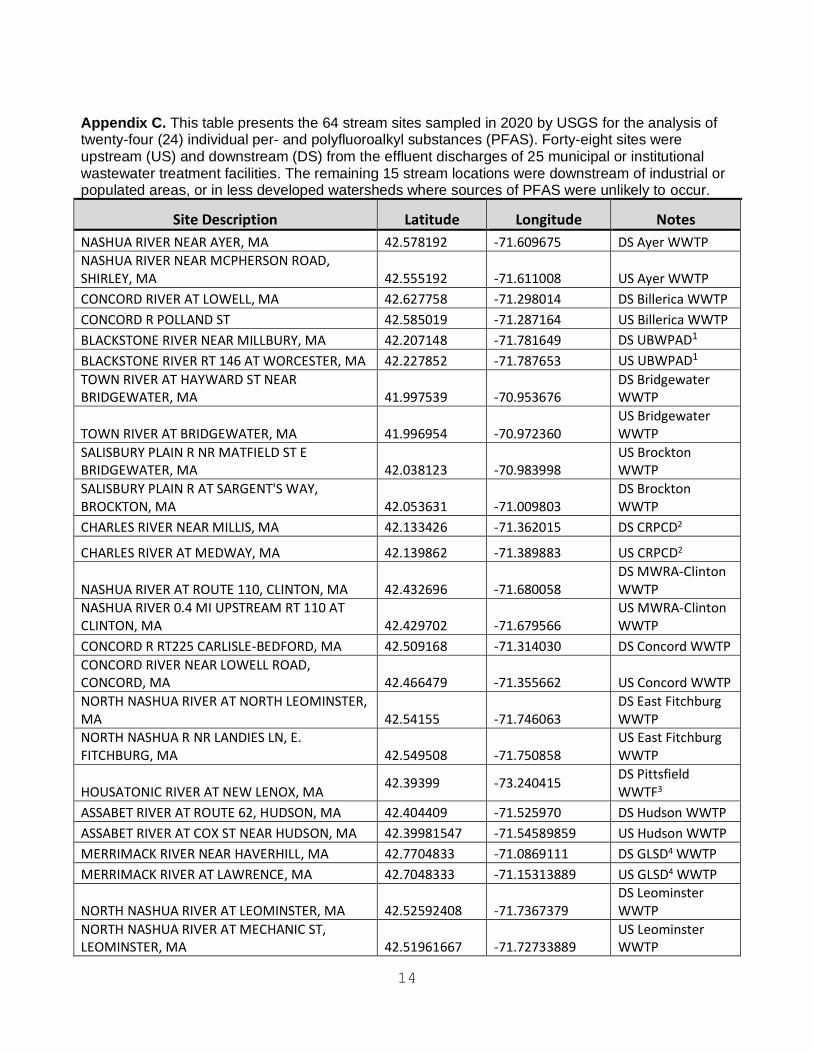
Appendix C. This table presents the 64 stream sites sampled in 2020 by USGS for the analysis of twenty-four (24) individual per- and polyfluoroalkyl substances (PFAS). Forty-eight sites were upstream (US) and downstream (DS) from the effluent discharges of 25 municipal or institutional wastewater treatment facilities. The remaining 15 stream locations were downstream of industrial or populated areas, or in less developed watersheds where sources of PFAS were unlikely to occur.
Site Description Latitude Longitude Notes
NASHUA RIVER NEAR AYER, MA 42.578192 -71.609675 DS Ayer WWTP
NASHUA RIVER NEAR MCPHERSON ROAD, SHIRLEY, MA 42.555192 -71.611008 US Ayer WWTP
CONCORD RIVER AT LOWELL, MA 42.627758 -71.298014 DS Billerica WWTP
CONCORD R POLLAND ST 42.585019 -71.287164 US Billerica WWTP
BLACKSTONE RIVER NEAR MILLBURY, MA 42.207148 -71.781649 DS UBWPAD1
BLACKSTONE RIVER RT 146 AT WORCESTER, MA 42.227852 -71.787653 US UBWPAD1
TOWN RIVER AT HAYWARD ST NEAR BRIDGEWATER, MA 41.997539 -70.953676
DS Bridgewater WWTP
TOWN RIVER AT BRIDGEWATER, MA 41.996954 -70.972360 US Bridgewater WWTP
SALISBURY PLAIN R NR MATFIELD ST E BRIDGEWATER, MA 42.038123 -70.983998
US Brockton WWTP
SALISBURY PLAIN R AT SARGENT'S WAY, BROCKTON, MA 42.053631 -71.009803
DS Brockton WWTP
CHARLES RIVER NEAR MILLIS, MA 42.133426 -71.362015 DS CRPCD2
CHARLES RIVER AT MEDWAY, MA 42.139862 -71.389883 US CRPCD2
NASHUA RIVER AT ROUTE 110, CLINTON, MA 42.432696 -71.680058 DS MWRA-Clinton WWTP
NASHUA RIVER 0.4 MI UPSTREAM RT 110 AT CLINTON, MA 42.429702 -71.679566
US MWRA-Clinton WWTP
CONCORD R RT225 CARLISLE-BEDFORD, MA 42.509168 -71.314030 DS Concord WWTP
CONCORD RIVER NEAR LOWELL ROAD, CONCORD, MA 42.466479 -71.355662 US Concord WWTP
NORTH NASHUA RIVER AT NORTH LEOMINSTER, MA 42.54155 -71.746063
DS East Fitchburg WWTP
NORTH NASHUA R NR LANDIES LN, E. FITCHBURG, MA 42.549508 -71.750858
US East Fitchburg WWTP
HOUSATONIC RIVER AT NEW LENOX, MA 42.39399 -73.240415
DS Pittsfield WWTF3
ASSABET RIVER AT ROUTE 62, HUDSON, MA 42.404409 -71.525970 DS Hudson WWTP
ASSABET RIVER AT COX ST NEAR HUDSON, MA 42.39981547 -71.54589859 US Hudson WWTP
MERRIMACK RIVER NEAR HAVERHILL, MA 42.7704833 -71.0869111 DS GLSD4 WWTP
MERRIMACK RIVER AT LAWRENCE, MA 42.7048333 -71.15313889 US GLSD4 WWTP
NORTH NASHUA RIVER AT LEOMINSTER, MA 42.52592408 -71.7367379 DS Leominster WWTP
NORTH NASHUA RIVER AT MECHANIC ST, LEOMINSTER, MA 42.51961667 -71.72733889
US Leominster WWTP

15
Appendix C. This table presents the 64 stream sites sampled in 2020 by USGS for the analysis of twenty-four (24) individual per- and polyfluoroalkyl substances (PFAS). Forty-eight sites were upstream (US) and downstream (DS) from the effluent discharges of 25 municipal or institutional wastewater treatment facilities. The remaining 15 stream locations were downstream of industrial or populated areas, or in less developed watersheds where sources of PFAS were unlikely to occur.
Site Description Latitude Longitude Notes
MERRIMACK R AT ABE BASHARA BOAT HOUSE LAWRENCE, MA 42.69291666 -71.17661111
DS Gr. Lowell WWTP
MERRIMACK RIVER BL CONCORD RIVER AT LOWELL, MA 42.64592464 -71.2983937
US Gr. Lowell WWTP
SEWAGE BROOK NEAR MARLBOROUGH, MA 42.350888 -71.490878 DS Marlborough Easterly WWTP
WARD BROOK NEAR MARLBOROUGH, MA 42.35203856 -71.4947859 US Marlborough Easterly WWTP
ASSABET RIVER, DS MARLBOROUGH WWTP 42.34520556 -71.6142667 DS Marlborough Westerly WWTP
ASSABET RIVER AT BOUNDARY ST. NR NORTHBOROUGH, MA 42.3414824 -71.6159002
US Marlborough Westerly WWTP
ASSABET R POWDERMILL RD ACTON, MA 42.440688 -71.429196 DS Maynard WWTP
ASSABET RIVER AT MAYNARD, MA 42.432038 -71.4497848 US Maynard WWTP
SAWMILL BROOK AT ROUTE 28, BRIDGEWATER, MA 41.948906 -70.968574
DS MCI Bridgewater
SAWMILL BROOK AT CONANT ST BRIDGEWATER, MA 41.94901944 -70.9683361
US MCI Bridgewater
ASSABET RIVER AT RT 2 NEAR CONCORD, MA 42.466253 -71.390669 DS MCI Concord ASSABET RIVER AT MAIN ST NEAR CONCORD, MA 42.456557 -71.389955 US MCI Concord
THREEMILE RIVER AT NORTON AVE, TAUNTON, MA 41.933303 -71.154267
DS MFNRWD5 WWTP
THREEMILE RIVER AT CRANE ST, TAUNTON, MA 41.946758 -71.160412 US MFNRWD5 WWTP
NEMASKET RIVER AT PLYMOUTH ST, MIDDLEBOROUGH, MA 41.921878 -70.923362
DS Middleborough WWTP
NEMASKET R AT OLIVER MILL PARK, MIDDLEBOROUGH, MA 41.907009 -70.913628
US Middleborough WWTP
CHARLES RIVER AT MELLON STREET, MILFORD, MA 42.116912 -71.501376 DS Milford WWTP
CHARLES RIVER AT MILFORD SEWER PLANT, MILFORD, MA 42.119908 -71.507000 US Milford WWTP NASHUA RIVER DS PEPPERELL WWTF, PEPPERELL, MA 42.67585556 -71.55976389
DS Pepperell WWTP
NASHUA RIVER US PEPPERELL WWTF, PEPPERELL, MA 42.672973 -71.563149
US Pepperell WWTP
TAUNTON RIVER DS WWTF, TAUNTON, MA 41.8715611 -71.1025556 DS Taunton WWTP

16
Appendix C. This table presents the 64 stream sites sampled in 2020 by USGS for the analysis of twenty-four (24) individual per- and polyfluoroalkyl substances (PFAS). Forty-eight sites were upstream (US) and downstream (DS) from the effluent discharges of 25 municipal or institutional wastewater treatment facilities. The remaining 15 stream locations were downstream of industrial or populated areas, or in less developed watersheds where sources of PFAS were unlikely to occur.
Site Description Latitude Longitude Notes
TAUNTON RIVER US WWTF, TAUNTON, MA 41.87751389 -71.0934333 US Taunton WWTP
ASSABET RIVER DS FROM WESTBOROUGH WTP AT ROUTE 9 42.2833333 -71.6386111
DS Westborough WWTP
ASSABET RIVER NEAR WESTBOROUGH, MA 42.2795385 -71.63812279 US Westborough WWTP
BASHBISH BROOK NEAR MT. WASHINGTON, MA 42.106819 -73.482548 --
CHICOPEE RIVER AT INDIAN ORCHARD, MA 42.160549 -72.510558 --
COLD RIVER NEAR CHARLEMONT, MA 42.636282 -72.934349 --
DEERFIELD R, STILLWATER BR, AT WEST DEERFIELD, MA
42.526753 -72.632589 --
WEST BRANCH FARMINGTON RIVER NEAR NEW BOSTON, MA 42.078861 -73.072883 --
GREEN RIVER NEAR GREENFIELD, MA 42.645778 -72.619166 --
HOOSIC RIVER AT WILLIAMSTOWN, MA 42.702957 -73.167689 --
HOOSIC RIVER NEAR GROVE STREET, ADAMS, MA
42.600574 -73.138151 --
HOUSATONIC RIVER NEAR GREAT BARRINGTON, MA 42.23191667 -73.3546667
--
MILLERS RIVER AT BRIDGE STREET, MILLERS FALLS, MA
42.580185 -72.496861 --
SHAWSHEEN RIVER AT BRIDGE STREET NR TEWKSBURY, MA 42.5946527 -71.1952
--
STILLWATER RIVER AT WEST STERLING, MA 42.44675787 -71.818128 --
WARE RIVER NEAR PALMER, MA. 42.20461944 -72.3186111 --
WESTFIELD RIVER AT HUNTINGTON, MA 42.2256454 -72.8706533 --
WESTFIELD RIVER AT BRIDGE ST AT NORTH AGAWAM, MA 42.09944444 -72.6363056
--
Notes: 1Upper Blackstone Pollution Abatement District 2Charles River Pollution Control District 3No upstream site for Pittsfield WWTP 4Greater Lawrence Sanitary District 5Mansfield/Foxborough/Norton Regional Wastewater District