2021 compensation survey report of not-for-profit
TRANSCRIPT

2021 Compensation Survey Report of Not-For-Profit Organizations
SAMPLE

TABLE OF CONTENTS Page Page
I. About Compensation Resources 1 Finance/Audit II. Study Background 2 Finance Director 23III. Definitions and Reporting 3 Controller 24IV. Participant Demographics 5 Accounting Manager 25V. Survey Results 6 Accountant 26
Financial Analyst 27Executive Accounting Assistant 28
78 Grantmaking
9 4216
Grantmaking Manager Grant Writer 42
1016 Human Resources 11 Human Resources Director 2912 Human Resources Manager 4313 Human Resources Generalist 3014 Human Resources Coordinator 4316 Benefits Manager 4317 Benefits Coordinator 44
Overal Findings Executive Director/Top Executive Deputy Executive Director/Top Operations Executive Chief of Staff Top Communications Executive Top Compliance Executive Top Development Executive Top Financial Executive Top Human Resources Executive Top Information Executive Top Legal Executive/General Counsel Top Marketing Executive Top Programs Executive 15 Recruiter 31
Trainer 44Communications
Communications Director 18 Information Technology Communications Manager 19 Information Technology Director 32Communications Coordinator 20 Information Technology Manager 33
Help Desk Coordinator 34Compliance Network Administrator 44
Compliance Director 41 Programmer/Analyst 45Compliance Manager 41 Systems Administrator 35Compliance Coordinator 41 Web Developer 45
Development Development Director 21Development Officer 42Development Coordinator 22SAMPLE

Page Legal
Staff Attorney 45Paralegal 46
Marketing Marketing Director 46Marketing Manager 46Marketing Coordinator 47
Major Gifts Major Gifts Officer 47
Membership Membership Director 47Membership Manager 48Membership Coordinator 48
Programs Program Director 36Program Manager 37Program Coordinator 38
Other Administrative Assistant 39Call Center/Customer Service Manager 48Call Center/Customer Service Representative 49Case Manager 49Education Director 49Executive Assistant to Top Executive 40Social Worker BSW 50Social Worker MSW 50Volunteer Manager 50
VI. Compensation and Benefits Practices 51VII. List of Survey Participants 62SAMPLE

I. About Compensation Resources
EA Compensation Resources LLC, an EisnerAmper Group Company (“Compensation Resources”), provides compensation and human resource consulting services to mid- and small-cap public companies, private, family-owned, and closely-held firms, as well as not-for-profit organizations. Compensation Resources specializes in executive compensation, sales compensation, pay-for-performance and incentive compensation, and performance management programs.
For more information on our services, please contact:
Sean Gimpel Mary A. Rizzuti, CCP, PHR, SHRM-CP
Office Senior Manager Managing Director
[email protected] [email protected]
310 Route 17 North Upper Saddle River, NJ 07458
(201) 934-0505(201) 934-0737 (Fax)
www.compensationresources.com
Copyright © 2021 Compensation Resources All Rights Reserved. No part of the report may be reproduced, stored in a retrieval system, or transmitted, in any form or by any means, electronic, mechanical, photocopying, recording, or otherwise, without prior written permission of Compensation Resources.
This survey has been prepared based on the responses received by Compensation Resources. Although Compensation Resources believes that the data provided by participants was reliable and representative of the practices within responding organizations, the survey results are provided for informational purpose only and without warranty of any kind. The results represented in this survey report should be considered in light of your organization’s mission, business plan, strategy, competitive position and the manner in which the information contained herein supports its direction. Compensation Resources encourages you to use this report in concert with additional sources of information in order to validate all results. This report and its contents are confidential and for the sole use of the purchasing organization, and you agree that it will not be reproduced or disclosed to anyone or any entity outside of your organization.
2021 COMPENSATION SURVEY REPORT OF NOT-FOR-PROFIT ORGANIZATIONS
1
SAMPLE
II. Study Background
Compensation Resources is pleased to present the 2021 Compensation Survey Report of Not-For-Profit Organizations. This survey, targeted exclusively to tax-exempt organizations, was designed to capture compensation data of positions within a broad range of not-for-profit classifications. Data was collected between April and August 2021, and results were compiled from survey questions that were developed by Compensation Resources and distributed to organizations in all not-for-profit classifications. There were 72 organizations that participated in this study.
Compensation data is reported as of March 1, 2021 in the following dimensions:
Base Salary (Weighted Average, Average, Median, and 25th and 75th percentiles) Bonus & Incentive Other Compensation (executive positions) Deferred Compensation (executive positions) Nontaxable Benefits (executive positions)
This survey also reports the prevalence of various programs and practices relative to compensation, covering annual incentives, long-term incentives, various perquisites, supplemental benefits, and agreements.
Compensation Resources is dedicated to providing accurate results of this survey to participants; therefore, should you have any questions or need clarification regarding any aspect of the survey's results, please contact me at (201) 710-6483.
We thank you for your participation.
2021 COMPENSATION SURVEY REPORT OF NOT-FOR-PROFIT ORGANIZATIONS
2
SAMPLE
III. Definitions and Reporting
Data effective date: March 1, 2021.
Executive compensation reporting tables
# of Incs: The number of incumbents reported by participants for the position. Avg Base Salary: The sum of all base salaries reported divided by the number of reported inputs. 25th: The point below which 25% of the data falls. Median: The middle number in the data array. 75th: The point below which 75% of the data falls. Avg Bonus & Incentive: The sum of all annual bonuses/incentives reported divided by the number of reported inputs. Avg Other Comp: The sum of all other compensation reported divided by the number of reported inputs. Avg Deferred Comp: The sum of all deferred compensation amounts reported divided by the number of reported inputs. Avg Nontaxable Benefits: The sum of all nontaxable benefit amounts reported divided by the number of reported inputs. Total Comp. Package: The sum of all total compensation amounts reported divided by the number of reported inputs.
Non-executive compensation reporting tables
# of Incs: The number of incumbents reported by participants for the position. Weighted Avg Base Salary: The sum of all reported base salaries divided by the number of incumbents. Where one organization dominated the results by 25% or greater, no weighted average is reported; indicated with a double asterisk (**). Avg Base Salary: The sum of all base salaries reported divided by the number of reporting organizations. 25th: The point below which 25% of the data falls. Median: The middle number in the data array. 75th: The point below which 75% of the data falls. Total Cash Comp: The sum of all total cash compensation amounts reported divided by the number of reported inputs.
Insufficient data is reported with an asterisk (*). For positions with insufficient data in the revenue, industry classification, size, and/or region cuts, only the overall data is reported (see Table of Contents for page number).
2021 COMPENSATION SURVEY REPORT OF NOT-FOR-PROFIT ORGANIZATIONS
3
SAMPLE
No reporting is shown for the following positions due to lack of sufficient responses:
Top Foundation Executive Top Grantmaking Executive Auditing Director Auditing Manager Auditor Foundation Officer Grantmaking Director Major Gifts Director Government Affairs Manager Job Coach Research Analyst
2021 COMPENSATION SURVEY REPORT OF NOT-FOR-PROFIT ORGANIZATIONS
4
SAMPLE
IV. Participant Demographics
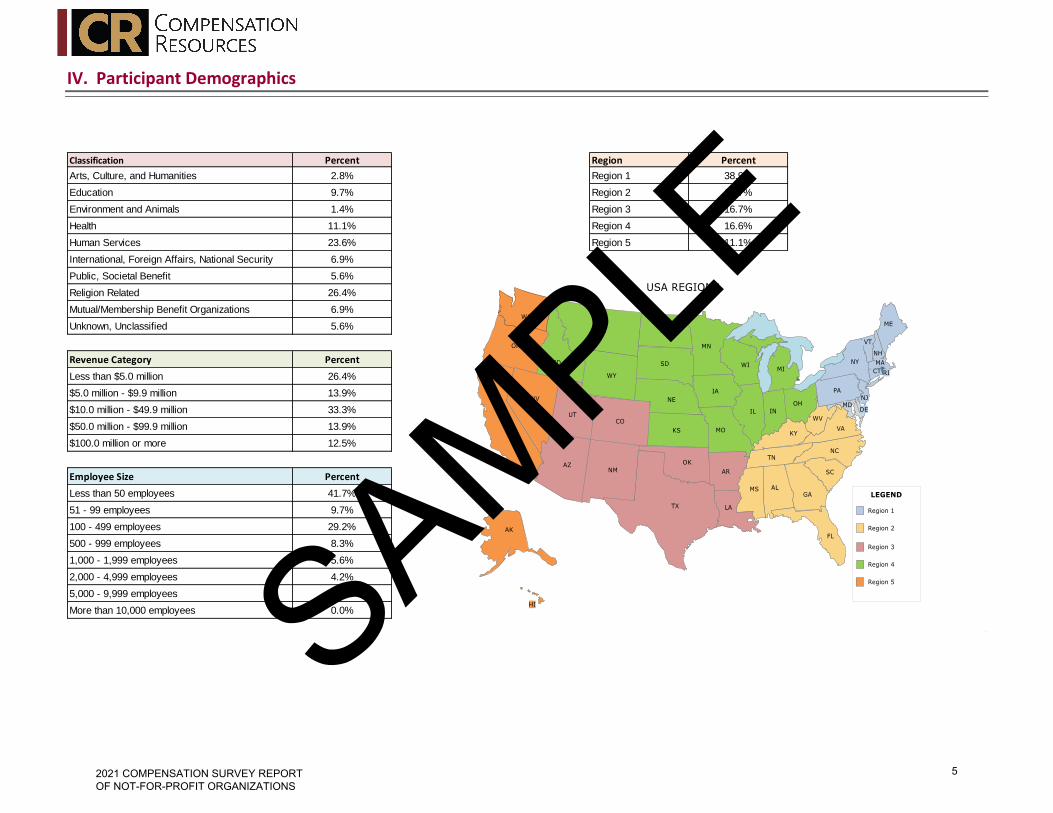
Classification Percent Region Percent
Arts, Culture, and Humanities 2.8% Region 1 38.9%
Education 9.7% Region 2 16.7%
Environment and Animals 1.4% Region 3 16.7%
Health 11.1% Region 4 16.6%
Human Services 23.6% Region 5 11.1%
International, Foreign Affairs, National Security 6.9%
Public, Societal Benefit 5.6%
Religion Related 26.4%
Mutual/Membership Benefit Organizations 6.9%
Unknown, Unclassified 5.6%
Revenue Category Percent
Less than $5.0 million 26.4%
$5.0 million - $9.9 million 13.9%
$10.0 million - $49.9 million 33.3%
$50.0 million - $99.9 million 13.9%
$100.0 million or more 12.5%
Employee Size Percent
Less than 50 employees 41.7%
51 - 99 employees 9.7%
100 - 499 employees 29.2%
500 - 999 employees 8.3%
1,000 - 1,999 employees 5.6%
2,000 - 4,999 employees 4.2%
5,000 - 9,999 employees 1.3%
More than 10,000 employees 0.0%
2021 COMPENSATION SURVEY REPORT OF NOT-FOR-PROFIT ORGANIZATIONS
5
SAMPLE

Executive Director/Top Executive
Overall
Less than $5.0 million$5.0 million ‐ $9.9 million$10.0 million ‐ $49.9 million$50.0 million ‐ or more
EducationHealthHuman ServicesReligion Related
Less than 50 ees51 ‐ 99 ees100 ‐ 499 eesMore than 500 ees
Region 1Region 2Region 3Region 4Region 5
Base SalaryAnnualBonus &Incentive
Other Compensation
Average
Revenue
Avg Bonus & Incentive
Avg Other Comp.
Avg Deferred Comp.
Avg Nontaxable Benefits
Total Comp. Package
Classification
This is the top executive and principal organization leader. Responsible for directing the organization with the objective of accomplishing the mission and vision of theorganization. Establishes current and long‐range objectives, plans, and policies. Reviews activity reports and financial statements to determine progress and status inattaining objectives and revises objectives and plans in accordance with current conditions. Represents the organization with its constituents, clients, the financialcommunity, and the public. Regularly interacts with the organization's Board of Directors, and may serve as one of its members.
# of Incs
Avg 25th Median 75th
Size
Region
2021 COMPENSATION SURVEY REPORT OF NOT-FOR-PROFIT ORGANIZATIONS
8
SAMPLE
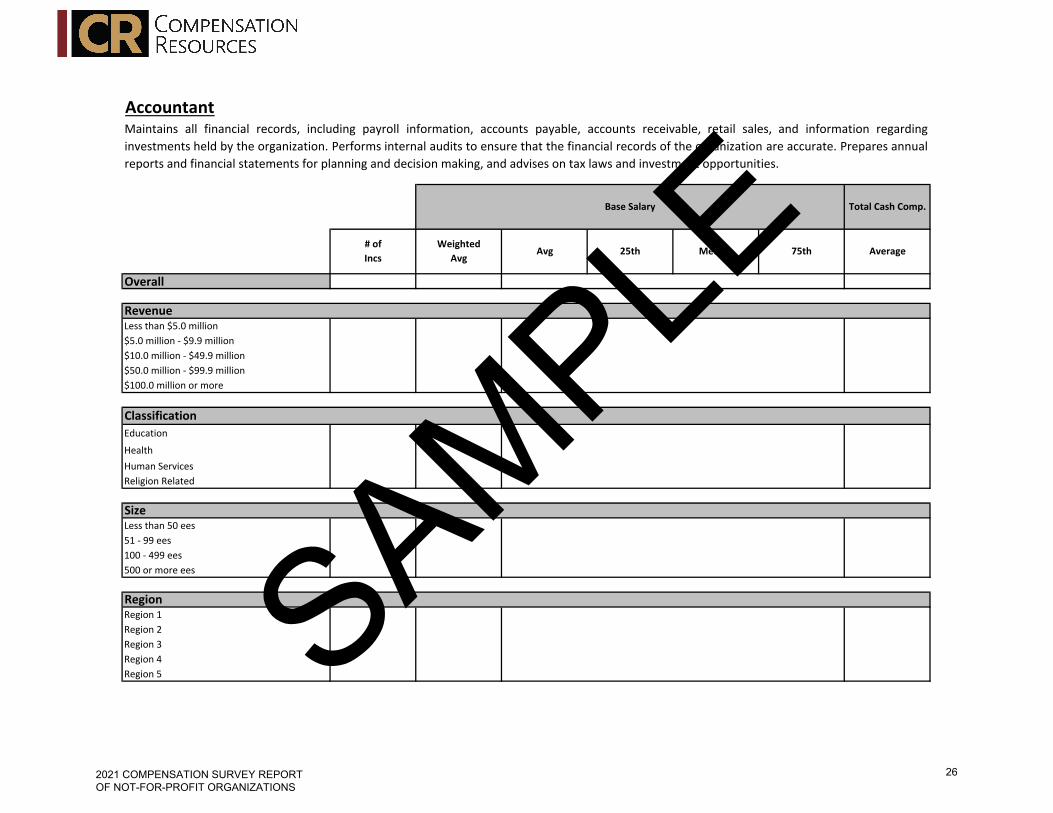
Accountant
Overall
Less than $5.0 million$5.0 million ‐ $9.9 million$10.0 million ‐ $49.9 million$50.0 million ‐ $99.9 million$100.0 million or more
Education
HealthHuman ServicesReligion Related
Less than 50 ees51 ‐ 99 ees100 ‐ 499 ees500 or more ees
Region 1Region 2Region 3Region 4Region 5
# of Incs
WeightedAvg
Avg 25th
Maintains all financial records, including payroll information, accounts payable, accounts receivable, retail sales, and information regardinginvestments held by the organization. Performs internal audits to ensure that the financial records of the organization are accurate. Prepares annualreports and financial statements for planning and decision making, and advises on tax laws and investment opportunities.
Classification
Size
Region
Total Cash Comp.
Average
Revenue
Base Salary
Median 75th
2021 COMPENSATION SURVEY REPORT OF NOT-FOR-PROFIT ORGANIZATIONS
26
SAMPLE
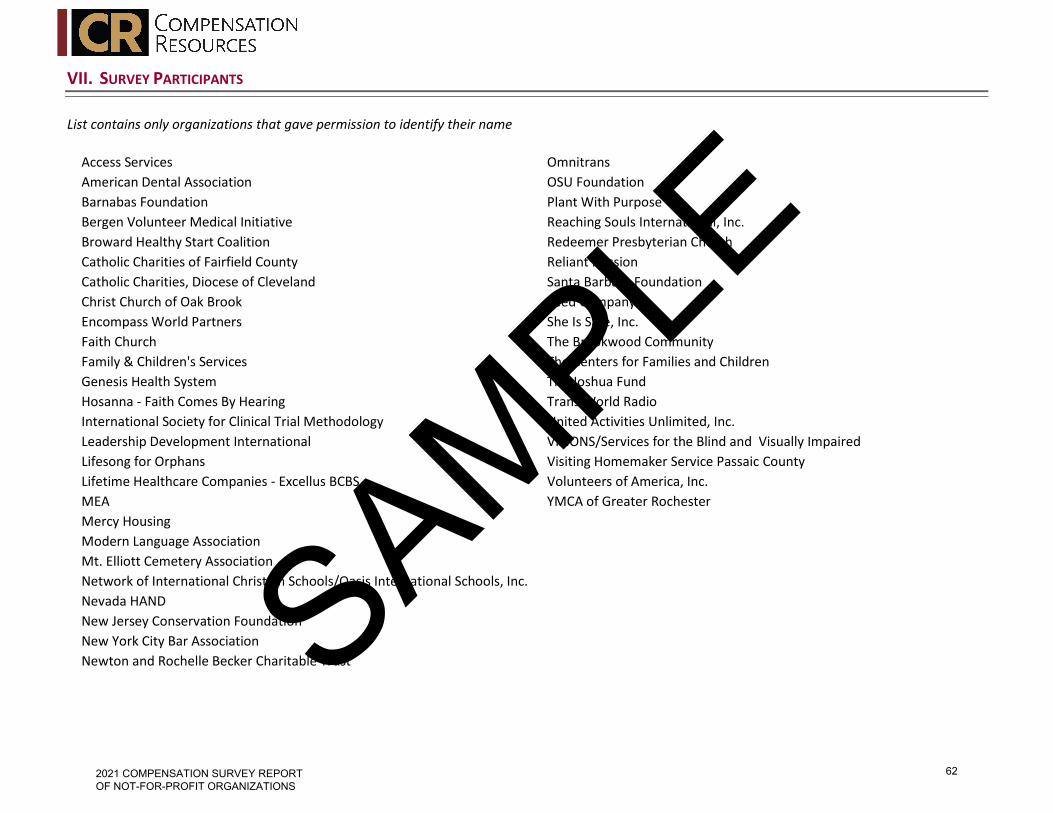
VII. SURVEY PARTICIPANTS
List contains only organizations that gave permission to identify their name
Access Services Omnitrans
American Dental Association OSU Foundation
Barnabas Foundation Plant With Purpose
Bergen Volunteer Medical Initiative Reaching Souls International, Inc.
Broward Healthy Start Coalition Redeemer Presbyterian Church
Catholic Charities of Fairfield County Reliant Mission
Catholic Charities, Diocese of Cleveland Santa Barbara Foundation
Christ Church of Oak Brook Seed Company
Encompass World Partners She Is Safe, Inc.
Faith Church The Brookwood Community
Family & Children's Services The Centers for Families and Children
Genesis Health System The Joshua Fund
Hosanna - Faith Comes By Hearing Trans World Radio
International Society for Clinical Trial Methodology United Activities Unlimited, Inc.
Leadership Development International VISIONS/Services for the Blind and Visually Impaired
Lifesong for Orphans Visiting Homemaker Service Passaic County
Lifetime Healthcare Companies - Excellus BCBS Volunteers of America, Inc.
MEA YMCA of Greater Rochester
Mercy Housing
Modern Language Association
Mt. Elliott Cemetery Association
Network of International Christian Schools/Oasis International Schools, Inc.
Nevada HAND
New Jersey Conservation Foundation
New York City Bar Association
Newton and Rochelle Becker Charitable Trust
2021 COMPENSATION SURVEY REPORT OF NOT-FOR-PROFIT ORGANIZATIONS
62
SAMPLE