2021 datalex big book of airline data page 0
TRANSCRIPT

2021 Datalex Big Book of Airline Data Page 0

2021 Datalex Big Book of Airline Data Page 1
2021 Datalex Big Book of Airline Data by IdeaWorksCompany
Table of Contents
Updates to the 2021 Datalex Big Book of Airline Data .................................................................................... 3
A. Welcome Message from Datalex .................................................................................................................. 5
B. Introduction to the Data ................................................................................................................................. 6
About Special Reporting Periods ....................................................................................................................... 7
Year over Year Comparisons are Introduced this Year............................................................................... 8
2020 Was Bad – But There Were a Few Bright Spots ................................................................................. 9
C. Airline Traffic for the 2020 Period .............................................................................................................. 12
Primary Airlines in Alphabetical Order .......................................................................................................... 12
Subsidiary Airlines in Alphabetical Order ...................................................................................................... 18
Primary Airlines by Traffic ................................................................................................................................. 21
Primary Airlines Traffic by World Region ...................................................................................................... 27
Traffic Generated by Global Alliances ............................................................................................................ 35
Traffic by Airline Category ................................................................................................................................ 37
D. Airline Revenue for the 2020 Period .......................................................................................................... 40
Primary Airlines in Alphabetical Order .......................................................................................................... 40
Subsidiary Airlines in Alphabetical Order ...................................................................................................... 46
Primary Airlines by Revenue ............................................................................................................................. 48
Primary Airlines Revenue by World Region.................................................................................................. 54
Revenue Generated by Global Alliances ........................................................................................................ 61
Revenue by Airline Category ............................................................................................................................ 63
E. Frequent Flyer Membership by Program ................................................................................................... 66
Currency Exchange Rates Used for this Big Book ........................................................................................... 68
Appendix: Airlines Included in this Big Book .................................................................................................... 69
The free distribution of this report
is made possible through the sponsorship of Datalex.
Issued 12 August 2021 by IdeaWorksCompany.com LLC
Shorewood, Wisconsin, USA
www.IdeaWorksCompany.com
Version 1

2021 Datalex Big Book of Airline Data Page 2
About Jay Sorensen, Writer of the Report
Jay Sorensen’s research and reports have made him a leading authority on frequent flyer
programs and the ancillary revenue movement. He is a regular keynote speaker at the
annual MEGA Event, spoke at IATA Passenger Services Symposiums in Abu Dhabi and
Singapore, and has testified to the US Congress on ancillary revenue issues. His published
works are relied upon by airline executives throughout the world and include first-ever
guides on the topics of ancillary
revenue and loyalty marketing. He was
acknowledged by his peers when he
received the Airline Industry
Achievement Award at the MEGA
Event in 2011.
Mr. Sorensen is a veteran management professional with 37 years experience
in product, partnership, and marketing
development. As president of the
IdeaWorksCompany consulting firm,
he has enhanced the generation of airline revenue, started loyalty programs and co-branded
credit cards, developed products in the service sector, and helped start airlines and other
travel companies. His career includes 13 years at Midwest Airlines where he was
responsible for marketing, sales, customer service, product development, operations,
planning, financial analysis and budgeting. His favorite activities are hiking, exploring and
camping in US national parks with his family.
About Eric Lucas, Editor of the Report
Eric Lucas is an international travel, culture and natural history
writer and editor whose work has appeared in Michelin travel
guides, Alaska Airlines Beyond Magazine, Westways and numerous
other publications. Founding editor of Midwest Airlines Magazine,
he is the author of eight books, including the 2017 Michelin Alaska
guide. Eric has followed and written about the travel industry for
more than 30 years. He lives on San Juan Island, Washington,
where he grows organic garlic, apples, beans and hay; visit him
online at TrailNot4Sissies.com.
Eric, at his favorite summer retreat, Steens Mountain, Oregon.
Jay and sons Aleksei and Anton hiking on the Pacific Crest Trail
in the Angeles National Forest in California.
2021 Datalex Big Book of Airline Data Page 3
Disclosure to Readers of this Report: IdeaWorksCompany.com LLC makes every effort to
ensure the quality of the information in this report. Before relying on the information, you should
obtain any appropriate professional advice relevant to your particular circumstances.
IdeaWorksCompany cannot guarantee, and assumes no legal liability or responsibility for, the
accuracy, currency or completeness of the information.
The views expressed in the report are the views of the author, and do not represent the official
view of Datalex.
Terms of Use for this Report: You may not disseminate any portion of the report through
digital means, including mail lists or digital bulletin boards, without the prior consent of
IdeaWorksCompany. This restriction includes Statista.com and similar subscriber-based websites.
You may make one hard copy by downloading and printing it. You may store the document as a file
on your computer. Please contact IdeaWorksCompany if you require multiple downloads for use
within your company, and for all other uses.
Except as expressly permitted in this Terms of Use, the report may not be reproduced, transmitted,
or distributed without permission. You may not commingle any portion of the report with any
other information and shall not edit, modify, or alter any portion.
IdeaWorksCompany provides the report and services “as is” and without any warranty, or
condition, express, implied or statutory. IdeaWorksCompany specifically disclaims any implied
warranty of title, merchantability, fitness for a particular purpose, and non-infringement. In no event
shall IdeaWorksCompany be liable for lost profits or any special, incidental, or consequential
damages arising out of or in connection with the report (however arising, including negligence).
Distribution of this report is protected by the Economic Espionage Act of 1996 of the United States
and the data protection laws of Europe.
About Datalex: Datalex is a market leader in digital commerce for travel retail. Datalex provides
airlines with unique products to drive revenue and profit as digital retailers. Today the Datalex
Digital Commerce Platform enables a travel marketplace of over one billion shoppers covering every
corner of the globe, driven by some of the world’s most innovative airline retail brands. Datalex’s
customers include JetBlue Airways, Air China, Tianjin Airlines, West Air, Guangxi Beibu Gulf
Airlines, Urumqi Air, Air Changan, SAS, KLM, Turkish Airlines, Copa Airlines, Aer Lingus, Edelweiss,
Air Transat and Trailfinders. The Group is headquartered in Dublin, Ireland, and maintains offices
across Europe, the USA and China. Datalex plc is a publicly listed company on Euronext Growth.
Learn more at Datalex.com
Updates to the 2021 Datalex Big Book of Airline Data
This is Version 1.0 of the 2021 Datalex Big Book of Airline Data by IdeaWorksCompany.
Readers are encouraged to visit the IdeaWorksCompany website to check for updates to this
Datalex Big Book of Airline Data: https://ideaworkscompany.com/reports/
Updates will include corrections made to the data presented. These will be summarized in the
“Updates to the 2021 Datalex Big Book of Airline Data page.” The most up-to-date version of the
big book will be available on the website.

2021 Datalex Big Book of Airline Data Page 4

2021 Datalex Big Book of Airline Data Page 5
A. Welcome Message from Datalex
As we welcome you to this second edition of the Datalex Big Book of Airline Data by
IdeaWorksCompany, let’s acknowledge that 2020 was one of the most challenging years
ever faced by our industry.
The Big Book provides a comprehensive look at air travel revenue, passenger numbers and
more for this seminal period and we are delighted to once again sponsor a single source of
truth about air travel. The contrast with 2019 is striking – that was a record year for air
travel and the companies that provide it.
To be expected for 2020, there is bad news; numbers are down in almost every respect.
There is good news too - virtually all the airlines in last year’s Big Book are still around, a
testament to their ingenuity, resilience, and relevance – and to the fundamental value that
travel provides for humankind.
As we emerge from the challenges of the global pandemic, we believe there will be a strong
recovery over time, which will in turn be positively reflected in airline traffic and revenues in
future Big Book editions. Airlines that harness the accelerated power of ecommerce will
recover faster and perform better.
Our core product portfolio – Datalex Merchandiser, Datalex Direct, Datalex Dynamic and
Datalex NDC – is here to support the ever-changing needs of airlines and their customers.
Investments in our Digital Configurator and in AI/ML pricing have been designed to
empower airlines for true retailing.
We thank Jay Sorensen and his team at IdeaWorksCompany for producing a stellar piece of
work – we are happy to share it. We encourage the media to use the data from this
publication in their reporting and we hope that this Big Book will be a powerful resource for
all those interested in our industry.
Alison Bell
Senior Vice President Global Sales & Marketing
Datalex

2021 Datalex Big Book of Airline Data Page 6
B. Introduction to the Data
This publication is your single source of data for passenger traffic, airline revenue, and
frequent flyer enrollment for 188 airlines from Aegean to Zhuhai. The data collection
process for the 2021 Datalex Big Book of Airline Data by IdeaWorksCompany began in
January of this year and was completed in June to allow an earlier publication date of August
2021. It’s a significant undertaking with a review of more than 270 airlines to find traffic,
revenue, and membership data for presentation in the Big Book. The information is
presented in multiple formats to create user-friendly access to the data.
The first part of the Big Book contains passenger traffic results for 125 primary airlines and
55 subsidiary airlines. The second portion contains revenue results for 109 primary airlines
and 43 subsidiary airlines. The final section provides membership data for 42 frequent flyer
programs. It’s important to understand the distinction between primary and subsidiary
airlines:
Primary airlines include individual airlines not affiliated with a corporate group structure such as Aeromexico and Copa Airlines. Group airlines are also included.
These groups feature multiple carriers under a single corporate ownership structure.
Examples of groups include AirAsia Group and Air France/KLM Group.
Subsidiary airlines are individually identified airlines under an airline group (also
known as the corporate parent). The carriers listed do not always represent the full
list of airlines operating under the group umbrella. The listing is limited to the
disclosures made by the parent company, and these may not be comprehensive;
groups often omit smaller operations from the annual report.
There are 70+ pages in this Big Book and two features are designed to help keep users on
track through the many tables. Each data section will use a consistent highlight color for the
traffic and revenue data. In addition, tables offer “line” numbers for individual results. For
tables offering high to low results, the individual results appear as a “rank.”
Passenger traffic typically represents one way passengers with connections between flights
counted as a single trip. Some airlines, such as low cost carriers, count passengers on a
segment basis; a connection passenger would represent two trips. Revenue is often
described by airlines as “operating revenue” which includes a variety of sources such as
passenger fares, ancillary revenue, air cargo, and services sold to other airlines such as
catering and ground handling. Data collection attempted to identify operating revenue for
inclusion in the Big Book. Some disclosures were very scant and the revenue type could not
be determined.

2021 Datalex Big Book of Airline Data Page 7
The reporting period focuses on 2020. For the majority of airlines, this is the calendar year
of January through December. Some airlines use fiscal years with quarters ending on 31
March, 30 June, and 30 September. The most recent reporting period was selected for this
Big Book. Unfortunately, some listings have periods ending 31 March 2020, which is prior
to the pandemic. The source for information was almost always an annual report found at
the investor relations page of an airline website. There are a variety of sources identified in
the tables with official financial documents being preferred. The source data for all
disclosures is noted in the Appendix section at the end of the document.
About Special Reporting Periods
The 2020 pandemic created the need for special treatment of fiscal years ending on 31
March 2020, 30 June 2020, and 30 September 2020. This is because the 2021 Big Book
provides year-over-year comparisons of traffic and revenue. For airlines using calendar year
2020 or the 31 March 2021 fiscal year, these periods include the significant decreases
expected for the pandemic period. As would be expected, decreases of 50 to 80 percent are common. But carriers that listed 31 March 2020, 30 June 2020, 30 September 2020
reporting periods may display traffic and revenue increases (or minor decreases). These
carriers are highlighted with a green box ■ following the carrier name and the reporting
period description appears in green font; the following carriers are designated in this
manner:
Carrier Name Reporting Period (most recent)
Air India Express ■ FY ended 31 March 2020
Air New Zealand ■ FY ended 30 June 2020
Eastern Airways UK ■ FY ended 31 March 2020
EasyJet ■ FY ended 30 September 2020
Ethiopian Airlines ■ Period ended July 2020
Loganair ■ FY ended 31 March 2020
REX - Regional Express ■ FY ended 31 March 2020
SriLankan Airlines ■ FY ended 31 March 2020
Tigerair Australia ■ FY ended 30 June 2020
TUI Group (Markets & Airlines) ■ FY ended 30 September 2020
Virgin Australia Group ■ FY ended 30 June 2020
Airlines may post traffic and financial results six months or more after the close of a fiscal
period. More recent results for the above carriers are not included in this Big Book.
Qantas reports half-yearly results with its fiscal year ending on 30 June. The half yearly
results were combined to provide a later 31 December 2020 ending period to capture
more of the pandemic. Similar treatment was given to Jetstar (the wholly owned subsidiary
of Qantas). This special reporting period for Qantas and Jetstar is disclosed but not
highlighted in green.
2021 Datalex Big Book of Airline Data Page 8
Care should be taken by the reader when comparing the results of these carriers with those
that disclose traffic and revenue that has endured more of a pandemic period. Airlines
which are privately owned (no public shares ownership) or government owned offer very
little disclosure beyond a simple traffic or revenue reference made at the website, in a press
release, or in the statistics published by civil aviation authorities.
The tables offer the most robust information for primary airlines, as these carriers and
groups can be effectively ranked in terms of passenger traffic and revenue. All airlines are
listed in alphabetical order with passenger traffic, revenue, reporting period, data source,
and global region listed. Primary airlines are listed in rank by passenger traffic and revenue.
In addition, primary airlines are ranked within their global regions. There are sections which
collate results for the three primary alliances: Oneworld, SkyTeam, and Star.
Every effort is made to provide accurate data. However, the quantity of data presented will
inevitably incorporate errors and omissions. Users are kindly requested to advise
IdeaWorksCompany using the contact form provided on the website:
https://ideaworkscompany.com/contact/
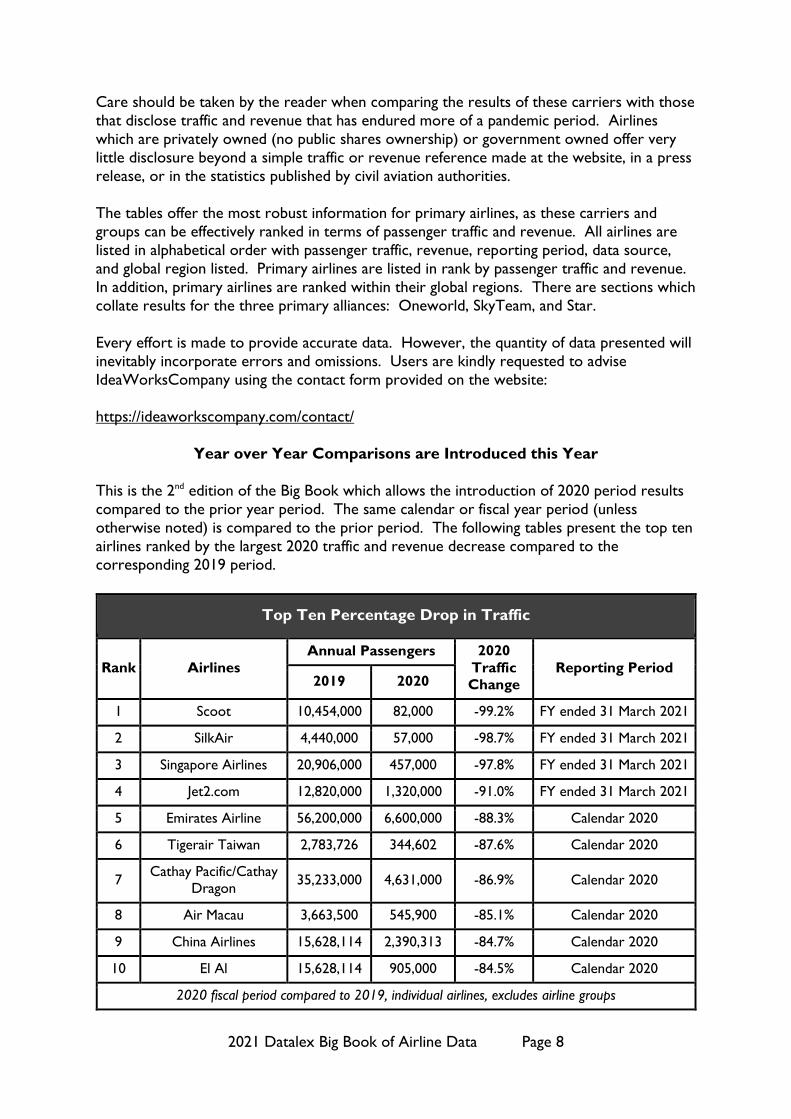
Year over Year Comparisons are Introduced this Year
This is the 2nd edition of the Big Book which allows the introduction of 2020 period results
compared to the prior year period. The same calendar or fiscal year period (unless
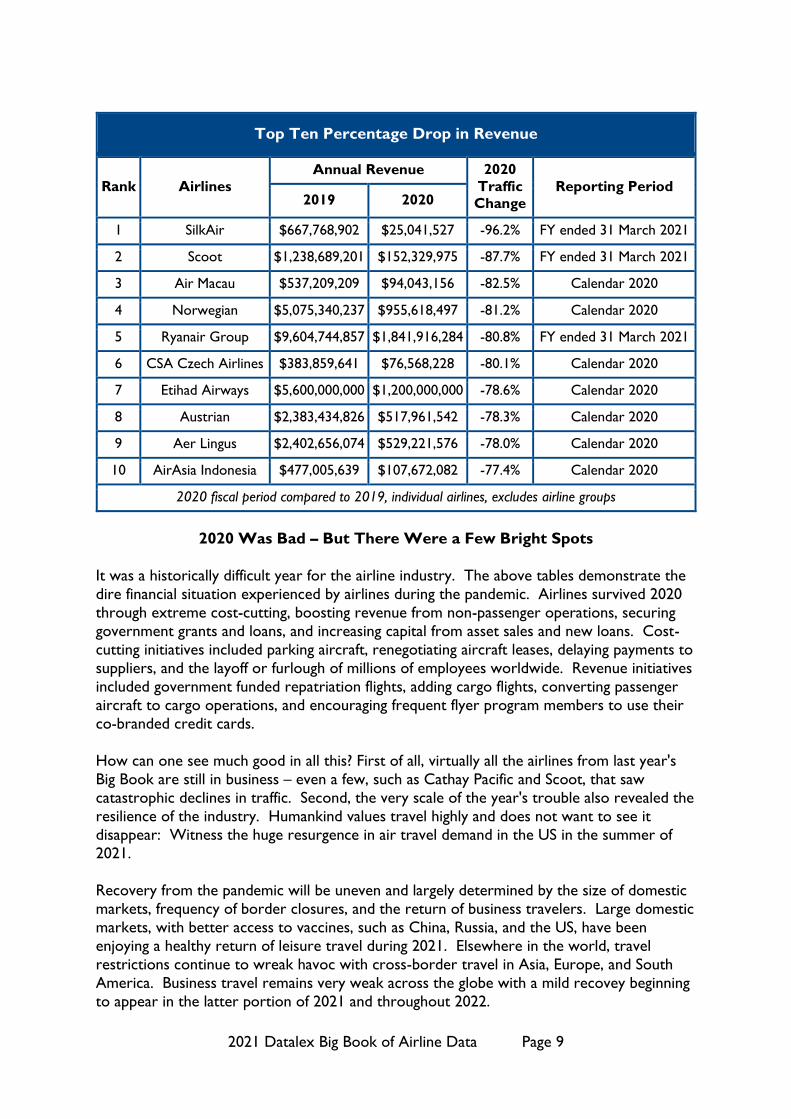
otherwise noted) is compared to the prior period. The following tables present the top ten
airlines ranked by the largest 2020 traffic and revenue decrease compared to the
corresponding 2019 period.
Top Ten Percentage Drop in Traffic
Rank Airlines
Annual Passengers 2020
Traffic
Change
Reporting Period 2019 2020
1 Scoot 10,454,000 82,000 -99.2% FY ended 31 March 2021
2 SilkAir 4,440,000 57,000 -98.7% FY ended 31 March 2021
3 Singapore Airlines 20,906,000 457,000 -97.8% FY ended 31 March 2021
4 Jet2.com 12,820,000 1,320,000 -91.0% FY ended 31 March 2021
5 Emirates Airline 56,200,000 6,600,000 -88.3% Calendar 2020
6 Tigerair Taiwan 2,783,726 344,602 -87.6% Calendar 2020
7 Cathay Pacific/Cathay
Dragon 35,233,000 4,631,000 -86.9% Calendar 2020
8 Air Macau 3,663,500 545,900 -85.1% Calendar 2020
9 China Airlines 15,628,114 2,390,313 -84.7% Calendar 2020
10 El Al 15,628,114 905,000 -84.5% Calendar 2020
2020 fiscal period compared to 2019, individual airlines, excludes airline groups
2021 Datalex Big Book of Airline Data Page 9
Top Ten Percentage Drop in Revenue
Rank Airlines
Annual Revenue 2020
Traffic
Change
Reporting Period 2019 2020
1 SilkAir $667,768,902 $25,041,527 -96.2% FY ended 31 March 2021
2 Scoot $1,238,689,201 $152,329,975 -87.7% FY ended 31 March 2021
3 Air Macau $537,209,209 $94,043,156 -82.5% Calendar 2020
4 Norwegian $5,075,340,237 $955,618,497 -81.2% Calendar 2020
5 Ryanair Group $9,604,744,857 $1,841,916,284 -80.8% FY ended 31 March 2021
6 CSA Czech Airlines $383,859,641 $76,568,228 -80.1% Calendar 2020
7 Etihad Airways $5,600,000,000 $1,200,000,000 -78.6% Calendar 2020
8 Austrian $2,383,434,826 $517,961,542 -78.3% Calendar 2020
9 Aer Lingus $2,402,656,074 $529,221,576 -78.0% Calendar 2020
10 AirAsia Indonesia $477,005,639 $107,672,082 -77.4% Calendar 2020
2020 fiscal period compared to 2019, individual airlines, excludes airline groups
2020 Was Bad – But There Were a Few Bright Spots
It was a historically difficult year for the airline industry. The above tables demonstrate the
dire financial situation experienced by airlines during the pandemic. Airlines survived 2020
through extreme cost-cutting, boosting revenue from non-passenger operations, securing
government grants and loans, and increasing capital from asset sales and new loans. Cost-
cutting initiatives included parking aircraft, renegotiating aircraft leases, delaying payments to
suppliers, and the layoff or furlough of millions of employees worldwide. Revenue initiatives
included government funded repatriation flights, adding cargo flights, converting passenger
aircraft to cargo operations, and encouraging frequent flyer program members to use their
co-branded credit cards.
How can one see much good in all this? First of all, virtually all the airlines from last year's
Big Book are still in business – even a few, such as Cathay Pacific and Scoot, that saw
catastrophic declines in traffic. Second, the very scale of the year's trouble also revealed the
resilience of the industry. Humankind values travel highly and does not want to see it
disappear: Witness the huge resurgence in air travel demand in the US in the summer of
2021.
Recovery from the pandemic will be uneven and largely determined by the size of domestic
markets, frequency of border closures, and the return of business travelers. Large domestic
markets, with better access to vaccines, such as China, Russia, and the US, have been
enjoying a healthy return of leisure travel during 2021. Elsewhere in the world, travel
restrictions continue to wreak havoc with cross-border travel in Asia, Europe, and South
America. Business travel remains very weak across the globe with a mild recovey beginning
to appear in the latter portion of 2021 and throughout 2022.

2021 Datalex Big Book of Airline Data Page 10
The airline industry has been forever changed by this event. Every airline will adapt through
changes made to route networks, onboard products, pricing methods, retailing, and
marketing strategies. The 2022 Big Book will hopefully reveal a much improved economic
picture for the global airline industry.
As famed physicist Stephen Hawking put it: "However bad life may seem, there is always
something you can do and succeed at. Where there's life, there's hope."

2021 Datalex Big Book of Airline Data Page 11

2021 Datalex Big Book of Airline Data Page 12
C. Airline Traffic for the 2020 Period
Primary Airlines in Alphabetical Order
This section provides annual passenger traffic information for 125 primary airlines in
alphabetical order from Aegean Airlines to Wizz Air. Primary airlines include individual
airlines, such as Air Greenland and Allegiant, not affiliated with a corporate group structure.
Group airlines are also included. These groups feature multiple carriers under a single
corporate ownership structure. Examples of groups include Air China and Lufthansa. Using
the example of Lufthansa Group, this structure includes Austrian, Brussels, Eurowings,
Lufthansa Airlines, and SWISS as subsidiary airlines under the group. Traffic detail for
subsidiary airlines is provided in the section which follows the primary airlines listing. Please
refer to section B of the Big Book (Introduction to the Data) for information describing data
collection, reporting periods, and data sources. The 2020 versus 2019 traffic decrease
among all primary airlines was 52.5% (using weighted averages).
Traffic – Primary Airlines – Alphabetical
Line Airlines Annual
Passengers
Traffic Change (from prior
annual period) Reporting Period World Region
1 Aegean Airlines 5,155,000 -65.6% Calendar 2020 Europe & Russia
2 Aeroflot Group 30,300,000 -50.2% Calendar 2020 Europe & Russia
3 Aerolineas
Argentinas 2,226,000 -77.8% Calendar 2020 Latin America
4 Aeromexico 9,484,000 -54.2% Calendar 2020 Latin America
5 Air Arabia 4,400,000 -63.3% Calendar 2020 Middle East &
Africa
6 Air Astana 3,700,000 -27.7% Calendar 2020 Asia & South
Pacific
7 Air Canada Group 13,760,000 -73.3% Calendar 2020 US & Canada
8 Air China Group 68,687,070 -40.3% Calendar 2020 Asia & South
Pacific
9 Air Europa 3,900,000 -66.9% Calendar 2020 Europe & Russia
10 Air France/KLM
Group 34,065,000 -67.3% Calendar 2020 Europe & Russia
11 Air Greenland 246,000 -43.8% Calendar 2020 Europe & Russia
12 Air India 6,280,837 -71.2% FY ended 31
March 2021
Asia & South
Pacific
13 Air India Express ■ 4,840,000 11.0% FY ended 31
March 2020
Asia & South
Pacific
14 Air New Zealand ■ 13,525,000 -23.8% FY ended 30 June
2020
Asia & South
Pacific
15 AirAsia Group (exc.
AirAsia X) 13,309,353 -74.2% Calendar 2020
Asia & South
Pacific
■ Refer to page 7 for details. * Estimates by IdeaWorks. Table continues next page.

2021 Datalex Big Book of Airline Data Page 13
Traffic – Primary Airlines – Alphabetical
Continued
Line Airlines Annual
Passengers
Traffic Change (from prior
annual period) Reporting Period World Region
16 AirAsia X 1,144,004 -81.2% Calendar 2020 Asia & South
Pacific
17 airBaltic 1,340,000 -73.5% Calendar 2020 Europe & Russia
18 AIRDO 579,631 -71.6% FY ended 31
March 2021
Asia & South
Pacific
19 Alaska Air Group 17,927,000 -61.6% Calendar 2020 US & Canada
20 Allegiant Air 8,623,984 -42.6% Calendar 2020 US & Canada
21 Alliance India 792,436 -52.3% Calendar 2020 Asia & South
Pacific
22 American 95,324,000 -55.7% Calendar 2020 US & Canada
23 ANA All Nippon
Airways 13,088,042 -70.9%
FY ended 31
March 2021
Asia & South
Pacific
24 Asiana Airlines
Group 39,400,000 -68.1% Calendar 2020
Asia & South
Pacific
25 Atlantic Airways 148,717 -56.0% Calendar 2020 Europe & Russia
26 Avianca 7,647,943 -75.0% Calendar 2020 Latin America
27 Azimuth Airlines 1,221,638 -2.1% Calendar 2020 Europe & Russia
28 Azul 14,796,000 -46.5% Calendar 2020 Latin America
29 Azur Air 1,930,037 -66.7% Calendar 2020 Europe & Russia
30 Bangkok Airways 1,884,600 -67.8% Calendar 2020 Asia & South
Pacific
31 Cathay Pacific/Cathay
Dragon 4,631,000 -86.9% Calendar 2020
Asia & South
Pacific
32 Cebu Pacific Air 5,026,000 -77.6% Calendar 2020 Asia & South
Pacific
33 China Airlines 2,390,313 -84.7% Calendar 2020 Asia & South
Pacific
34 China Eastern Group 74,621,210 -42.7% Calendar 2020 Asia & South
Pacific
35 China Southern
Group 96,856,040 -36.1% Calendar 2020
Asia & South
Pacific
36 Copa Airlines 2,852,000 -81.5% Calendar 2020 Latin America
37 Croatia Airlines 618,000 -71.6% Calendar 2020 Europe & Russia
38 CSA Czech Airlines 500,000 -80.8% Calendar 2020 Europe & Russia
39 Daily Air (Taiwan) 106,588 12.5% Calendar 2020 Asia & South
Pacific
40 Delta 70,145,000 -64.9% Calendar 2020 US & Canada
■ Refer to page 7 for details. * Estimates by IdeaWorks. Table continues next page.

2021 Datalex Big Book of Airline Data Page 14
Traffic – Primary Airlines – Alphabetical
Continued
Line Airlines Annual
Passengers
Traffic Change (from prior
annual period) Reporting Period World Region
41 easyJet ■ 48,100,000 -49.9% FY ended 30
September 2020
Europe &
Russia
42 Edelweiss Air 870,000 -67.4% Calendar 2020 Europe &
Russia
43 El Al 905,000 -84.5% Calendar 2020 Middle East &
Africa
44 Emirates Airline 6,600,000 -88.3% Calendar 2020 Middle East &
Africa
45 Etihad Airways 4,200,000 -76.0% Calendar 2020 Middle East &
Africa
46 EVA Air 2,330,025 -81.8% Calendar 2020 Asia & South
Pacific
47 Finnair 3,485,600 -76.2% Calendar 2020 Europe &
Russia
48 Flybondi (Argentina) 304,000 -78.9% Calendar 2020 Latin America
49 flydubai 3,200,000 -66.7% Calendar 2020 Middle East &
Africa
50 Frontier Airlines 11,238,000 -50.5% Calendar 2020 US & Canada
51 Garuda Indonesia 5,313,600 -73.0% Calendar 2020 Asia & South
Pacific
52 GoAir 5,437,792 -64.5% Calendar 2020 Asia & South
Pacific
53 GOL Linhas Aereas 16,775,000 -54.0% Calendar 2020 Latin America
54 Hainan Airlines Group 37,032,000 -54.7% Calendar 2020 Asia & South
Pacific
55 Hawaiian Holdings 3,362,000 -71.4% Calendar 2020 US & Canada
56 HK Express 572,000 -69.7% Calendar 2020 Asia & South
Pacific
57 Icelandair 891,000 -79.8% Calendar 2020 Europe &
Russia
58 IndiGo 29,336,170 -60.9% FY ended 31
March 2021
Asia & South
Pacific
59 Int'l Airlines Group
IAG 31,275,000 -73.6% Calendar 2020
Europe &
Russia
60 Japan Airlines Group 12,569,650 -70.1% FY ended 31
March 2021
Asia & South
Pacific
■ Refer to page 7 for details. * Estimates by IdeaWorks. Table continues next page.

2021 Datalex Big Book of Airline Data Page 15
Traffic – Primary Airlines – Alphabetical
Continued
Line Airlines Annual
Passengers
Traffic Change (from prior
annual period) Reporting Period World Region
61 Jazeera Airways 696,093 -71.0% Calendar 2020 Middle East &
Africa
62 Jeju Air 5,519,000 -59.0% Calendar 2020 Asia & South
Pacific
63 Jet2.com 1,880,000 -91.0% FY ended 31
March 2021 Europe & Russia
64 JetBlue Airways 14,274,000 -66.6% Calendar 2020 US & Canada
65 JetSMART Chile 1,235,387 -45.9% Calendar 2020 Latin America
66 Jetstar Group 7,308,000 -70.8%
Calendar 2020
(Not regular
period)
Asia & South
Pacific
67 Jin Air 4,372,377 -49.5% Calendar 2020 Asia & South
Pacific
68 Juneyao Air 15,716,850 -28.6% Calendar 2020 Asia & South
Pacific
69 Kenya Airways Group 1,800,000 -65.1% Calendar 2020 Middle East &
Africa
70 Korean Air 7,312,000 -73.2% Calendar 2020 Asia & South
Pacific
71 LATAM Group 28,299,000 -61.9% Calendar 2020 Latin America
72 Loganair ■ 1,047,281 33.2% FY ended 31
March 2020 Europe & Russia
73 LOT - Polish Aviation
Group 3,000,000 -70.0% Calendar 2020 Europe & Russia
74 Lufthansa Group 36,354,000 -75.0% Calendar 2020 Europe & Russia
75 Luxair 658,873 -69.3% Calendar 2020 Europe & Russia
76 Mandarin Airlines 1,854,366 -33.2% Calendar 2020 Asia & South
Pacific
77 Nordwind Airlines 2,939,000 -46.9% Calendar 2020 Europe & Russia
78 Norwegian 6,870,000 -81.0% Calendar 2020 Europe & Russia
79 Pegasus 14,710,000 -51.8% Calendar 2020 Europe & Russia
80 Philippine Airlines
Group 3,620,438 -77.8% Calendar 2020
Asia & South
Pacific
■ Refer to page 7 for details. * Estimates by IdeaWorks. Table continues next page.

2021 Datalex Big Book of Airline Data Page 16
Traffic – Primary Airlines – Alphabetical
Continued
Line Airlines Annual
Passengers
Traffic Change (from prior
annual period) Reporting Period World Region
81 PIA Pakistan 2,541,000 -52.0% Calendar 2020 Asia & South
Pacific
82 Qantas Airways
(includes Loyalty) 9,206,000 -70.1%
Calendar 2020
(Not regular
period)
Asia & South
Pacific
83 Qatar Airways * 8,800,000 -70.2% FY ended 31
March 2021
Middle East &
Africa
84 Red Wings 1,536,902 -49.9% Calendar 2020 Europe & Russia
85 REX - Regional
Express ■ 892,000 -29.8%
FY ended 30 June
2020
Asia & South
Pacific
86 Royal Jordanian 751,000 -77.2% Calendar 2020 Middle East &
Africa
87 Ryanair Group 27,500,000 -81.5% FY ended 31
March 2021 Europe & Russia
88 S7 Airlines 12,300,000 -31.3% Calendar 2020 Europe & Russia
89 SAS Group 12,610,000 -57.6% FY ended 31
October 2020 Europe & Russia
90 SATA Air Acores 361,297 -52.9% Calendar 2020 Europe & Russia
91 SATA International 304,640 -67.8% Calendar 2020 Europe & Russia
92 Saudi Arabian
Airlines * 12,600,000 -65.0% Calendar 2020
Middle East &
Africa
93 Scoot 82,000 -99.2% FY ended 31
March 2021
Asia & South
Pacific
94 SIA Group
(Singapore) 457,000 -98.7%
FY ended 31
March 2021
Asia & South
Pacific
95 SKY Airline (Chile) 1,800,604 -61.1% Calendar 2020 Latin America
96 Smartwings Group 1,800,000 -81.4% Calendar 2020 Europe & Russia
97 Solaseed Air 659,609 -63.3% FY ended 31
March 2021
Asia & South
Pacific
98 Southwest Airlines 54,088,000 -59.7% Calendar 2020 US & Canada
99 SpiceJet 10,015,139 -58.8% Calendar 2020 Asia & South
Pacific
100 Spirit Airlines 18,444,000 -46.6% Calendar 2020 US & Canada
101 Spring Airlines 18,591,900 -17.0% Calendar 2020 Asia & South
Pacific
102 SriLankan Airlines ■ 5,256,040 -7.2% FY ended 31
March 2020
Asia & South
Pacific
103 Starflyer 457,000 -72.7% FY ended 31
March 2021
Asia & South
Pacific
■ Refer to page 7 for details. * Estimates by IdeaWorks. Table continues next page.

2021 Datalex Big Book of Airline Data Page 17
Traffic – Primary Airlines – Alphabetical
Continued
Line Airlines Annual
Passengers
Traffic Change (from prior
annual period) Reporting Period World Region
104 Starlux (Taiwan) 34,784 n/a Calendar 2020 Asia & South
Pacific
105 Sun Country Airlines 1,679,242 -58.9% Calendar 2020 US & Canada
106 TAP Portugal 4,657,200 -72.7% Calendar 2020 Europe &
Russia
107 Thai Airways Int’l. 5,870,000 -69.8% Calendar 2020 Asia & South
Pacific
108 TUI Group (Markets
& Airlines) ■ 8,057,000 -61.8%
FY ended 30
September 2020
Europe &
Russia
109 Tunisair 997,451 -71.1% Calendar 2020 Middle East &
Africa
110 Turkish Airlines
Group 27,950,200 -62.4% Calendar 2020
Europe &
Russia
111 T'way Air 4,631,000 -43.2% Calendar 2020 Asia & South
Pacific
112 UNI Air (Taiwan) 3,296,368 -16.4% Calendar 2020 Asia & South
Pacific
113 United 57,761,000 -64.4% Calendar 2020 US & Canada
114 Ural Airlines 5,632,000 -41.4% Calendar 2020 Europe &
Russia
115 Utair (excludes
helicopter) 4,800,000 -38.7% Calendar 2020
Europe &
Russia
116 VietJet Air 15,000,000 -39.8% Calendar 2020 Asia & South
Pacific
117 Vietnam Airlines 16,400,000 -28.4% Calendar 2020 Asia & South
Pacific
118 Virgin Atlantic
Airways 1,192,999 -79.7% Calendar 2020
Europe &
Russia
119 Virgin Australia
Group ■ 18,500,000 -25.4%
FY ended 30 June
2020
Asia & South
Pacific
120 Vistara 3,938,711 -47.1% Calendar 2020 Asia & South
Pacific
121 Viva Aerobus 8,123,000 -32.4% Calendar 2020 Latin America
122 Volaris 13,153,000 -37.1% Calendar 2020 Latin America
123 Volotea 3,800,000 -50.0% Calendar 2020 Europe &
Russia
124 Wideroe 1,767,471 -41.1% Calendar 2020 Europe &
Russia
125 Wizz Air 10,186,077 -74.6% FY ended 31
March 2021
Europe &
Russia
■ Refer to page 7 for details. * Estimates by IdeaWorks. End of Table.
2021 Datalex Big Book of Airline Data Page 18
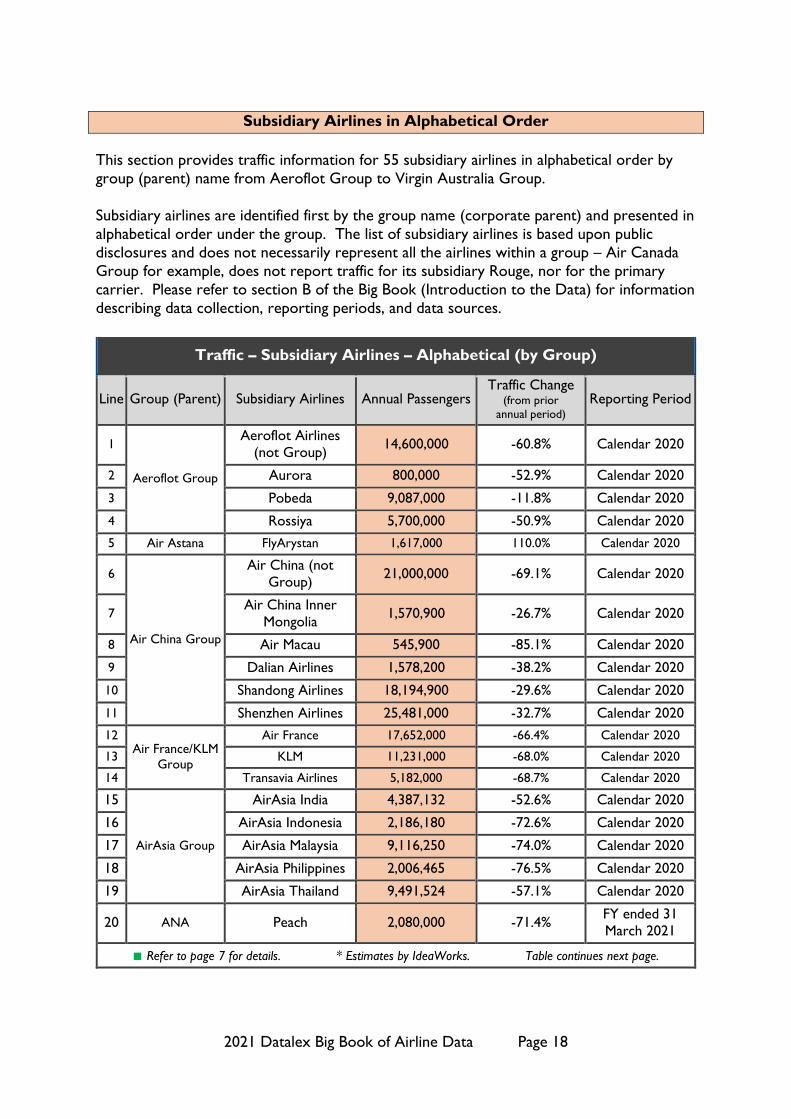
Subsidiary Airlines in Alphabetical Order
This section provides traffic information for 55 subsidiary airlines in alphabetical order by
group (parent) name from Aeroflot Group to Virgin Australia Group.
Subsidiary airlines are identified first by the group name (corporate parent) and presented in
alphabetical order under the group. The list of subsidiary airlines is based upon public
disclosures and does not necessarily represent all the airlines within a group – Air Canada
Group for example, does not report traffic for its subsidiary Rouge, nor for the primary
carrier. Please refer to section B of the Big Book (Introduction to the Data) for information
describing data collection, reporting periods, and data sources.
Traffic – Subsidiary Airlines – Alphabetical (by Group)
Line Group (Parent) Subsidiary Airlines Annual Passengers Traffic Change
(from prior
annual period) Reporting Period
1
Aeroflot Group
Aeroflot Airlines
(not Group) 14,600,000 -60.8% Calendar 2020
2 Aurora 800,000 -52.9% Calendar 2020
3 Pobeda 9,087,000 -11.8% Calendar 2020
4 Rossiya 5,700,000 -50.9% Calendar 2020
5 Air Astana FlyArystan 1,617,000 110.0% Calendar 2020
6
Air China Group
Air China (not
Group) 21,000,000 -69.1% Calendar 2020
7 Air China Inner
Mongolia 1,570,900 -26.7% Calendar 2020
8 Air Macau 545,900 -85.1% Calendar 2020
9 Dalian Airlines 1,578,200 -38.2% Calendar 2020
10 Shandong Airlines 18,194,900 -29.6% Calendar 2020
11 Shenzhen Airlines 25,481,000 -32.7% Calendar 2020
12 Air France/KLM
Group
Air France 17,652,000 -66.4% Calendar 2020
13 KLM 11,231,000 -68.0% Calendar 2020
14 Transavia Airlines 5,182,000 -68.7% Calendar 2020
15
AirAsia Group
AirAsia India 4,387,132 -52.6% Calendar 2020
16 AirAsia Indonesia 2,186,180 -72.6% Calendar 2020
17 AirAsia Malaysia 9,116,250 -74.0% Calendar 2020
18 AirAsia Philippines 2,006,465 -76.5% Calendar 2020
19 AirAsia Thailand 9,491,524 -57.1% Calendar 2020
20 ANA Peach 2,080,000 -71.4% FY ended 31
March 2021
■ Refer to page 7 for details. * Estimates by IdeaWorks. Table continues next page.

2021 Datalex Big Book of Airline Data Page 19
Traffic – Subsidiary Airlines – Alphabetical (by Group)
Line Group (Parent) Subsidiary Airlines Annual Passengers Traffic Change
(from prior
annual period) Reporting Period
21
China Eastern
Group
China Eastern (not
Group) 40,357,110 -48.8% Calendar 2020
22 China United Airlines 5,199,900 -43.3% Calendar 2020
23 Eastern Air Jiangsu 7,993,600 -41.4% Calendar 2020
24 Eastern Air Wuhan 3,201,500 -52.8% Calendar 2020
25 Eastern Air Yunnan 9,555,600 -35.1% Calendar 2020
26 Shanghai Airlines 8,313,500 -48.9% Calendar 2020
27
China Southern
Group
Chongqing Airlines 3,326,800 -24.3% Calendar 2020
28 Guizhou Airlines 2,799,700 -29.4% Calendar 2020
29 Henan Airlines 4,342,000 -28.3% Calendar 2020
30 Shantou Airlines 2,113,700 -36.5% Calendar 2020
31 Xiamen Airlines 26,908,800 -32.5% Calendar 2020
32 Zhuhai Airlines 1,737,500 -30.4% Calendar 2020
33 EVA Air Tigerair Taiwan 344,602 -87.6% Calendar 2020
34 Garuda Garuda Citilink 5,494,679 -55.0% Calendar 2020
35
Int'l Airlines
Group IAG
Aer Lingus 2,118,000 -81.8% Calendar 2020
36 British Airways 12,285,000 -74.3% Calendar 2020
37 Iberia 6,796,000 -69.7% Calendar 2020
38 LEVEL 445,000 -76.3% Calendar 2020
39 Vueling Airlines 9,631,000 -72.1% Calendar 2020
40 Kenya Airways
Group Jambojet 250,000 n/a Calendar 2020
41
LATAM Group
LATAM Brasil 14,400,000 -54.3% Calendar 2020
42 LATAM Chile 3,600,000 -59.1% Calendar 2020
43 LATAM Colombia 2,200,000 -56.9% Calendar 2020
44 LATAM Ecuador 500,000 -58.3% Calendar 2020
45 LATAM Peru 3,100,000 -64.0% Calendar 2020
46
Lufthansa Group
Austrian 3,114,000 -78.7% Calendar 2020
47 Brussels 2,362,000 -76.4% Calendar 2020
48 Eurowings 7,235,000 -74.2% Calendar 2020
49 Lufthansa Airlines 17,996,000 -74.8% Calendar 2020
50 SWISS 5,677,000 -73.7% Calendar 2020
■ Refer to page 7 for details. * Estimates by IdeaWorks. Table continues next page.
2021 Datalex Big Book of Airline Data Page 20
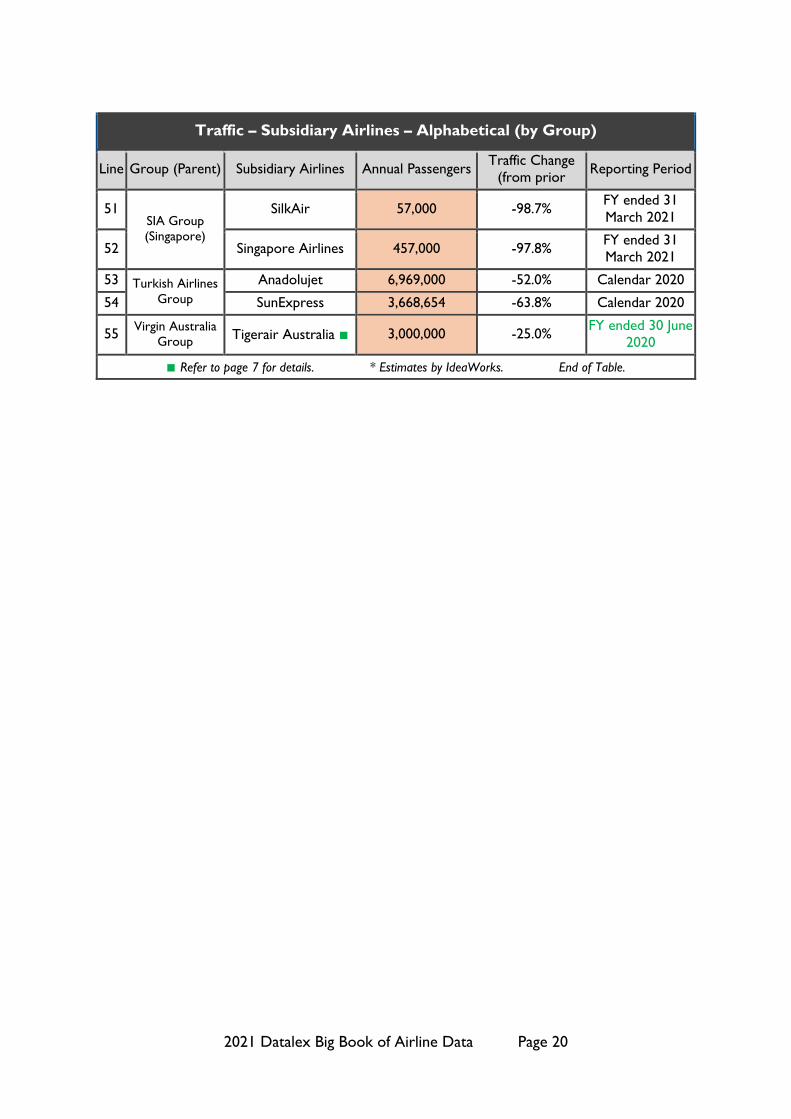
Traffic – Subsidiary Airlines – Alphabetical (by Group)
Line Group (Parent) Subsidiary Airlines Annual Passengers Traffic Change
(from prior Reporting Period
51 SIA Group
(Singapore)
SilkAir 57,000 -98.7% FY ended 31
March 2021
52 Singapore Airlines 457,000 -97.8% FY ended 31
March 2021
53 Turkish Airlines
Group
Anadolujet 6,969,000 -52.0% Calendar 2020
54 SunExpress 3,668,654 -63.8% Calendar 2020
55 Virgin Australia
Group Tigerair Australia ■ 3,000,000 -25.0%
FY ended 30 June
2020
■ Refer to page 7 for details. * Estimates by IdeaWorks. End of Table.

2021 Datalex Big Book of Airline Data Page 21
Primary Airlines by Traffic
This section provides traffic information for 125 primary airlines in order of descending
passenger loads. The top of the list is dominated by three China and three US airlines:
China Southern Group, American, China Eastern Group, Delta, Air China Group, and
United. The strength of China’s domestic market during the pandemic unseated the
dominance of the big three US carriers. While the top of the list certainly contains the
world’s largest carriers, the last entries on the list do not represent the world’s smallest
airlines. This Big Book contains airlines which have disclosed revenue and traffic statistics;
the smallest airlines of the world often make no such disclosures.
Primary airlines include individual airlines, such as Air Greenland and Allegiant, not affiliated
with a corporate group structure. Group airlines are also included. These groups feature
multiple carriers under a single corporate ownership structure. Examples of groups include
Air China and Lufthansa. Using the example of Lufthansa Group, this structure includes
Austrian, Brussels, Eurowings, Lufthansa Airlines, and SWISS as subsidiary airlines under the
group. Traffic detail for subsidiary airlines, where available, is provided in the section which
follows the primary airlines alphabetical listing. Please refer to section B of the Big Book
(Introduction to the Data) for information describing data collection, reporting periods, and
data sources.
Primary Airlines by Traffic
Rank Airlines Annual
Passengers
Traffic Change (from prior
annual period) Reporting Period World Region
1 China Southern
Group 96,856,040 -36.1% Calendar 2020
Asia & South
Pacific
2 American 95,324,000 -55.7% Calendar 2020 US & Canada
3 China Eastern Group 74,621,210 -42.7% Calendar 2020 Asia & South
Pacific
4 Delta 70,145,000 -64.9% Calendar 2020 US & Canada
5 Air China Group 68,687,070 -40.3% Calendar 2020 Asia & South
Pacific
6 United 57,761,000 -64.4% Calendar 2020 US & Canada
7 Southwest Airlines 54,088,000 -59.7% Calendar 2020 US & Canada
8 easyJet ■ 48,100,000 -49.9% FY ended 30
September 2020 Europe & Russia
9 Asiana Airlines
Group 39,400,000 -68.1% Calendar 2020
Asia & South
Pacific
10 Hainan Airlines
Group 37,032,000 -54.7% Calendar 2020
Asia & South
Pacific
11 Lufthansa Group 36,354,000 -75.0% Calendar 2020 Europe & Russia
12 Air France/KLM
Group 34,065,000 -67.3% Calendar 2020 Europe & Russia
■ Refer to page 7 for details. * Estimates by IdeaWorks. Table continues next page.

2021 Datalex Big Book of Airline Data Page 22
Primary Airlines by Traffic
Continued
Rank Airlines Annual
Passengers
Traffic Change (from prior
annual period) Reporting Period World Region
13 Int'l Airlines Group
IAG 31,275,000 -73.6% Calendar 2020 Europe & Russia
14 Aeroflot Group 30,300,000 -50.2% Calendar 2020 Europe & Russia
15 IndiGo 29,336,170 -60.9% FY ended 31
March 2021
Asia & South
Pacific
16 LATAM Group 28,299,000 -61.9% Calendar 2020 Latin America
17 Turkish Airlines
Group 27,950,200 -62.4% Calendar 2020 Europe & Russia
18 Ryanair Group 27,500,000 -81.5% FY ended 31
March 2021 Europe & Russia
19 Spring Airlines 18,591,900 -17.0% Calendar 2020 Asia & South
Pacific
20 Virgin Australia
Group ■ 18,500,000 -25.4%
FY ended 30
June 2020
Asia & South
Pacific
21 Spirit Airlines 18,444,000 -46.6% Calendar 2020 US & Canada
22 Alaska Air Group 17,927,000 -61.6% Calendar 2020 US & Canada
23 GOL Linhas Aereas 16,775,000 -54.0% Calendar 2020 Latin America
24 Vietnam Airlines 16,400,000 -28.4% Calendar 2020 Asia & South
Pacific
25 Juneyao Air 15,716,850 -28.6% Calendar 2020 Asia & South
Pacific
26 VietJet Air 15,000,000 -39.8% Calendar 2020 Asia & South
Pacific
27 Azul 14,796,000 -46.5% Calendar 2020 Latin America
28 Pegasus 14,710,000 -51.8% Calendar 2020 Europe & Russia
29 JetBlue Airways 14,274,000 -66.6% Calendar 2020 US & Canada
30 Air Canada Group 13,760,000 -73.3% Calendar 2020 US & Canada
31 Air New Zealand ■ 13,525,000 -23.8% FY ended 30
June 2020
Asia & South
Pacific
32 AirAsia Group (exc.
AirAsia X) 13,309,353 -74.2% Calendar 2020
Asia & South
Pacific
33 Volaris 13,153,000 -37.1% Calendar 2020 Latin America
34 ANA All Nippon
Airways 13,088,042 -70.9%
FY ended 31
March 2021
Asia & South
Pacific
35 SAS Group 12,610,000 -57.6% FY ended 31
October 2020 Europe & Russia
36 Saudi Arabian
Airlines * 12,600,000 -65.0% Calendar 2020
Middle East &
Africa
■ Refer to page 7 for details. * Estimates by IdeaWorks. Table continues next page.

2021 Datalex Big Book of Airline Data Page 23
Primary Airlines by Traffic
Continued
Rank Airlines Annual
Passengers
Traffic Change (from prior
annual period) Reporting Period World Region
37 Japan Airlines Group 12,569,650 -70.1% FY ended 31
March 2021
Asia & South
Pacific
38 S7 Airlines 12,300,000 -31.3% Calendar 2020 Europe & Russia
39 Frontier Airlines 11,238,000 -50.5% Calendar 2020 US & Canada
40 Wizz Air 10,186,077 -74.6% FY ended 31
March 2021 Europe & Russia
41 SpiceJet 10,015,139 -58.8% Calendar 2020 Asia & South
Pacific
42 Aeromexico 9,484,000 -54.2% Calendar 2020 Latin America
43 Qantas Airways
(includes Loyalty) 9,206,000 -70.1%
Calendar 2020
(Not regular
period)
Asia & South
Pacific
44 Qatar Airways * 8,800,000 -70.2% FY ended 31
March 2021
Middle East &
Africa
45 Allegiant Air 8,623,984 -42.6% Calendar 2020 US & Canada
46 Viva Aerobus 8,123,000 -32.4% Calendar 2020 Latin America
47 TUI Group (Markets
& Airlines) ■ 8,057,000 -61.8%
FY ended 30
September 2020 Europe & Russia
48 Avianca 7,647,943 -75.0% Calendar 2020 Latin America
49 Korean Air 7,312,000 -73.2% Calendar 2020 Asia & South
Pacific
50 Jetstar Group 7,308,000 -70.8%
Calendar 2020
(Not regular
period)
Asia & South
Pacific
51 Norwegian 6,870,000 -81.0% Calendar 2020 Europe & Russia
52 Emirates Airline 6,600,000 -88.3% Calendar 2020 Middle East &
Africa
53 Air India 6,280,837 -71.2% FY ended 31
March 2021
Asia & South
Pacific
54 Thai Airways Int’l. 5,870,000 -69.8% Calendar 2020 Asia & South
Pacific
55 Ural Airlines 5,632,000 -41.4% Calendar 2020 Europe & Russia
56 Jeju Air 5,519,000 -59.0% Calendar 2020 Asia & South
Pacific
57 GoAir 5,437,792 -64.5% Calendar 2020 Asia & South
Pacific
■ Refer to page 7 for details. * Estimates by IdeaWorks. Table continues next page.
2021 Datalex Big Book of Airline Data Page 24
Primary Airlines by Traffic
Continued
Rank Airlines Annual
Passengers
Traffic Change (from prior
annual period) Reporting Period World Region
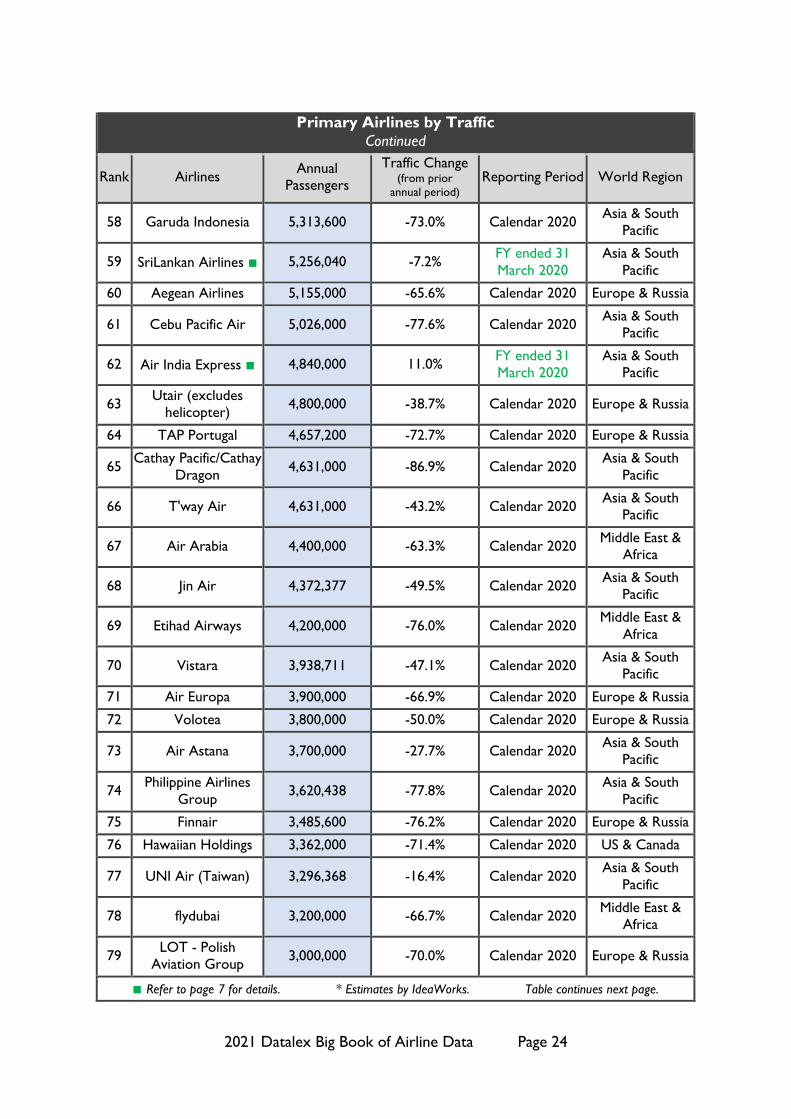
58 Garuda Indonesia 5,313,600 -73.0% Calendar 2020 Asia & South
Pacific
59 SriLankan Airlines ■ 5,256,040 -7.2% FY ended 31
March 2020
Asia & South
Pacific
60 Aegean Airlines 5,155,000 -65.6% Calendar 2020 Europe & Russia
61 Cebu Pacific Air 5,026,000 -77.6% Calendar 2020 Asia & South
Pacific
62 Air India Express ■ 4,840,000 11.0% FY ended 31
March 2020
Asia & South
Pacific
63 Utair (excludes
helicopter) 4,800,000 -38.7% Calendar 2020 Europe & Russia
64 TAP Portugal 4,657,200 -72.7% Calendar 2020 Europe & Russia
65 Cathay Pacific/Cathay
Dragon 4,631,000 -86.9% Calendar 2020
Asia & South
Pacific
66 T'way Air 4,631,000 -43.2% Calendar 2020 Asia & South
Pacific
67 Air Arabia 4,400,000 -63.3% Calendar 2020 Middle East &
Africa
68 Jin Air 4,372,377 -49.5% Calendar 2020 Asia & South
Pacific
69 Etihad Airways 4,200,000 -76.0% Calendar 2020 Middle East &
Africa
70 Vistara 3,938,711 -47.1% Calendar 2020 Asia & South
Pacific
71 Air Europa 3,900,000 -66.9% Calendar 2020 Europe & Russia
72 Volotea 3,800,000 -50.0% Calendar 2020 Europe & Russia
73 Air Astana 3,700,000 -27.7% Calendar 2020 Asia & South
Pacific
74 Philippine Airlines
Group 3,620,438 -77.8% Calendar 2020
Asia & South
Pacific
75 Finnair 3,485,600 -76.2% Calendar 2020 Europe & Russia
76 Hawaiian Holdings 3,362,000 -71.4% Calendar 2020 US & Canada
77 UNI Air (Taiwan) 3,296,368 -16.4% Calendar 2020 Asia & South
Pacific
78 flydubai 3,200,000 -66.7% Calendar 2020 Middle East &
Africa
79 LOT - Polish
Aviation Group 3,000,000 -70.0% Calendar 2020 Europe & Russia
■ Refer to page 7 for details. * Estimates by IdeaWorks. Table continues next page.

2021 Datalex Big Book of Airline Data Page 25
Primary Airlines by Traffic
Continued
Rank Airlines Annual
Passengers
Traffic Change (from prior
annual period) Reporting Period World Region
80 Nordwind Airlines 2,939,000 -46.9% Calendar 2020 Europe & Russia
81 Copa Airlines 2,852,000 -81.5% Calendar 2020 Latin America
82 PIA Pakistan 2,541,000 -52.0% Calendar 2020 Asia & South
Pacific
83 China Airlines 2,390,313 -84.7% Calendar 2020 Asia & South
Pacific
84 EVA Air 2,330,025 -81.8% Calendar 2020 Asia & South
Pacific
85 Aerolineas
Argentinas 2,226,000 -77.8% Calendar 2020 Latin America
86 Azur Air 1,930,037 -66.7% Calendar 2020 Europe & Russia
87 Bangkok Airways 1,884,600 -67.8% Calendar 2020 Asia & South
Pacific
88 Jet2.com 1,880,000 -91.0% FY ended 31
March 2021 Europe & Russia
89 Mandarin Airlines 1,854,366 -33.2% Calendar 2020 Asia & South
Pacific
90 SKY Airline (Chile) 1,800,604 -61.1% Calendar 2020 Latin America
91 Kenya Airways
Group 1,800,000 -65.1% Calendar 2020
Middle East &
Africa
92 Smartwings Group 1,800,000 -81.4% Calendar 2020 Europe & Russia
93 Wideroe 1,767,471 -41.1% Calendar 2020 Europe & Russia
94 Sun Country Airlines 1,679,242 -58.9% Calendar 2020 US & Canada
95 Red Wings 1,536,902 -49.9% Calendar 2020 Europe & Russia
96 airBaltic 1,340,000 -73.5% Calendar 2020 Europe & Russia
97 JetSMART Chile 1,235,387 -45.9% Calendar 2020 Latin America
98 Azimuth Airlines 1,221,638 -2.1% Calendar 2020 Europe & Russia
99 Virgin Atlantic
Airways 1,192,999 -79.7% Calendar 2020 Europe & Russia
100 AirAsia X 1,144,004 -81.2% Calendar 2020 Asia & South
Pacific
101 Loganair ■ 1,047,281 33.2% FY ended 31
March 2020 Europe & Russia
102 Tunisair 997,451 -71.1% Calendar 2020 Middle East &
Africa
103 El Al 905,000 -84.5% Calendar 2020 Middle East &
Africa
■ Refer to page 7 for details. * Estimates by IdeaWorks. Table continues next page.

2021 Datalex Big Book of Airline Data Page 26
Primary Airlines by Traffic
Continued
Rank Airlines Annual
Passengers
Traffic Change (from prior
annual period) Reporting Period World Region
104 REX - Regional
Express ■ 892,000 -29.8%
FY ended 30 June
2020
Asia & South
Pacific
105 Icelandair 891,000 -79.8% Calendar 2020 Europe & Russia
106 Edelweiss Air 870,000 -67.4% Calendar 2020 Europe & Russia
107 Alliance India 792,436 -52.3% Calendar 2020 Asia & South
Pacific
108 Royal Jordanian 751,000 -77.2% Calendar 2020 Middle East &
Africa
109 Jazeera Airways 696,093 -71.0% Calendar 2020 Middle East &
Africa
110 Solaseed Air 659,609 -63.3% FY ended 31
March 2021
Asia & South
Pacific
111 Luxair 658,873 -69.3% Calendar 2020 Europe & Russia
112 Croatia Airlines 618,000 -71.6% Calendar 2020 Europe & Russia
113 AIRDO 579,631 -71.6% FY ended 31
March 2021
Asia & South
Pacific
114 HK Express 572,000 -69.7% Calendar 2020 Asia & South
Pacific
115 CSA Czech Airlines 500,000 -80.8% Calendar 2020 Europe & Russia
116 SIA Group
(Singapore) 457,000 -98.7%
FY ended 31
March 2021
Asia & South
Pacific
117 Starflyer 457,000 -72.7% FY ended 31
March 2021
Asia & South
Pacific
118 SATA Air Acores 361,297 -52.9% Calendar 2020 Europe & Russia
119 SATA International 304,640 -67.8% Calendar 2020 Europe & Russia
120 Flybondi (Argentina) 304,000 -78.9% Calendar 2020 Latin America
121 Air Greenland 246,000 -43.8% Calendar 2020 Europe & Russia
122 Atlantic Airways 148,717 -56.0% Calendar 2020 Europe & Russia
123 Daily Air (Taiwan) 106,588 12.5% Calendar 2020 Asia & South
Pacific
124 Scoot 82,000 -99.2% FY ended 31
March 2021
Asia & South
Pacific
125 Starlux (Taiwan) 34,784 n/a Calendar 2020 Asia & South
Pacific
■ Refer to page 7 for details. * Estimates by IdeaWorks. End of Table.

2021 Datalex Big Book of Airline Data Page 27
Primary Airlines Traffic by World Region
This section provides traffic information for 125 primary airlines in order of descending
passenger numbers. The largest traffic-producing airline in each region is: Asia & South
Pacific – China Southern Group; Europe & Russia – easyJet; Latin America – LATAM; Middle
East & Africa – Saudi Arabian Airlines (among calendar year 2020 results); and US & Canada
– American. The home office location determines a carrier’s assigned world region.
Primary airlines include individual airlines, such as Air Greenland and Allegiant, not affiliated
with a corporate group structure. Group airlines are also included. These groups feature
multiple carriers under a single corporate ownership structure. Examples of groups include
Air China and Lufthansa. Using the example of Lufthansa Group, this structure includes
Austrian, Brussels, Eurowings, Lufthansa Airlines, and SWISS as subsidiary airlines under the
group. Traffic detail for subsidiary airlines is provided in the section which follows the
primary airlines alphabetical listing. Please refer to section B of the Big Book (Introduction
to the Data) for information describing data collection, reporting periods, and data sources. The weighted average for each world region was calculated using the traffic change for
individual airlines weighted by the traffic for the airline.
Traffic – Primary Airlines – World Regions
Rank Airlines
Based In: Airlines Annual Passengers
Traffic Change (from prior
annual period) Reporting Period
1
Asia & South
Pacific
China Southern
Group 96,856,040 -36.1% Calendar 2020
2 China Eastern Group 74,621,210 -42.7% Calendar 2020
3 Air China Group 68,687,070 -40.3% Calendar 2020
4 Asiana Airlines
Group 39,400,000 -68.1% Calendar 2020
5 Hainan Airlines
Group 37,032,000 -54.7% Calendar 2020
6 IndiGo 29,336,170 -60.9% FY ended 31
March 2021
7 Spring Airlines 18,591,900 -17.0% Calendar 2020
8 Virgin Australia
Group ■ 18,500,000 -25.4%
FY ended 30
June 2020
9 Vietnam Airlines 16,400,000 -28.4% Calendar 2020
10 Juneyao Air 15,716,850 -28.6% Calendar 2020
11 VietJet Air 15,000,000 -39.8% Calendar 2020
12 Air New Zealand ■ 13,525,000 -23.8% FY ended 30
June 2020
13 AirAsia Group (exc.
AirAsia X) 13,309,353 -74.2% Calendar 2020
■ Refer to page 7 for details. * Estimates by IdeaWorks. Table continues next page.
2021 Datalex Big Book of Airline Data Page 28
Traffic – Primary Airlines – World Regions
Continued
Rank Airlines
Based In: Airlines Annual Passengers
Traffic Change (from prior
annual period) Reporting Period
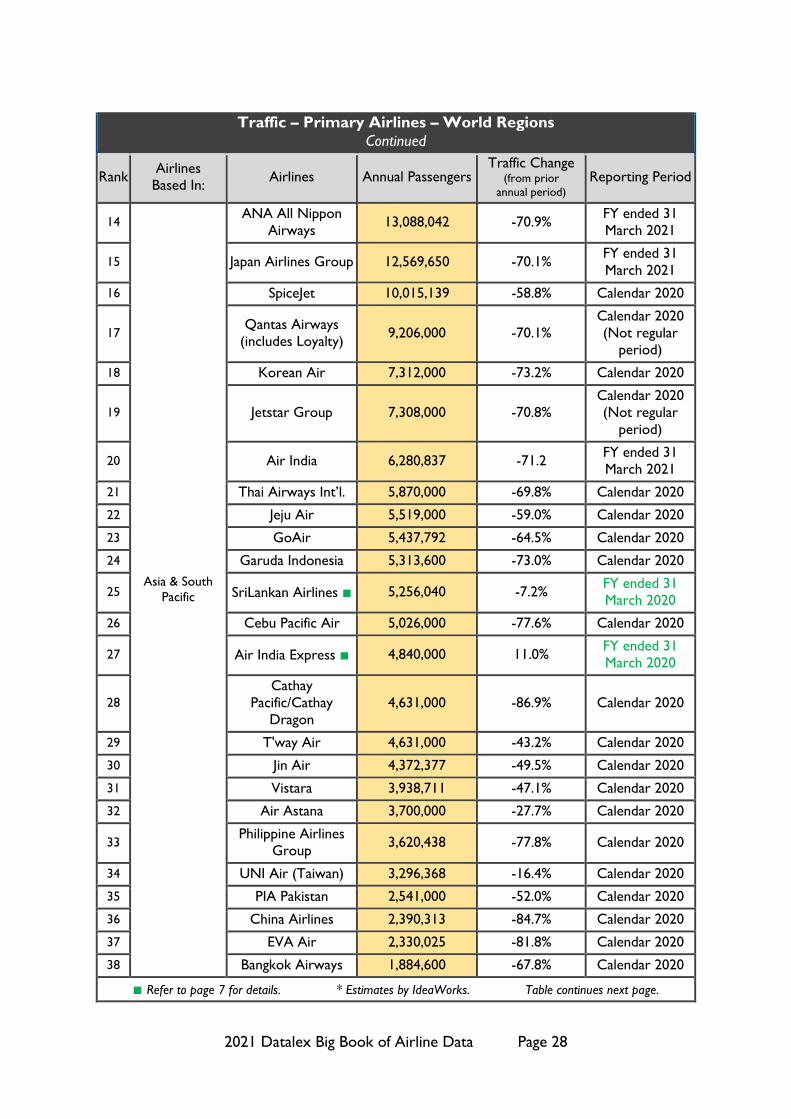
14
Asia & South
Pacific
ANA All Nippon
Airways 13,088,042 -70.9%
FY ended 31
March 2021
15 Japan Airlines Group 12,569,650 -70.1% FY ended 31
March 2021
16 SpiceJet 10,015,139 -58.8% Calendar 2020
17 Qantas Airways
(includes Loyalty) 9,206,000 -70.1%
Calendar 2020
(Not regular
period)
18 Korean Air 7,312,000 -73.2% Calendar 2020
19 Jetstar Group 7,308,000 -70.8%
Calendar 2020
(Not regular
period)
20 Air India 6,280,837 -71.2 FY ended 31
March 2021
21 Thai Airways Int’l. 5,870,000 -69.8% Calendar 2020
22 Jeju Air 5,519,000 -59.0% Calendar 2020
23 GoAir 5,437,792 -64.5% Calendar 2020
24 Garuda Indonesia 5,313,600 -73.0% Calendar 2020
25 SriLankan Airlines ■ 5,256,040 -7.2% FY ended 31
March 2020
26 Cebu Pacific Air 5,026,000 -77.6% Calendar 2020
27 Air India Express ■ 4,840,000 11.0% FY ended 31
March 2020
28
Cathay
Pacific/Cathay
Dragon
4,631,000 -86.9% Calendar 2020
29 T'way Air 4,631,000 -43.2% Calendar 2020
30 Jin Air 4,372,377 -49.5% Calendar 2020
31 Vistara 3,938,711 -47.1% Calendar 2020
32 Air Astana 3,700,000 -27.7% Calendar 2020
33 Philippine Airlines
Group 3,620,438 -77.8% Calendar 2020
34 UNI Air (Taiwan) 3,296,368 -16.4% Calendar 2020
35 PIA Pakistan 2,541,000 -52.0% Calendar 2020
36 China Airlines 2,390,313 -84.7% Calendar 2020
37 EVA Air 2,330,025 -81.8% Calendar 2020
38 Bangkok Airways 1,884,600 -67.8% Calendar 2020
■ Refer to page 7 for details. * Estimates by IdeaWorks. Table continues next page.

2021 Datalex Big Book of Airline Data Page 29
Traffic – Primary Airlines – World Regions
Continued
Rank Airlines
Based In: Airlines Annual Passengers
Traffic Change (from prior
annual period) Reporting Period
39
Asia & South
Pacific
Mandarin Airlines 1,854,366 -33.2% Calendar 2020
40 AirAsia X 1,144,004 -81.2% Calendar 2020
41 REX - Regional
Express ■ 892,000 -29.8%
FY ended 30 June
2020
42 Alliance India 792,436 -52.3% Calendar 2020
43 Solaseed Air 659,609 -63.3% FY ended 31
March 2021
44 AIRDO 579,631 -71.6% FY ended 31
March 2021
45 HK Express 572,000 -69.7% Calendar 2020
46 SIA Group
(Singapore) 457,000 -98.7%
FY ended 31
March 2021
47 Starflyer 457,000 -72.7% FY ended 31
March 2021
48 Daily Air (Taiwan) 106,588 12.5% Calendar 2020
49 Scoot 82,000 -99.2% FY ended 31
March 2021
50 Starlux (Taiwan) 34,784 n/a Calendar 2020
Total for Asia & South Pacific: 604,984,943 Weighted Change: -47.1%
1
Europe & Russia
easyJet ■ 48,100,000 -49.9% FY ended 30
September 2020
2 Lufthansa Group 36,354,000 -75.0% Calendar 2020
3 Air France/KLM
Group 34,065,000 -67.3% Calendar 2020
4 Int'l Airlines Group
IAG 31,275,000 -73.6% Calendar 2020
5 Aeroflot Group 30,300,000 -50.2% Calendar 2020
6 Turkish Airlines
Group 27,950,200 -62.4% Calendar 2020
7 Ryanair Group 27,500,000 -81.5% FY ended 31
March 2021
8 Pegasus 14,710,000 -51.8% Calendar 2020
9 SAS Group 12,610,000 -57.6% FY ended 31
October 2020
10 S7 Airlines 12,300,000 -31.3% Calendar 2020
11 Wizz Air 10,186,077 -74.6% FY ended 31
March 2021
■ Refer to page 7 for details. * Estimates by IdeaWorks. Table continues next page.
2021 Datalex Big Book of Airline Data Page 30
Traffic – Primary Airlines – World Regions
Continued
Rank Airlines
Based In: Airlines Annual Passengers
Traffic Change (from prior
annual period) Reporting Period
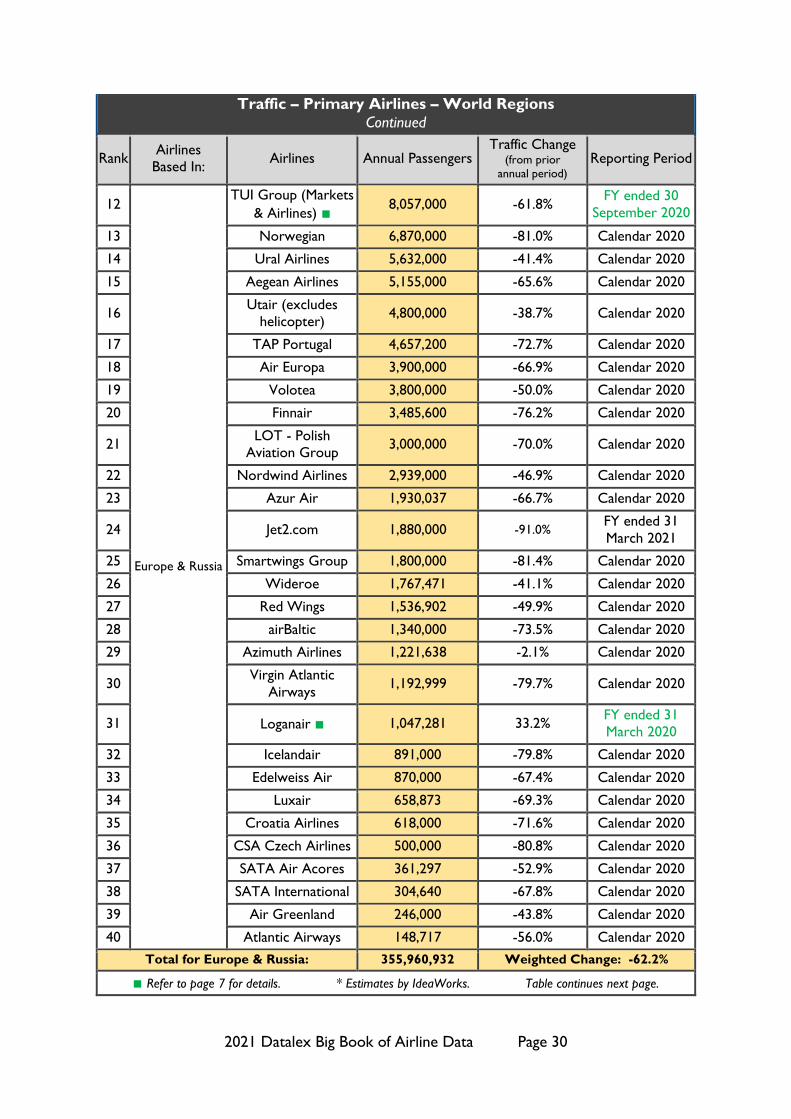
12
Europe & Russia
TUI Group (Markets
& Airlines) ■ 8,057,000 -61.8%
FY ended 30
September 2020
13 Norwegian 6,870,000 -81.0% Calendar 2020
14 Ural Airlines 5,632,000 -41.4% Calendar 2020
15 Aegean Airlines 5,155,000 -65.6% Calendar 2020
16 Utair (excludes
helicopter) 4,800,000 -38.7% Calendar 2020
17 TAP Portugal 4,657,200 -72.7% Calendar 2020
18 Air Europa 3,900,000 -66.9% Calendar 2020
19 Volotea 3,800,000 -50.0% Calendar 2020
20 Finnair 3,485,600 -76.2% Calendar 2020
21 LOT - Polish
Aviation Group 3,000,000 -70.0% Calendar 2020
22 Nordwind Airlines 2,939,000 -46.9% Calendar 2020
23 Azur Air 1,930,037 -66.7% Calendar 2020
24 Jet2.com 1,880,000 -91.0% FY ended 31
March 2021
25 Smartwings Group 1,800,000 -81.4% Calendar 2020
26 Wideroe 1,767,471 -41.1% Calendar 2020
27 Red Wings 1,536,902 -49.9% Calendar 2020
28 airBaltic 1,340,000 -73.5% Calendar 2020
29 Azimuth Airlines 1,221,638 -2.1% Calendar 2020
30 Virgin Atlantic
Airways 1,192,999 -79.7% Calendar 2020
31 Loganair ■ 1,047,281 33.2% FY ended 31
March 2020
32 Icelandair 891,000 -79.8% Calendar 2020
33 Edelweiss Air 870,000 -67.4% Calendar 2020
34 Luxair 658,873 -69.3% Calendar 2020
35 Croatia Airlines 618,000 -71.6% Calendar 2020
36 CSA Czech Airlines 500,000 -80.8% Calendar 2020
37 SATA Air Acores 361,297 -52.9% Calendar 2020
38 SATA International 304,640 -67.8% Calendar 2020
39 Air Greenland 246,000 -43.8% Calendar 2020
40 Atlantic Airways 148,717 -56.0% Calendar 2020
Total for Europe & Russia: 355,960,932 Weighted Change: -62.2%
■ Refer to page 7 for details. * Estimates by IdeaWorks. Table continues next page.

2021 Datalex Big Book of Airline Data Page 31
Traffic – Primary Airlines – World Regions
Continued
Rank Airlines
Based In: Airlines Annual Passengers
Traffic Change (from prior
annual period) Reporting Period
1
Latin America
LATAM Group 28,299,000 -61.9% Calendar 2020
2 GOL Linhas Aereas 16,775,000 -54.0% Calendar 2020
3 Azul 14,796,000 -46.5% Calendar 2020
4 Volaris 13,153,000 -37.1% Calendar 2020
5 Aeromexico 9,484,000 -54.2% Calendar 2020
6 Viva Aerobus 8,123,000 -32.4% Calendar 2020
7 Avianca 7,647,943 -75.0% Calendar 2020
8 Copa Airlines 2,852,000 -81.5% Calendar 2020
9 Aerolineas
Argentinas 2,226,000 -77.8% Calendar 2020
10 SKY Airline (Chile) 1,800,604 -61.1% Calendar 2020
11 JetSMART Chile 1,235,387 -45.9% Calendar 2020
12 Flybondi (Argentina) 304,000 -78.9% Calendar 2020
Total for Latin America: 106,695,934 Weighted Change: -54.2%
1
Middle East &
Africa
Saudi Arabian
Airlines * 12,600,000 -65.0% Calendar 2020
2 Qatar Airways * 8,800,000 -70.2% FY ended 31
March 2021
3 Emirates Airline 6,600,000 -88.3% Calendar 2020
4 Air Arabia 4,400,000 -63.3% Calendar 2020
5 Etihad Airways 4,200,000 -76.0% Calendar 2020
6 flydubai 3,200,000 -66.7% Calendar 2020
7 Kenya Airways
Group 1,800,000 -65.1% Calendar 2020
8 Tunisair 997,451 -71.1% Calendar 2020
9 El Al 905,000 -84.5% Calendar 2020
10 Royal Jordanian 751,000 -77.2% Calendar 2020
11 Jazeera Airways 696,093 -71.0% Calendar 2020
Total for Middle East & Africa: 44,949,544 Weighted Change: -64.1%
■ Refer to page 7 for details. * Estimates by IdeaWorks. Table continues next page.

2021 Datalex Big Book of Airline Data Page 32
Traffic – Primary Airlines – World Regions
Continued
Rank Airlines
Based In: Airlines Annual Passengers
Traffic Change (from prior
annual period) Reporting Period
1
US & Canada
American 95,324,000 -55.7% Calendar 2020
2 Delta 70,145,000 -64.9% Calendar 2020
3 United 57,761,000 -64.4% Calendar 2020
4 Southwest Airlines 54,088,000 -59.7% Calendar 2020
5 Spirit Airlines 18,444,000 -46.6% Calendar 2020
6 Alaska Air Group 17,927,000 -61.6% Calendar 2020
7 JetBlue Airways 14,274,000 -66.6% Calendar 2020
8 Air Canada Group 13,760,000 -73.3% Calendar 2020
9 Frontier Airlines 11,238,000 -50.5% Calendar 2020
10 Allegiant Air 8,623,984 -42.6% Calendar 2020
11 Hawaiian Holdings 3,362,000 -71.4% Calendar 2020
12 Sun Country Airlines 1,679,242 -58.9% Calendar 2020
Total for US & Canada: 366,626,226 Weighted Change: -60.0%
Weighted change (from prior annual period) for all 125 airlines: -54.9%
■ Refer to page 7 for details. * Estimates by IdeaWorks. End of Table.

2021 Datalex Big Book of Airline Data Page 33
Asia & South
Pacific
40.9%
Europe &
Russia
24.0%Latin America
7.2%
Middle East &
Africa
3.0%
US & Canada
24.8%
Passenger Traffic by World Region2020 Financial Period
World region designated by headquarters location of disclosing airlines.
Percentages are rounded and may not add up to 100%.Carrier data is based upon individual listings from the
2021 Datalex Big Book of Airline Data by IdeaWorksCompany.

2021 Datalex Big Book of Airline Data Page 34
2021 Datalex Big Book of Airline Data Page 35
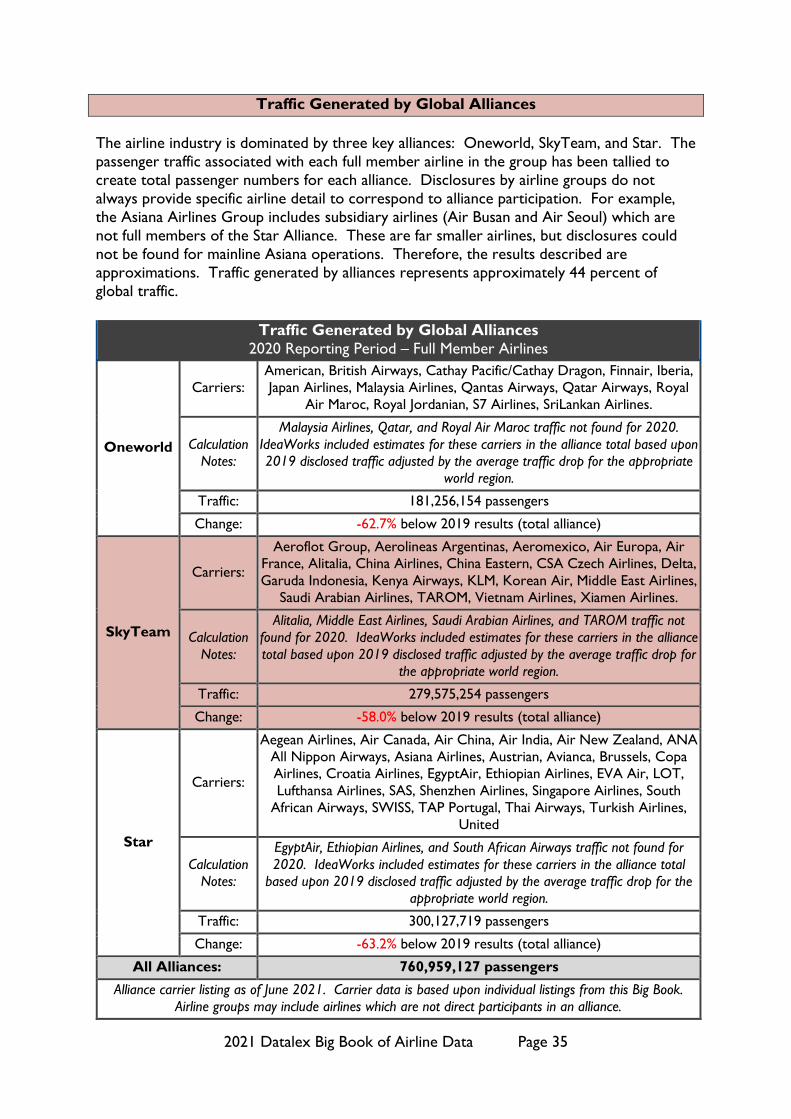
Traffic Generated by Global Alliances
The airline industry is dominated by three key alliances: Oneworld, SkyTeam, and Star. The
passenger traffic associated with each full member airline in the group has been tallied to
create total passenger numbers for each alliance. Disclosures by airline groups do not
always provide specific airline detail to correspond to alliance participation. For example,
the Asiana Airlines Group includes subsidiary airlines (Air Busan and Air Seoul) which are
not full members of the Star Alliance. These are far smaller airlines, but disclosures could
not be found for mainline Asiana operations. Therefore, the results described are
approximations. Traffic generated by alliances represents approximately 44 percent of
global traffic.
Traffic Generated by Global Alliances
2020 Reporting Period – Full Member Airlines
Oneworld
Carriers:
American, British Airways, Cathay Pacific/Cathay Dragon, Finnair, Iberia,
Japan Airlines, Malaysia Airlines, Qantas Airways, Qatar Airways, Royal
Air Maroc, Royal Jordanian, S7 Airlines, SriLankan Airlines.
Calculation
Notes:
Malaysia Airlines, Qatar, and Royal Air Maroc traffic not found for 2020.
IdeaWorks included estimates for these carriers in the alliance total based upon
2019 disclosed traffic adjusted by the average traffic drop for the appropriate
world region.
Traffic: 181,256,154 passengers
Change: -62.7% below 2019 results (total alliance)
SkyTeam
Carriers:
Aeroflot Group, Aerolineas Argentinas, Aeromexico, Air Europa, Air
France, Alitalia, China Airlines, China Eastern, CSA Czech Airlines, Delta,
Garuda Indonesia, Kenya Airways, KLM, Korean Air, Middle East Airlines,
Saudi Arabian Airlines, TAROM, Vietnam Airlines, Xiamen Airlines.
Calculation
Notes:
Alitalia, Middle East Airlines, Saudi Arabian Airlines, and TAROM traffic not
found for 2020. IdeaWorks included estimates for these carriers in the alliance
total based upon 2019 disclosed traffic adjusted by the average traffic drop for
the appropriate world region.
Traffic: 279,575,254 passengers
Change: -58.0% below 2019 results (total alliance)
Star
Carriers:
Aegean Airlines, Air Canada, Air China, Air India, Air New Zealand, ANA
All Nippon Airways, Asiana Airlines, Austrian, Avianca, Brussels, Copa
Airlines, Croatia Airlines, EgyptAir, Ethiopian Airlines, EVA Air, LOT,
Lufthansa Airlines, SAS, Shenzhen Airlines, Singapore Airlines, South
African Airways, SWISS, TAP Portugal, Thai Airways, Turkish Airlines,
United
Calculation
Notes:
EgyptAir, Ethiopian Airlines, and South African Airways traffic not found for
2020. IdeaWorks included estimates for these carriers in the alliance total
based upon 2019 disclosed traffic adjusted by the average traffic drop for the
appropriate world region.
Traffic: 300,127,719 passengers
Change: -63.2% below 2019 results (total alliance)
All Alliances: 760,959,127 passengers
Alliance carrier listing as of June 2021. Carrier data is based upon individual listings from this Big Book.
Airline groups may include airlines which are not direct participants in an alliance.
2021 Datalex Big Book of Airline Data Page 36
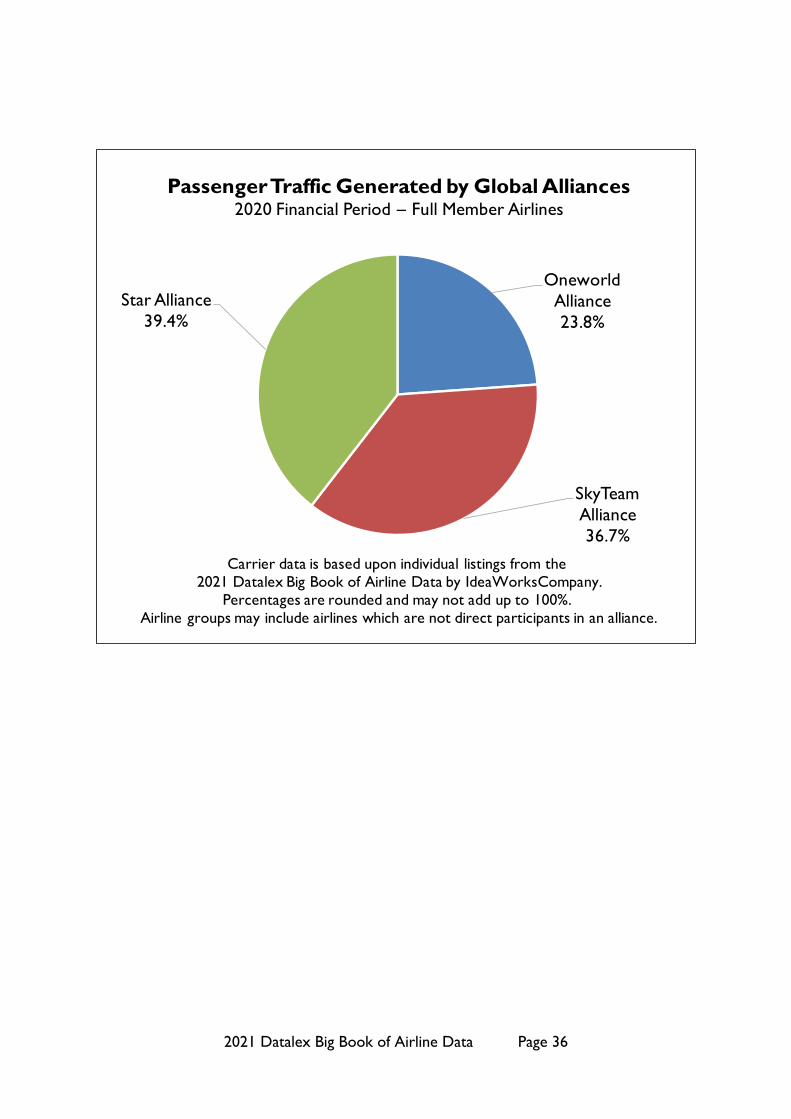
Oneworld
Alliance
23.8%
SkyTeam
Alliance
36.7%
Star Alliance
39.4%
Passenger Traffic Generated by Global Alliances2020 Financial Period – Full Member Airlines
Carrier data is based upon individual listings from the 2021 Datalex Big Book of Airline Data by IdeaWorksCompany.
Percentages are rounded and may not add up to 100%. Airline groups may include airlines which are not direct participants in an alliance.
2021 Datalex Big Book of Airline Data Page 37
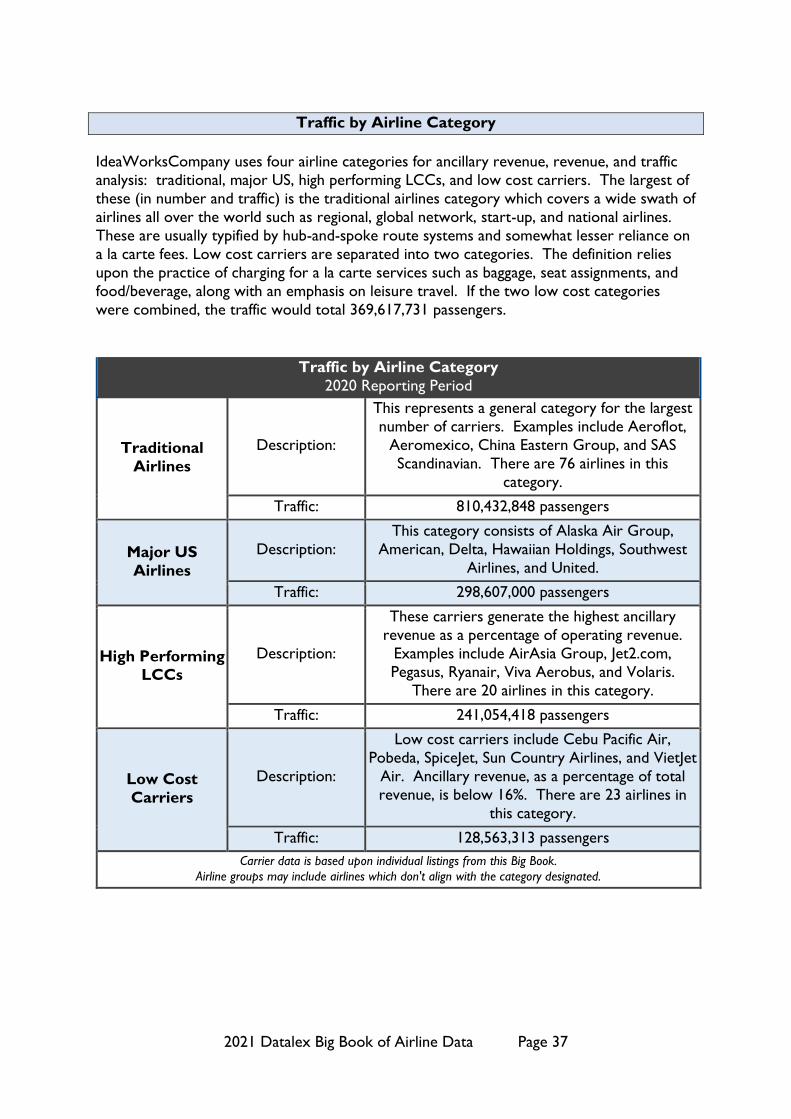
Traffic by Airline Category
IdeaWorksCompany uses four airline categories for ancillary revenue, revenue, and traffic
analysis: traditional, major US, high performing LCCs, and low cost carriers. The largest of
these (in number and traffic) is the traditional airlines category which covers a wide swath of
airlines all over the world such as regional, global network, start-up, and national airlines.
These are usually typified by hub-and-spoke route systems and somewhat lesser reliance on
a la carte fees. Low cost carriers are separated into two categories. The definition relies
upon the practice of charging for a la carte services such as baggage, seat assignments, and
food/beverage, along with an emphasis on leisure travel. If the two low cost categories
were combined, the traffic would total 369,617,731 passengers.
Traffic by Airline Category
2020 Reporting Period
Traditional
Airlines
Description:
This represents a general category for the largest
number of carriers. Examples include Aeroflot,
Aeromexico, China Eastern Group, and SAS
Scandinavian. There are 76 airlines in this
category.
Traffic: 810,432,848 passengers
Major US
Airlines
Description:
This category consists of Alaska Air Group,
American, Delta, Hawaiian Holdings, Southwest
Airlines, and United.
Traffic: 298,607,000 passengers
High Performing
LCCs
Description:
These carriers generate the highest ancillary
revenue as a percentage of operating revenue.
Examples include AirAsia Group, Jet2.com,
Pegasus, Ryanair, Viva Aerobus, and Volaris.
There are 20 airlines in this category.
Traffic: 241,054,418 passengers
Low Cost
Carriers
Description:
Low cost carriers include Cebu Pacific Air,
Pobeda, SpiceJet, Sun Country Airlines, and VietJet
Air. Ancillary revenue, as a percentage of total
revenue, is below 16%. There are 23 airlines in
this category.
Traffic: 128,563,313 passengers
Carrier data is based upon individual listings from this Big Book.
Airline groups may include airlines which don't align with the category designated.

2021 Datalex Big Book of Airline Data Page 38
High
Performing
LCCs
16.3%
Traditional
Airlines
54.8%
Low Cost
Carriers
8.7%
US Major
Airlines
20.2%
Passenger Traffic by Airline Category2020 Financial Period
Carrier data is based upon individual listings from the 2021 Datalex Big Book of Airline Data by IdeaWorksCompany.
Percentages are rounded and may not add up to 100%. Airline groups may include airlines which don't align with the category designated.

2021 Datalex Big Book of Airline Data Page 39

2021 Datalex Big Book of Airline Data Page 40
D. Airline Revenue for the 2020 Period
Primary Airlines in Alphabetical Order
This section provides revenue information for 109 primary airlines in alphabetical order
from Aegean Airlines to Wizz Air. Primary airlines include individual airlines, such as Air
Greenland and Allegiant, not affiliated with a corporate group structure. Group airlines are
also included. These groups feature multiple carriers under a single corporate ownership
structure. Examples of groups include Air China and Lufthansa. Using the example of
Lufthansa Group, this structure includes Austrian, Brussels, Eurowings, Lufthansa Airlines,
and SWISS as subsidiary airlines under the group. Revenue detail for subsidiary airlines is
provided in the section which follows the primary airlines listing. Please refer to section B
of the Big Book (Introduction to the Data) for information describing data collection,
reporting periods, and data sources. The 2020 versus 2019 revenue decrease among all
primary airlines was 52.4% (using weighted averages).
Revenue – Primary Airlines – Alphabetical
Line Airlines Annual Revenue Revenue Change
(from prior
annual period) Reporting Period World Region
1 Aegean Airlines $467,403,991 -68.4% Calendar 2020 Europe & Russia
2 Aeroflot Group $4,268,356,015 -60.4% Calendar 2020 Europe & Russia
3 Aeromexico $1,249,228,420 -65.3% Calendar 2020 Latin America
4 Air Arabia $504,007,080 -61.1% Calendar 2020 Middle East &
Africa
5 Air Astana $400,264,000 -55.5% Calendar 2020 Asia & South
Pacific
6 Air Canada Group $4,295,138,642 -70.5% Calendar 2020 US & Canada
7 Air China Group $9,829,100,637 -50.5% Calendar 2020 Asia & South
Pacific
8 Air Europa $591,151,760 -75.1% Calendar 2020 Europe & Russia
9 Air France/KLM
Group $12,485,125,169 -59.4% Calendar 2020 Europe & Russia
10 Air Greenland $170,653,842 -19.4% Calendar 2020 Europe & Russia
11 Air India * $973,040,392 -74.7% FY ended 31
March 2021
Asia & South
Pacific
12 Air India Express ■ $676,094,636 13.8% FY ended 31
March 2020
Asia & South
Pacific
13 Air New Zealand ■ $3,130,720,058 -18.9% FY ended 30 June
2020
Asia & South
Pacific
14 AirAsia Group (exc.
AirAsia X) $730,533,074 -74.1% Calendar 2020
Asia & South
Pacific
15 AirAsia X $263,676,242 -76.2% Calendar 2020 Asia & South
Pacific
■ Refer to page 7 for details. * Estimates by IdeaWorks. Table continues next page.
2021 Datalex Big Book of Airline Data Page 41
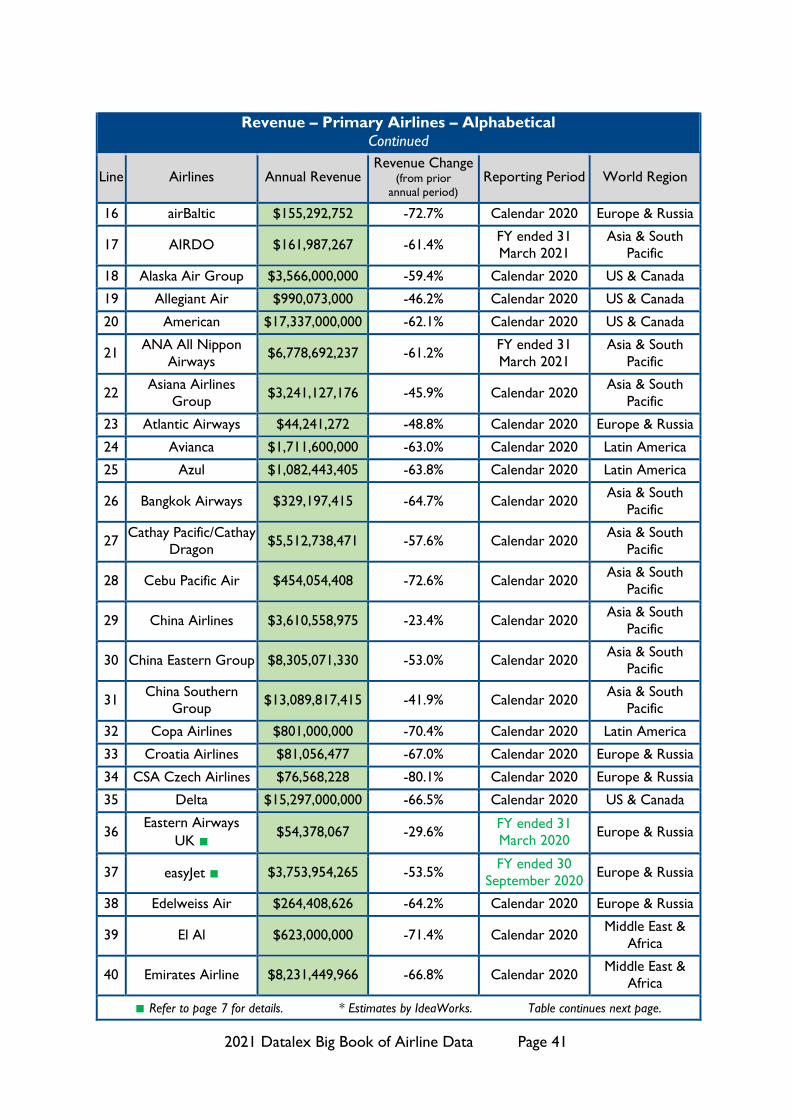
Revenue – Primary Airlines – Alphabetical
Continued
Line Airlines Annual Revenue Revenue Change
(from prior
annual period) Reporting Period World Region
16 airBaltic $155,292,752 -72.7% Calendar 2020 Europe & Russia
17 AIRDO $161,987,267 -61.4% FY ended 31
March 2021
Asia & South
Pacific
18 Alaska Air Group $3,566,000,000 -59.4% Calendar 2020 US & Canada
19 Allegiant Air $990,073,000 -46.2% Calendar 2020 US & Canada
20 American $17,337,000,000 -62.1% Calendar 2020 US & Canada
21 ANA All Nippon
Airways $6,778,692,237 -61.2%
FY ended 31
March 2021
Asia & South
Pacific
22 Asiana Airlines
Group $3,241,127,176 -45.9% Calendar 2020
Asia & South
Pacific
23 Atlantic Airways $44,241,272 -48.8% Calendar 2020 Europe & Russia
24 Avianca $1,711,600,000 -63.0% Calendar 2020 Latin America
25 Azul $1,082,443,405 -63.8% Calendar 2020 Latin America
26 Bangkok Airways $329,197,415 -64.7% Calendar 2020 Asia & South
Pacific
27 Cathay Pacific/Cathay
Dragon $5,512,738,471 -57.6% Calendar 2020
Asia & South
Pacific
28 Cebu Pacific Air $454,054,408 -72.6% Calendar 2020 Asia & South
Pacific
29 China Airlines $3,610,558,975 -23.4% Calendar 2020 Asia & South
Pacific
30 China Eastern Group $8,305,071,330 -53.0% Calendar 2020 Asia & South
Pacific
31 China Southern
Group $13,089,817,415 -41.9% Calendar 2020
Asia & South
Pacific
32 Copa Airlines $801,000,000 -70.4% Calendar 2020 Latin America
33 Croatia Airlines $81,056,477 -67.0% Calendar 2020 Europe & Russia
34 CSA Czech Airlines $76,568,228 -80.1% Calendar 2020 Europe & Russia
35 Delta $15,297,000,000 -66.5% Calendar 2020 US & Canada
36 Eastern Airways
UK ■ $54,378,067 -29.6%
FY ended 31
March 2020 Europe & Russia
37 easyJet ■ $3,753,954,265 -53.5% FY ended 30
September 2020 Europe & Russia
38 Edelweiss Air $264,408,626 -64.2% Calendar 2020 Europe & Russia
39 El Al $623,000,000 -71.4% Calendar 2020 Middle East &
Africa
40 Emirates Airline $8,231,449,966 -66.8% Calendar 2020 Middle East &
Africa
■ Refer to page 7 for details. * Estimates by IdeaWorks. Table continues next page.

2021 Datalex Big Book of Airline Data Page 42
Revenue – Primary Airlines – Alphabetical
Continued
Line Airlines Annual Revenue Revenue Change
(from prior
annual period) Reporting Period World Region
41 Ethiopian Airlines ■ $3,300,000,000 -15.5% Period ended July
2020
Middle East &
Africa
42 Etihad Airways $1,200,000,000 -78.6% Calendar 2020 Middle East &
Africa
43 EVA Air $3,023,840,204 -48.2% Calendar 2020 Asia & South
Pacific
44 Finnair $933,681,980 -73.3% Calendar 2020 Europe & Russia
45 flydubai $762,423,417 -53.3% Calendar 2020 Middle East &
Africa
46 Frontier Airlines $1,250,000,000 -50.2% Calendar 2020 US & Canada
47 GOL Linhas Aereas $1,190,535,842 -67.2% Calendar 2020 Latin America
48 Hainan Airlines
Group $4,157,842,527 -60.6% Calendar 2020
Asia & South
Pacific
49 Hawaiian Holdings $844,813,000 -70.2% Calendar 2020 US & Canada
50 HK Express $111,085,654 -54.2% Calendar 2020 Asia & South
Pacific
51 Icelandair $433,591,000 -62.6% Calendar 2020 Europe & Russia
52 IndiGo $2,076,010,186 -61.6% FY ended 31
March 2021
Asia & South
Pacific
53 Int'l Airlines Group
IAG $8,789,582,167 -69.5% Calendar 2020 Europe & Russia
54 Japan Airlines Group $4,476,673,906 -65.0% FY ended 31
March 2021
Asia & South
Pacific
55 Jazeera Airways $134,455,539 -60.6% Calendar 2020 Middle East &
Africa
56 Jeju Air $311,215,486 -73.7% Calendar 2020 Asia & South
Pacific
57 Jet2.com $493,291,298 -89.1% FY ended 31
March 2021 Europe & Russia
58 JetBlue Airways $2,957,000,000 -63.5% Calendar 2020 US & Canada
59 Jetstar Group $878,481,018 -68.1%
Calendar 2020
(Not regular
period)
Asia & South
Pacific
60 Jin Air $226,153,364 -71.1% Calendar 2020 Asia & South
Pacific
61 Juneyao Air $1,428,544,120 -41.6% Calendar 2020 Asia & South
Pacific
■ Refer to page 7 for details. * Estimates by IdeaWorks. Table continues next page.
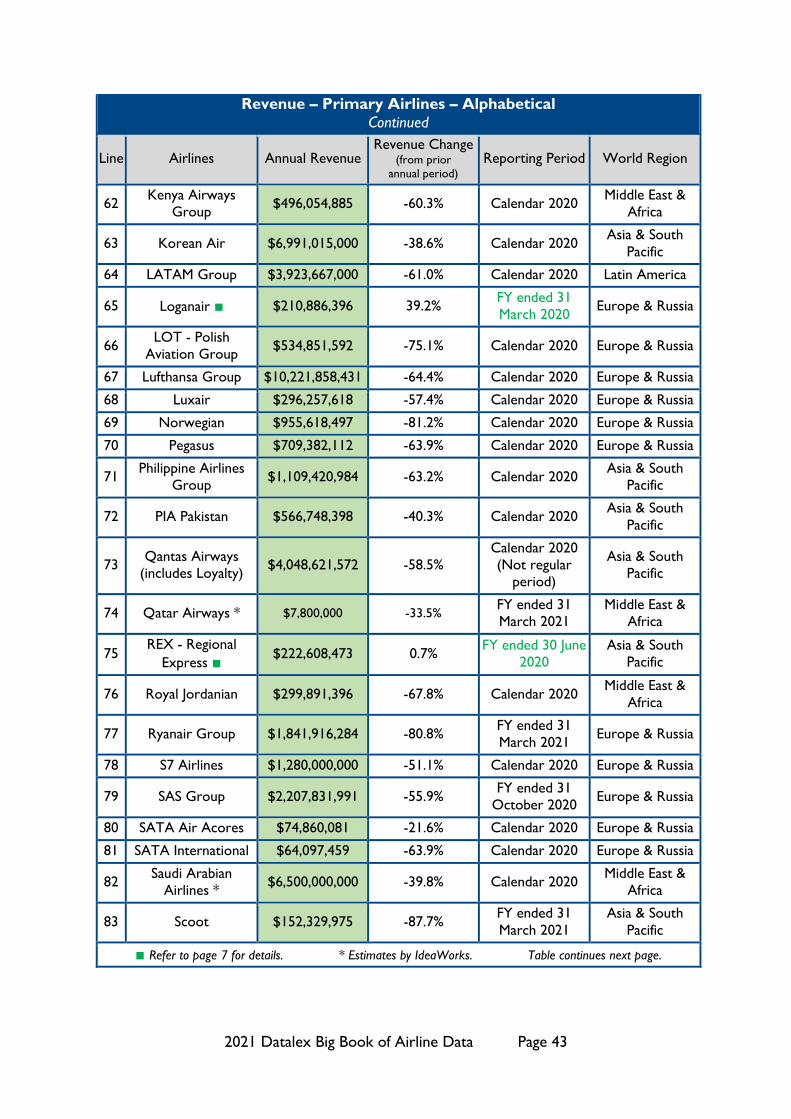
2021 Datalex Big Book of Airline Data Page 43
Revenue – Primary Airlines – Alphabetical
Continued
Line Airlines Annual Revenue Revenue Change
(from prior
annual period) Reporting Period World Region
62 Kenya Airways
Group $496,054,885 -60.3% Calendar 2020
Middle East &
Africa
63 Korean Air $6,991,015,000 -38.6% Calendar 2020 Asia & South
Pacific
64 LATAM Group $3,923,667,000 -61.0% Calendar 2020 Latin America
65 Loganair ■ $210,886,396 39.2% FY ended 31
March 2020 Europe & Russia
66 LOT - Polish
Aviation Group $534,851,592 -75.1% Calendar 2020 Europe & Russia
67 Lufthansa Group $10,221,858,431 -64.4% Calendar 2020 Europe & Russia
68 Luxair $296,257,618 -57.4% Calendar 2020 Europe & Russia
69 Norwegian $955,618,497 -81.2% Calendar 2020 Europe & Russia
70 Pegasus $709,382,112 -63.9% Calendar 2020 Europe & Russia
71 Philippine Airlines
Group $1,109,420,984 -63.2% Calendar 2020
Asia & South
Pacific
72 PIA Pakistan $566,748,398 -40.3% Calendar 2020 Asia & South
Pacific
73 Qantas Airways
(includes Loyalty) $4,048,621,572 -58.5%
Calendar 2020
(Not regular
period)
Asia & South
Pacific
74 Qatar Airways * $7,800,000 -33.5% FY ended 31
March 2021
Middle East &
Africa
75 REX - Regional
Express ■ $222,608,473 0.7%
FY ended 30 June
2020
Asia & South
Pacific
76 Royal Jordanian $299,891,396 -67.8% Calendar 2020 Middle East &
Africa
77 Ryanair Group $1,841,916,284 -80.8% FY ended 31
March 2021 Europe & Russia
78 S7 Airlines $1,280,000,000 -51.1% Calendar 2020 Europe & Russia
79 SAS Group $2,207,831,991 -55.9% FY ended 31
October 2020 Europe & Russia
80 SATA Air Acores $74,860,081 -21.6% Calendar 2020 Europe & Russia
81 SATA International $64,097,459 -63.9% Calendar 2020 Europe & Russia
82 Saudi Arabian
Airlines * $6,500,000,000 -39.8% Calendar 2020
Middle East &
Africa
83 Scoot $152,329,975 -87.7% FY ended 31
March 2021
Asia & South
Pacific
■ Refer to page 7 for details. * Estimates by IdeaWorks. Table continues next page.

2021 Datalex Big Book of Airline Data Page 44
Revenue – Primary Airlines – Alphabetical
Continued
Line Airlines Annual Revenue Revenue Change
(from prior
annual period) Reporting Period World Region
84 SIA Group
(Singapore) $2,737,993,182 -76.7%
FY ended 31
March 2021
Asia & South
Pacific
85 Solaseed Air $188,425,435 -51.2% FY ended 31
March 2021
Asia & South
Pacific
86 Southwest Airlines $9,048,000,000 -59.7% Calendar 2020 US & Canada
87 Spirit Airlines $1,810,022,000 -52.7% Calendar 2020 US & Canada
88 Spring Airlines $1,325,501,962 -38.6% Calendar 2020 Asia & South
Pacific
89 SriLankan Airlines ■ $985,127,673 -5.7% FY ended 31
March 2020
Asia & South
Pacific
90 Starflyer $170,192,216 -54.3% FY ended 31
March 2021
Asia & South
Pacific
91 Sun Country Airlines $401,486,000 -42.8% Calendar 2020 US & Canada
92 Sun-Air of
Scandinavia $45,669,925 -38.6%
FY ended 31
October 2020 Europe & Russia
93 TAP Portugal $1,193,788,754 -68.0% Calendar 2020 Europe & Russia
94 Thai Airways Int’l. $1,567,260,141 -74.6% Calendar 2020 Asia & South
Pacific
95 TUI Group (Markets
& Airlines) ■ $7,517,873,981 -58.4%
FY ended 30
September 2020 Europe & Russia
96 Tunisair $169,405,378 -70.1% Calendar 2020 Middle East &
Africa
97 Turkish Airlines
Group $6,734,000,000 -49.1% Calendar 2020 Europe & Russia
98 T'way Air $224,050,837 -67.8% Calendar 2020 Asia & South
Pacific
99 United $15,355,000,000 -64.5% Calendar 2020 US & Canada
100 Ural Airlines $766,383,830 -44.1% Calendar 2020 Europe & Russia
101 Utair (excludes
helicopter) $822,846,738 -12.5% Calendar 2020 Europe & Russia
102 VietJet Air $655,480,386 -63.1% Calendar 2020 Asia & South
Pacific
103 Vietnam Airlines $1,829,507,282 -57.6% Calendar 2020 Asia & South
Pacific
104 Virgin Atlantic
Airways $1,082,895,414 -70.7% Calendar 2020 Europe & Russia
■ Refer to page 7 for details. * Estimates by IdeaWorks. Table continues next page.

2021 Datalex Big Book of Airline Data Page 45
Revenue – Primary Airlines – Alphabetical
Continued
Line Airlines Annual Revenue Revenue Change
(from prior
annual period) Reporting Period World Region
105 Virgin Australia
Group ■ $3,124,487,210 -23.0%
FY ended 30 June
2020
Asia & South
Pacific
106 Viva Aerobus $360,075,799 -46.6% Calendar 2020 Latin America
107 Volaris $970,559,350 -46.7% Calendar 2020 Latin America
108 Wideroe $427,517,641 -27.9% Calendar 2020 Europe & Russia
109 Wizz Air $832,116,477 -73.3% FY ended 31
March 2021 Europe & Russia
■ Refer to page 7 for details. * Estimates by IdeaWorks. End of Table.

2021 Datalex Big Book of Airline Data Page 46
Subsidiary Airlines in Alphabetical Order
This section provides revenue information for 43 subsidiary airlines in alphabetical order by
group name (corporate parent) from Aeroflot Group to Virgin Australia Group.
Subsidiary airlines are identified first by the group name and presented in alphabetical order
under the group. Financial disclosures provide group level results and sometimes describe
results for subsidiary airlines under the group umbrella. The list of subsidiary airlines is
based upon the disclosures made and does not always represent all of the airlines within a
group. Please refer to section B of the Big Book (Introduction to the Data) for information
describing data collection, reporting periods, and data sources.
Revenue – Subsidiary Airlines – Alphabetical (by Group)
Line Group (Parent) Subsidiary Airlines Annual Passengers Traffic Change
(from prior
annual period) Reporting Period
1 Aeroflot Group
Pobeda $535,793,927 -36.6% Calendar 2020
2 Rossiya $958,714,046 -52.2% Calendar 2020
3
Air China Group
Air China (not
Group) $5,501,171,092 -56.5% Calendar 2020
4 Air China Inner
Mongolia $138,448,496 -44.7% Calendar 2020
5 Air Macau $94,043,156 -82.5% Calendar 2020
6 Dalian Airlines $149,337,704 -45.0% Calendar 2020
7 Shandong Airlines $1,489,700,162 -46.2% Calendar 2020
8 Shenzhen Airlines $2,459,829,562 -47.1% Calendar 2020
9 Air France/KLM
Group
Air France $7,223,311,504 -61.5% Calendar 2020
10 KLM $5,765,137,163 -54.0% Calendar 2020
11 Transavia Airlines $682,358,031 -65.4% Calendar 2020
12
AirAsia Group
AirAsia India $229,183,461 -52.4% Calendar 2020
13 AirAsia Indonesia $107,672,082 -77.4% Calendar 2020
14 AirAsia Malaysia $474,923,728 -73.9% Calendar 2020
15 AirAsia Philippines $125,492,096 -76.5% Calendar 2020
16 AirAsia Thailand $429,871,933 -67.2% Calendar 2020
17 ANA Peach $204,658,582 -72.9% FY ended 31
March 2021
18 Asiana Airlines
Group
Air Busan $158,007,814 -71.0% Calendar 2020
19 Air Seoul $59,991,382 -70.1% Calendar 2020
■ Refer to page 7 for details. * Estimates by IdeaWorks. Table continues next page.

2021 Datalex Big Book of Airline Data Page 47
Revenue – Subsidiary Airlines – Alphabetical (by Group)
Continued
Line Group (Parent) Subsidiary Airlines Annual Passengers Traffic Change
(from prior
annual period) Reporting Period
20
China Eastern
Group
China Eastern (not
Group) $8,302,138,173 -30.2% Calendar 2020
21 China United
Airlines $381,122,265 -53.8% Calendar 2020
22 Eastern Air Jiangsu $643,453,174 -54.9% Calendar 2020
23 Eastern Air
Wuhan $233,340,162 -66.3% Calendar 2020
24 Eastern Air
Yunnan $855,297,757 -49.6% Calendar 2020
25 Shanghai Airlines $819,943,187 -57.7% Calendar 2020
26 China Southern
Group Xiamen Airlines $2,923,822,939 -38.6% Calendar 2020
27
Hainan Airline
Holdings
Fuzhou Airlines $142,549,626 -51.4% Calendar 2020
28 Lucky Air
(Yunnan) $556,198,095 -50.0% Calendar 2020
29 Urumqi Air $134,064,529 -55.0% Calendar 2020
30
Int’l Airlines
Group IAG
Aer Lingus $529,221,576 -78.0% Calendar 2020
31 British Airways $4,991,549,024 -70.3% Calendar 2020
32 Iberia $2,543,641,573 -60.2% Calendar 2020
33 Vueling Airlines $646,325,924 -76.7% Calendar 2020
34 Kenya Airways
Group Jambojet $16,965,725 -72.3% Calendar 2020
35
Lufthansa Group
Austrian $517,961,542 -78.3% Calendar 2020
36 Brussels $466,165,388 -70.1% Calendar 2020
37 Eurowings $673,350,005 -75.3% Calendar 2020
38 Lufthansa Airlines $4,621,117,757 -74.6% Calendar 2020
39 SWISS $1,950,237,806 -66.5% Calendar 2020
40 SIA Group
(Singapore)
SilkAir $25,041,527 -96.2% FY ended 31
March 2021
41 Singapore Airlines $2,475,738,797 -74.0% FY ended 31
March 2021
42 Turkish Airlines
Group SunExpress $564,000,000 -64.0% Calendar 2020
43 Virgin Australia
Group Tigerair Australia ■ $289,829,564 -26.1%
FY ended 30 June
2020
■ Refer to page 7 for details. * Estimates by IdeaWorks. End of Table.
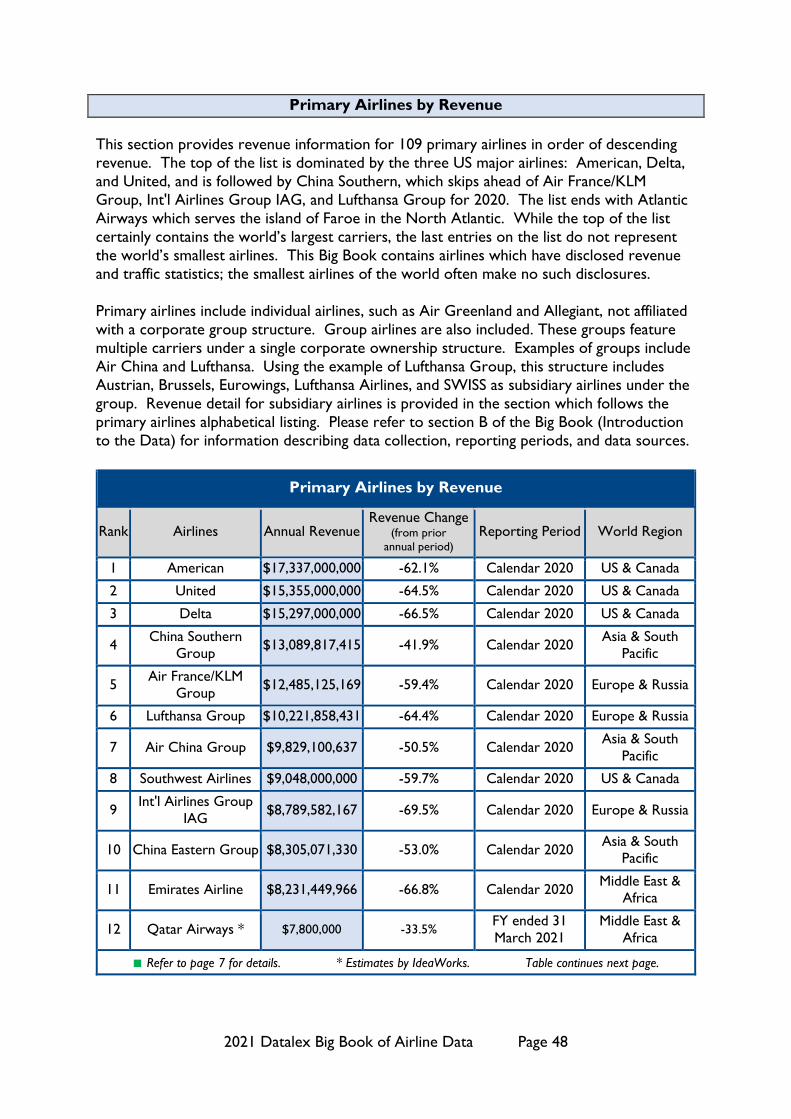
2021 Datalex Big Book of Airline Data Page 48
Primary Airlines by Revenue
This section provides revenue information for 109 primary airlines in order of descending
revenue. The top of the list is dominated by the three US major airlines: American, Delta,
and United, and is followed by China Southern, which skips ahead of Air France/KLM
Group, Int'l Airlines Group IAG, and Lufthansa Group for 2020. The list ends with Atlantic
Airways which serves the island of Faroe in the North Atlantic. While the top of the list
certainly contains the world’s largest carriers, the last entries on the list do not represent
the world’s smallest airlines. This Big Book contains airlines which have disclosed revenue
and traffic statistics; the smallest airlines of the world often make no such disclosures.
Primary airlines include individual airlines, such as Air Greenland and Allegiant, not affiliated
with a corporate group structure. Group airlines are also included. These groups feature
multiple carriers under a single corporate ownership structure. Examples of groups include
Air China and Lufthansa. Using the example of Lufthansa Group, this structure includes
Austrian, Brussels, Eurowings, Lufthansa Airlines, and SWISS as subsidiary airlines under the
group. Revenue detail for subsidiary airlines is provided in the section which follows the
primary airlines alphabetical listing. Please refer to section B of the Big Book (Introduction
to the Data) for information describing data collection, reporting periods, and data sources.
Primary Airlines by Revenue
Rank Airlines Annual Revenue Revenue Change
(from prior
annual period) Reporting Period World Region
1 American $17,337,000,000 -62.1% Calendar 2020 US & Canada
2 United $15,355,000,000 -64.5% Calendar 2020 US & Canada
3 Delta $15,297,000,000 -66.5% Calendar 2020 US & Canada
4 China Southern
Group $13,089,817,415 -41.9% Calendar 2020
Asia & South
Pacific
5 Air France/KLM
Group $12,485,125,169 -59.4% Calendar 2020 Europe & Russia
6 Lufthansa Group $10,221,858,431 -64.4% Calendar 2020 Europe & Russia
7 Air China Group $9,829,100,637 -50.5% Calendar 2020 Asia & South
Pacific
8 Southwest Airlines $9,048,000,000 -59.7% Calendar 2020 US & Canada
9 Int'l Airlines Group
IAG $8,789,582,167 -69.5% Calendar 2020 Europe & Russia
10 China Eastern Group $8,305,071,330 -53.0% Calendar 2020 Asia & South
Pacific
11 Emirates Airline $8,231,449,966 -66.8% Calendar 2020 Middle East &
Africa
12 Qatar Airways * $7,800,000 -33.5% FY ended 31
March 2021
Middle East &
Africa
■ Refer to page 7 for details. * Estimates by IdeaWorks. Table continues next page.

2021 Datalex Big Book of Airline Data Page 49
Primary Airlines by Revenue
Continued
Rank Airlines Annual Revenue Revenue Change
(from prior
annual period) Reporting Period World Region
13 TUI Group (Markets
& Airlines) ■ $7,517,873,981 -58.4%
FY ended 30
September 2020 Europe & Russia
14 Korean Air $6,991,015,000 -38.6% Calendar 2020 Asia & South
Pacific
15 ANA All Nippon
Airways $6,778,692,237 -61.2%
FY ended 31
March 2021
Asia & South
Pacific
16 Turkish Airlines
Group $6,734,000,000 -49.1% Calendar 2020 Europe & Russia
17 Saudi Arabian
Airlines * $6,500,000,000 -39.8% Calendar 2020
Middle East &
Africa
18 Cathay Pacific/Cathay
Dragon $5,512,738,471 -57.6% Calendar 2020
Asia & South
Pacific
19 Japan Airlines Group $4,476,673,906 -65.0% FY ended 31
March 2021
Asia & South
Pacific
20 Air Canada Group $4,295,138,642 -70.5% Calendar 2020 US & Canada
21 Aeroflot Group $4,268,356,015 -60.4% Calendar 2020 Europe & Russia
22 Hainan Airlines
Group $4,157,842,527 -60.6% Calendar 2020
Asia & South
Pacific
23 Qantas Airways
(includes Loyalty) $4,048,621,572 -58.5%
Calendar 2020
(Not regular
period)
Asia & South
Pacific
24 LATAM Group $3,923,667,000 -61.0% Calendar 2020 Latin America
25 easyJet ■ $3,753,954,265 -53.5% FY ended 30
September 2020 Europe & Russia
26 China Airlines $3,610,558,975 -23.4% Calendar 2020 Asia & South
Pacific
27 Alaska Air Group $3,566,000,000 -59.4% Calendar 2020 US & Canada
28 Ethiopian Airlines ■ $3,300,000,000 -15.5% Period ended
July 2020
Middle East &
Africa
29 Asiana Airlines
Group $3,241,127,176 -45.9% Calendar 2020
Asia & South
Pacific
30 Air New Zealand ■ $3,130,720,058 -18.9% FY ended 30
June 2020
Asia & South
Pacific
31 Virgin Australia
Group ■ $3,124,487,210 -23.0%
FY ended 30
June 2020
Asia & South
Pacific
32 EVA Air $3,023,840,204 -48.2% Calendar 2020 Asia & South
Pacific
■ Refer to page 7 for details. * Estimates by IdeaWorks. Table continues next page.
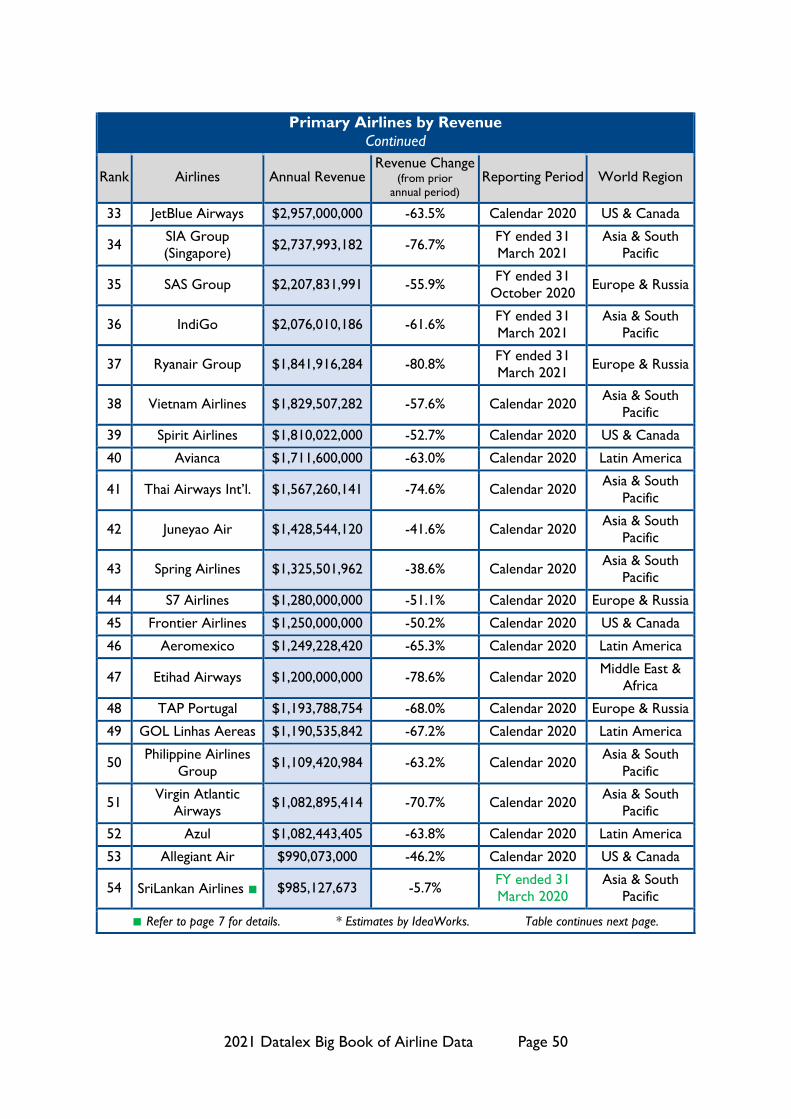
2021 Datalex Big Book of Airline Data Page 50
Primary Airlines by Revenue
Continued
Rank Airlines Annual Revenue Revenue Change
(from prior
annual period) Reporting Period World Region
33 JetBlue Airways $2,957,000,000 -63.5% Calendar 2020 US & Canada
34 SIA Group
(Singapore) $2,737,993,182 -76.7%
FY ended 31
March 2021
Asia & South
Pacific
35 SAS Group $2,207,831,991 -55.9% FY ended 31
October 2020 Europe & Russia
36 IndiGo $2,076,010,186 -61.6% FY ended 31
March 2021
Asia & South
Pacific
37 Ryanair Group $1,841,916,284 -80.8% FY ended 31
March 2021 Europe & Russia
38 Vietnam Airlines $1,829,507,282 -57.6% Calendar 2020 Asia & South
Pacific
39 Spirit Airlines $1,810,022,000 -52.7% Calendar 2020 US & Canada
40 Avianca $1,711,600,000 -63.0% Calendar 2020 Latin America
41 Thai Airways Int’l. $1,567,260,141 -74.6% Calendar 2020 Asia & South
Pacific
42 Juneyao Air $1,428,544,120 -41.6% Calendar 2020 Asia & South
Pacific
43 Spring Airlines $1,325,501,962 -38.6% Calendar 2020 Asia & South
Pacific
44 S7 Airlines $1,280,000,000 -51.1% Calendar 2020 Europe & Russia
45 Frontier Airlines $1,250,000,000 -50.2% Calendar 2020 US & Canada
46 Aeromexico $1,249,228,420 -65.3% Calendar 2020 Latin America
47 Etihad Airways $1,200,000,000 -78.6% Calendar 2020 Middle East &
Africa
48 TAP Portugal $1,193,788,754 -68.0% Calendar 2020 Europe & Russia
49 GOL Linhas Aereas $1,190,535,842 -67.2% Calendar 2020 Latin America
50 Philippine Airlines
Group $1,109,420,984 -63.2% Calendar 2020
Asia & South
Pacific
51 Virgin Atlantic
Airways $1,082,895,414 -70.7% Calendar 2020
Asia & South
Pacific
52 Azul $1,082,443,405 -63.8% Calendar 2020 Latin America
53 Allegiant Air $990,073,000 -46.2% Calendar 2020 US & Canada
54 SriLankan Airlines ■ $985,127,673 -5.7% FY ended 31
March 2020
Asia & South
Pacific
■ Refer to page 7 for details. * Estimates by IdeaWorks. Table continues next page.

2021 Datalex Big Book of Airline Data Page 51
Primary Airlines by Revenue
Continued
Rank Airlines Annual Revenue Revenue Change
(from prior
annual period) Reporting Period World Region
55 Air India * $973,040,392 -74.7% FY ended 31
March 2021
Asia & South
Pacific
56 Volaris $970,559,350 -46.7% Calendar 2020 Latin America
57 Norwegian $955,618,497 -81.2% Calendar 2020 Europe & Russia
58 Finnair $933,681,980 -73.3% Calendar 2020 Europe & Russia
59 Jetstar Group $878,481,018 -68.1%
Calendar 2020
(Not regular
period)
Asia & South
Pacific
60 Hawaiian Holdings $844,813,000 -70.2% Calendar 2020 US & Canada
61 Wizz Air $832,116,477 -73.3% FY ended 31
March 2021 Europe & Russia
62 Utair (excludes
helicopter) $822,846,738 -12.5% Calendar 2020 Europe & Russia
63 Copa Airlines $801,000,000 -70.4% Calendar 2020 Latin America
64 Ural Airlines $766,383,830 -44.1% Calendar 2020 Europe & Russia
65 flydubai $762,423,417 -53.3% Calendar 2020 Middle East &
Africa
66 AirAsia Group (exc.
AirAsia X) $730,533,074 -74.1% Calendar 2020
Asia & South
Pacific
67 Pegasus $709,382,112 -63.9% Calendar 2020 Europe & Russia
68 Air India Express ■ $676,094,636 13.8% FY ended 31
March 2020
Asia & South
Pacific
69 VietJet Air $655,480,386 -63.1% Calendar 2020 Asia & South
Pacific
70 El Al $623,000,000 -71.4% Calendar 2020 Middle East &
Africa
71 Air Europa $591,151,760 -75.1% Calendar 2020 Europe & Russia
72 PIA Pakistan $566,748,398 -40.3% Calendar 2020 Asia & South
Pacific
73 LOT - Polish
Aviation Group $534,851,592 -75.1% Calendar 2020 Europe & Russia
74 Air Arabia $504,007,080 -61.1% Calendar 2020 Middle East &
Africa
75 Kenya Airways
Group $496,054,885 -60.3% Calendar 2020
Middle East &
Africa
■ Refer to page 7 for details. * Estimates by IdeaWorks. Table continues next page.

2021 Datalex Big Book of Airline Data Page 52
Primary Airlines by Revenue
Continued
Rank Airlines Annual Revenue Revenue Change
(from prior
annual period) Reporting Period World Region
76 Jet2.com $493,291,298 -89.1% FY ended 31
March 2021 Europe & Russia
77 Aegean Airlines $467,403,991 -68.4% Calendar 2020 Europe & Russia
78 Cebu Pacific Air $454,054,408 -72.6% Calendar 2020 Asia & South
Pacific
79 Icelandair $433,591,000 -62.6% Calendar 2020 Europe & Russia
80 Wideroe $427,517,641 -27.9% Calendar 2020 Europe & Russia
81 Sun Country Airlines $401,486,000 -42.8% Calendar 2020 US & Canada
82 Air Astana $400,264,000 -55.5% Calendar 2020 Asia & South
Pacific
83 Viva Aerobus $360,075,799 -46.6% Calendar 2020 Latin America
84 Bangkok Airways $329,197,415 -64.7% Calendar 2020 Asia & South
Pacific
85 Jeju Air $311,215,486 -73.7% Calendar 2020 Asia & South
Pacific
86 Royal Jordanian $299,891,396 -67.8% Calendar 2020 Middle East &
Africa
87 Luxair $296,257,618 -57.4% Calendar 2020 Europe & Russia
88 Edelweiss Air $264,408,626 -64.2% Calendar 2020 Europe & Russia
89 AirAsia X $263,676,242 -76.2% Calendar 2020 Asia & South
Pacific
90 Jin Air $226,153,364 -71.1% Calendar 2020 Asia & South
Pacific
91 T'way Air $224,050,837 -67.8% Calendar 2020 Asia & South
Pacific
92 REX - Regional
Express ■ $222,608,473 0.7%
FY ended 30
June 2020
Asia & South
Pacific
93 Loganair ■ $210,886,396 39.2% FY ended 31
March 2020 Europe & Russia
94 Solaseed Air $188,425,435 -51.2% FY ended 31
March 2021
Asia & South
Pacific
95 Air Greenland $170,653,842 -19.4% Calendar 2020 Europe & Russia
96 Starflyer $170,192,216 -54.3% FY ended 31
March 2021 96
97 Tunisair $169,405,378 -70.1% Calendar 2020 97
■ Refer to page 7 for details. * Estimates by IdeaWorks. Table continues next page.
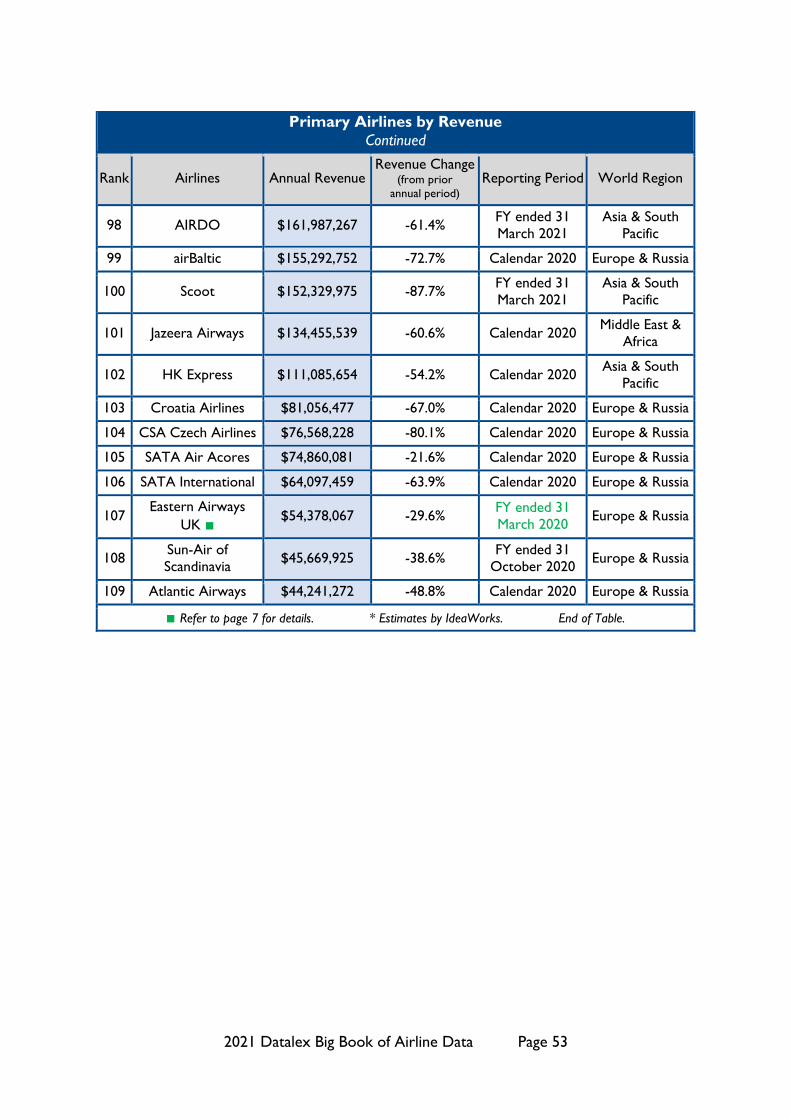
2021 Datalex Big Book of Airline Data Page 53
Primary Airlines by Revenue
Continued
Rank Airlines Annual Revenue Revenue Change
(from prior
annual period) Reporting Period World Region
98 AIRDO $161,987,267 -61.4% FY ended 31
March 2021
Asia & South
Pacific
99 airBaltic $155,292,752 -72.7% Calendar 2020 Europe & Russia
100 Scoot $152,329,975 -87.7% FY ended 31
March 2021
Asia & South
Pacific
101 Jazeera Airways $134,455,539 -60.6% Calendar 2020 Middle East &
Africa
102 HK Express $111,085,654 -54.2% Calendar 2020 Asia & South
Pacific
103 Croatia Airlines $81,056,477 -67.0% Calendar 2020 Europe & Russia
104 CSA Czech Airlines $76,568,228 -80.1% Calendar 2020 Europe & Russia
105 SATA Air Acores $74,860,081 -21.6% Calendar 2020 Europe & Russia
106 SATA International $64,097,459 -63.9% Calendar 2020 Europe & Russia
107 Eastern Airways
UK ■ $54,378,067 -29.6%
FY ended 31
March 2020 Europe & Russia
108 Sun-Air of
Scandinavia $45,669,925 -38.6%
FY ended 31
October 2020 Europe & Russia
109 Atlantic Airways $44,241,272 -48.8% Calendar 2020 Europe & Russia
■ Refer to page 7 for details. * Estimates by IdeaWorks. End of Table.

2021 Datalex Big Book of Airline Data Page 54
Primary Airlines Revenue by World Region
This section provides revenue information for 109 primary airlines in order of descending
revenue. The highest revenue-producing airline based in each region is: Asia & South Pacific
– China Southern Group; Europe & Russia – Air France/KLM Group; Latin America –
LATAM; Middle East & Africa – Emirates (among calendar year 2020 results); and US &
Canada – American. The home office location determines a carrier’s assigned world region.
Primary airlines include individual airlines, such as Air Greenland and Allegiant, not affiliated
with a corporate group structure. Group airlines are also included. These groups feature
multiple carriers under a single corporate ownership structure. Examples of groups include
Air China and Lufthansa. Using the example of Lufthansa Group, this structure includes
Austrian, Brussels, Eurowings, Lufthansa Airlines, and SWISS as subsidiary airlines under the
group. Revenue detail for subsidiary airlines is provided in the section which follows the
primary airlines alphabetical listing. Please refer to section B of the Big Book (Introduction to the Data) for information describing data collection, reporting periods, and data sources.
The weighted average for each world region was calculated using the revenue change for
individual airlines weighted by the revenue for the airline.
Revenue – Primary Airlines – World Region
Rank Airlines
Based In: Airlines Annual Revenue
Revenue Change (from prior
annual period) Reporting Period
1
Asia & South
Pacific
China Southern
Group $13,089,817,415 -41.9% Calendar 2020
2 Air China Group $9,829,100,637 -50.5% Calendar 2020
3 China Eastern Group $8,305,071,330 -53.0% Calendar 2020
4 Korean Air $6,991,015,000 -38.6% Calendar 2020
5 ANA All Nippon
Airways $6,778,692,237 -61.2%
FY ended 31
March 2021
6
Cathay
Pacific/Cathay
Dragon
$5,512,738,471 -57.6% Calendar 2020
7 Japan Airlines Group $4,476,673,906 -65.0% FY ended 31
March 2021
8 Hainan Airlines
Group $4,157,842,527 -60.6% Calendar 2020
9 Qantas Airways
(includes Loyalty) $4,048,621,572 -58.5%
Calendar 2020
(Not regular
period)
10 China Airlines $3,610,558,975 -23.4% Calendar 2020
11 Asiana Airlines
Group $3,241,127,176 -45.9% Calendar 2020
■ Refer to page 7 for details. * Estimates by IdeaWorks. Table continues next page.
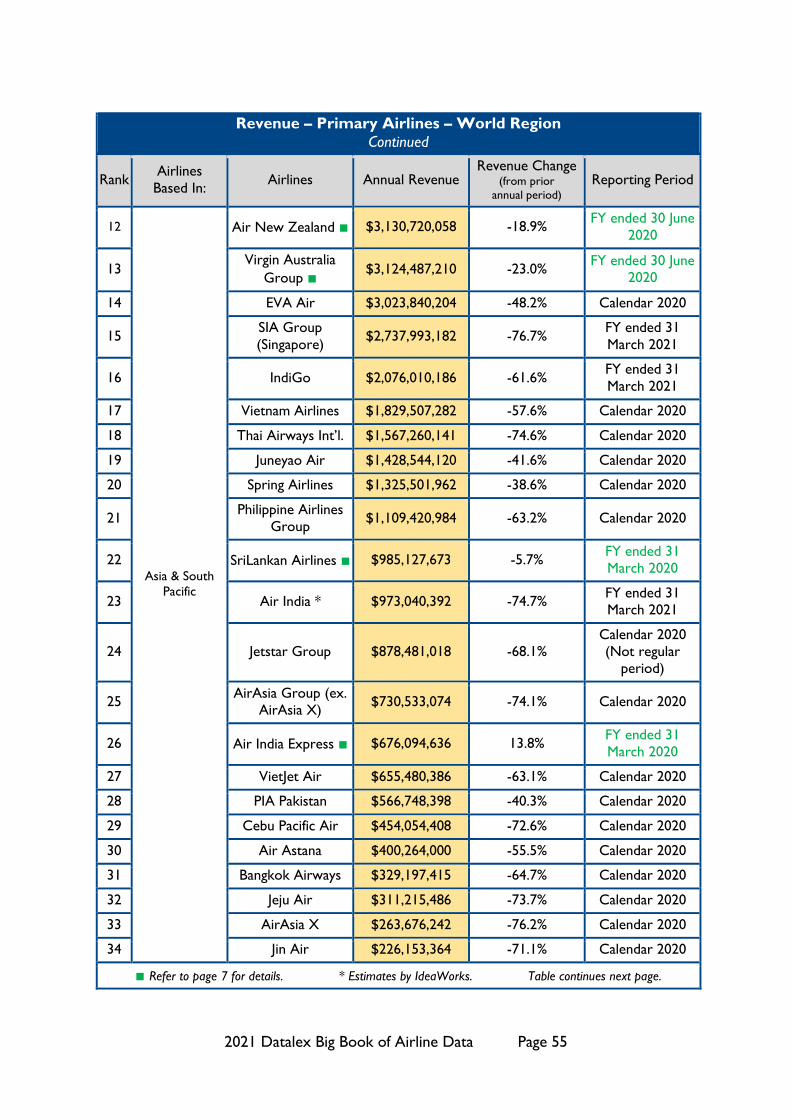
2021 Datalex Big Book of Airline Data Page 55
Revenue – Primary Airlines – World Region
Continued
Rank Airlines
Based In: Airlines Annual Revenue
Revenue Change (from prior
annual period) Reporting Period
12
Asia & South
Pacific
Air New Zealand ■ $3,130,720,058 -18.9% FY ended 30 June
2020
13 Virgin Australia
Group ■ $3,124,487,210 -23.0%
FY ended 30 June
2020
14 EVA Air $3,023,840,204 -48.2% Calendar 2020
15 SIA Group
(Singapore) $2,737,993,182 -76.7%
FY ended 31
March 2021
16 IndiGo $2,076,010,186 -61.6% FY ended 31
March 2021
17 Vietnam Airlines $1,829,507,282 -57.6% Calendar 2020
18 Thai Airways Int’l. $1,567,260,141 -74.6% Calendar 2020
19 Juneyao Air $1,428,544,120 -41.6% Calendar 2020
20 Spring Airlines $1,325,501,962 -38.6% Calendar 2020
21 Philippine Airlines
Group $1,109,420,984 -63.2% Calendar 2020
22 SriLankan Airlines ■ $985,127,673 -5.7% FY ended 31
March 2020
23 Air India * $973,040,392 -74.7% FY ended 31
March 2021
24 Jetstar Group $878,481,018 -68.1%
Calendar 2020
(Not regular
period)
25 AirAsia Group (ex.
AirAsia X) $730,533,074 -74.1% Calendar 2020
26 Air India Express ■ $676,094,636 13.8% FY ended 31
March 2020
27 VietJet Air $655,480,386 -63.1% Calendar 2020
28 PIA Pakistan $566,748,398 -40.3% Calendar 2020
29 Cebu Pacific Air $454,054,408 -72.6% Calendar 2020
30 Air Astana $400,264,000 -55.5% Calendar 2020
31 Bangkok Airways $329,197,415 -64.7% Calendar 2020
32 Jeju Air $311,215,486 -73.7% Calendar 2020
33 AirAsia X $263,676,242 -76.2% Calendar 2020
34 Jin Air $226,153,364 -71.1% Calendar 2020
■ Refer to page 7 for details. * Estimates by IdeaWorks. Table continues next page.
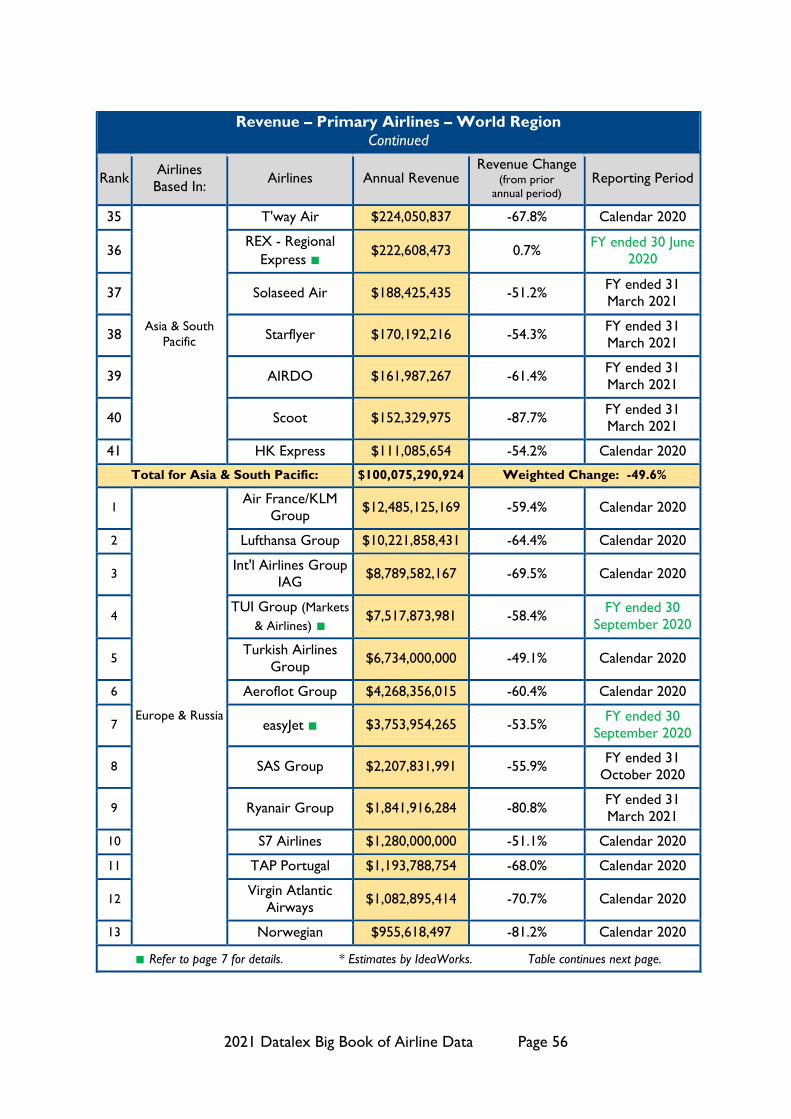
2021 Datalex Big Book of Airline Data Page 56
Revenue – Primary Airlines – World Region
Continued
Rank Airlines
Based In: Airlines Annual Revenue
Revenue Change (from prior
annual period) Reporting Period
35
Asia & South
Pacific
T'way Air $224,050,837 -67.8% Calendar 2020
36 REX - Regional
Express ■ $222,608,473 0.7%
FY ended 30 June
2020
37 Solaseed Air $188,425,435 -51.2% FY ended 31
March 2021
38 Starflyer $170,192,216 -54.3% FY ended 31
March 2021
39 AIRDO $161,987,267 -61.4% FY ended 31
March 2021
40 Scoot $152,329,975 -87.7% FY ended 31
March 2021
41 HK Express $111,085,654 -54.2% Calendar 2020
Total for Asia & South Pacific: $100,075,290,924 Weighted Change: -49.6%
1
Europe & Russia
Air France/KLM
Group $12,485,125,169 -59.4% Calendar 2020
2 Lufthansa Group $10,221,858,431 -64.4% Calendar 2020
3 Int'l Airlines Group
IAG $8,789,582,167 -69.5% Calendar 2020
4 TUI Group (Markets
& Airlines) ■ $7,517,873,981 -58.4%
FY ended 30
September 2020
5 Turkish Airlines
Group $6,734,000,000 -49.1% Calendar 2020
6 Aeroflot Group $4,268,356,015 -60.4% Calendar 2020
7 easyJet ■ $3,753,954,265 -53.5% FY ended 30
September 2020
8 SAS Group $2,207,831,991 -55.9% FY ended 31
October 2020
9 Ryanair Group $1,841,916,284 -80.8% FY ended 31
March 2021
10 S7 Airlines $1,280,000,000 -51.1% Calendar 2020
11 TAP Portugal $1,193,788,754 -68.0% Calendar 2020
12 Virgin Atlantic
Airways $1,082,895,414 -70.7% Calendar 2020
13 Norwegian $955,618,497 -81.2% Calendar 2020
■ Refer to page 7 for details. * Estimates by IdeaWorks. Table continues next page.

2021 Datalex Big Book of Airline Data Page 57
Revenue – Primary Airlines – World Region
Continued
Rank Airlines
Based In: Airlines Annual Revenue
Revenue Change (from prior
annual period) Reporting Period
14
Europe & Russia
Finnair $933,681,980 -73.3% Calendar 2020
15 Wizz Air $832,116,477 -73.3% FY ended 31
March 2021
16 Utair (excludes
helicopter) $822,846,738 -12.5% Calendar 2020
17 Ural Airlines $766,383,830 -44.1% Calendar 2020
18 Pegasus $709,382,112 -63.9% Calendar 2020
19 Air Europa $591,151,760 -75.1% Calendar 2020
20 LOT - Polish
Aviation Group $534,851,592 -75.1% Calendar 2020
21 Jet2.com $493,291,298 -89.1% FY ended 31
March 2021
22 Aegean Airlines $467,403,991 -68.4% Calendar 2020
23 Icelandair $433,591,000 -62.6% Calendar 2020
24 Wideroe $427,517,641 -27.9% Calendar 2020
25 Luxair $296,257,618 -57.4% Calendar 2020
26 Edelweiss Air $264,408,626 -64.2% Calendar 2020
27 Loganair ■ $210,886,396 39.2% FY ended 31
March 2020
28 Air Greenland $170,653,842 -19.4% Calendar 2020
29 airBaltic $155,292,752 -72.7% Calendar 2020
30 Croatia Airlines $81,056,477 -67.0% Calendar 2020
31 CSA Czech Airlines $76,568,228 -80.1% Calendar 2020
32 SATA Air Acores $74,860,081 -21.6% Calendar 2020
33 SATA International $64,097,459 -63.9% Calendar 2020
34 Eastern Airways
UK ■ $54,378,067 -29.6%
FY ended 31
March 2020
35 Sun-Air of
Scandinavia $45,669,925 -38.6%
FY ended 31
October 2020
36 Atlantic Airways $44,241,272 -48.8% Calendar 2020
Total for Europe & Russia: $70,883,390,131 Weighted Change: -60.4%
■ Refer to page 7 for details. * Estimates by IdeaWorks. Table continues next page.

2021 Datalex Big Book of Airline Data Page 58
Revenue – Primary Airlines – World Region
Continued
Rank Airlines
Based In: Airlines Annual Revenue
Revenue Change (from prior
annual period) Reporting Period
1
LATAM Group $3,923,667,000 -61.0% Calendar 2020
2 Avianca $1,711,600,000 -63.0% Calendar 2020
3 Aeromexico $1,249,228,420 -65.3% Calendar 2020
4 GOL Linhas Aereas $1,190,535,842 -67.2% Calendar 2020
5 Azul $1,082,443,405 -63.8% Calendar 2020
6 Volaris $970,559,350 -46.7% Calendar 2020
7 Copa Airlines $801,000,000 -70.4% Calendar 2020
8 Viva Aerobus $360,075,799 -46.6% Calendar 2020
Total for Latin America $11,289,109,817 Weighted Change: -61.7%
1
Middle East &
Africa
Emirates Airline $8,231,449,966 -66.8% Calendar 2020
2 Qatar Airways * $7,800,000 -33.5% FY ended 31
March 2021
3 Saudi Arabian
Airlines * $6,500,000,000 -39.8% Calendar 2020
4 Ethiopian Airlines ■ $3,300,000,000 -15.5% Period ended July
2020
5 Etihad Airways $1,200,000,000 -78.6% Calendar 2020
6 flydubai $762,423,417 -53.3% Calendar 2020
7 El Al $623,000,000 -71.4% Calendar 2020
8 Air Arabia $504,007,080 -61.1% Calendar 2020
9 Kenya Airways
Group $496,054,885 -60.3% Calendar 2020
10 Royal Jordanian $299,891,396 -67.8% Calendar 2020
11 Tunisair $169,405,378 -70.1% Calendar 2020
12 Jazeera Airways $134,455,539 -60.6% Calendar 2020
Total for Middle East & Africa: $31,020,687,661 Weighted Change: -46.3%
■ Refer to page 7 for details. * Estimates by IdeaWorks. Table continues next page.

2021 Datalex Big Book of Airline Data Page 59
Revenue – Primary Airlines – World Region
Continued
Rank Airlines
Based In: Airlines Annual Revenue
Revenue Change (from prior
annual period) Reporting Period
1
US & Canada
American $17,337,000,000 -62.1% Calendar 2020
2 United $15,355,000,000 -64.5% Calendar 2020
3 Delta $15,297,000,000 -66.5% Calendar 2020
4 Southwest Airlines $9,048,000,000 -59.7% Calendar 2020
5 Air Canada Group $4,295,138,642 -70.5% Calendar 2020
6 Alaska Air Group $3,566,000,000 -59.4% Calendar 2020
7 JetBlue Airways $2,957,000,000 -63.5% Calendar 2020
8 Spirit Airlines $1,810,022,000 -52.7% Calendar 2020
9 Frontier Airlines $1,250,000,000 -50.2% Calendar 2020
10 Allegiant Air $990,073,000 -46.2% Calendar 2020
11 Hawaiian Holdings $844,813,000 -70.2% Calendar 2020
12 Sun Country
Airlines $401,486,000 -42.8% Calendar 2020
Total for US & Canada: $73,151,532,642 Weighted Change: -63.0%
Weighted change (from prior annual period) for all 109 airlines: -55.8%
■ Refer to page 7 for details. * Estimates by IdeaWorks. End of Table.

2021 Datalex Big Book of Airline Data Page 60
Asia & South
Pacific
34.9%Europe &
Russia
24.7%
Latin America
3.9%
Middle East &
Africa
10.8%
US & Canada
25.5%
Airline Revenue by World Region2020 Financial Period
World region designated by headquarters location of disclosing airlines.Percentages are rounded and may not add up to 100%.Carrier data is based upon individual listings from the
2021 Datalex Big Book of Airline Data by IdeaWorksCompany.

2021 Datalex Big Book of Airline Data Page 61
Revenue Generated by Global Alliances
The airline industry is dominated by three key alliances: Oneworld, SkyTeam, and Star. The
revenue associated with each full member airline in the alliance has been tallied to create
total revenue for each of the three. Disclosures by airline groups do not always provide
specific airline detail to correspond to alliance participation. For example, the Asiana
Airlines Group includes subsidiary airlines (Air Busan and Air Seoul) which are not full
members of the Star Alliance. These are far smaller airlines, but disclosures could not be
found for mainline Asiana operations. Therefore, the results described are approximations.
Global revenue generated by alliances represents approximately 59 percent of global airline
revenue.
Revenue Generated by Global Alliances
2020 Reporting Period – Full Member Airlines
Oneworld
Carriers:
American, British Airways, Cathay Pacific/Cathay Dragon, Finnair, Iberia,
Japan Airlines, Malaysia Airlines, Qantas Airways, Qatar Airways, Royal Air
Maroc, Royal Jordanian, S7 Airlines, SriLankan Airlines.
Calculation
Notes:
Malaysia Airlines, Qatar, and Royal Air Moroc revenue not found for 2020.
IdeaWorks included estimates for these carriers in the alliance total based upon
2019 disclosed revenue adjusted by the average revenue drop for the appropriate
world region.
Revenue: $53,142,955,173
Change: -59.1% below 2019 results (total alliance)
SkyTeam
Carriers:
Aeroflot Group, Aerolineas Argentinas, Aeromexico, Air Europa, Air
France, Alitalia, China Airlines, China Eastern, CSA Czech Airlines, Delta,
Garuda Indonesia, Kenya Airways, KLM, Korean Air, Middle East Airlines,
Saudi Arabian Airlines, TAROM, Vietnam Airlines, Xiamen Airlines.
Calculation
Notes:
Aerolineas Argentinas, Alitalia, Garuda Indonesia, Middle East Airlines, Saudi
Arabia Airlines, and TAROM revenue not found for 2020. IdeaWorks included
estimates for these carriers in the alliance total based upon 2019 disclosed
revenue adjusted by the average revenue drop for the appropriate world region.
Revenue: $69,649,204,255
Change: -54.1% below 2019 results (total alliance)
Star
Carriers:
Aegean Airlines, Air Canada, Air China, Air India, Air New Zealand, ANA
All Nippon Airways, Asiana Airlines, Austrian, Avianca, Brussels, Copa
Airlines, Croatia Airlines, EgyptAir, Ethiopian Airlines, EVA Air, LOT,
Lufthansa Airlines, SAS, Shenzhen Airlines, Singapore Airlines, South African
Airways, SWISS, TAP Portugal, Thai Airways, Turkish Airlines, United
Calculation
Notes:
Air India, EgyptAir, Ethiopian Airlines, and South African Airways revenue not
found for 2020. IdeaWorks included estimates for these carriers in the alliance
total based upon 2019 disclosed revenue adjusted by the average revenue drop
for the appropriate world region.
Revenue: $75,204,792,611
Change: -62.7% below 2019 results (total alliance)
All Alliances: $197,996,952,039
Alliance carrier listing as of June 2021. Carrier data is based upon individual listings from this Big Book.
Airline groups may include airlines which are not direct participants in an alliance.
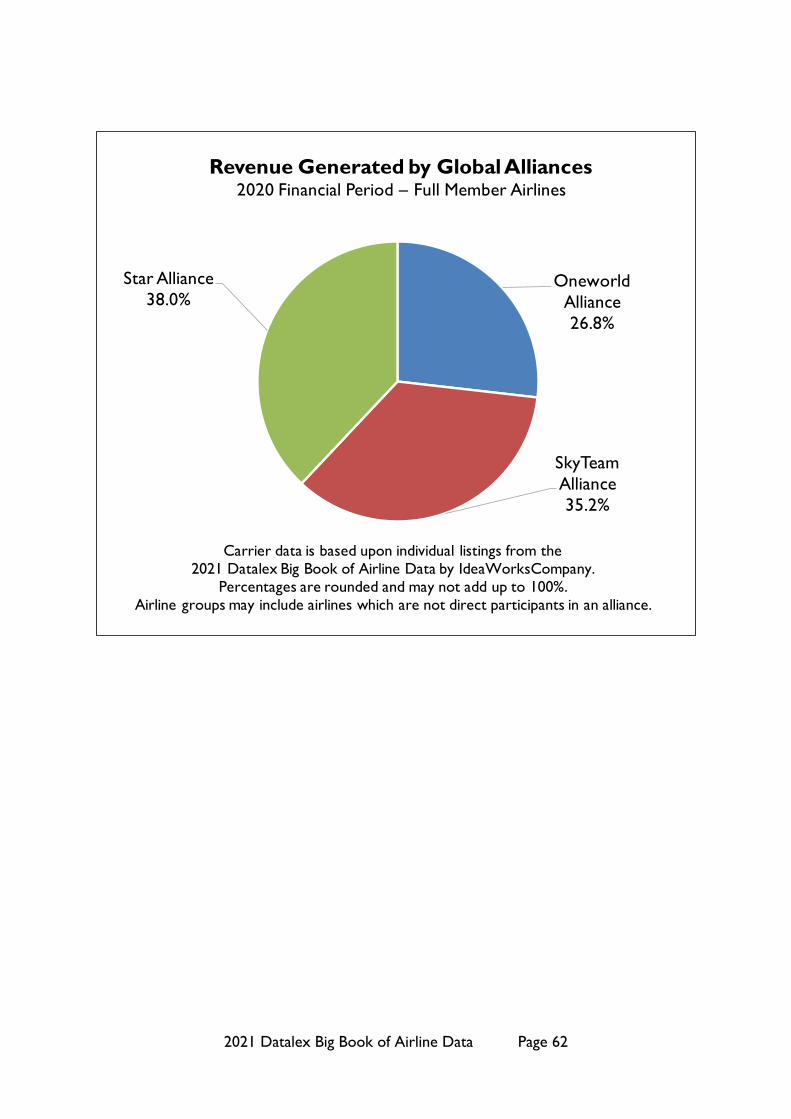
2021 Datalex Big Book of Airline Data Page 62
Oneworld
Alliance
26.8%
SkyTeam
Alliance
35.2%
Star Alliance
38.0%
Revenue Generated by Global Alliances2020 Financial Period – Full Member Airlines
Carrier data is based upon individual listings from the2021 Datalex Big Book of Airline Data by IdeaWorksCompany.
Percentages are rounded and may not add up to 100%.Airline groups may include airlines which are not direct participants in an alliance.

2021 Datalex Big Book of Airline Data Page 63
Revenue by Airline Category
IdeaWorksCompany uses four airline categories for ancillary revenue, revenue, and traffic
analysis: traditional, major US, high performing LCCs, and low cost carriers. The largest of
these (in number and traffic) is the traditional airlines category which covers a wide swath of
airlines all over the world such as regional, global network, start-up, and national airlines.
These are usually typified by hub-and-spoke route systems and somewhat lesser reliance on
a la carte fees. Low cost carriers are separated into two categories. The definition relies
upon the practice of charging for a la carte services such as baggage, seat assignments, and
food/beverage, along with an emphasis on leisure travel. If the two categories were
combined, the revenue total would be $37,549,402,977.
Revenue by Airline Category
2020 Reporting Period
Traditional
Airlines
Description:
This represents a general category for the largest
number of carriers. Examples include Aeroflot,
Aeromexico, China Eastern, and SAS Scandinavian.
There are 67 airlines in this category.
Revenue: $187,422,795,197
Major US
Airlines
Description:
This category consists of Alaska Air Group,
American, Delta, Hawaiian Holdings, Southwest
Airlines, and United.
Revenue: $61,447,813,000
High Performing
LCCs
Description:
These carriers generate the highest ancillary
revenue activity as a percentage of operating
revenue. Examples include AirAsia Group,
Jet2.com, Pegasus, Ryanair, Viva Aerobus, and
Volaris. There are 19 airlines in this category.
Revenue: $19,031,574,678
Low Cost
Carriers
Description:
Low cost carriers include Jambojet, Pobeda,
SpiceJet, Sun Country Airlines, and VietJet Air.
Ancillary revenue, as a % of total revenue, is below
16%. There are 17 airlines in this category.
Revenue: $18,517,828,300
Carrier data is based upon individual listings from this Big Book.
Airline groups may include airlines which don't align with the category designated.
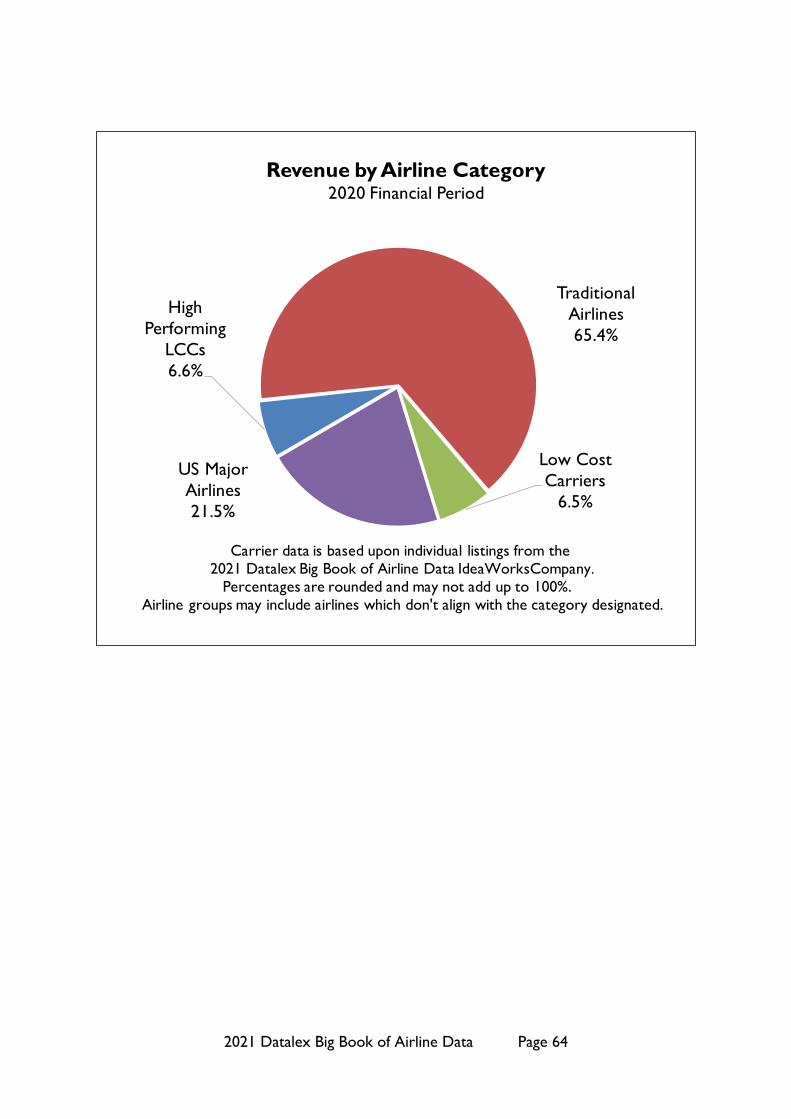
2021 Datalex Big Book of Airline Data Page 64
High
Performing
LCCs
6.6%
Traditional
Airlines
65.4%
Low Cost
Carriers
6.5%
US Major
Airlines
21.5%
Revenue by Airline Category2020 Financial Period
Carrier data is based upon individual listings from the 2021 Datalex Big Book of Airline Data IdeaWorksCompany.
Percentages are rounded and may not add up to 100%. Airline groups may include airlines which don't align with the category designated.

2021 Datalex Big Book of Airline Data Page 65

2021 Datalex Big Book of Airline Data Page 66
E. Frequent Flyer Membership by Program
Airlines may disclose the membership size of frequent flyer programs in their financial
reports, corporate press releases, and websites. This was found for 42 of the airlines in the
Big Book. For most, a total membership number was referenced. Others described “active
membership” which traditionally is defined by accounts that have accrual or redemption
activity in a 12-month period. The active portion of a membership base can represent 25 to
40 percent of total membership. Some airlines make modest disclosures. United Airlines
disclosed “100+ million” members; their true membership is likely 25 percent higher. It
would be inappropriate to rank these results because the list of programs is incomplete and
limited by disclosure. Results are from the most recent reporting period for each airline,
unless noted in parenthesis.
Frequent Flyer Membership by Program – Alphabetical
Line Airlines Program Name Source and Notes FFP Membership
1 Aeroflot Group Aeroflot Bonus Annual report (2019) 9,800,000
2 Aerolineas Argentinas Aerolineas Plus Annual report (2019) 3,000,000
3 Aeromexico Club Premier Annual report 7,000,000
4 Air Astana Nomad Club Annual report (2019) 370,000
5 Air Canada Group Aeroplan (active
members) Annual report (2019) 5,000,000
6 Air China Group Phoenix Miles Annual report 68,176,600
7 Air France/KLM
Group
Flying Blue (active
members) Annual report 15,000,000
8 Air India Flying Returns Annual report 2,723,185
9 Air New Zealand Airpoints Annual report 3,200,000
10 AirAsia Group (ex.
AirAsia X) BIG Loyalty Annual report 25,000,000
11 airBaltic airBaltic Club Annual report 2,360,000
12 Alaska Air Group Mileage Plan Annual report and
IdeaWorks estimate 9,500,000
13 American AAdvantage Annual report 115,000,000
14 ANA All Nippon
Airways ANA Mileage Club Annual report 37,440,000
15 Avianca LifeMiles Annual report 10,100,000
16 Azul TudoAzul Annual report 12,600,000
17 Cathay Pacific/Cathay
Dragon Asia Miles Annual report 13,000,000
18 China Eastern Group Eastern Miles Annual report 45,220,000
19 China Southern Group Sky Pearl Annual report 49,000,000
Table continues next page.
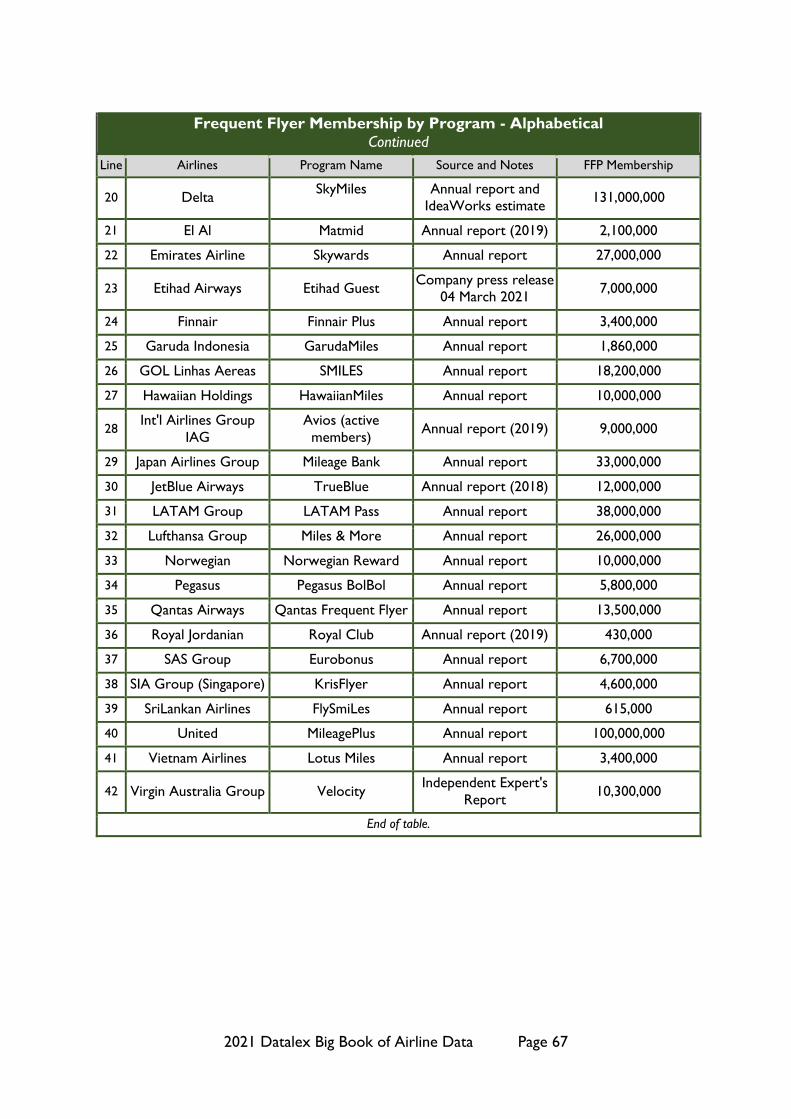
2021 Datalex Big Book of Airline Data Page 67
Frequent Flyer Membership by Program - Alphabetical
Continued
Line Airlines Program Name Source and Notes FFP Membership
20 Delta SkyMiles
Annual report and
IdeaWorks estimate 131,000,000
21 El Al Matmid Annual report (2019) 2,100,000
22 Emirates Airline Skywards Annual report 27,000,000
23 Etihad Airways Etihad Guest Company press release
04 March 2021 7,000,000
24 Finnair Finnair Plus Annual report 3,400,000
25 Garuda Indonesia GarudaMiles Annual report 1,860,000
26 GOL Linhas Aereas SMILES Annual report 18,200,000
27 Hawaiian Holdings HawaiianMiles Annual report 10,000,000
28 Int'l Airlines Group
IAG
Avios (active
members) Annual report (2019) 9,000,000
29 Japan Airlines Group Mileage Bank Annual report 33,000,000
30 JetBlue Airways TrueBlue Annual report (2018) 12,000,000
31 LATAM Group LATAM Pass Annual report 38,000,000
32 Lufthansa Group Miles & More Annual report 26,000,000
33 Norwegian Norwegian Reward Annual report 10,000,000
34 Pegasus Pegasus BolBol Annual report 5,800,000
35 Qantas Airways Qantas Frequent Flyer Annual report 13,500,000
36 Royal Jordanian Royal Club Annual report (2019) 430,000
37 SAS Group Eurobonus Annual report 6,700,000
38 SIA Group (Singapore) KrisFlyer Annual report 4,600,000
39 SriLankan Airlines FlySmiLes Annual report 615,000
40 United MileagePlus Annual report 100,000,000
41 Vietnam Airlines Lotus Miles Annual report 3,400,000
42 Virgin Australia Group Velocity Independent Expert's
Report 10,300,000
End of table.

2021 Datalex Big Book of Airline Data Page 68
Currency Exchange Rates Used for this Big Book
Airlines usually disclose revenue in local currency. The overall reporting currency for this
guide is the US dollar. The following exchange rates were used to convert amounts from
local currencies to the US dollar.
Currency Exchange Rates Used for this Big Book
Currency Code Convert to $1 Currency Code Convert to $1
Argentine Peso ARS 0.01418
Mexican Peso MXN 0.04380
Australian
Dollar AUD 0.69172
New Zealand
Dollar NZD 0.64738
Brazilian Real BRL 0.18684 Norwegian
Krone NOK 0.10506
British Pound GBP 1.24758 Pakistani
Rupee PKR 0.00597
Canadian
Dollar CAD 0.73635 Philippine Peso PHP 0.02007
Chinese Yuan
Renminbi CNY 0.14142 Qatari Riyal QAR 0.27473
Danish Krone DKK 0.15109 Russian Ruble RUB 0.01413
Emirati Dirham AED 0.27229 Saudi Arabian
Riyal SAR 0.26667
Euro EUR 1.12600 Singapore
Dollar SGD 0.71752
Fijian Dollar FJD 0.46006 South African
Rand ZAR 0.05853
Hong Kong
Dollar HKD 0.12902
South Korean
Won KRW 0.00083
Indian Rupee INR 0.01324 Sri Lankan
Rupee LKR 0.00537
Indonesian
Rupiah IDR 0.00007 Swedish Krona SEK 0.10763
Japanese Yen JPY 0.00930 Swiss Franc CHF 1.05763
Jordanian
Dinar JOD 1.41044
Taiwan New
Dollar TWD 0.03396
Kenyan Shilling KES 0.00939 Thai Baht THB 0.03222
Kuwaiti Dinar KWD 3.25004 Tunisian Dinar TND 0.35293
Lebanese
Pound LBP 0.00066 Turkish Lira TRY 0.14601
Malaysian
Ringgit MYR 0.23332
Vietnamese
Dong VND 0.00004
Currency exchange rates are from XE.com, the Universal Exchange Converter.
As effective on 01 July 2020 (a mid-year measurement).

2021 Datalex Big Book of Airline Data Page 69
Appendix: Airlines Included in this Big Book
Appendix: Airlines Included in this Big Book
Line Airlines
Listed as a
Subsidiary
Airline
Annual
Traffic
Annual
Revenue
Frequent
Flyer
Membership
Data Source Notes
(Primary airline
noted for subsidiary
airlines)
1 Aegean Airlines ■ ■ Annual report
2 Aer Lingus ■ ■ ■ Annual report - IAG
3 Aeroflot Airlines ■ ■ Annual report -
Aeroflot
4 Aeroflot Group ■ ■ ■ Annual report
5 Aerolineas
Argentinas ■ ■
Aviacion Civil
Argentina ANAC
Report (traffic)
Annual Report
(revenue)
6 Aeromexico ■ ■ ■ Annual report
7 Air Arabia ■ ■ Annual report
8 Air Astana ■ ■ ■ Annual report
9 Air Busan ■ ■ Annual report -
Asiana
10 Air Canada
Group ■ ■ ■ Annual report
11 Air China (not
Group) ■ ■ ■
Estimate by
IdeaWorks
12 Air China Group ■ ■ ■ Annual report
13 Air China Inner
Mongolia ■ ■ ■
Annual report - Air
China
14 Air Europa ■ ■
IAG press release 19
January 2021 (traffic)
IdeaWorks estimate
(revenue)
15 Air France ■ ■ ■ Annual report - Air
France/KLM
16 Air France/KLM
Group ■ ■ ■ Annual report
17 Air Greenland ■ ■ Annual report
18 Air India ■ ■ ■
Traffic: Directorate
General of Civil
Aviation data,
Revenue: IdeaWorks
estimate
19 Air India Express ■ ■ Annual report
Table continues next page.

2021 Datalex Big Book of Airline Data Page 70
Appendix: Airlines Included in this Big Book
Continued
Line Airlines
Listed as a
Subsidiary
Airline
Annual
Traffic
Annual
Revenue
Frequent
Flyer
Membership
Data Source Notes
(Primary airline
noted for subsidiary
airlines)
20 Air Macau ■ ■ ■ Annual report - Air
China
21 Air New Zealand ■ ■ ■ Annual report
22 Air Seoul ■ ■ Annual report -
Asiana
23 AirAsia Group
(ex. AirAsia X) ■ ■ ■ Annual report
24 AirAsia India ■ ■ ■ Directorate General
of Civil Aviation data
25 AirAsia Indonesia ■ ■ ■ Annual report -
AirAsia Group
26 AirAsia Malaysia ■ ■ ■ Annual report -
AirAsia Group
27 AirAsia Philippines ■ ■ ■ Annual report -
AirAsia Group
28 AirAsia Thailand ■ ■ ■ Annual report - Thai
AirAsia
29 AirAsia X ■ ■ Annual report
30 airBaltic ■ ■ ■ Annual report
31 AIRDO ■ ■ Company press
release 31 May 2021
32 Alaska Air Group ■ ■ ■ Annual report
33 Allegiant Air ■ ■ Annual report
34 Alliance India ■ Directorate General
of Civil Aviation data
35 American ■ ■ ■ Annual report
36 ANA All Nippon
Airways ■ ■ ■ Annual report
37 Anadolujet ■ ■ Annual report -
Turkish
38 Asiana Airlines
Group ■ ■ Annual report
39 Atlantic Airways ■ ■ Annual report
40 Aurora ■ ■ Annual report -
Aeroflot
41 Austrian ■ ■ ■ Annual report -
Lufthansa Group
Table continues next page.

2021 Datalex Big Book of Airline Data Page 71
Appendix: Airlines Included in this Big Book
Continued
Line Airlines
Listed as a
Subsidiary
Airline
Annual
Traffic
Annual
Revenue
Frequent
Flyer
Membership
Data Source Notes
(Primary airline
noted for subsidiary
airlines)
42 Avianca ■ ■ ■ Annual report
43 Azimuth Airlines ■
Federal Agency for
Air Transport -
Russia
44 Azul ■ ■ ■ Annual report
45 Azur Air ■
Federal Agency for
Air Transport -
Russia
46 Bangkok Airways ■ ■ Annual report
47 British Airways ■ ■ ■ Annual report - IAG
48 Brussels ■ ■ ■ Annual report -
Lufthansa Group
49
Cathay
Pacific/Cathay
Dragon
■ ■ ■ Annual report
50 Cebu Pacific Air ■ ■ Annual report
51 China Airlines ■ ■ Annual report
52 China Eastern
(not Group) ■ ■ ■
Annual report -
China Eastern
53 China Eastern
Group ■ ■ ■ Annual report
54 China Southern
Group ■ ■ ■ Annual report
55 China United
Airlines ■ ■ ■
Annual report -
China Eastern
56 Chongqing
Airlines ■ ■
Annual report -
China Southern
57 Copa Airlines ■ ■ Annual report
58 Croatia Airlines ■ ■ Annual report
(Croatian language)
59 CSA Czech
Airlines ■ ■
Company press
release 26 February
2021 and estimates
60 Daily Air (Taiwan) ■
Civil Aviation
Statistics Taiwan
annual report
61 Dalian Airlines ■ ■ ■ Annual report - Air
China
Table continues next page.
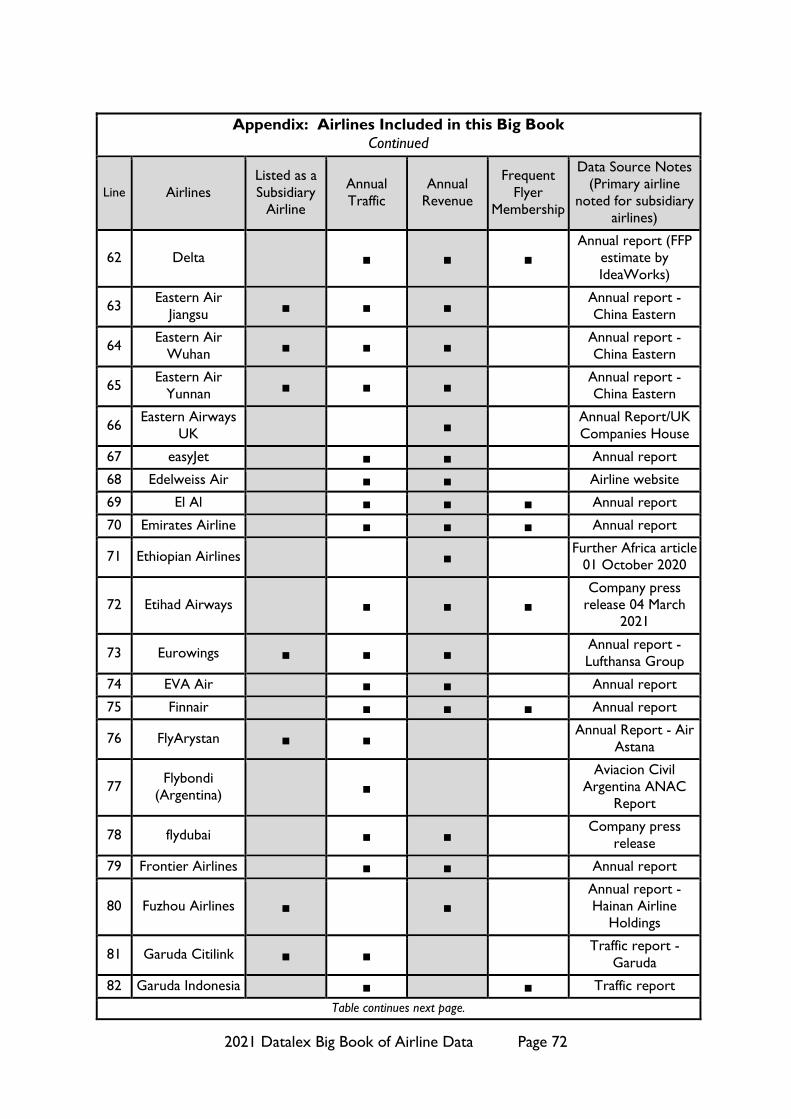
2021 Datalex Big Book of Airline Data Page 72
Appendix: Airlines Included in this Big Book
Continued
Line Airlines
Listed as a
Subsidiary
Airline
Annual
Traffic
Annual
Revenue
Frequent
Flyer
Membership
Data Source Notes
(Primary airline
noted for subsidiary
airlines)
62 Delta ■ ■ ■
Annual report (FFP
estimate by
IdeaWorks)
63 Eastern Air
Jiangsu ■ ■ ■
Annual report -
China Eastern
64 Eastern Air
Wuhan ■ ■ ■
Annual report -
China Eastern
65 Eastern Air
Yunnan ■ ■ ■
Annual report -
China Eastern
66 Eastern Airways
UK ■
Annual Report/UK
Companies House
67 easyJet ■ ■ Annual report
68 Edelweiss Air ■ ■ Airline website
69 El Al ■ ■ ■ Annual report
70 Emirates Airline ■ ■ ■ Annual report
71 Ethiopian Airlines ■ Further Africa article
01 October 2020
72 Etihad Airways ■ ■ ■
Company press
release 04 March
2021
73 Eurowings ■ ■ ■ Annual report -
Lufthansa Group
74 EVA Air ■ ■ Annual report
75 Finnair ■ ■ ■ Annual report
76 FlyArystan ■ ■ Annual Report - Air
Astana
77 Flybondi
(Argentina) ■
Aviacion Civil
Argentina ANAC
Report
78 flydubai ■ ■ Company press
release
79 Frontier Airlines ■ ■ Annual report
80 Fuzhou Airlines ■ ■
Annual report -
Hainan Airline
Holdings
81 Garuda Citilink ■ ■ Traffic report -
Garuda
82 Garuda Indonesia ■ ■ Traffic report
Table continues next page.
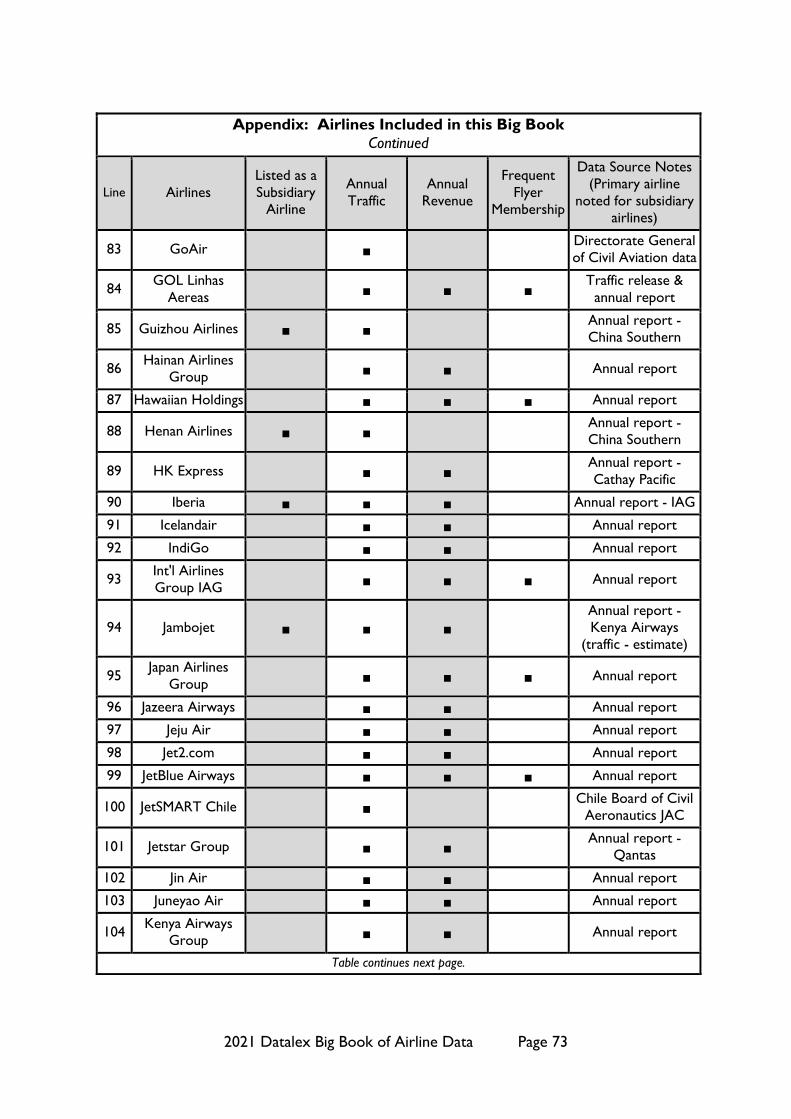
2021 Datalex Big Book of Airline Data Page 73
Appendix: Airlines Included in this Big Book
Continued
Line Airlines
Listed as a
Subsidiary
Airline
Annual
Traffic
Annual
Revenue
Frequent
Flyer
Membership
Data Source Notes
(Primary airline
noted for subsidiary
airlines)
83 GoAir ■ Directorate General
of Civil Aviation data
84 GOL Linhas
Aereas ■ ■ ■
Traffic release &
annual report
85 Guizhou Airlines ■ ■ Annual report -
China Southern
86 Hainan Airlines
Group ■ ■ Annual report
87 Hawaiian Holdings ■ ■ ■ Annual report
88 Henan Airlines ■ ■ Annual report -
China Southern
89 HK Express ■ ■ Annual report -
Cathay Pacific
90 Iberia ■ ■ ■ Annual report - IAG
91 Icelandair ■ ■ Annual report
92 IndiGo ■ ■ Annual report
93 Int'l Airlines
Group IAG ■ ■ ■ Annual report
94 Jambojet ■ ■ ■
Annual report -
Kenya Airways
(traffic - estimate)
95 Japan Airlines
Group ■ ■ ■ Annual report
96 Jazeera Airways ■ ■ Annual report
97 Jeju Air ■ ■ Annual report
98 Jet2.com ■ ■ Annual report
99 JetBlue Airways ■ ■ ■ Annual report
100 JetSMART Chile ■ Chile Board of Civil
Aeronautics JAC
101 Jetstar Group ■ ■ Annual report -
Qantas
102 Jin Air ■ ■ Annual report
103 Juneyao Air ■ ■ Annual report
104 Kenya Airways
Group ■ ■ Annual report
Table continues next page.
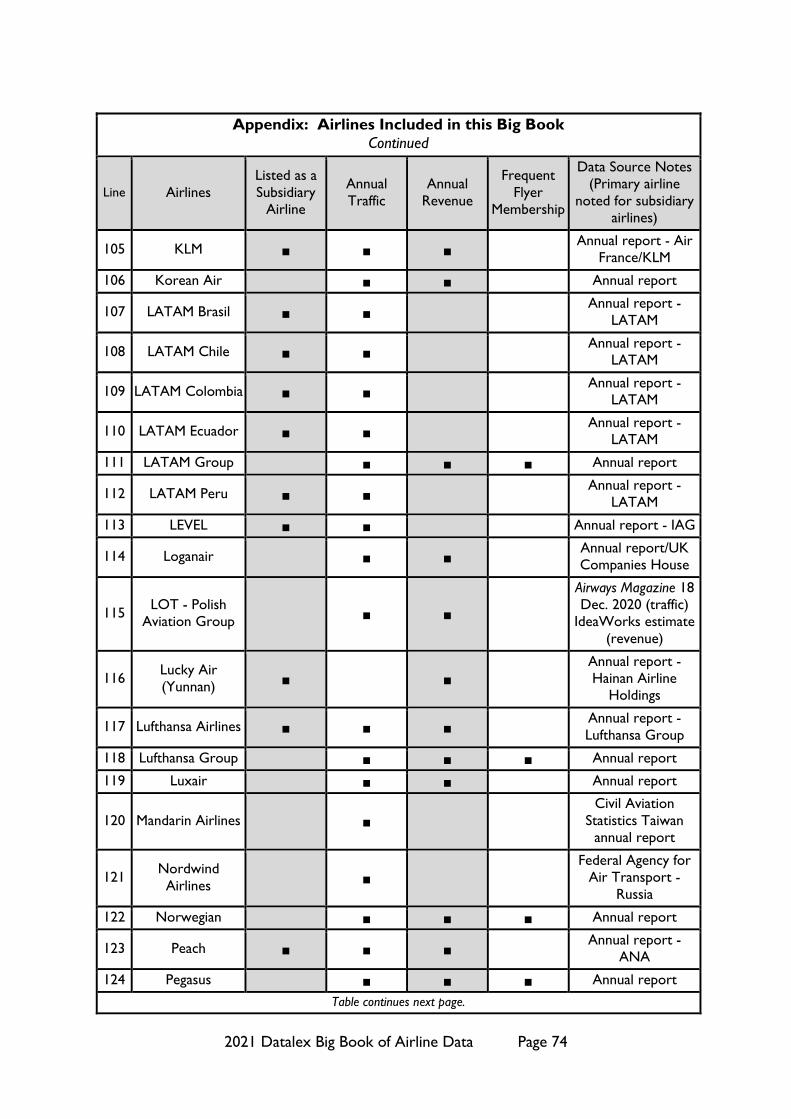
2021 Datalex Big Book of Airline Data Page 74
Appendix: Airlines Included in this Big Book
Continued
Line Airlines
Listed as a
Subsidiary
Airline
Annual
Traffic
Annual
Revenue
Frequent
Flyer
Membership
Data Source Notes
(Primary airline
noted for subsidiary
airlines)
105 KLM ■ ■ ■ Annual report - Air
France/KLM
106 Korean Air ■ ■ Annual report
107 LATAM Brasil ■ ■ Annual report -
LATAM
108 LATAM Chile ■ ■ Annual report -
LATAM
109 LATAM Colombia ■ ■ Annual report -
LATAM
110 LATAM Ecuador ■ ■ Annual report -
LATAM
111 LATAM Group ■ ■ ■ Annual report
112 LATAM Peru ■ ■ Annual report -
LATAM
113 LEVEL ■ ■ Annual report - IAG
114 Loganair ■ ■ Annual report/UK
Companies House
115 LOT - Polish
Aviation Group ■ ■
Airways Magazine 18
Dec. 2020 (traffic)
IdeaWorks estimate
(revenue)
116 Lucky Air
(Yunnan) ■ ■
Annual report -
Hainan Airline
Holdings
117 Lufthansa Airlines ■ ■ ■ Annual report -
Lufthansa Group
118 Lufthansa Group ■ ■ ■ Annual report
119 Luxair ■ ■ Annual report
120 Mandarin Airlines ■
Civil Aviation
Statistics Taiwan
annual report
121 Nordwind
Airlines ■
Federal Agency for
Air Transport -
Russia
122 Norwegian ■ ■ ■ Annual report
123 Peach ■ ■ ■ Annual report -
ANA
124 Pegasus ■ ■ ■ Annual report
Table continues next page.

2021 Datalex Big Book of Airline Data Page 75
Appendix: Airlines Included in this Big Book
Continued
Line Airlines
Listed as a
Subsidiary
Airline
Annual
Traffic
Annual
Revenue
Frequent
Flyer
Membership
Data Source Notes
(Primary airline
noted for subsidiary
airlines)
125 Philippine Airlines
Group ■ ■ Annual report
126 PIA Pakistan ■ ■ Annual report
127 Pobeda ■ ■ ■ Annual report -
Aeroflot
128 Qantas Airways
(includes Loyalty) ■ ■ ■ Annual report
129 Qatar Airways ■ ■ Estimates by
IdeaWorks
130 Red Wings ■
Federal Agency for
Air Transport -
Russia
131 REX - Regional
Express ■ ■ Annual report
132 Rossiya ■ ■ ■ Annual report -
Aeroflot
133 Royal Jordanian ■ ■ ■ Annual report
134 Ryanair Group ■ ■ Annual report
135 S7 Airlines ■ ■
Company press
release (pass.) D&B
(revenue)
136 SAS Group ■ ■ ■ Annual report
137 SATA Air Acores ■ ■ Annual report
138 SATA
International ■ ■ Annual report
139 Saudi Arabian
Airlines ■ ■
Estimates by
IdeaWorks (based
upon 2020 Saudi
airports traffic
decrease)
140 Scoot ■ ■ Annual report -
Singapore
141 Shandong Airlines ■ ■ ■ Annual report - Air
China
142 Shanghai Airlines ■ ■ ■ Annual report -
China Eastern
143 Shantou Airlines ■ ■ Annual report -
China Southern
Table continues next page.

2021 Datalex Big Book of Airline Data Page 76
Appendix: Airlines Included in this Big Book
Continued
Line Airlines
Listed as a
Subsidiary
Airline
Annual
Traffic
Annual
Revenue
Frequent
Flyer
Membership
Data Source Notes
(Primary airline
noted for subsidiary
airlines)
144 Shenzhen Airlines ■ ■ ■ Annual report - Air
China
145 SIA Group
(Singapore) ■ ■ ■ Annual report
146 SilkAir ■ ■ ■ Annual report -
Singapore
147 Singapore Airlines ■ ■ ■ Annual report -
Singapore
148 SKY Airline
(Chile) ■
Chile Board of Civil
Aeronautics JAC
149 Smartwings
Group ■
Company press
release dated 12
January 2021
150 Solaseed Air ■ ■ Annual report
151 Southwest
Airlines ■ ■ Annual report
152 SpiceJet ■ Directorate General
of Civil Aviation data
153 Spirit Airlines ■ ■ Annual report
154 Spring Airlines ■ ■ Annual report
155 SriLankan Airlines ■ ■ ■ Annual report
156 Starflyer ■ ■ Annual report
157 Starlux (Taiwan) ■
Civil Aviation
Statistics Taiwan
annual report
158 Sun Country
Airlines ■ ■ IPO Document
159 Sun-Air of
Scandinavia ■ Dun & Bradstreet
160 SunExpress ■ ■ ■ Annual report -
Turkish
161 SWISS ■ ■ ■ Annual report -
Lufthansa Group
162 TAP Portugal ■ ■ Annual report
163 Thai Airways Int’l. ■ ■ Annual report
164 Tigerair Australia ■ ■ ■ Clayton UTZ Report
Table continues next page.

2021 Datalex Big Book of Airline Data Page 77
Appendix: Airlines Included in this Big Book
Continued
Line Airlines
Listed as a
Subsidiary
Airline
Annual
Traffic
Annual
Revenue
Frequent
Flyer
Membership
Data Source Notes
(Primary airline
noted for subsidiary
airlines)
165 Tigerair Taiwan ■ ■ Annual report (only)
- EVA Airways
166 Transavia Airlines ■ ■ ■ Annual report - Air
France/KLM
167
TUI Group
(Markets &
Airlines)
■ ■ Annual report
168 Tunisair ■ ■
Traffic (website) and
revenue (Barron's 06
March 2021 article)
169 Turkish Airlines
Group ■ ■ Annual report
170 T'way Air ■ ■ Annual report
presentation
171 UNI Air (Taiwan) ■
Civil Aviation
Statistics Taiwan
annual report
172 United ■ ■ ■ Annual report
173 Ural Airlines ■ ■ Company press
release 30 April 2021
174 Urumqi Air ■ ■
Annual report -
Hainan Airline
Holdings
175 Utair (excludes
helicopter) ■ ■ Annual report
176 VietJet Air ■ ■ Company press
release 02 May 2021
177 Vietnam Airlines ■ ■ ■ Annual report
178 Virgin Atlantic
Airways ■ ■ Annual Report
179 Virgin Australia
Group ■ ■ ■ Clayton UTZ Report
180 Vistara ■ Directorate General
of Civil Aviation data
181 Viva Aerobus ■ ■ Annual report
182 Volaris ■ ■ Annual report
Table continues next page.

2021 Datalex Big Book of Airline Data Page 78
Appendix: Airlines Included in this Big Book
Continued
Line Airlines
Listed as a
Subsidiary
Airline
Annual
Traffic
Annual
Revenue
Frequent
Flyer
Membership
Data Source Notes
(Primary airline
noted for subsidiary
airlines)
183 Volotea ■
Company press
release 19 January
2021
184 Vueling Airlines ■ ■ ■ Annual report - IAG
185 Wideroe ■ ■ Annual report
(Norwegian)
186 Wizz Air ■ ■ Annual report
187 Xiamen Airlines ■ ■ ■ Annual report -
China Southern
188 Zhuhai Airlines ■ ■ Annual report -
China Southern
End of table.

2021 Datalex Big Book of Airline Data Page 79