2021 earnings third quarter
TRANSCRIPT

November 5, 2021
2021 Earnings – Third Quarter

Safe Harbor Provision
2
The company undertakes no duty to update forward-looking statements
This presentation contains forward-looking statements within the meaning of Section 27A of the Securities Act of 1933 and Section 21E of the Securities Exchange Act of 1934
(Exchange Act), including, without limitation, statements concerning our expectations relating to the integration of Kindred BioSciences, Inc. and Bayer Animal Health, expected
synergies and cost savings, expectations relating to the potential carve-out of the microbiome research and development (R&D) platform, sales of manufacturing facilities, product
launches and revenue from such products, independent company stand-up costs and timing, reduction of debt and leverage, cost savings and expenses relating to restructuring
actions, the impact of the COVID-19 pandemic on our business, our 2021 full year and fourth quarter guidance and long-term expectations, our industry and our operations,
performance and financial condition, and including in particular, statements relating to our business, growth strategies, distribution strategies, product development efforts and
future expenses. Forward-looking statements are based on our current expectations and assumptions regarding our business, the economy and other future conditions. Because
forward-looking statements relate to the future, by their nature, they are subject to inherent uncertainties, risks and changes in circumstances that are difficult to predict.
As a result, our actual results may differ materially from those contemplated by the forward-looking statements. Important factors that could cause actual results to differ materially
from those in the forward-looking statements include regional, national, or global political, economic, business, competitive, market, and regulatory conditions, including but not
limited to the following: heightened competition, including from generics; the impact of disruptive innovations and advances in veterinary medical practices, animal health
technologies and alternatives to animal-derived protein; changes in regulatory restrictions on the use of antibiotics in farm animals; our ability to implement our business strategies
or achieve targeted cost efficiencies and gross margin improvements; consolidation of our customers and distributors; an outbreak of infectious disease carried by farm animals; the
impact on our operations, the supply chain, customer demand, and our liquidity as a result of the COVID-19 global health pandemic; the success of our research and development
(R&D) and licensing efforts; misuse, off-label or counterfeiting use of our products; unanticipated safety, quality or efficacy concerns and the impact of identified concerns
associated with our products; the impact of weather conditions and the availability of natural resources; use of alternative distribution channels and the impact of increased or
decreased sales to our channel distributors resulting fluctuation in our revenues; manufacturing problems and capacity imbalances; challenges to our intellectual property rights or
our alleged violation of rights of others; risks related to our presence in foreign markets; breaches of our information technology systems; our ability to complete acquisitions and
successfully integrate the businesses we acquire, including Kindred BioSciences, Inc. and the animal health business of Bayer AG (Bayer Animal Health); the terms, timing or
structure of any separation of the microbiome R&D platform, including whether it will be consummated at all, and whether the operational and strategic benefits of such transaction
can be achieved, including whether the uncertainty of announcing the separation initiative will have adverse impacts on the employees, customers and suppliers related to the
platform; the effect of our substantial indebtedness on our business; the effect on our business resulting from our separation from Eli Lilly and Company (Lilly); the uncertainties
inherent in research relating to product safety and additional analyses of existing safety data; actions by regulatory bodies, including as a result of their interpretation of studies on
product safety; unfavorable publicity resulting from media reports on our products; public acceptance of our products; fluctuations in our business results due to seasonality and
other factors; and the impact of litigation, regulatory investigations, and other legal matters.
For additional information about the factors that could cause actual results to differ materially from forward-looking statements, please see the company’s latest Form 10-K and
subsequent Form 10-Qs filed with the Securities and Exchange Commission.

Executing Across Our Commitments
Q3 2021 Revenue Above Our Expectations
Outperformance in both Pet
Health and Farm Animal, led by
international execution
200 basis points of adjusted
EBITDA margin(1) expansion
resulting in adjusted EPS(1) of
$0.19, at the high-end of the
guidance range
Increased Full Year Revenue Guidance
Raised revenue guidance incorporating strong momentum exiting Q3, and maintained adjusted EBITDA(1) and adjusted EPS(1) guidance, with all three above initial ranges from the December 2020 Investor Day
Continued progress toward our
long-term targets of 60% gross
margin in 2023 and 31% EBITDA
margin in 2024
Positioned for Sustainable Long-Term Value Creation
KindredBio acquisition expected to
unlock upside to our long-term
growth algorithm and expand our
margins over time
Increased focus on high-value,
late-stage Pet Health pipeline,
including new R&D leadership
Continued implementation of our
company-wide productivity agenda
3(1) Non-GAAP financial measure. See Appendix to this presentation for more information, including GAAP to non-GAAP reconciliations

Third Quarter 2021
4
Actuals vs. Guidance Comparison
$ millions, except
per share values
(1) Non-GAAP financial measure. See Appendix to this presentation for more information, including GAAP to non-GAAP reconciliations

5
Outperforming vs. Our Investor Day Commitments
$4,520-$4,600
$4,730-$4,770
3%
7%
2%
7%
$4,240
$4,280
$4,320
$4,360
$4,400
$4,440
$4,480
$4,520
$4,560
$4,600
$4,640
$4,680
$4,720
$4,760
$4,800
Investor Day Today
Revenue
Year-Over-Year Growth
+$190M
2021 Revenue Guidance
$940-$1,000
$1,035-$1,075
21%-22%
22%-22.5%
20%
25%
$800
$840
$880
$920
$960
$1,000
$1,040
$1,080
Investor Day Today
Adj. EBITDA
Adj. EBITDA Margin
+$85M
2021 Adj. EBITDA(1)
Guidance
$0.83-$0.95
$0.97-$1.03
2%
7%
$1
Investor Day Today
+11c
2021 Adj. EPS(1)
Guidance
$ Millions Except Per Share Data
Dec 2020 Dec 2020Dec 2020
Note: Year-over-year revenue growth is on a pro forma combined company basis. The pro forma combined company figures represent estimates based on the historical records of Bayer and Elanco; however,
due to certain data limitations, including foreign exchange rates, these numbers may have some non-material differences from actuals. 2020 pro forma combined company numbers represent a good faith
summary to provide better financial context about historical performance
(1) Non-GAAP financial measure. See Appendix to this presentation for more information, including GAAP to non-GAAP reconciliations

6
Driving Growth Across Our Global Portfolio
Key Enablers Driving Long-Term Growth
Pricing Digital
Ecosystem
Omnichannel
Leadership
Geographic
Focus
Launch
Excellence
Pet Health
Contributed approximately one-third of outperformance in Q3
Continued industry tailwinds despite tougher comparisons
Global Seresto revenue up 28% compared to 2019
Strength in U.S. vaccine EDI and international markets
Successful launch of Credelio Plus in Australia
Farm Animal
Contributed approximately two-thirds of outperformance in Q3
Strength in U.S. cattle and swine, including Rumensin, Optaflexx,
and Denagard above forecast
Re-emerging ASF pressure with depressed Chinese hog prices
Double-digit improvement in international poultry and aqua, driven
by increased demand in reopened economies

7
Proven Execution Since Investor Day• Guiding to full year 2021 revenue growth of ~7% on a pro forma combined company basis(2),
4% higher than originally guided at our Investor Day
• Exceeded revenue guidance for four consecutive quarters, since Q4 2020
• Expecting full year 2021 pro forma combined company adj. EBITDA(1)(2) margin expansion of
approximately 300 basis points, on track toward long-term margin targets
• Launched all eight planned products for 2021
• Welcomed new R&D leader, Ellen de Brabander, in October
• Announced the potential carve-out of our microbiome R&D platform in October, to focus on
high-value, late-stage Pet Health blockbusters
• Accelerated expansion in the fast-growing dermatology market with KindredBio acquisition in
August, adding three potential blockbusters launching by 2025
• Manufacturing streamlining with the announced exit of three sites in June
• Progressing toward expected ~5.5x net leverage by year-end
• Announced second wave of restructuring in January, as part of our progression toward $300
million of synergies by 2023
• Published our first ESG summary report in June
Growing
Innovating
Elevating
Transforming
(1) Non-GAAP financial measure. See Appendix to this presentation for more information, including GAAP to non-GAAP reconciliations
(2) The pro forma combined company figures represent estimates based on the historical records of Bayer and Elanco; however, due to certain data limitations, including foreign exchange rates, these
numbers may have some non-material differences from actuals. 2020 pro forma combined company numbers represent a good faith summary to provide better financial context about historical
performance. We define pro forma combined company adjusted EBITDA margin as pro forma combined company adjusted EBITDA divided by pro forma combined company total revenue

Building Momentum Through Our Strengthened and Expanded IPP Strategy
Dependable Revenue Growth from Innovation
New R&D leader bringing proven
expertise in developing animal health
blockbusters
Continued progress toward 2025
innovation revenue of $600-$700 million
KindredBio expected to contribute three
potential blockbusters alongside our
own in dermatology
Launched all eight planned products for
2021
Unlocking Value
Expanded Portfolio, Capabilities, Access
Retail leadership, paired with long-
standing vet relationships
Value-based pricing as a differentiator
Continuous digital ecosystem
enhancement
Highly competitive offering across our
international markets
8
Customer Veterinarian
Farmer
Pet OwnerEnhanced profitability with
accelerated restructuring, maintaining
long-term gross margin target in 2023
Streamlined manufacturing footprint
with reduced capex and improved
working capital
Continued execution resulting in
sustainable double-digit adj.
EBITDA(1) and adj. EPS(1) growth
(1) Non-GAAP financial measure. See Appendix to this presentation for more information, including GAAP to non-GAAP reconciliations

9
2021 New Product Launches
Product Species Description Geography Launch Quarter Status (Updates)
Cattle Novel in Feed Technology with Environmental Claim Q1 2021U.S.: Launched
CA: Approved
Cattle
SwineInjectable Tulathromycin Antibiotic in BRD(1)/SRD(2) Q1 2021
EU: Launched
U.S.: Launched
PoultryNon-Medicated Feed Ingredient Supporting the
Natural Defense System; Suitable for RWA(3) Q3 2021 Launched
PoultryAnticoccidial Portfolio Expansion;
Suitable for RWA
Q1 2021 Launched
Q2 2021 Launched
Dog Oral Monthly Flea/Tick/Heartworm Q1 2021
JP: Launched
EU: Launched
AU: Launched
Cat Oral Monthly Flea/Tick Q2 2021 Launched
Cat Oral Solution for Weight Loss Management in CKD(4) Q1 2021 Launched
(1) Bovine Respiratory Disease, (2) Swine Respiratory Disease, (3) Raised Without Antibiotics, (4) Chronic Kidney Disease

Third Quarter 2021
10
FinancialPerformance Highlights
$ millions, except
per share values
(1) Non-GAAP financial measure. See Appendix to this presentation for more information, including GAAP to non-GAAP reconciliations

Third Quarter 2021
11
Adjusted(1)
Income StatementHighlights
$ millions, except
per share values
(1) Non-GAAP financial measure. See Appendix to this presentation for more information, including GAAP to non-GAAP reconciliations. We define adjusted gross margin as adjusted gross profit divided by total
revenue. Adjusted gross profit is defined as total revenue less adjusted cost of sales

Key Drivers
Global cattle performance
Global Pet Health retail
International poultry recovery
Aqua growth
FX tailwinds vs. expectations
Drivers of Q3 2021 Revenue vs. Guidance
($ millions)
12

Third Quarter 2021
13
Revenue Summary by Category
Note: Reported revenue in millions. Numbers may not add due to rounding. Year-over-year change noted in reported terms.
The comparison period in 2020 includes revenue from animal health products acquired from Bayer as of August 1, 2020

Third Quarter 2021
14
Impact of Price, Rate, and Volume on Revenue
Note: Reported revenue in millions. Numbers may not add due to rounding. The comparison period in 2020 includes revenue from animal health products acquired from Bayer
beginning on August 1, 2020, the acquisition date. If the impact of year-over-year change in revenue from animal health products acquired from Bayer were not fully reflected in
volume, the impact on total Elanco revenue would be: price 2%, FX rate 1%, and volume: 24%
(1) Represents impact of foreign exchange rate on growth attributable to the legacy Elanco portfolio only
(2) The impact of year-over-year change in revenue from animal health products acquired from Bayer is reflected in volume. As is typical with acquisitions, we will continue to
report the addition of the Bayer business in volume through the third quarter of 2021
(3) CER = Constant Exchange Rate, representing the growth rate excluding the impact of foreign exchange rates attributable to the legacy Elanco portfolio only

Third Quarter 2021
15
Revenue by Geography
$ millions
Note: Numbers may not add due to rounding

Key Balance Sheet and Cash Flow Metrics
16
Debt(1) Balances as of September 30, 2021$ millions
Note: Numbers may not add due to rounding. (1) Net debt is a non-GAAP measure calculated as gross debt less cash and cash equivalents on
our balance sheet. Gross debt is the sum of current portion of long-term debt and long-term debt, and excludes unamortized debt issuance costs
(2) Net leverage ratio calculated as gross debt less cash & equivalents on our balance sheet divided by adjusted EBITDA as reported. Does not
include Term Loan B covenant-related adjustments that reduce this leverage ratio
Days sales outstandingincreased to 81 days vs. 75 days at
the end of Q2 2021, reflecting
higher international revenue and
lower retail revenue in U.S. Pet
Health driven by normal seasonality
Year-end net leverage(2)
expected at ~5.5x
Three-month extension of leverage target to gain three potential blockbustersWith net leverage goal of <3x by the
end of the first quarter of 2024

Raising full year guidance for revenue, maintaining
guidance for adj. EBITDA and adj. EPS, and
updating guidance for reported EPS
2021 Guidance
17

18(1) Non-GAAP financial measure. See Appendix to this presentation for more information, including GAAP to non-GAAP reconciliations; (2) Net of an expected U.S. federal income tax refund of $16 million and U.S.
state income tax refund of $3 million
2021
Full Year Guidance
$ millions

2021 Fourth Quarter
19
Guidance
Strong
momentum
to exit the third
quarter
Balanced outlook
Anticipated revenue decline vs.
fourth quarter 2020 one-time items;
adj. EBITDA(1) and adj. EPS (1)
growth through productivity initiatives
Quarterly cadence
reflective of seasonality in
Elanco’s fourth quarter
product mix
$ millions, except
per share values
(1) Non-GAAP financial measure. See Appendix to this presentation for more information, including GAAP to non-GAAP reconciliations

20
Drivers of Q4 2021 Revenue vs. Q4 2020
Normalization Items
Large U.S. Pet Health customer ordered in 2020 vs.
2021 (~$10 million)
Incremental U.S. cattle vaccine and implant revenue
due to competitor stock-outs (~$10 million)
Contract manufacturing exits including the sale of our
Shawnee manufacturing facility to TriRx, and
discontinued human growth hormone production for
Lilly from our Speke facility (~$20 million)
Exited operations (~$20 million)
Total impact of Q4 2020 normalization:
Approximately $60 million
Other Impacts to Consider
Re-emerging ASF headwinds in China
Competitive dynamics
Generic pressure
Expected Q4 2021 Revenue Growth of Flat to 3.5%, After Normalization Items
Continued Execution
Portfolio outperformance
Recovery in international poultry and aqua
Eight innovation launches

Food and Companionship Enriching Life
21

Reference slides and GAAP reported to
non-GAAP adjusted reconciliations
Appendix
22

Combined Company Revenue
23
2020 ReferenceBase(1) Elanco Reported Revenue $3,273
Bayer Animal Health (Prior to Close)(2) $1,249
Less: Divestitures from Combined Company(3) $82
Combined Company Revenue $4,441
$ millions
Updated from
Investor Day
with Q4
reported revenue
Assumes Bayer Animal
Health transaction
closed January 1, 2020
Assumes related divestitures
completed January 1, 2020
and accounting
reclassifications complete
(1) This reference base is materially correct based on the public filings of Bayer and Elanco; however, due to certain data limitations, including foreign exchange rates, these numbers may have some non-
material differences to actuals. This reference base is a good faith summary to provide better financial context to investors about the expected performance of Elanco in 2021
(2) Includes revenue from Bayer Animal Health for the first seven months of 2020, that has been adjusted for differences in accounting methodologies between IFRS and GAAP, and for foreign exchange rates
(3) Less revenue from products that were included in Elanco and Bayer reported revenue prior being to divested, in most cases, as of August 1, 2020. Divestitures from legacy Elanco include: Osurnia,
Capstar, StandGuard, Vecoxan, Itrafungol, and Clomicalm. Divestitures from legacy Bayer Animal Health include: Drontal, Profender, Avenge, Maggo, and Zapp Encore

Nine Months 2021
24
FinancialPerformance Highlights
$ millions, except
per share values
(1) Non-GAAP financial measure. See slides 34-36 for more information, including GAAP to non-GAAP reconciliations

Nine Months 2021
25
Adjusted(1)
Income StatementHighlights
$ millions, except
per share values
(1) Non-GAAP financial measure. See slides 34-36 for more information, including GAAP to non-GAAP reconciliations. We define adjusted gross margin as adjusted gross profit divided by total revenue.
Adjusted gross profit is defined as total revenue less adjusted cost of sales

Nine Months 2021
26
Revenue Summary by Category
Note: Reported revenue in millions. Numbers may not add due to rounding. Year-over-year change noted in reported terms.
The comparison period in 2020 includes revenue from animal health products acquired from Bayer as of August 1, 2020

Nine Months 2021
27
Impact of Price, Rate, and Volume on Revenue
Note: Reported revenue in millions. Numbers may not add due to rounding. The comparison period in 2020 includes revenue from animal health products acquired from Bayer
beginning on August 1, 2020, the acquisition date. If the impact of year-over-year change in revenue from animal health products acquired from Bayer were not fully reflected in
volume, the impact on total Elanco revenue would be: price 2%, FX rate 2%, and volume: 67%
(1) Represents impact of foreign exchange rate on growth attributable to the legacy Elanco portfolio only
(2) The impact of year-over-year change in revenue from animal health products acquired from Bayer is reflected in volume. As is typical with acquisitions, we will continue to
report the addition of the Bayer business in volume through the third quarter of 2021
(3) CER = Constant Exchange Rate, representing the growth rate excluding the impact of foreign exchange rates attributable to the legacy Elanco portfolio only

Nine Months 2021
28
Revenue by Geography
$ millions
Note: Numbers may not add due to rounding

Note: Revenue in reported dollars in millions. Numbers may not add due to rounding
Pet Health
Revenue by Quarter
29

Farm Animal
Revenue by Quarter
30Note: Revenue in reported dollars in millions. Numbers may not add due to rounding
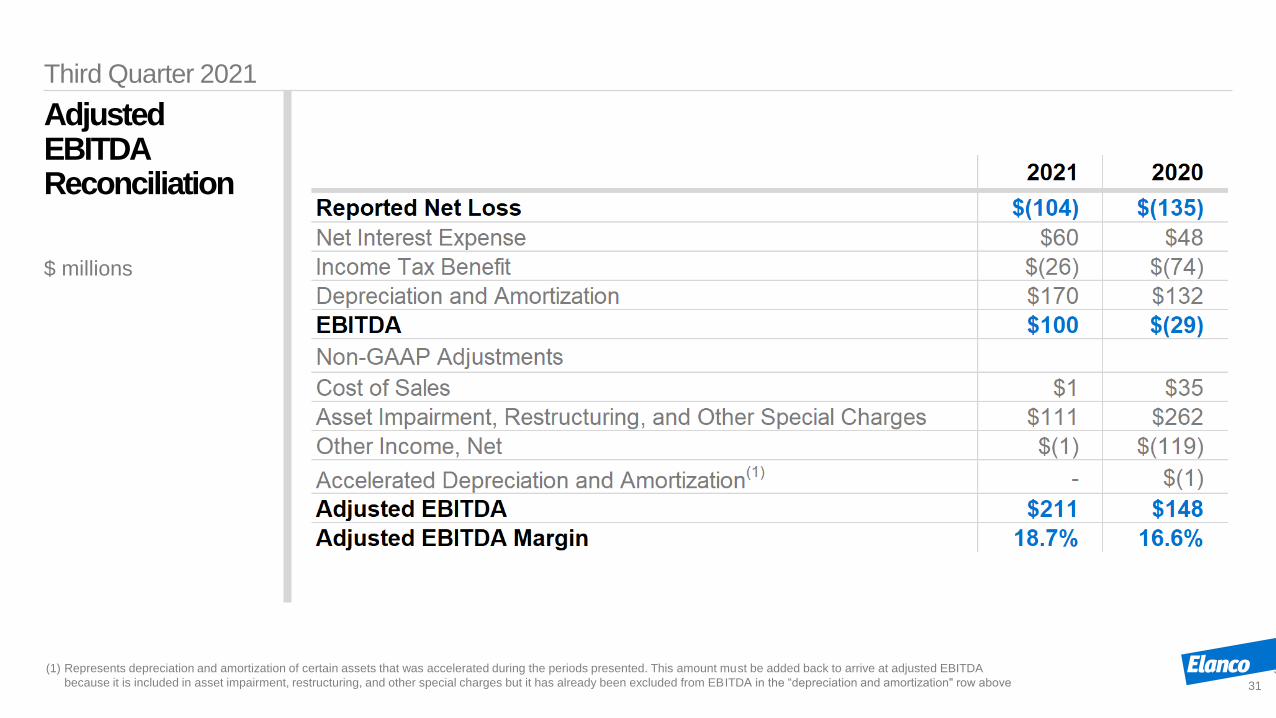
Third Quarter 2021
Adjusted EBITDA Reconciliation
31
$ millions
(1) Represents depreciation and amortization of certain assets that was accelerated during the periods presented. This amount must be added back to arrive at adjusted EBITDA
because it is included in asset impairment, restructuring, and other special charges but it has already been excluded from EBITDA in the “depreciation and amortization" row above

Third Quarter 2021
Reconciliation of GAAP Reported to Non-GAAP Adjusted Income Statement Items
$ millions
32See slide 33 for details of adjustments to certain GAAP reported measures

Third Quarter 2021
Details of Adjustments to Certain GAAP Reported Measures
33
For the three months ended September 30, 2021 and 2020:
1. 2021 excludes amortization of inventory fair value adjustments recorded from the acquisition of Bayer Animal Health resulting from the
delayed purchase of certain entities ($1 million).
2. 2020 excludes amortization of inventory fair value adjustments recorded from the acquisition of Bayer Animal Health ($33 million) and
charges associated with the write-off of marketing inventory recorded from the acquisition of Bayer Animal Health ($2 million).
3. 2021 excludes charges associated with integration efforts and external costs related to the acquisitions of Bayer Animal Health and
KindredBio, and charges primarily related to independent stand-up costs and other related activities ($30 million), a charge associated
with the settlement of a liability for future royalty and milestone payments triggered in connection with our acquisition of KindredBio ($26
million), costs associated with the sale of our manufacturing site in Shawnee, Kansas ($1 million), asset impairments ($50 million), asset
write-downs ($6 million), and the settlement of a legal matter ($8 million), partially offset by curtailment gains recognized due to the
remeasurement our pension benefit obligations resulting from workforce reductions associated with our recent restructuring programs ($9
million) and a favorable adjustment from reversals for severance programs that are no longer active ($2 million).
4. 2020 excludes charges associated with integration efforts and external costs related to the acquisition of businesses, including the
acquisition of the animal health business of Bayer, and charges primarily related to independent stand-up costs and other related
activities ($131 million), severance ($130 million), and asset write-downs ($1 million).
5. 2020 excludes the debt extinguishment loss recorded in connection with the partial repayment of our existing term loan facility ($2
million).
6. 2021 excludes an adjustment to a loss that was previously recorded in relation to the divestiture of products ($1 million).
7. 2020 excludes gains recorded in relation to the divestiture of several products as required as a result of the acquisition of the animal
health business of Bayer ($156 million) and a hedging gain related to the closing of the acquisition of the animal health business of Bayer
($6 million), partially offset by a loss recorded in relation to the divestiture of products ($7 million) and debt issuance costs ($36 million).
8. 2021 represents the income tax expense associated with the adjusted items, as well as a net decrease in the valuation allowance
recorded against our U.S. deferred tax assets during the period ($2 million).
9. 2020 represents the income tax expense associated with the adjusted items.
10. During the three months ended September 30, 2021 and 2020, we reported a GAAP net loss and thus potential dilutive common shares
were not assumed to have been issued since their effect is anti-dilutive. During the same periods, we reported non-GAAP net income. As
a result, potential dilutive common shares would not have an anti-dilutive effect, and diluted weighted average shares outstanding for
purposes of calculating Adjusted EPS include 1.7 million and 1.2 million, respectively, of common stock equivalents.

Nine Months 2021
Adjusted EBITDA Reconciliation
34
$ millions
(1) Represents depreciation and amortization of certain assets that was accelerated during the periods presented. This amount must be added back to arrive at adjusted EBITDA
because it is included in asset impairment, restructuring, and other special charges but it has already been excluded from EBITDA in the “depreciation and amortization" row above
Nine Months 2021
Reconciliation of GAAP Reported to Non-GAAP Adjusted Income Statement Items
$ millions
35See slide 36 for details of adjustments to certain GAAP reported measures

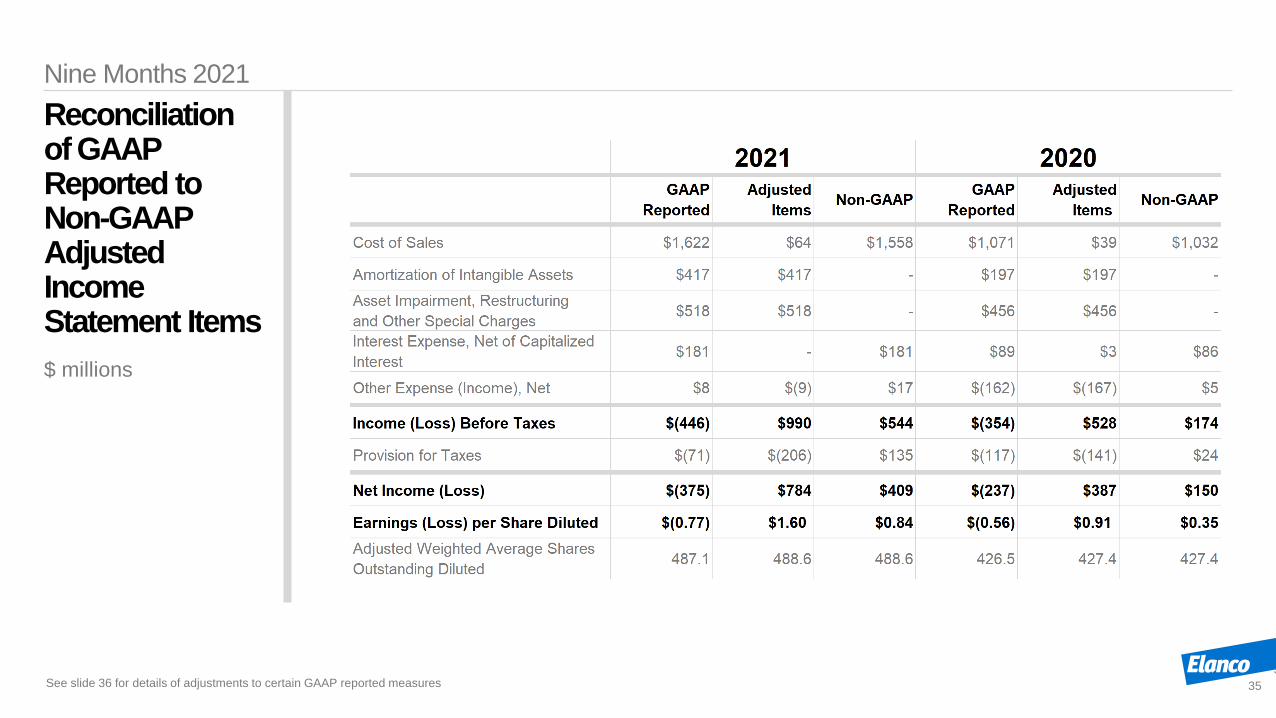
Nine Months 2021
Details of Adjustments to Certain GAAP Reported Measures
36
For the nine months ended September 30, 2021 and 2020:
1. 2021 excludes amortization of inventory fair value adjustments recorded from the acquisition of Bayer Animal Health ($64 million).
2. 2020 excludes amortization of inventory fair value adjustments recorded from the acquisition of the animal health business of Bayer ($33 million)
and charges associated with the write-off of marketing inventory recorded from the acquisition of the animal health business of Bayer ($2 million),
and a onetime payment to settle outstanding obligations to a contract manufacturing organization in connection with a divestiture ($4 million).
3. 2021 excludes charges associated with integration efforts and external costs related to the acquisition of Bayer Animal Health and KindredBio, and
charges primarily related to independent stand-up costs and other related activities ($141 million), a charge associated with the settlement of a
liability for future royalty and milestone payments triggered in connection with our acquisition of KindredBio ($26 million), costs associated with the
sale of our manufacturing sites in Shawnee, Kansas and Speke, U.K. and other business development transactions ($4 million), severance accruals
net of reversals ($26 million), asset impairments ($63 million), and asset write-downs ($275 million) and the settlement of a legal matter ($8 million),
partially offset by curtailment gains recognized due to the remeasurement our pension benefit obligations resulting from workforce reductions
associated with our recent restructuring programs ($26 million).
4. 2020 excludes charges associated with integration efforts and external costs related to the acquisition of businesses, including the pending
acquisition of the animal health business of Bayer, and charges primarily related to independent stand-up costs and other related activities ($318
million), facility exit costs and asset write-downs ($4 million), severance accruals net of reversals ($131 million), the settlement of a legal matter ($3
million), and the impairment of intangible assets ($4 million), partially offset by the gain on the sale of our R&D facility in Prince Edward Island,
Canada ($4 million).
5. 2020 excludes the debt extinguishment loss recorded in connection with the repayment of our existing term loan facilities ($3 million).
6. 2021 excludes up-front payments received and equity issued to us in relation to license and asset assignment agreements ($9 million).
7. 2020 excludes the gains recorded in relation to the divestiture of several products as required as a result of the acquisition of the animal health
business of Bayer ($156 million), a hedging gain related to the closing of the acquisition of the animal health business of Bayer ($6 million), the gain
on our sale of land and buildings in New South Wales, Australia ($46 million) and the impact of a decrease in the fair value of the Prevtec contingent
consideration ($2 million), partially offset by a loss recorded in relation to the divestiture of products ($7 million) and debt issuance costs ($36
million).
8. 2021 represents the income tax expense associated with the adjusted items, partially offset by a net increase in the valuation allowance recorded
against our U.S. deferred tax assets during the period ($2 million).
9. 2020 represents the income tax expense associated with the adjusted items.
10. During the nine months ended September 30, 2021 and 2020, we reported a GAAP net loss and thus potential dilutive common shares were not
assumed to have been issued since their effect is anti-dilutive. During the same periods, we reported non-GAAP net income. As a result, potential
dilutive common shares would not have an anti-dilutive effect, and diluted weighted average shares outstanding for purposes of calculating Adjusted
EPS include 1.5 million and 0.9 million, respectively, of common stock equivalents.

Full Year 2021
37
EPS Guidance Reconciliation November Update
Note: Numbers may not add due to rounding
(1) Cost of sales adjustment is related to the amortization of inventory fair value adjustments recorded from the acquisition of Bayer Animal Health
(2) Asset impairment, restructuring, and other special charges adjustments are related to integration efforts and external costs related to the acquisition of businesses, including the acquisition of the animal
health business of Bayer, and charges primarily related to independent stand-up costs and other related activities, including severance
(3) Adjusted EPS is calculated as the sum of reported EPS and total adjustments to EPS

Full Year 2021
$ millions
38Note: Numbers may not add due to rounding
EBITDA Guidance Reconciliation November Update

Fourth Quarter 2021
39
EPS Guidance Reconciliation
Note: Numbers may not add due to rounding
(1) Asset impairment, restructuring, and other special charges adjustments are related to integration efforts and external costs related to the acquisition of businesses, including the acquisition of the animal
health business of Bayer, and charges primarily related to independent stand-up costs and other related activities, including severance
(2) Adjusted EPS is calculated as the sum of reported EPS and total adjustments to EPS

Fourth Quarter 2021
$ millions
40Note: Numbers may not add due to rounding
EBITDA Guidance Reconciliation