2021 investor day - seeking alpha
TRANSCRIPT

INVESTOR DAYFEBRUARY 25, 2021

Statement Regarding Safe Harbor for Forward-Looking StatementsThis presentation may contain forward-looking statements – that is, information related to future, not past, events. Like other businesses, Martin Marietta (the Company) is subject to risks and uncertainties which could cause its actual results to differ materially from its projections or that could cause forward-looking statements to prove incorrect, including the risks and uncertainties discussed in Martin Marietta’s most recent Annual Report on Form 10-K, quarterly reports on Form 10-Q and current reports on Form 8-K, which have been filed with the Securities and Exchange Commission (SEC) and are readily accessible on the SEC's website and the Company's website. Except as legally required, Martin Marietta undertakes no obligation to publicly update or revise any forward-looking statements, whether resulting from new information, future developments or otherwise.
Non-GAAP Financial MeasuresThis presentation contains certain financial measures presented on a non-GAAP basis which are defined in the Appendix. These non-GAAP financial measures are not in accordance with, nor are they a substitute for, GAAP measures. Reconciliations of non-GAAP financial measures to the most directly comparable GAAP financial measures are provided in the Appendix. Management believes these non-GAAP measures are commonly used financial measures for investors to evaluate the Company’s operating performance, and when read in conjunction with the Company’s consolidated financial statements, present a useful tool to evaluate the Company’s ongoing operations, performance from period to period and anticipated performance. In addition, these are some of the factors the Company used in internal evaluation of the overall performance of its businesses. Management acknowledges there are many items that impact a company’s reported results and the adjustments reflected in these non-GAAP measures are not intended to present all items that may have impacted these results. In addition, these non-GAAP measures are not necessarily comparable to similarly titled measures used by other companies.
2

BUILDING ON A SUSTAINABLE FOUNDATION

UNIQUELY POSITIONED AGGREGATES-LED GROWTH PLATFORMUPSTREAM BUILDING MATERIALS TARGETED DOWNSTREAM PRODUCTS MAGNESIA SPECIALTIES
Aggregates Strategic Cement
90 years of reservesbased on 2020
production levels
#1 or #2in 90% of markets
4.5MM tonscombined annual capacity
Largest producer in Texaswith 2 plants
30% of total tonsconsumed internally
Ready-Mixed Concrete Asphalt & Paving
Leading positionsalong Colorado Front Range
and Texas Triangle
Premier A&P businessalong Colorado Front Range
70% of asphalt tonsused internally for paving
8.4MM cubic yardsannual production
Consumer of high-margin
upstream materials
Consumer of high-margin
upstream materials
Specialty Chemicals and Dolomitic Lime
300K tonsannual chemicals
production capacity
Largest dolomitic lime operation in North America
30+ countrieschemicals sales
4

of total consolidated gross profit82%
VALUE PROPOSITION OF BUILDING MATERIALS SUPPLY CHAIN
• Real pricing growth through economic cycles
• Depleting natural resource
• Limited substitute products
• Texas demand exceeds statewide capacity
• Key markets largely insulated from waterborne imports
AGGREGATES
CEMENT
• Key aggregates distribution channel (95% by weight)
• End market resiliency
• Key aggregates and cement distribution channel (80% by weight)
• Selective market entry
• Resilient product
ASPHALT
READY MIXED CONCRETE
of total consolidated gross profit10%
UPSTREAM MATERIALS DOWNSTREAM PRODUCTS
5

ATTRACTIVE GEOGRAPHIC FOOTPRINT ACROSS U.S. MEGAREGIONS
Cascadia
Northern California
Southern California
Front Range
Texas Triangle
Gulf Coast
Florida
Northeast
Piedmont Atlantic
Great Lakes
Martin Marietta Locations
Arizona Sun Corridor
Source: America 2050 *Defined as large networks of metropolitan population centers covering thousands of square miles
Majority of the nation’s population and economic growth through 2050will occur in 11 megaregions*
6

OUR SUSTAINABLE GROWTH AND PERFORMANCE ARE UNDERSCORED BY SOAR
Employee Well-Being
CommunityWell-Being
Environmental Stewardship
Safe Operations
Commercial and Operational Excellence
Platform for Growth
CapitalAllocation
Strategic Operating Analysis and Review
7

COMMITTED TO A WORLD-CLASS SAFETY CULTURE
Companywide, we achieved a world-class lost-time incident rate (LTIR) 1 for the fourth consecutive year
99.8%of employees experiencedZERO lost-time incidents
98.9%of employees experienced ZERO incidents
79business units have worked more than 500,000 hours with ZERO lost-time injuries
World-Class Safety Level (0.20)
World-classperformance
WE CONTINUE TO PROVE THAT ZERO IS POSSIBLE
0.39 0.24 0.152010 2015 2020
Note: Safety data current as of 12/31/20LTIR rate per 200,000 man hours worked. World-class levels based on general industries.
8

OPERATING IN AN ENVIRONMENTALLY RESPONSIBLE MANNER
Aggregates-led business yields small direct greenhouse gas emissions (GHG) footprint
WATER AND WASTE MANAGEMENT
OPERATIONAL UPGRADES
ALTERNATIVE FUELS
PRODUCTION INNOVATION
BIODIVERSITY
DRIVING REDUCTION GOALS RESPONSIBLY USING NATURAL RESOURCES
15%in Scope 1 CO2e emissionsfrom cement operations
10%in Scope 1 CO2e emissions from Magnesia Specialties businesses
2030 GHG REDUCTION GOALS
87%of OVERALL
Scope 1 CO2e emissions
9

SUPPORTING AND INVESTING IN OUR PEOPLE
Note: Photographs taken prior to COVID-19-related enhanced safety and health protocols.
10

ROBUST CORPORATE GOVERNANCE AND OVERSIGHT BY BOARD OF DIRECTORS
C. HOWARD NYEChairman of the Board
2010
JOHN J. KORALESKILead Independent Director
2016
DOROTHY M. ABLESIndependent Director
2018
SUE W. COLEIndependent Director
2002
MICHAEL J. QUILLENIndependent Director
2008
DONALD W. SLAGERIndependent Director
2016
DAVID C. WAJSGRASIndependent Director
2020
independent directors>90% women or minorities45%current or former public company CEOs45%
SMITH W. DAVISIndependent Director2018
ANTHONY R. FOXXIndependent Director
2020
LAREE E. PEREZIndependent Director2004
THOMAS H. PIKEIndependent Director2019
11

DISCIPLINED EXECUTION OF A PROVEN STRATEGY
Best-in-class growth1
TOTAL REVENUES ADJUSTED EBITDA TOTAL SHAREHOLDER RETURNS
1. Growth % are for the period from 12/31/2005 through 12/31/2020.
2. 2020 Adjusted EBITDA includes $70MM in gains on nonoperational land and asset sales. Source: Public company filings for fiscal years ending 12/31/2005 and 12/31/2020 and FactSet market data.
68%
135%
90%
219%
167%
351%
2
+6,700 bps
+12,900 bps
+18,400 bps
12

DISCIPLINED EXECUTION OF A PROVEN STRATEGY
TOTAL SHAREHOLDER RETURNS
Consistently outperformed S&P 500 and heavyside building materials companies
Note: Time period is representative of FY 2005 (Peak Volume) to FY 2020. Source: FactSet market data. Note: International peer set includes CEMEX, CRH, HeidelbergCement, and LafargeHolcim.
S&P 500
International Heavyside Building Materials Companies
351%
311%
167%
-13%
13
OUR DIFFERENTIATED BUSINESSMODEL PROVIDES A SUSTAINABLE FOUNDATION FOR GROWTH

RESILIENT AGGREGATES-LED BUSINESS IS A KEY DIFFERENTIATOR
1. CAGR – Compound Annual Growth Rate.
90%OF TOTAL CONSOLIDATED GROSS PROFIT
Complementary, high-margin business with sustainable earnings that moderates heavyside demand cyclicality
Texas cement pricing CAGR1 of 4.5% since 2013, similar to aggregates business
Secular pricing growth coupled with resilient infrastructure demand through cycles
Leading cement position in the nation’s largest cement market
Leading producer of magnesia-based chemicals and dolomitic lime
Leading aggregates positions in 90% of markets
AGGREGATES-LED STRATEGIC CEMENT MAGNESIA SPECIALTIES
15

AGGREGATES-LED COMPANY, FIRST AND FOREMOST
Secular pricing and per unit profitability growth through cycles
1. Peak-to-trough timeframe represents peak Martin Marietta aggregates shipments in 2005 and Great Recession industry trough in 2011.
VALUE DRIVERS AVERAGE SELLING PRICE PER TON
CASH GROSS PROFIT PER TON
Diminishing natural resource
Capital and permitting barriers to entry for new supply
Limited substitute products
Value-to-weight ratio creates logistical moats
40%29%32%Margin
$2.47 $3.02
$5.92
2005 (Peak) 1 2011 (Trough) 1 2020
$7.58
$10.32
$14.77
2005 (Peak) 1 2011 (Trough) 1 2020
16

STRATEGIC CEMENT
4.5% pricing CAGR since 2013, similar to what you would expect in an aggregates business
1. Represents year prior to Martin Marietta ownership of Texas cement assets.
VALUE DRIVERS
Demand exceeds capacity of statewide plants
Leading and targeted vertical position supports “value over volume” pricing strategy
Midlothian and Hunter plants arelocationally well-positioned
Improved market structure
AVERAGE SELLING PRICE PER TON
PRODUCT GROSS PROFIT ($MM)
$83.57 $113.88
2013 20201
$77
$171
2013 2020
Margin 28% 38%
1
17

COMPLEMENTARY MAGNESIA SPECIALTIES BUSINESS
Sustainable profitability moderates heavyside earnings cyclicality
VALUE DRIVERS
Highly valued and recognized brand names
Diversified global distribution network
Wide variety of end-use applications
Company-leading free cash flow conversion
PRODUCT GROSS PROFIT AND MARGIN
COVID-19 impact to
steel industry
18

SOAR EXECUTION PROVIDES A SUSTAINABLE FUTURE FOR GENERATIONS TO COME

SOAR HAS SIGNIFICANTLY TRANSFORMED OUR BUSINESS
Responsible and sustainable market expansion through M&A; committed to investment-grade credit rating
4.2X MARKET CAP GROWTH SINCE ORIGINAL SOAR LAUNCH
2.7x
3.7x
$1.8BTotal Revenues $4.7B
$377MMAdjusted EBITDA $1.4BGrowth
$4.2B(12-31-10)
$8.8B(12-31-15)
$17.7B(12-31-20)
20

DISCIPLINED STRATEGIC PLANNING AND EXECUTION
SWOTAnalysis
Market Dynamics
M&A Target Identificationand Prioritization
Organic Growth Opportunities
Portfolio Optimization
Local Demand Drivers
EXECUTIVE LEADERSHIP STRATEGY & DEVELOPMENT
LOCAL OPERATING TEAMSDIVISION LEADERSHIP
21

Drive profitable materials growth while maximizing shareholder value
IDENTIFIED ACTIONABLE STRATEGIC PRIORITIESOVER THE NEXT FIVE YEARS
PORTFOLIOOPTIMIZATIONINORGANIC GROWTHORGANIC GROWTH
GROWTH CAPITAL INVESTMENTS
COMMERCIAL EXCELLENCE
OPERATIONALEXCELLENCE
BOLT-ON ACQUISITIONS
NEW MARKET EXPANSION
ASSET SWAPS / DIVESTITURES
MONETIZE SURPLUS & EXCESS LAND
22

CAPACITY EXPANSION AT KEY UPSTREAM MATERIALSOPERATIONS IN DALLAS/FORT WORTH
+ 3.5MM TONS OF CAPACITY
BRIDGEPORT / CHICO AGGREGATES QUARRIES MIDLOTHIAN CEMENT PLANT FINISH MILL 7
+ 0.5MM TONS OF HIGH-UNIT-MARGIN CAPACITY
23

CONSISTENT PRICING POWER UNDERSCORES THE AGGREGATES INVESTMENT THESIS
Consistent pricing growth through economic cycles
Note: 2020 shipments includes 40MM tons from operations acquired since original SOAR launch in 2010. Excluding acquired tons, 2020 shipments remain 28% below 2005 prior-peak levels.
4.5% PRICING CAGR
$7.58 $8.60
$9.49 $10.14 $10.39 $10.04 $10.32 $10.40 $10.72 $11.18 $12.04
$12.91 $13.50 $13.75 $14.33 $14.77
2005 2006 2007 2008 2009 2010 2011 2012 2013 2014 2015 2016 2017 2018 2019 2020
Aggregates Shipments Aggregates Average Selling Price
24

COMMERCIAL EXCELLENCE THROUGH AGILE LOCALLY-DRIVEN PRICING STRATEGY
Complemented by a consistent strategy to emphasize and reward value over volume
Locally-led pricing across the enterprise
Increased investment in sales personnel training and development
Mix-adjusted metrics focus on same-store and same-product pricing opportunities
Local autonomy enables market-based, real-time decision making
25

LOCALLY-EXECUTED STRATEGY DRIVES SUSTAINABLE AND ACHIEVABLE AGGREGATES PRICING UPSIDE
1. For illustrative purposes only. Represents pricing upside assuming $18.50 ASP achieved across all aggregates operations.
AVERAGE SELLING PRICE (ASP)
$700MM OPPORTUNITY FROM REALIZING $18.50 ASP ACROSS THE FOOTPRINT
West Group ASP$13.82
East Group ASP$15.31
$10.04
$14.77
$18.50
2010 2020Various MLM Markets1Company Average
+25% UPSIDE
4.0% CAGR
+47%
$140MM OPPORTUNITY FROM PRICING NORMALIZATION ACROSS THE FOOTPRINT
26

COMMITTED TO OPERATIONAL EXCELLENCE
STRATEGIC AREAS OF FOCUS BASED ON VALUE POTENTIAL
POISED TO CAPTURE CONTINUED BENEFITS FROM SCALE AND STANDARDIZATION
Mine PlanningPlant Design
Production Preventative Maintenance
Transportation & Logistics
Planning
Procurement Asset Management
SUPPLY CHAIN MANAGEMENTPERFORMANCE IMPROVEMENT
27

WE ARE A CLEAR LOW-COST PRODUCER
CONSOLIDATED SG&A AS % OF TOTAL REVENUESAGGREGATES COST OF SALES PER TON
$8.06
$10.22
2010 2020
7.5%
6.5%
2010 2020
2.4% CAGR100 BPS
28
Note: Aggregates Cost of Sales Per Ton defined as Aggregates Average Selling Price less Aggregates Gross Profit per Ton.

PRICING DISCIPLINE AND OPERATIONAL EXCELLENCE DRIVESUSTAINABLE AND INDUSTRY-LEADING UNIT PROFITABILITY GROWTH
Best-in-class unit profitability growth enhanced by M&A opportunities
Manage costs to be at or less than inflation rate
Mix-adjusted ASP CAGR of 4%
Best-in-Class Aggregates
Unit Profitability
2025 STRATEGIC FOCUSAGGREGATES GROSS PROFIT PER TON
$1.98
$4.55
2010 2020
8.7% CAGR
29

M&A REMAINS OUR PREFERRED STRATEGY FOR GROWTH
GREENFIELDM&A
Significant upfront capital investment for uncertain future cash flows (generally a lower-return exercise)
Increasingly difficult and lengthy permitting process
Inherent local community risks by introducing a new industrial facility
Day 1 cash flows
Synergy potential
Limited regulatory risk in targeted new markets
Significant bolt-on and platform acquisition opportunities available
Disciplined management team with notable transaction execution experience
30

CONSOLIDATION ALLOWS FOR SIGNIFICANT UNITPROFITABILITY GROWTH VS. GREENFIELD DEVELOPMENT
Day 0 Year 1 Year 2 Year 3 Year 4 Year 5 Year 6 Year 7
$5.81
$3.11
Operational Permits Approved
Sell Rock(Cash Inflow)
Facility ConstructionLand Use Permits /
Operational Permits
Land Use Permit Approved
Risk of Appeal
Land Acquisition
GREENFIELD CASE
ACQUISITION CASE
TIMELINE
+87%
Note: For illustrative purposes. Acquisition case based on historical Martin Marietta Texas-based aggregates acquisition.
Disclaimer: Timelines could be shorter or longer depending on region and specific circumstances of proposed facility.
31

DISCIPLINED VALUE OVER VOLUME STRATEGY IN TARGETED NEW MARKETS
Note: For illustrative purposes. Based on historical Martin Marietta aggregates acquisition.
AGGREGATES GROSS PROFIT PER TONAGGREGATES AVERAGE SELLING PRICE
$10.10
$12.35
2017 2020
$3.28
$4.53
2017 2020
+22%+38%
32

WHAT MAKES A MARKET ATTRACTIVE?
HIGH BARRIERS TO ENTRY
MARKET STRUCTURE SUPERIOR STATE FINANCIAL POSITION
EMPLOYMENT / POPULATION GROWTH
POPULATION DENSITY BUSINESS AND EMPLOYMENT DIVERSITY
Protects location advantage Drives margin performance Supports infrastructure volume growth providing stability through cycles
Drives increased per capita heavy-side building materials consumption
Strengthens economic andmarket stability
Supports public infrastructure spending
33

WHERE ARE WE LOOKING?
Viable, executable acquisition targets present unmatched growth opportunities
BOLT-ONS PLATFORM EXPANSION
WEST COAST SOUTH FLORIDA
D.C. METRO TENNESSEE
WEST DIVISION CENTRAL DIVISION
SOUTHWEST DIVISION EAST DIVISION
34

BALANCED APPROACH TO LONG-STANDING CAPITAL ALLOCATION PRIORITIES
ACQUISITIONSORGANIC CAPITAL
INVESTMENTRETURN OF CASH TO
SHAREHOLDERS
35

FIREPOWER TO SUCCESSFULLY MAINTAIN A RESPONSIBLELEADING ROLE IN OUR INDUSTRY’S EVOLUTION
1.9xLeverage Ratio
$2.5 - $3.0 BILLIONAdditional Leverage Capacity and Still Retain
Investment-Grade Rating
2021 2022 2023 2024 2025 2026
NO DEBT MATURITIES UNTIL 2024 Full availability under our
A/R and Revolving Credit Facilities
Undrawn Revolving Credit Availability
$125M
$400M
$4.8B+
INVESTED IN ACQUISITIONS since original SOAR launch
Atlanta and River for the Rockies
FINANCIAL STRENGTH AND FLEXIBILITY
36

PRUDENTLY REINVESTING INTO THE BUSINESS
8.5% 7.4% 7.2% 7.9%
9.0% 10.1% 10.3%
8.9% 8.3% 7.6%
2011 2012 2013 2014 2015 2016 2017 2018 2019 2020
CapEx CapEx as % of Total Revenues
Balanced approach to maintenance capital minimized catch-up costs
relative to peers
Reduced spend in response to
COVID-19
ANNUAL CAPITAL SPEND
37

ENHANCING SHAREHOLDER VALUE
$2.1 billion returned to shareholders since initial SOAR launch
DIVIDENDS SHARE REPURCHASES
SUSTAINABLE AND MEANINGFUL DIVIDENDmaintained or increased every quarter since
becoming a public company in 1994
OPPORTUNISTIC SHARE REPURCHASESto improve balance sheet efficiency and
preserve targeted leverage ratio
38

RESPONSIBLY GROWING OUR BUSINESS FOR LONG-TERM SUCCESS
ORGANIC GROWTH
2020 2025DRIVE PROFITABLE MATERIALS GROWTH WHILE MAXIMIZING SHAREHOLDER VALUE
INORGANIC GROWTH PORTFOLIO OPTIMIZATION
CEMENT
Growth Capital
Investments
Commercial Excellence
Operational Excellence
Maintain and improve industry-leading aggregates cost per ton• Operational improvements• Supply chain management
TOP
LIN
EB
OTT
OM
LIN
E
AGGREGATES
Mix-adjusted ASP CAGR of 4%
Priority Bolt-Ons
New Market Expansion
Current footprintTargeted ExpansionTarget Market
West Division Central Division
Southwest Division East Division
Asset Swaps &
Divestitures
Monetize Surplus and Excess Land
Build upon recent successful land sales in Texas and California
Evaluate opportunities where we may not be the best owner for a particular set of assets
39

BRIGHT PROSPECTS FOR SUSTAINABLE LONG-TERM DEMAND

EMERGING DEMAND TRENDS NOT SEEN IN OVER A DECADE
Stable Demand Cyclical Demand
NONRESIDENTIAL RESIDENTIAL
StateFederal Schools, healthcare and municipal
facilities
Retail, commercialand heavy industrial
Single-family and multi-family development
Public Funding
INFRASTRUCTURE
Private / Public Funding Private Funding
41

INFRASTRUCTURE PROVIDES STABLE BASE LEVEL FOR AGGREGATES SHIPMENTS
Source: The American Association of State Highway and Transportation Officials (AASHTO) and American Road & Transportation Builders Association (ARTBA).
STATEFEDERAL
ATTRACTIVE TOP 5 STATE DOTS HAVE ESTIMATED FY2021 LETTINGS ABOVE OR NEAR PRIOR-YEAR LEVELS
FUTURE: Bipartisan support for new surface transportation legislation at increased funding levels not seen in over 15 years
CURRENT: The continuing resolution of the Fixing America’s Surface Transportation Act (FAST Act) maintains current funding levels through September 2021
$45 $57
$64
FAST Act2016 - 2020
Senate Proposal2019
House Proposal2020
AVERAGE ANNUAL SPENDING($ in Billions)
303state and local initiatives
on November 3, 2020 ballot
94%APPROVED
VOTER-APPROVED TRANSPORTATION INVESTMENT BALLOT MEASURES HIT 20-YEAR HIGH
42

WHAT DRIVES PRIVATE-SECTOR AGGREGATES DEMAND?
Note: Correlation data from 2000-2019 on a one year lag basis. Source: U.S. Census Bureau and Dodge Data and Analytics.
DRAG-ALONG EFFECTLEADING INDICATORS WITH A STRONG RELATIONSHIP TO AGGREGATES DEMAND
93% CORRELATION
99% CORRELATION
96% CORRELATION
Single-family housing starts
Dodge total squarefootage (residential and nonresidential)
Single-family housing starts and Dodge nonresidential square footage
43

SINGLE-FAMILY DEVELOPMENT IS 2X TO 3X MORE AGGREGATES INTENSIVE
CURBS, SEWERS andGUTTERS in new
residential development
NEW SCHOOLS, HEALTHCARE and
MUNICIPAL FACILITIES
NEW RETAIL, COMMERCIAL and WAREHOUSES
to support new communities
NEW ACCESS ROADS, INTERCHANGES
and LANE WIDENINGS
“Drag-along effects” of community buildout
44

NONRESIDENTIAL CONSTRUCTION TO BENEFIT FROM DRAG-ALONG EFFECT
Source: U.S. Census Bureau, USGS and Dodge Data and Analytics.
Correlation between nonresidential square footage and single-family starts 93%
12 to 18 month lag between single-family and nonresidential
square footage peak
2000 2001 2002 2003 2004 2005 2006 2007 2008 2009 2010 2011 2012 2013 2014 2015 2016 2017 2018 2019 2020
Single-Family Starts (000s) Nonresidential Sqft (BNs)
26% below peak
45

NONRESIDENTIAL ACTIVITY VARIES BY SECTOR
Minimal impact beyond 2021 Length / Duration Impact beyond 2021
Deg
ree
of
nea
r-te
rm
CO
VID
-19
imp
act
High impact
Low impact
Single-family development
should stabilize these sectors
ACCELERATING TO MEET INCREASED DEMAND
Data centers Warehouses
→
HIGH SHORT-TERM IMPACT AND UNCERTAIN RECOVERY
HIGH SHORT-TERM IMPACT AND POTENTIAL FOR SLOW RECOVERY
RetailHospitality / Restaurants
MODERATE IMPACT AND POTENTIAL FOR SLOW RECOVERY
MODERATE SHORT-TERM IMPACT AND QUICK RECOVERY
Education Healthcare Manufacturing Office
46

ACCELERATING E-COMMERCE AND REMOTE WORK TRENDS REQUIRE INCREASED INVESTMENT
Source: Dodge Data and Analytics.
Warehouses and data centers consume significantly more aggregates thanretail and light commercial projects
WALMART DISTRIBUTION CENTER CHARLESTON, SC
3MM Sqft
FACEBOOK DATA CENTERDES MOINES, IA
+3MM Sqft
5 AMAZON WAREHOUSESSAN ANTONIO, TX
5MM Sqft
AMAZON FULFILLMENT CENTERCOLORADO SPRINGS, CO
4MM Sqft
47

SCOPE AND SCALE, NOT DOLLAR VALUE, DRIVE DEMAND
Source: Dodge Data and Analytics Q1 2021 Sneak Peek.
TOTAL NONRESIDENTIAL AND RESIDENTIAL SQUARE FOOTAGE
96% CORRELATION
Total residential and nonresidential square footage
Aggregates intensity2017 2018 2019 2020 2021E 2022E 2023E 2024E 2025E
(IN
BIL
LIO
NS)
Multi-year growth in total forecasted square footage
48

EMERGING DEMAND TRENDS NOT SEEN IN OVER A DECADE
Stable Demand Cyclical Demand
NONRESIDENTIAL RESIDENTIAL
StateFederal Schools, healthcare and municipal
facilities
Retail, commercialand heavy industrial
Single-family and multi-family development
Public Funding
INFRASTRUCTURE
Private / Public Funding Private Funding
49

CONCLUDING REMARKS

A SUSTAINABLE FOUNDATION
Aggregates-led growth platform
Attractive geographies
Sustainable practices
Best-in-class teams
Right strategic priorities
51

DISCIPLINED EXECUTION OF A PROVEN STRATEGYORGANIC GROWTH INORGANIC GROWTH CYCLICAL DEMAND INFRASTRUCTURE RECOVERY
• Commercial excellence
• Operational excellence
• Balance sheet flexibility
• Regulatory expertise and capability
• Track record of successful integration and synergy realization
• Unmatched white space
• Single-family housing-led recovery
• Ancillary infrastructure and nonresidential buildout
• Comprehensive Federal surface transportation legislation
• State-led transportation investment initiatives
UNRIVALED GROWTH POTENTIAL DEMAND TAILWINDS NOT SEEN IN OVER A DECADE
BEST-IN-CLASS UNIT PROFITABILITY GROWTH
52

WELL-POSITIONED TO REPEAT PRIOR CYCLE SUCCESS
20202010
4.2XMarket cap growth since original SOAR launch(MM, except ratio)
1. Inclusive of +40MM tons from operations acquired since 2010.2. Includes $70MM in gains on nonoperational land and asset sales.
TOTAL REVENUES
ADJUSTED EBITDA
LEVERAGE RATIO
AGGREGATES TONS
$1,783
$377
2.7x
131
$4,730
$1,3932
1.9x
1861
Colorado
Atlanta
Colorado platform entrance
Texas platform
expansion
Southeast platform
expansion
53
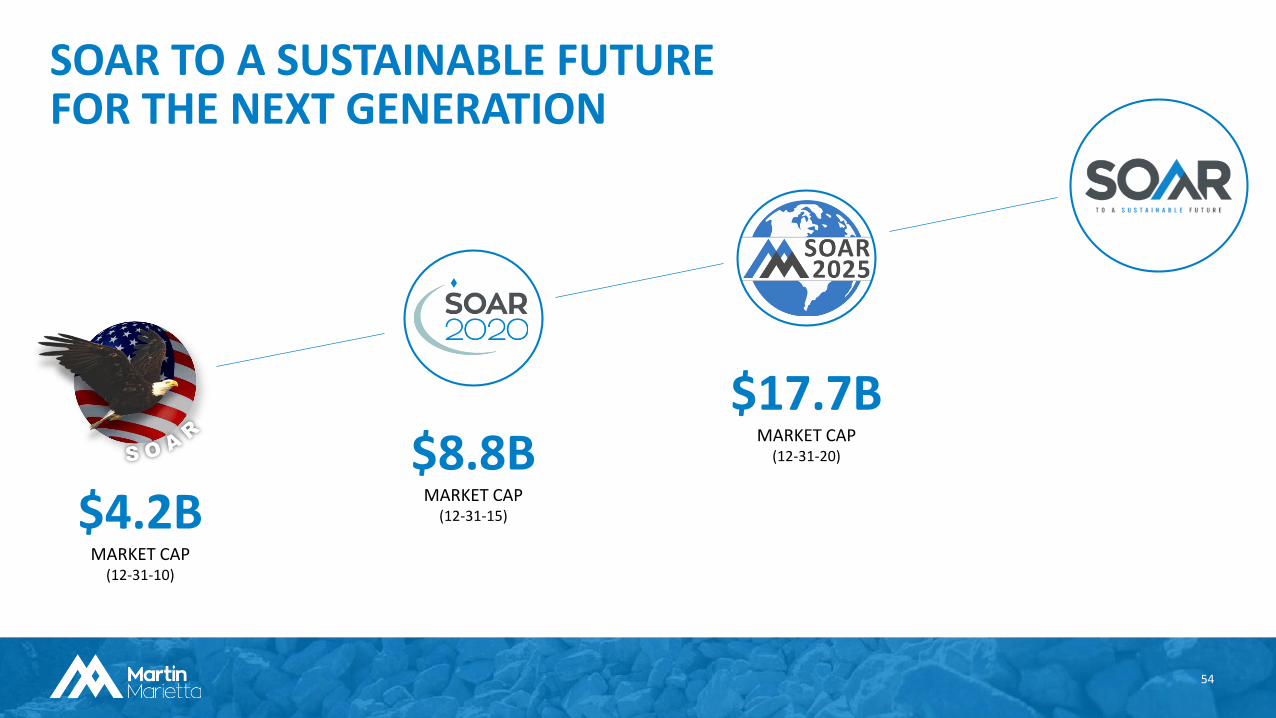
$4.2BMARKET CAP
(12-31-10)
$8.8BMARKET CAP
(12-31-15)
$17.7BMARKET CAP
(12-31-20)
SOAR TO A SUSTAINABLE FUTURE FOR THE NEXT GENERATION
54

APPENDIX

2005 2010 2020
Net earnings attributable to Martin Marietta
$193 $97 $721
Add back:
Interest expense, net of interest income
42 68 118
Income tax expense for controlling interests
71 29 168
Depreciation, depletion and amortization expense and noncash earnings/loss from nonconsolidated equity affiliates
136 183 386
Adjusted EBITDA $442 $377 $1,393
ADJUSTED EBITDA
Earnings before interest; income taxes;
depreciation, depletion and amortization
expense; and the earnings/loss from
nonconsolidated equity affiliates (Adjusted
EBITDA) is an indicator used by the Company and
investors to evaluate the Company's operating
performance from period to period.
Adjusted EBITDA is not defined by generally
accepted accounting principles and, as such,
should not be construed as an alternative to
earnings from operations, net earnings or
operating cash flow.
$ IN MILLIONS
56

2005 2011 2020
Aggregates product gross profit $386 $227 $849
Depreciation, depletion and amortization expense
118 153 255
Aggregates cash gross profit $504 $380 $1,104
Aggregates shipments 204 126 186
Aggregates gross profit per ton $1.89 $1.80 $4.56
Aggregates cash gross profit per ton $2.47 $3.02 $5.92
AGGREGATES CASH GROSS PROFIT
Cash gross profit adds back noncash charges
for depreciation, depletion, and amortization to
gross profit.
Cash gross profit is not defined by generally
accepted accounting principles and, as such,
should not be construed as an alternative to
gross profit or other earnings or cash flow
measures defined by GAAP.
Aggregates cash gross profit per ton is computed
by dividing aggregates cash gross profit by tons
shipped.
$ IN MILLIONS, EXCEPT PER TON
57

2010 2020
Net earnings attributable to Martin Marietta $97 $721
Add back:
Interest expense, net of interest income 69 118
Income tax expense for controlling interests 29 168
Depreciation, depletion and amortization expense and noncash earnings/loss from nonconsolidated equity affiliates
182 386
Adjusted EBITDA $377 $1,393
Consolidated debt at December 31 $1,031 $2,626
Leverage ratio 2.7X 1.9X
LEVERAGE RATIO
Leverage ratio, or consolidated debt to
consolidated Adjusted EBITDA, is a non-
GAAP measure.
Management uses this ratio to assess its
capacity for additional borrowings. The
calculation is not intended to be a substitute
for the Company's leverage covenant under
its credit facility.
$ IN MILLIONS
58

INVESTOR DAYFEBRUARY 25, 2021