2021 phase 2 sampling preliminary analysis draft
TRANSCRIPT

Enhanced Delta Smelt Monitoring2021 Phase 2 SamplingPreliminary Analysis
DRAFTU.S. Fish and Wildlife Service
July 7, 2021
Overview
On March 29, 2021, the Enhanced Delta Smelt Monitoring (EDSM) program started its Phase 2 samplingprogram for postlarval and juvenile Delta Smelt. In order to improve our ability to make inferences aboutthe population, sampling effort is being focused on six geographic areas where Delta Smelt are likelyto be caught based on historical data. Sampling locations are generated using a generalized random-tessellation stratified (GRTS) design [Stevens and Olsen, 2004] with stratification and equal probabilitysampling. Trawling gear similar to that used in the California Department of Fish and Wildlife’s 20 mmSurvey is used to conduct two tows per site.
In some previous years, the trawl was towed obliquely with a single boat as in the 20 mm Survey. Thisyear, the trawl will be towed at the surface with a single boat. This change is based on experimental larvalsampling in spring 2018 and 2019, the results of which indicated we could improve our ability to detectthese early life stages of Delta Smelt by using surface tows. This is potentially because densities nearthe surface are higher than densities at depth. In an attempt to standardize abundance estimates basedon surface tows with estimates from previous years based on oblique tows we have used an adjustmentfactor. A derivation of the adjustment factor is included at the end of this document.
Everything presented here is preliminary and subject to correction, revision, and improvement. The fol-lowing points should be taken into consideration when interpreting the results:
1. An oblique tow method was used during Phase 2 in 2017, 2018, and 2019. A surface tow method hasnow been used for Phase 2 since 2020.
2. Delta Smelt captured outside of the live box or cod end of the net could not be assigned to a specifictow and were excluded from this analysis. These fish are included in the daily catch summary andare indicated by a Gear Condition Code of 9. Delta Smelt captured in highly impaired samples,e.g., samples with large net blockages of debris or vegetation, were also excluded from this analysis.These fish are included in the daily catch summary and are indicated by a Gear Condition Code of 3.
3. The Week designations used here were defined out of convenience and are subject to change.
4. Current sampling is limited to areas of the Bay-Delta that can be safely navigated by the boats, whichmeans areas with a minimum depth of approximately 8 feet. The abundance estimation method usedhere assumes that the density of fish in unsampled areas (i.e., those with depth less than 8 feet) isthe same as in sampled areas (i.e., those with depth greater than or equal to 8 feet).
5. The methods of analysis used here remain in development.
1

DRAFT 2
Change Log
Report date May 7, 2021:
• On April 27, 20201, EDSM caught 2 Delta Smelt in the Sac DW Ship Channel stratum. Their forklengths were 25.5 and 56 mm. According to an age-length key developed by the California Depart-ment of Fish and Wildlife, the smaller fish is age-0, meaning it was born in the same calendar yearin which it was caught, while the larger individual is age-1, meaning it was born in a year prior tothe year in which it was caught (see Appendix A of Mitchell et al. [2019] for the age-length key).During Phase 2, this implies that the smaller fish is in the postlarval/juvenile life stage while thelarger individual is in the adult life stage.
As a result, this report has been updated to show separate abundance estimates for postlarval/juvenileand adult life stages each week. We assume adults are uniformly distributed between 0.5- and 4.5-mdepth and we account for the overlap of the 20mm net with this depth stratum during sampling. Thisis similar to the approach used by Polansky et al. [2019] for adult Delta Smelt caught in the SpringKodiak Trawl Survey. Habitat volume estimates used to calculate abundance estimates are shown inTable 2 for the postlarval/juvenile life stage and Table 3 for the adult life stage.
Report date June 10, 2021:
• Corrections were made to data collected the week of May 24-27 as a result of on-going QA/QC.Sampling the week of June 1 was limited due to boat issues.
DRAFT 3
Results
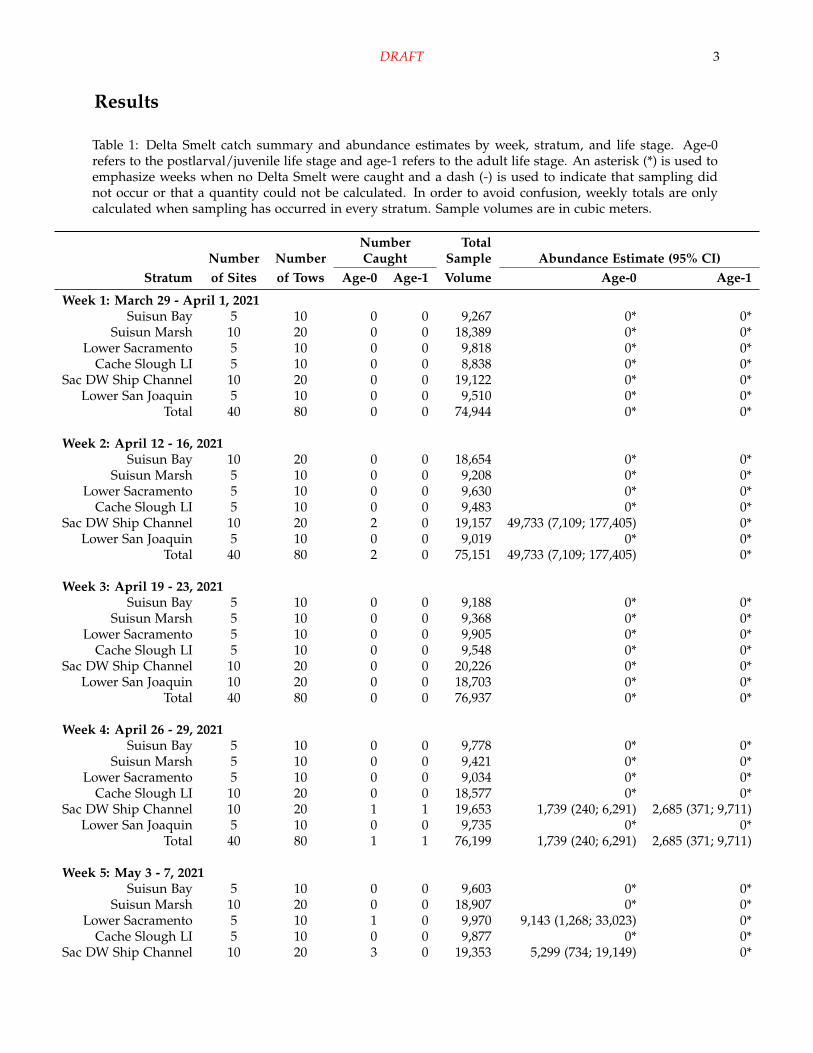
Table 1: Delta Smelt catch summary and abundance estimates by week, stratum, and life stage. Age-0refers to the postlarval/juvenile life stage and age-1 refers to the adult life stage. An asterisk (*) is used toemphasize weeks when no Delta Smelt were caught and a dash (-) is used to indicate that sampling didnot occur or that a quantity could not be calculated. In order to avoid confusion, weekly totals are onlycalculated when sampling has occurred in every stratum. Sample volumes are in cubic meters.
Number TotalNumber Number Caught Sample Abundance Estimate (95% CI)
Stratum of Sites of Tows Age-0 Age-1 Volume Age-0 Age-1
Week 1: March 29 - April 1, 2021Suisun Bay 5 10 0 0 9,267 0* 0*
Suisun Marsh 10 20 0 0 18,389 0* 0*Lower Sacramento 5 10 0 0 9,818 0* 0*
Cache Slough LI 5 10 0 0 8,838 0* 0*Sac DW Ship Channel 10 20 0 0 19,122 0* 0*
Lower San Joaquin 5 10 0 0 9,510 0* 0*Total 40 80 0 0 74,944 0* 0*
Week 2: April 12 - 16, 2021Suisun Bay 10 20 0 0 18,654 0* 0*
Suisun Marsh 5 10 0 0 9,208 0* 0*Lower Sacramento 5 10 0 0 9,630 0* 0*
Cache Slough LI 5 10 0 0 9,483 0* 0*Sac DW Ship Channel 10 20 2 0 19,157 49,733 (7,109; 177,405) 0*
Lower San Joaquin 5 10 0 0 9,019 0* 0*Total 40 80 2 0 75,151 49,733 (7,109; 177,405) 0*
Week 3: April 19 - 23, 2021Suisun Bay 5 10 0 0 9,188 0* 0*
Suisun Marsh 5 10 0 0 9,368 0* 0*Lower Sacramento 5 10 0 0 9,905 0* 0*
Cache Slough LI 5 10 0 0 9,548 0* 0*Sac DW Ship Channel 10 20 0 0 20,226 0* 0*
Lower San Joaquin 10 20 0 0 18,703 0* 0*Total 40 80 0 0 76,937 0* 0*
Week 4: April 26 - 29, 2021Suisun Bay 5 10 0 0 9,778 0* 0*
Suisun Marsh 5 10 0 0 9,421 0* 0*Lower Sacramento 5 10 0 0 9,034 0* 0*
Cache Slough LI 10 20 0 0 18,577 0* 0*Sac DW Ship Channel 10 20 1 1 19,653 1,739 (240; 6,291) 2,685 (371; 9,711)
Lower San Joaquin 5 10 0 0 9,735 0* 0*Total 40 80 1 1 76,199 1,739 (240; 6,291) 2,685 (371; 9,711)
Week 5: May 3 - 7, 2021Suisun Bay 5 10 0 0 9,603 0* 0*
Suisun Marsh 10 20 0 0 18,907 0* 0*Lower Sacramento 5 10 1 0 9,970 9,143 (1,268; 33,023) 0*
Cache Slough LI 5 10 0 0 9,877 0* 0*Sac DW Ship Channel 10 20 3 0 19,353 5,299 (734; 19,149) 0*

DRAFT 4
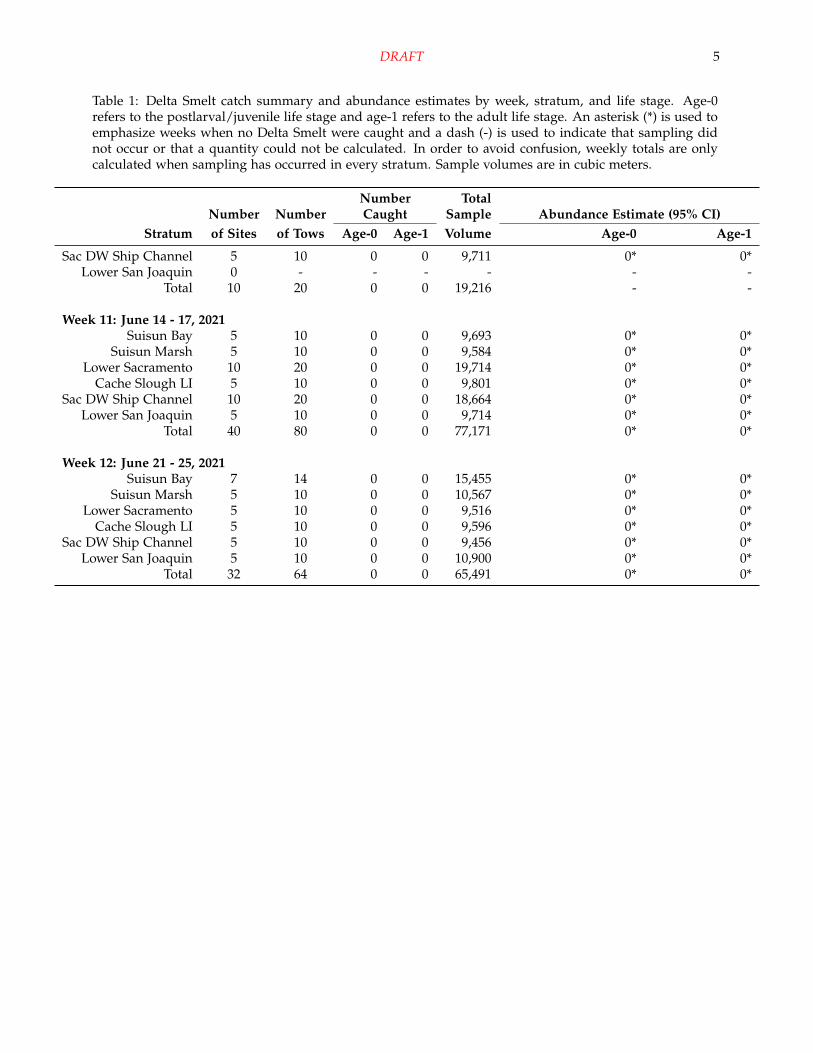
Table 1: Delta Smelt catch summary and abundance estimates by week, stratum, and life stage. Age-0refers to the postlarval/juvenile life stage and age-1 refers to the adult life stage. An asterisk (*) is used toemphasize weeks when no Delta Smelt were caught and a dash (-) is used to indicate that sampling didnot occur or that a quantity could not be calculated. In order to avoid confusion, weekly totals are onlycalculated when sampling has occurred in every stratum. Sample volumes are in cubic meters.
Number TotalNumber Number Caught Sample Abundance Estimate (95% CI)
Stratum of Sites of Tows Age-0 Age-1 Volume Age-0 Age-1
Lower San Joaquin 5 10 0 0 9,460 0* 0*Total 40 80 4 0 77,170 14,442 (3,235; 42,027) 0*
Week 6: May 10 - 13, 2021Suisun Bay 5 10 0 0 9,624 0* 0*
Suisun Marsh 5 10 0 0 10,009 0* 0*Lower Sacramento 5 10 0 0 10,515 0* 0*
Cache Slough LI 5 10 0 0 9,914 0* 0*Sac DW Ship Channel 9 18 0 0 17,590 0* 0*
Lower San Joaquin 5 10 0 0 9,418 0* 0*Total 34 68 0 0 67,069 0* 0*
Week 7: May 17 - 21, 2021Suisun Bay 8 16 0 0 16,122 0* 0*
Suisun Marsh 5 10 0 0 10,177 0* 0*Lower Sacramento 3 6 0 0 6,166 0* 0*
Cache Slough LI 3 6 0 0 6,238 0* 0*Sac DW Ship Channel 3 6 0 0 5,707 0* 0*
Lower San Joaquin 4 7 0 0 6,096 0* 0*Total 26 51 0 0 50,506 0* 0*
Week 8: May 24 - 27, 2021Suisun Bay 5 10 0 0 10,992 0* 0*
Suisun Marsh 5 10 0 0 11,062 0* 0*Lower Sacramento 4 8 0 0 7,975 0* 0*
Cache Slough LI 5 10 0 0 10,165 0* 0*Sac DW Ship Channel 10 20 0 0 20,311 0* 0*
Lower San Joaquin 10 20 0 0 20,180 0* 0*Total 39 78 0 0 80,685 0* 0*
Week 9: June 1 - 4, 2021Suisun Bay 5 10 0 0 10,359 0* 0*
Suisun Marsh 0 - - - - - -Lower Sacramento 0 - - - - - -
Cache Slough LI 0 - - - - - -Sac DW Ship Channel 0 - - - - - -
Lower San Joaquin 3 6 0 0 6,041 0* 0*Total 8 16 0 0 16,400 - -
Week 10: June 10 - 11, 2021Suisun Bay 0 - - - - - -
Suisun Marsh 0 - - - - - -Lower Sacramento 5 10 0 0 9,504 0* 0*
Cache Slough LI 0 - - - - - -
DRAFT 5
Table 1: Delta Smelt catch summary and abundance estimates by week, stratum, and life stage. Age-0refers to the postlarval/juvenile life stage and age-1 refers to the adult life stage. An asterisk (*) is used toemphasize weeks when no Delta Smelt were caught and a dash (-) is used to indicate that sampling didnot occur or that a quantity could not be calculated. In order to avoid confusion, weekly totals are onlycalculated when sampling has occurred in every stratum. Sample volumes are in cubic meters.
Number TotalNumber Number Caught Sample Abundance Estimate (95% CI)
Stratum of Sites of Tows Age-0 Age-1 Volume Age-0 Age-1
Sac DW Ship Channel 5 10 0 0 9,711 0* 0*Lower San Joaquin 0 - - - - - -
Total 10 20 0 0 19,216 - -
Week 11: June 14 - 17, 2021Suisun Bay 5 10 0 0 9,693 0* 0*
Suisun Marsh 5 10 0 0 9,584 0* 0*Lower Sacramento 10 20 0 0 19,714 0* 0*
Cache Slough LI 5 10 0 0 9,801 0* 0*Sac DW Ship Channel 10 20 0 0 18,664 0* 0*
Lower San Joaquin 5 10 0 0 9,714 0* 0*Total 40 80 0 0 77,171 0* 0*
Week 12: June 21 - 25, 2021Suisun Bay 7 14 0 0 15,455 0* 0*
Suisun Marsh 5 10 0 0 10,567 0* 0*Lower Sacramento 5 10 0 0 9,516 0* 0*
Cache Slough LI 5 10 0 0 9,596 0* 0*Sac DW Ship Channel 5 10 0 0 9,456 0* 0*
Lower San Joaquin 5 10 0 0 10,900 0* 0*Total 32 64 0 0 65,491 0* 0*

DRAFT 6
050
100
150
Abu
ndan
ce E
stim
ate
and
95%
CI
(tho
usan
ds o
f fis
h)
1 2 3(Mar 29 −
Apr 1, 2021)(Apr 12 −
Apr 16, 2021)(Apr 19 −
Apr 23, 2021)
Week
Stratum
Suisun BaySuisun MarshLower SacramentoCache Slough LISac DW Ship ChannelLower San Joaquin
Life Stage
Postlarval/juvenileAdult
Delta Smelt Abundance Estimates Over Time
050
100
150
Abu
ndan
ce E
stim
ate
and
95%
CI
(tho
usan
ds o
f fis
h)
4 5 6(Apr 26 −
Apr 29, 2021)(May 3 −
May 7, 2021)(May 10 −
May 13, 2021)
Week
Stratum
Suisun BaySuisun MarshLower SacramentoCache Slough LISac DW Ship ChannelLower San Joaquin
Life Stage
Postlarval/juvenileAdult

DRAFT 7
050
100
150
Abu
ndan
ce E
stim
ate
and
95%
CI
(tho
usan
ds o
f fis
h)
7 8 9(May 17 −
May 21, 2021)(May 24 −
May 27, 2021)(Jun 1 −
Jun 4, 2021)
Week
Stratum
Suisun BaySuisun MarshLower SacramentoCache Slough LISac DW Ship ChannelLower San Joaquin
Life Stage
Postlarval/juvenileAdult
050
100
150
Abu
ndan
ce E
stim
ate
and
95%
CI
(tho
usan
ds o
f fis
h)
10 11 12(Jun 10 −
Jun 11, 2021)(Jun 14 −
Jun 17, 2021)(Jun 21 −
Jun 25, 2021)
Week
Stratum
Suisun BaySuisun MarshLower SacramentoCache Slough LISac DW Ship ChannelLower San Joaquin
Life Stage
Postlarval/juvenileAdult

DRAFT 8
Total Catch
0
Delta Smelt Total Catch by Site
Week 1 (March 29 − April 1, 2021)
Suisun BaySuisun MarshLower SacramentoCache Slough LISac DW Ship ChannelLower San Joaquin
Total Catch
0
1
Delta Smelt Total Catch by Site
Week 2 (April 12 − 16, 2021)
Suisun BaySuisun MarshLower SacramentoCache Slough LISac DW Ship ChannelLower San Joaquin

DRAFT 9
Total Catch
0
Delta Smelt Total Catch by Site
Week 3 (April 19 − 23, 2021)
Suisun BaySuisun MarshLower SacramentoCache Slough LISac DW Ship ChannelLower San Joaquin
Total Catch
0
2
Delta Smelt Total Catch by Site
Week 4 (April 26 − 29, 2021)
Suisun BaySuisun MarshLower SacramentoCache Slough LISac DW Ship ChannelLower San Joaquin
DRAFT 10
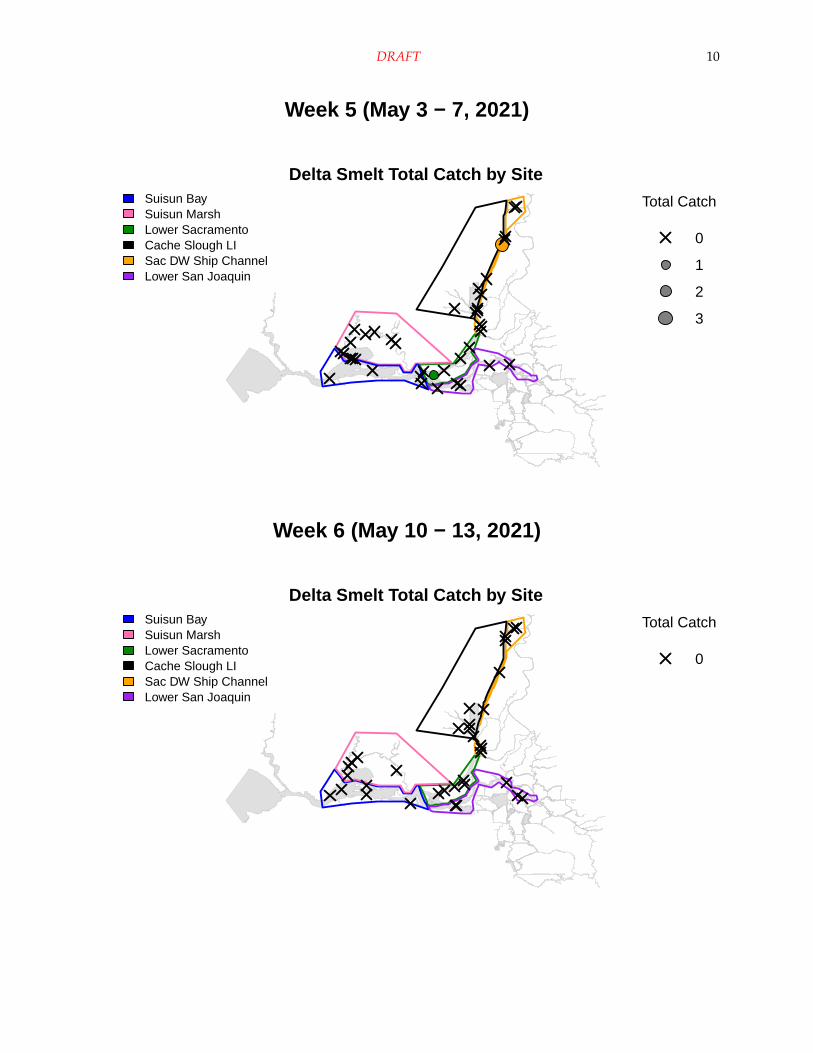
Total Catch
0
1
2
3
Delta Smelt Total Catch by Site
Week 5 (May 3 − 7, 2021)
Suisun BaySuisun MarshLower SacramentoCache Slough LISac DW Ship ChannelLower San Joaquin
Total Catch
0
Delta Smelt Total Catch by Site
Week 6 (May 10 − 13, 2021)
Suisun BaySuisun MarshLower SacramentoCache Slough LISac DW Ship ChannelLower San Joaquin

DRAFT 11
Total Catch
0
Delta Smelt Total Catch by Site
Week 7 (May 17 − 21, 2021)
Suisun BaySuisun MarshLower SacramentoCache Slough LISac DW Ship ChannelLower San Joaquin
Total Catch
0
Delta Smelt Total Catch by Site
Week 8 (May 24 − 27, 2021)
Suisun BaySuisun MarshLower SacramentoCache Slough LISac DW Ship ChannelLower San Joaquin

DRAFT 12
Total Catch
0
Delta Smelt Total Catch by Site
Week 9 (June 1 − 4, 2021)
Suisun BaySuisun MarshLower SacramentoCache Slough LISac DW Ship ChannelLower San Joaquin
Total Catch
0
Delta Smelt Total Catch by Site
Week 10 (June 10 − 11, 2021)
Suisun BaySuisun MarshLower SacramentoCache Slough LISac DW Ship ChannelLower San Joaquin

DRAFT 13
Total Catch
0
Delta Smelt Total Catch by Site
Week 11 (June 14 − 17, 2021)
Suisun BaySuisun MarshLower SacramentoCache Slough LISac DW Ship ChannelLower San Joaquin
Total Catch
0
Delta Smelt Total Catch by Site
Week 12 (June 21 − 25, 2021)
Suisun BaySuisun MarshLower SacramentoCache Slough LISac DW Ship ChannelLower San Joaquin
DRAFT 14
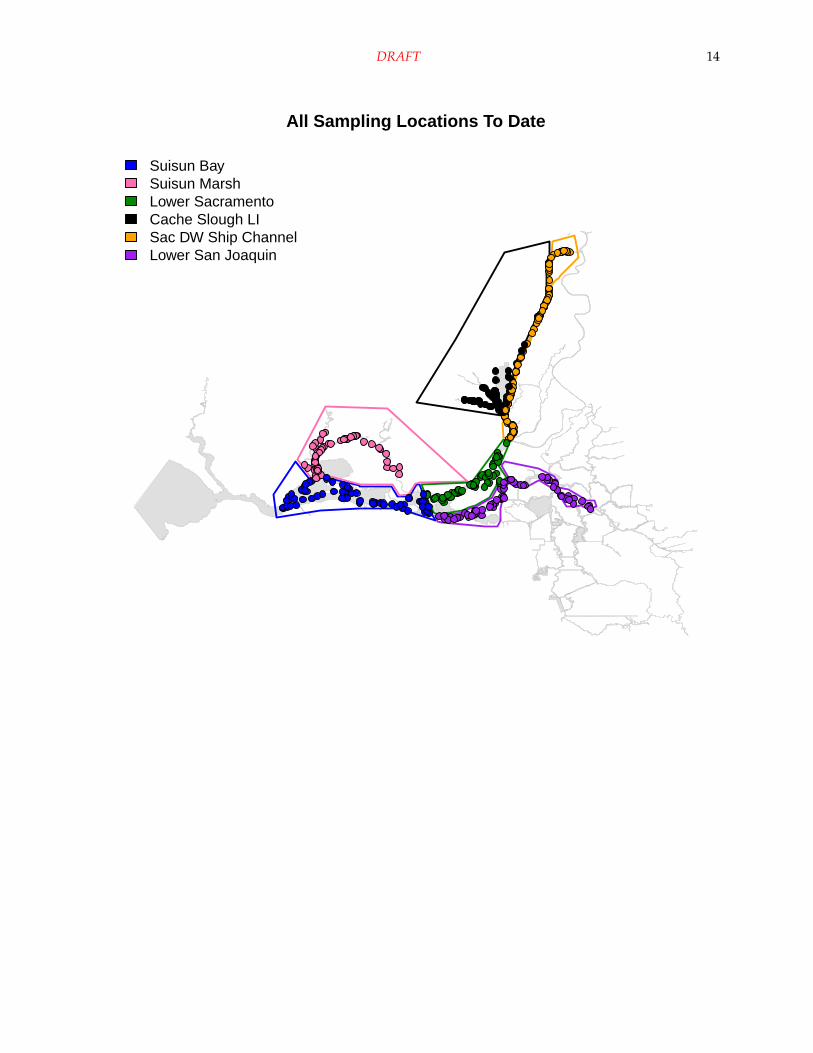
All Sampling Locations To Date
Suisun BaySuisun MarshLower SacramentoCache Slough LISac DW Ship ChannelLower San Joaquin

DRAFT 15
Habitat Volume Estimates
Table 2: Estimates of water volume(cubic meters) between 0 and 10-mdepth, by stratum.
Stratum Volume
Cache Slough LI 52,180,503Lower Sacramento 171,562,419Lower San Joaquin 232,126,861Sac DW Ship Channel 64,336,104Suisun Bay 531,809,657Suisun Marsh 106,744,669
Table 3: Estimates of water volume(cubic meters) between 0.5-m and 4.5-m depth, by stratum.
Stratum Volume
Cache Slough LI 33,420,492Lower Sacramento 88,162,170Lower San Joaquin 122,096,565Sac DW Ship Channel 30,411,491Suisun Bay 285,840,678Suisun Marsh 76,278,718
References
L. Mitchell, K. Newman, and R. Baxter. Estimating the size selectivity of fishing trawls for a short-lived fishspecies. San Francisco Estuary and Watershed Science, 17(1), 2019. URL http://dx.doi.org/10.15447/
sfews.2019v17iss1art5.
L. Polansky, L. Mitchell, and K. B. Newman. Using multistage design-based methods to construct abun-dance indices and uncertainty measures for Delta Smelt. Transactions of the American Fisheries Society, 148(4):710–724, 2019. URL https://doi.org/10.1002/tafs.10166.
D. L. Stevens and A. R. Olsen. Spatially balanced sampling of natural resources. Journal of the AmericanStatistical Association, 99(465):262 – 278, 2004. URL https://doi.org/10.1198/016214504000000250.
DRAFT 16
Appendix
Derivation of a density gradient adjustment factor to standardize Delta Smelt density estimates based on 20
mm surface tows:
During experimental larval sampling by EDSM staff in spring 2018 and spring 2019, surface tows with a 20 mm
trawl generally produced higher catch‐per‐unit‐effort (CPUE) of Delta Smelt than oblique or midwater tows. These
differences in CPUE are likely caused by fish densities being higher at the surface than at depth, though other
alternative or complementary explanations are possible. For example, it may be easier for post‐larval and juvenile
Delta Smelt to passively or actively evade the net during midwater and oblique tows than during surface tows.
Starting in 2020, Phase 2 switched from using oblique tows to using surface tows in an effort to increase its overall
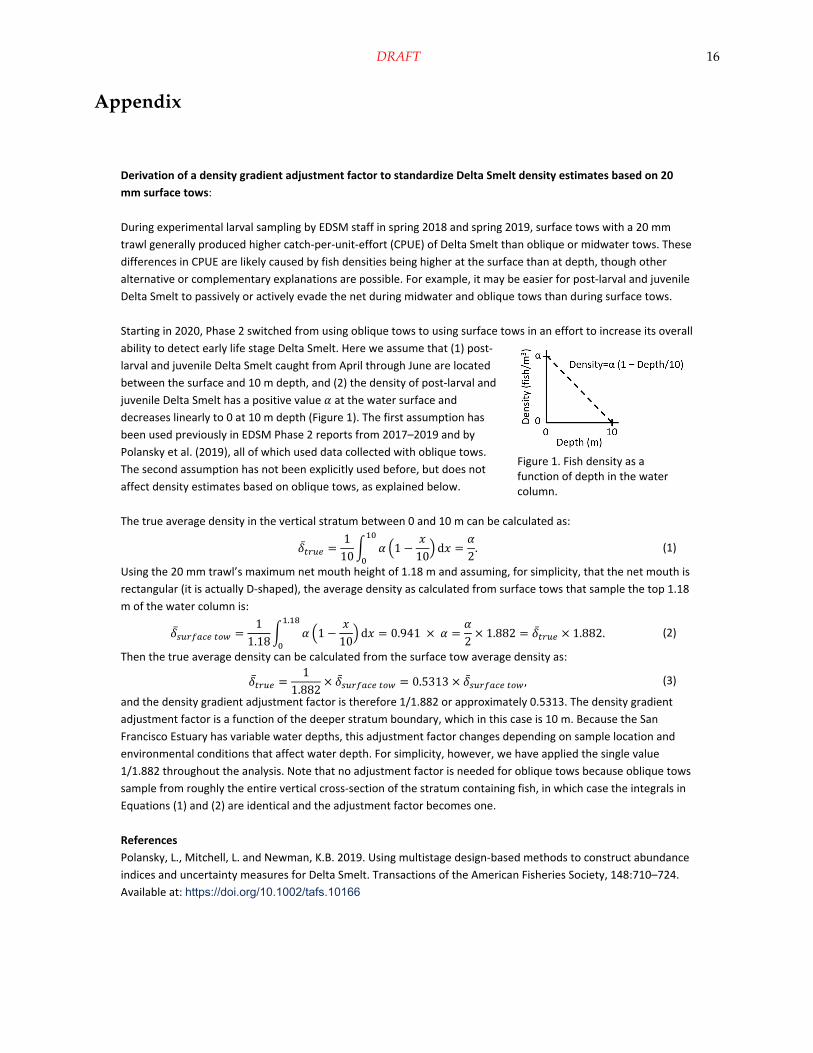
ability to detect early life stage Delta Smelt. Here we assume that (1) post‐
larval and juvenile Delta Smelt caught from April through June are located
between the surface and 10 m depth, and (2) the density of post‐larval and
juvenile Delta Smelt has a positive value 𝛼 at the water surface and decreases linearly to 0 at 10 m depth (Figure 1). The first assumption has
been used previously in EDSM Phase 2 reports from 2017–2019 and by
Polansky et al. (2019), all of which used data collected with oblique tows.
The second assumption has not been explicitly used before, but does not
affect density estimates based on oblique tows, as explained below.
The true average density in the vertical stratum between 0 and 10 m can be calculated as:
𝛿̅1
10𝛼 1
𝑥10
d𝑥𝛼2
. (1)
Using the 20 mm trawl’s maximum net mouth height of 1.18 m and assuming, for simplicity, that the net mouth is
rectangular (it is actually D‐shaped), the average density as calculated from surface tows that sample the top 1.18
m of the water column is:
𝛿̅ 1
1.18𝛼 1
𝑥10
d𝑥.
0.941 𝛼𝛼2
1.882 𝛿̅ 1.882. (2)
Then the true average density can be calculated from the surface tow average density as:
𝛿̅1
1.882𝛿̅ 0.5313 𝛿̅ , (3)
and the density gradient adjustment factor is therefore 1/1.882 or approximately 0.5313. The density gradient
adjustment factor is a function of the deeper stratum boundary, which in this case is 10 m. Because the San
Francisco Estuary has variable water depths, this adjustment factor changes depending on sample location and
environmental conditions that affect water depth. For simplicity, however, we have applied the single value
1/1.882 throughout the analysis. Note that no adjustment factor is needed for oblique tows because oblique tows
sample from roughly the entire vertical cross‐section of the stratum containing fish, in which case the integrals in
Equations (1) and (2) are identical and the adjustment factor becomes one.
References
Polansky, L., Mitchell, L. and Newman, K.B. 2019. Using multistage design‐based methods to construct abundance
indices and uncertainty measures for Delta Smelt. Transactions of the American Fisheries Society, 148:710–724.
Available at: https://doi.org/10.1002/tafs.10166
Figure 1. Fish density as a function of depth in the water column.