2021 q2 en-10q - metro inc
TRANSCRIPT

INTERIM REPORT
12-week period ended March 13, 2021
2nd Quarter 2021
HIGHLIGHTS
2021 SECOND QUARTER
n Sales of $4,193.0 million, up 5.1%n Food same-store sales up 5.5%, and up 10.1% for the first 10 weeks of the quarter n Pharmacy same-store sales down 0.8%n Net earnings of $188.1 million, up 6.8% and adjusted net earnings(1) of $194.7 million,
up 6.5%n Fully diluted net earnings per share of $0.75, up 8.7%, and adjusted fully diluted net
earnings per share(1) of $0.78, up 8.3%n Expenses related to COVID-19 totalling $29 million, including $8 million of gift cards
to front-line employees
REPORT TO SHAREHOLDERS
Dear Shareholders,
I am pleased to present our interim report for the second quarter of Fiscal 2021 ended March 13, 2021.
Sales in the second quarter of Fiscal 2021 reached $4,193.0 million, up 5.1% compared to $3,988.9 million in the second quarter of 2020. Food same-store sales were up 5.5% (9.7% in 2020) and were up 10.1% for the first 10 weeks of the quarter as we experienced an unprecedented surge in sales in the last two weeks of the second quarter last year due to the pandemic. Online food sales increased by about 240% versus last year. Our food basket inflation was approximately 2.0% (2.0% in 2020). Pharmacy same-store sales were down 0.8% (up 7.9% in 2020), with a 4.2% increase in prescription drugs and a 10.5% decrease in front-store sales. This decrease is mainly due to restrictions on sales of non-essential products in Quebec for a period of six weeks during the quarter, the milder cold and flu season, and the pandemic-related increase in sales experienced at the end of the second quarter last year.
Second quarter net earnings were $188.1 million in Fiscal 2021 compared with $176.2 million in 2020, and fully diluted net earnings per share were $0.75 compared with $0.69 in 2020, up 6.8% and 8.7%, respectively. Taking into account adjustments for the 2021 and 2020 second quarters, the amortization of intangible assets acquired in connection with the Jean Coutu Group acquisition, adjusted net earnings(1) for the second quarter of Fiscal 2021 totalled $194.7 million compared with $182.8 million in 2020, and adjusted fully diluted net earnings per share(1) amounted to $0.78 versus $0.72, up 6.5% and 8.3%, respectively.
On April 20, 2021, the Board of Directors declared a quarterly dividend of $0.25 per share, the same amount declared last quarter.
We delivered strong sales and earnings growth in our second quarter. More than one year into the pandemic crisis, our teams continue to show extraordinary resilience to safely serve our communities while executing well on our strategic priorities of operational excellence, supply chain modernization and digital acceleration. Our affiliated pharmacists have begun to administer vaccines and we look forward to increasing the pace as soon as more vaccine supply becomes available in the coming weeks. As we are currently cycling the peak sales of the start of the pandemic last year, we are confident that our sales volume will remain elevated compared to pre-pandemic levels and we are well positioned to continue to deliver value to our customers and shareholders.
Eric La FlèchePresident and Chief Executive Officer
April 21, 2021
(1) See table on "Net earnings adjustments" and section on "Non-IFRS Measurements"(2) See table on "Operating income before depreciation and amortization adjustments" and section on "Non-IFRS Measurements"(3) See section on "Forward-looking Information"
- 2 -

MANAGEMENT'S DISCUSSION AND ANALYSISThe following Management's Discussion and Analysis (MD&A) sets out the financial position and consolidated results of METRO INC. on March 13, 2021 and for the 12 and 24-week periods then ended. It should be read in conjunction with the unaudited interim condensed consolidated financial statements and accompanying notes in this interim report.
The unaudited interim condensed consolidated financial statements for the 12 and 24-week periods ended March 13, 2021 have been prepared by management in accordance with IAS 34 Interim Financial Reporting. They should be read in conjunction with the audited annual consolidated financial statements and accompanying notes and the MD&A presented in the Corporation's 2020 Annual Report. Unless otherwise stated, the interim report is based on information as at April 2, 2021.
Additional information, including the Certification of Interim Filings for the quarter ended March 13, 2021 signed by the President and Chief Executive Officer and the Executive Vice-President, Chief Financial Officer and Treasurer, will also be available on the SEDAR website at: www.sedar.com.
OPERATING RESULTS
SALES
Sales in the second quarter of Fiscal 2021 reached $4,193.0 million, up 5.1% compared to $3,988.9 million in the second quarter of 2020. Food same-store sales were up 5.5% (9.7% in 2020) and were up 10.1% for the first 10 weeks of the quarter as we experienced an unprecedented surge in sales in the last two weeks of the second quarter last year due to the pandemic. Online food sales increased by about 240% versus last year. Our food basket inflation was approximately 2.0% (2.0% in 2020). Pharmacy same-store sales were down 0.8% (up 7.9% in 2020), with a 4.2% increase in prescription drugs and a 10.5% decrease in front-store sales. This decrease is mainly due to restrictions on sales of non-essential products in Quebec for a period of six weeks during the quarter, the milder cold and flu season, and the pandemic-related increase in sales experienced at the end of the second quarter last year.
Sales in the first 24 weeks of Fiscal 2021 totalled $8,471.2 million, up 5.6% compared to $8,018.7 million for the corresponding period of 2020.
OPERATING INCOME BEFORE DEPRECIATION AND AMORTIZATION
This earnings measurement excludes financial costs, taxes, depreciation and amortization.
Operating income before depreciation and amortization for the second quarter of Fiscal 2021 totalled $396.1 million, or 9.4% of sales, up 5.9% versus the corresponding quarter of last year.
Operating income before depreciation and amortization for the first 24 weeks of Fiscal 2021 totalled $795.3 million or 9.4% of sales, up 7.9% versus the corresponding period of 2020. During the first 24 weeks of Fiscal 2020, we recognized a loss of $7.5 million on disposal of our subsidiary MissFresh. Excluding this item, adjusted operating income before depreciation and amortization(2) for the first 24 weeks of Fiscal 2021 increased by 6.8% versus the corresponding period of 2020.
Operating income before depreciation and amortization adjustments (OI)(2)
24 weeks / Fiscal Year2021 2020
(Millions of dollars, unless otherwise indicated) OI Sales (%) OI Sales (%)
Operating income before depreciation and amortization 795.3 8,471.2 9.4 737.2 8,018.7 9.2
Loss on disposal of a subsidiary — 7.5 Adjusted operating income before depreciation
and amortization(2) 795.3 8,471.2 9.4 744.7 8,018.7 9.3
(1) See table on "Net earnings adjustments" and section on "Non-IFRS Measurements"(2) See table on "Operating income before depreciation and amortization adjustments" and section on "Non-IFRS Measurements"(3) See section on "Forward-looking Information"
- 3 -

Gross margin on sales for the second quarter and the first 24 weeks of Fiscal 2021 were 20.2% and 19.9% respectively, versus 19.7% for the corresponding periods of 2020.
Operating expenses as a percentage of sales for the second quarter of Fiscal 2021 were 10.7% versus 10.3% for the corresponding quarter of 2020. The last two weeks of the second quarter of 2020 experienced a surge in sales due to the pandemic with no incremental COVID-19 related expenses. The costs related to COVID-19 for the second quarter of Fiscal 2021 were approximately $29 million, including $8 million of gift cards to front-line employees.
For the first 24 weeks of Fiscal 2021, operating expenses as a percentage of sales were 10.5% versus 10.5% (10.4% excluding the loss on disposal of our subsidiary MissFresh) for the corresponding period of 2020. The costs related to COVID-19 for the first 24 weeks of Fiscal 2021 were approximately $57 million, including $16 million of gift cards to front-line employees.
DEPRECIATION AND AMORTIZATION AND NET FINANCIAL COSTS
Total depreciation and amortization expense for the second quarter of Fiscal 2021 was $110.8 million versus $102.0 million for the corresponding quarter of 2020. The increase reflects the additional investments in supply chain and logistics as well as in-store technology. For the first 24 weeks of Fiscal 2021, total depreciation and amortization expense was $218.1 million versus $203.5 million for the corresponding period of 2020.
Net financial costs for the second quarter of Fiscal 2021 were $31.3 million compared with $31.9 million for the corresponding quarter of 2020. For the first 24 weeks of Fiscal 2021, net financial costs were $62.7 million compared with $63.0 million for the corresponding period of 2020.
INCOME TAXES
The income tax expense of $65.9 million for the second quarter of Fiscal 2021 represented an effective tax rate of 25.9% compared with an income tax expense of $64.0 million in the second quarter of Fiscal 2020 which represented an effective tax rate of 26.6%. The 24-week period income tax expense of $135.2 million for Fiscal 2021 and $124.3 million for Fiscal 2020 represented an effective tax rate of 26.3% and 26.4% respectively.
NET EARNINGS AND ADJUSTED NET EARNINGS(1)
Net earnings for the second quarter of Fiscal 2021 were $188.1 million compared with $176.2 million for the corresponding quarter of 2020, while fully diluted net earnings per share were $0.75 compared with $0.69 in 2020, up 6.8% and 8.7%, respectively. Excluding the specific items shown in the table below, adjusted net earnings(1) for the second quarter of Fiscal 2021 totalled $194.7 million compared with $182.8 million for the corresponding quarter of 2020, and adjusted fully diluted net earnings per share(1) amounted to $0.78 versus $0.72, up 6.5% and 8.3%, respectively. Net earnings in the second quarter of 2020 were favorably impacted by a surge in sales due to the pandemic with no incremental COVID-19 related expenses.
Net earnings for the first 24 weeks of Fiscal 2021 were $379.3 million compared with $346.4 million for the corresponding period of 2020, while fully diluted net earnings per share were $1.51 compared with $1.36 in 2020, up 9.5% and 11.0%, respectively. Excluding the specific items shown in the table below, adjusted net earnings(1) for the first 24 weeks of Fiscal 2021 totalled $392.4 million compared with $363.7 million for the corresponding period of 2020, and adjusted fully diluted net earnings per share(1) amounted to $1.57 versus $1.43, up 7.9% and 9.8%, respectively. The impact of the labour conflict at the Jean Coutu distribution center in the first quarter of Fiscal 2021, was approximately $0.05 per share.
(1) See table on "Net earnings adjustments" and section on "Non-IFRS Measurements"(2) See table on "Operating income before depreciation and amortization adjustments" and section on "Non-IFRS Measurements"(3) See section on "Forward-looking Information"
- 4 -

Net earnings adjustments(1)
12 weeks / Fiscal Year2021 2020 Change (%)
(Millions of dollars)
Fully diluted EPS
(Dollars)(Millions of
dollars)
Fully diluted EPS
(Dollars)Net
earnings
Fully diluted
EPS
Net earnings 188.1 0.75 176.2 0.69 6.8 8.7 Amortization of intangible assets acquired in
connection with the Jean Coutu Group acquisition, after taxes 6.6 6.6
Adjusted net earnings(1) 194.7 0.78 182.8 0.72 6.5 8.3
24 weeks / Fiscal Year2021 2020 Change (%)
(Millions of dollars)
Fully diluted EPS
(Dollars)(Millions of
dollars)
Fully diluted EPS
(Dollars)Net
earnings
Fully diluted
EPS
Net earnings 379.3 1.51 346.4 1.36 9.5 11.0 Loss on disposal of a subsidiary, after taxes — 4.2 Amortization of intangible assets acquired in
connection with the Jean Coutu Group acquisition, after taxes 13.1 13.1
Adjusted net earnings(1) 392.4 1.57 363.7 1.43 7.9 9.8
(1) See table on "Net earnings adjustments" and section on "Non-IFRS Measurements"(2) See table on "Operating income before depreciation and amortization adjustments" and section on "Non-IFRS Measurements"(3) See section on "Forward-looking Information"
- 5 -

QUARTERLY HIGHLIGHTS
(Millions of dollars, unless otherwise indicated) 2021 2020 2019 Change (%)
SalesQ2(4) 4,193.0 3,988.9 5.1 Q1(4) 4,278.2 4,029.8 6.2 Q4(4) 4,143.6 3,858.9 7.4 Q3(5) 5,835.2 5,229.3 11.6 Net earningsQ2(4) 188.1 176.2 6.8 Q1(4) 191.2 170.2 12.3 Q4(4) 186.5 167.4 11.4 Q3(5) 263.5 222.4 18.5 Adjusted net earnings(1)
Q2(4) 194.7 182.8 6.5 Q1(4) 197.7 180.9 9.3 Q4(4) 193.1 174.0 11.0 Q3(5) 272.3 230.3 18.2
Fully diluted net earnings per share (Dollars)Q2(4) 0.75 0.69 8.7 Q1(4) 0.76 0.67 13.4 Q4(4) 0.74 0.66 12.1 Q3(5) 1.04 0.86 20.9 Adjusted fully diluted net earnings per share(1) (Dollars)Q2(4) 0.78 0.72 8.3 Q1(4) 0.79 0.71 11.3 Q4(4) 0.77 0.68 13.2 Q3(5) 1.08 0.90 20.0
(4) 12 weeks(5) 16 weeks
Sales in the second quarter of Fiscal 2021 reached $4,193.0 million, up 5.1% compared to $3,988.9 million in the second quarter of 2020. Food same-store sales were up 5.5% (9.7% in 2020) and were up 10.1% for the first 10 weeks of the quarter as we experienced an unprecedented surge in sales in the last two weeks of the second quarter last year due to the pandemic. Online food sales increased by about 240% versus last year. Our food basket inflation was approximately 2.0% (2.0% in 2020). Pharmacy same-store sales were down 0.8% (up 7.9% in 2020), with a 4.2% increase in prescription drugs and a 10.5% decrease in front-store sales. This decrease is mainly due to restrictions on sales of non-essential products in Quebec for a period of six weeks during the quarter, the milder cold and flu season, and the pandemic-related increase in sales experienced at the end of the second quarter last year.
Sales in the first quarter of Fiscal 2021 reached $4,278.2 million, up 6.2% compared to $4,029.8 million in the first quarter of Fiscal 2020. Food same-store sales were up 10.0% (1.4% in 2020). Online food sales increased by about 170% versus last year. Our food basket inflation was approximately 2.5% (2.0% in 2020). Pharmacy same-store sales were up 1.3% (3.6% in 2020), with a 4.0% increase in prescription drugs and a 3.8% decrease in front-store sales, mainly due to lower traffic, the milder cold and flu season, and reduced promotional activity during the labour conflict. Our warehouse sales to franchisees were impacted by the labour conflict at our Jean Coutu distribution center which had a dampening effect on the total sales increase of the Corporation.
(1) See table on "Net earnings adjustments" and section on "Non-IFRS Measurements"(2) See table on "Operating income before depreciation and amortization adjustments" and section on "Non-IFRS Measurements"(3) See section on "Forward-looking Information"
- 6 -

Sales in the fourth quarter of Fiscal 2020 reached $4,143.6 million, up 7.4% compared to $3,858.9 million in the fourth quarter of Fiscal 2019. Excluding the impact of IFRS 16 Leases adopted in the first quarter of 2020, sales reached $4,156.1 million, up 7.7%. Food same-store sales were up 10.0% (4.1% in 2019). Online food sales were up 160% versus last year. Our food basket inflation was approximately 2.8% (2.8% in 2019). Pharmacy same-store sales were up 5.5% (3.4% in 2019), with a 5.3% increase in prescription drugs and a 6.0% increase in front-store sales.
Sales in the third quarter of Fiscal 2020 reached $5,835.2 million, up 11.6% compared to $5,229.3 million in the third quarter of Fiscal 2019. Excluding the impact of IFRS 16 Leases adopted in the first quarter of 2020, sales reached $5,851.9 million, up 11.9%. Food same-store sales were up 15.6% (3.1% in 2019). Online food sales almost quadrupled in the quarter from a small base last year. Our food basket inflation was approximately 3.0% (2.5% in 2019). Pharmacy same-store sales were up 1.0% (3.4% in 2019), with a 2.7% increase in prescription drugs and a 2.5% decrease in front-store sales.
Net earnings for the second quarter of Fiscal 2021 were $188.1 million compared with $176.2 million for the second quarter of 2020, while fully diluted net earnings per share were $0.75 compared with $0.69 in 2020, up 6.8% and 8.7%, respectively. Excluding from the second quarter of Fiscals 2021 and 2020 the amortization of intangible assets acquired in connection with the Jean Coutu Group acquisition of $8.9 million as well as income taxes relating to these items, adjusted net earnings(1) for the second quarter of Fiscal 2021 totalled $194.7 million compared with $182.8 million for the corresponding quarter of 2020 and adjusted fully diluted net earnings per share(1) amounted to $0.78 compared with $0.72, up 6.5% and 8.3%, respectively.
Net earnings for the first quarter of Fiscal 2021 were $191.2 million compared with $170.2 million for the first quarter of Fiscal 2020, while fully diluted net earnings per share were $0.76 compared with $0.67 in 2020, up 12.3% and 13.4%, respectively. Excluding from the first quarter of Fiscal 2021 the amortization of intangible assets acquired in connection with the Jean Coutu Group acquisition of $8.9 million and from the first quarter of Fiscal 2020 the $7.5 million loss on disposal of a subsidiary and the amortization of intangible assets acquired in connection with the Jean Coutu Group acquisition of $8.9 million as well as income taxes relating to these items, adjusted net earnings(1) for the first quarter of Fiscal 2021 totalled $197.7 million compared with $180.9 million for the corresponding quarter of 2020 and adjusted fully diluted net earnings per share(1) amounted to $0.79 compared with $0.71, up 9.3% and 11.3%, respectively. The impact of the labour conflict at the Jean Coutu distribution center was approximately $0.05 per share resulting from lower revenues and additional costs incurred to implement our contingency plan.
Net earnings for the fourth quarter of Fiscal 2020 were $186.5 million compared with $167.4 million for the fourth quarter of Fiscal 2019, while fully diluted net earnings per share were $0.74 compared with $0.66 in 2019, up 11.4% and 12.1%, respectively. Excluding from the fourth quarter of Fiscals 2020 and 2019 the amortization of intangible assets acquired in connection with the Jean Coutu Group acquisition of $9.0 million, as well as income taxes relating to these items, adjusted net earnings(1) for the fourth quarter of Fiscal 2020 totalled $193.1 million compared with $174.0 million for the corresponding quarter of 2019 and adjusted fully diluted net earnings per share(1) amounted to $0.77 compared with $0.68, up 11.0% and 13.2%, respectively.
Net earnings for the third quarter of Fiscal 2020 were $263.5 million compared with $222.4 million for the third quarter of Fiscal 2019, while fully diluted net earnings per share were $1.04 compared with $0.86 in 2019, up 18.5% and 20.9%, respectively. Excluding from the third quarter of Fiscal 2020 the amortization of intangible assets acquired in connection with the Jean Coutu Group acquisition of $11.9 million, and excluding from the third quarter of Fiscal 2019 the $1.0 million gain resulting from the selling price adjustment related to the investment in associate Colo-D Inc. and $11.9 million in amortization of intangible assets acquired in connection with the Jean Coutu Group acquisition, as well as income taxes relating to all these items, adjusted net earnings(1) for the third quarter of Fiscal 2020 totalled $272.3 million compared with $230.3 million for the corresponding quarter of 2019 and adjusted fully diluted net earnings per share(1) amounted to $1.08 compared with $0.90, up 18.2% and 20.0%, respectively.
(1) See table on "Net earnings adjustments" and section on "Non-IFRS Measurements"(2) See table on "Operating income before depreciation and amortization adjustments" and section on "Non-IFRS Measurements"(3) See section on "Forward-looking Information"
- 7 -

2021 2020 2019(Millions of dollars) Q2 Q1 Q4 Q3 Q2 Q1 Q4 Q3Net earnings 188.1 191.2 186.5 263.5 176.2 170.2 167.4 222.4 Loss on disposal of a subsidiary, after taxes — — — — — 4.2 — — Amortization of intangible assets acquired in
connection with the Jean Coutu Group acquisition, after taxes 6.6 6.5 6.6 8.8 6.6 6.5 6.6 8.8
Gain on disposal of an investment in an associate, after taxes — — — — — — — (0.9)
Adjusted net earnings(1) 194.7 197.7 193.1 272.3 182.8 180.9 174.0 230.3
2021 2020 2019(Dollars) Q2 Q1 Q4 Q3 Q2 Q1 Q4 Q3Fully diluted net earnings per share 0.75 0.76 0.74 1.04 0.69 0.67 0.66 0.86 Adjustments impact 0.03 0.03 0.03 0.04 0.03 0.04 0.02 0.04 Adjusted fully diluted net earnings per share(1) 0.78 0.79 0.77 1.08 0.72 0.71 0.68 0.90
CASH POSITION
OPERATING ACTIVITIES
In the second quarter of Fiscal 2021, operating activities generated cash inflows of $416.9 million compared with $465.4 million in the corresponding quarter of 2020. This difference resulted primarily from the change in non-cash working capital items that generated cash inflows of $64.4 million in the second quarter of 2021 compared with $128.2 million in the second quarter of 2020, mainly due to the impact of the pandemic, partly offset by the increase in earnings.
In the first 24 weeks of Fiscal 2021, operating activities generated cash inflows of $650.3 million compared with $544.9 million for the corresponding period of 2020. This difference resulted primarily from the increase in earnings and the change in non-cash working capital items that required cash outflows of $25.4 million in 2021 compared with $102.9 million in 2020.
INVESTING ACTIVITIES
Investing activities required cash outflows of $93.7 million for the second quarter of Fiscal 2021 compared with $65.8 million for the corresponding quarter of 2020, mainly due to higher investments in intangible assets of $28.2 million in 2021.
In the first 24 weeks of Fiscal 2021, investing activities required cash outflows of $158.1 million compared with $164.5 million for the corresponding period of 2020. This difference stemmed mainly from the buyout of minority interests in Groupe Première Moisson Inc. in the amount of $51.6 million in the first quarter of 2020, partly offset by higher investments in intangible assets of $32.9 million in 2021.
During the first 24 weeks of 2021, we and our retailers opened 1 store, carried out major expansions and renovations of 7 stores and relocated 1 store for a net increase of 56,000 square feet or 0.3% of our food retail network.
FINANCING ACTIVITIES
In the second quarter of 2021, financing activities required cash outflows of $318.8 million compared with $225.3 million in the corresponding quarter of 2020. This difference resulted mainly from higher share repurchases of $87.1 million in 2021.
(1) See table on "Net earnings adjustments" and section on "Non-IFRS Measurements"(2) See table on "Operating income before depreciation and amortization adjustments" and section on "Non-IFRS Measurements"(3) See section on "Forward-looking Information"
- 8 -

In the first 24 weeks of 2021, financing activities required cash outflows of $609.0 million compared with $436.0 million for the corresponding period of 2020. This difference resulted mainly from higher share repurchases of $159.8 million in 2021.
FINANCIAL POSITION We do not anticipate(3) any liquidity risk and consider our financial position at the end of the second quarter of Fiscal 2021 as very solid. We had an unused authorized revolving credit facility of $598.0 million. Our non-current debt and lease liabilities represented 41.0% of the combined total of non-current debt, lease liabilities and equity (non-current debt and lease liabilities/total capital).
At the end of the second quarter of Fiscal 2021, the main elements of our non-current debt were as follows:
Interest Rate MaturityBalance
(Millions of dollars)
Revolving Credit Facility Rates fluctuate with changes in bankers' acceptance rates November 3, 2024 2.0
Series C Notes 3.20% fixed rate December 1, 2021 300.0 Series F Notes 2.68% fixed rate December 5, 2022 300.0 Series G Notes 3.39% fixed rate December 6, 2027 450.0 Series B Notes 5.97% fixed rate October 15, 2035 400.0 Series D Notes 5.03% fixed rate December 1, 2044 300.0 Series H Notes 4.27% fixed rate December 4, 2047 450.0 Series I Notes 3.41% fixed rate February 28, 2050 400.0
The Corporation reclassified the Series C Notes of $300.0 million to current portion of the debt as it matures on December 1, 2021. The Corporation intends(3) to refinance the Series C Notes.
Our main financial ratios were as follows:
As at As atMarch 13, 2021 September 26, 2020
Financial structureNon-current debt (Millions of dollars) 2,617.2 2,612.0 Non-current lease liabilities (Millions of dollars) 1,719.9 1,811.4
4,337.1 4,423.4 Equity (Millions of dollars) 6,242.4 6,155.4 Non-current debt and lease liabilities/total capital (%) 41.0 41.8
Since the Corporation intends(3) to refinance the Series C Notes presented under non-current debt, the amount of $300.0 million was added to non-current debt when calculating the ratio of non-current debt and lease liabilities/total capital.
24 weeks / Fiscal Year
2021 2020
Results
Operating income before depreciation and amortization/Financial costs (Times) 12.7 11.7
(1) See table on "Net earnings adjustments" and section on "Non-IFRS Measurements"(2) See table on "Operating income before depreciation and amortization adjustments" and section on "Non-IFRS Measurements"(3) See section on "Forward-looking Information"
- 9 -

CAPITAL STOCK, STOCK OPTIONS AND PERFORMANCE SHARE UNITS
As at As at
March 13, 2021 September 26, 2020
Number of Common Shares outstanding (Thousands) 245,503 250,243 Stock options:
Number outstanding (Thousands) 2,742 2,322 Exercise prices (Dollars) 21.90 to 56.92 21.90 to 56.92Weighted average exercise price (Dollars) 44.15 41.27
Performance share units:Number outstanding (Thousands) 627 618
NORMAL COURSE ISSUER BID PROGRAM
Under the current normal course issuer bid program, the Corporation may repurchase up to 7,000,000 of its Common Shares between November 25, 2020 and November 24, 2021. As at April 2, 2021, the Corporation has repurchased 4,250,000 Common Shares at an average price of $56.21, for a total consideration of $238.9 million.
DIVIDENDS
On April 20, 2021, the Board of Directors declared a quarterly dividend of $0.25 per share, the same amount declared last quarter.
SHARE TRADING
The value of METRO shares remained in the $52.63 to $66.25 range over the first 24 weeks of Fiscal 2021. During this period, a total of 80.3 million shares were traded on the Toronto Stock Exchange. The closing price on April 1, 2021 was $58.03 compared with $64.02 at the end of Fiscal 2020.
FORWARD-LOOKING INFORMATIONWe have used, throughout this report, different statements that could, within the context of regulations issued by the Canadian Securities Administrators, be construed as being forward-looking information. In general, any statement contained herein that does not constitute a historical fact may be deemed a forward-looking statement. Expressions such as "anticipate", "expect", "intend" and other similar expressions are generally indicative of forward-looking statements. The forward-looking statements contained herein are based upon certain assumptions regarding the Canadian food industry, the general economy, our annual budget, as well as our 2021 action plan.
These forward-looking statements do not provide any guarantees as to the future performance of the Corporation and are subject to potential risks, known and unknown, as well as uncertainties that could cause the outcome to differ significantly. The arrival of a new competitor is an example of the risks described under the “Risk Management” section of the 2020 Annual Report which could have an impact on these statements. As with the preceding risks, the COVID-19 pandemic constitutes a risk that could have an impact on the business, operations, projects and performance of the Corporation as well as on the forward-looking statements contained in this document.
We believe these statements to be reasonable and pertinent as at the date of publication of this report and represent our expectations. The Corporation does not intend to update any forward-looking statement contained herein, except as required by applicable law.
(1) See table on "Net earnings adjustments" and section on "Non-IFRS Measurements"(2) See table on "Operating income before depreciation and amortization adjustments" and section on "Non-IFRS Measurements"(3) See section on "Forward-looking Information"
- 10 -

NON-IFRS MEASUREMENTS In addition to the International Financial Reporting Standards (IFRS) earnings measurements provided, we have included certain non-IFRS earnings measurements. These measurements are presented for information purposes only. They do not have a standardized meaning prescribed by IFRS and therefore may not be comparable to similar measurements presented by other public companies.
ADJUSTED OPERATING INCOME BEFORE DEPRECIATION AND AMORTIZATION, ADJUSTED NET EARNINGS AND ADJUSTED FULLY DILUTED NET EARNINGS PER SHARE
Adjusted operating income before depreciation and amortization, adjusted net earnings and adjusted fully diluted net earnings per share are earnings measurements that exclude some items that must be recognized under IFRS. They are non-IFRS measurements. We believe that presenting earnings without these items, which are not necessarily reflective of the Corporation's performance, leaves readers of financial statements better informed as to the current period and corresponding prior year's period's operating earnings, thus enabling them to better perform trend analysis, evaluate the Corporation's financial performance and judge its future outlook. The exclusion of these items does not imply that they are non-recurring.
OUTLOOK(3)
We continue to rigorously apply the government measures put in place to reduce the effects of the pandemic and remain agile as they evolve. We are working with government authorities to speed up vaccination efforts through our network of pharmacies and we expect our front-end sales, in the short-term, to compare favourably to last year, given the serious restrictions that were in place at that time. We also expect continued growth from prescription drugs. On the food side, given the extraordinary sales achieved last year at the start of the pandemic, we expect the year over year food sales, in the short-term, to decline. However, in absolute terms, we expect food sales to remain strong, and to compare favourably to pre-pandemic levels.
Montréal, April 21, 2021
(1) See table on "Net earnings adjustments" and section on "Non-IFRS Measurements"(2) See table on "Operating income before depreciation and amortization adjustments" and section on "Non-IFRS Measurements"(3) See section on "Forward-looking Information"
- 11 -

This page intentionally left blank
(1) See table on "Net earnings adjustments" and section on "Non-IFRS Measurements"(2) See table on "Operating income before depreciation and amortization adjustments" and section on "Non-IFRS Measurements"(3) See section on "Forward-looking Information"
- 12 -

Interim Condensed Consolidated Financial Statements
METRO INC.
March 13, 2021
- 13 -

Page
Consolidated statements of income.............................................................................................................. 15
Consolidated statements of comprehensive income.................................................................................... 16
Consolidated statements of financial position............................................................................................... 17
Consolidated statements of changes in equity............................................................................................. 18
Consolidated statements of cash flows........................................................................................................ 19
Notes to interim condensed consolidated financial statements.................................................................... 20
1- Statement presentation........................................................................................................................... 20
2- Additional information on the nature of earnings components................................................................ 21
3- Income taxes.......................................................................................................................................... 22
4- Net earnings per share........................................................................................................................... 22
5- Debt........................................................................................................................................................ 22
6- Capital stock........................................................................................................................................... 22
7- Financial instruments.............................................................................................................................. 24
8-Changes in defined benefit plans............................................................................................................ 25
9- Approval of financial statements............................................................................................................. 25
Table of contents
- 14 -

12 weeks 24 weeksFiscal Year Fiscal Year
2021 2020 2021 2020Sales 4,193.0 3,988.9 8,471.2 8,018.7 Cost of sales and operating expenses (note 2) (3,796.9) (3,614.8) (7,675.9) (7,274.0) Loss on disposal of a subsidiary (note 2) — — — (7.5) Operating income before depreciation and
amortization 396.1 374.1 795.3 737.2 Depreciation and amortization (note 2) (110.8) (102.0) (218.1) (203.5) Financial costs, net (note 2) (31.3) (31.9) (62.7) (63.0) Earnings before income taxes 254.0 240.2 514.5 470.7 Income taxes (note 3) (65.9) (64.0) (135.2) (124.3) Net earnings 188.1 176.2 379.3 346.4
Attributable to:Equity holders of the parent 187.3 175.7 377.8 345.4 Non-controlling interest 0.8 0.5 1.5 1.0
188.1 176.2 379.3 346.4
Net earnings per share (Dollars) (note 4)
Basic 0.76 0.70 1.52 1.36 Fully diluted 0.75 0.69 1.51 1.36
See accompanying notes
Consolidated statements of incomePeriods ended March 13, 2021 and March 14, 2020(Unaudited) (Millions of dollars, except for net earnings per share)
- 15 -

12 weeks 24 weeksFiscal Year Fiscal Year
2021 2020 2021 2020
Net earnings 188.1 176.2 379.3 346.4 Other comprehensive income
Items that will not be reclassified to net earningsChanges in defined benefit plans
Actuarial gains (note 8) 105.4 19.3 159.2 46.7 Asset ceiling effect (9.4) 1.6 (15.9) (3.6) Minimum funding requirement — — — 0.9
Corresponding income taxes (25.5) (5.5) (38.0) (11.6) 70.5 15.4 105.3 32.4
Comprehensive income 258.6 191.6 484.6 378.8
Attributable to:Equity holders of the parent 257.8 191.1 483.1 377.8 Non-controlling interest 0.8 0.5 1.5 1.0
258.6 191.6 484.6 378.8
See accompanying notes
Consolidated statements of comprehensive incomePeriods ended March 13, 2021 and March 14, 2020(Unaudited) (Millions of dollars)
- 16 -

As at As atMarch 13, 2021 September 26, 2020
ASSETSCurrent assetsCash and cash equivalents 324.7 441.5 Accounts receivable 606.7 641.8 Accounts receivable on subleases 89.6 88.0 Inventories 1,216.4 1,268.2 Prepaid expenses 59.9 45.0 Current taxes 21.1 16.0
2,318.4 2,500.5 Non-current assetsFixed assets 2,900.5 2,860.8 Investment properties 40.0 40.2 Right-of-use assets 1,114.5 1,150.5 Intangible assets 2,875.5 2,850.2 Goodwill 3,300.7 3,300.7 Deferred taxes 43.5 43.5 Defined benefit assets 74.9 19.7 Accounts receivable on subleases 556.0 596.3 Other assets 54.2 61.5
13,278.2 13,423.9 LIABILITIES AND EQUITYCurrent liabilitiesBank loans 0.4 0.4 Accounts payable 1,336.5 1,458.9 Deferred revenues 43.9 38.0 Current taxes 94.5 81.7 Provisions 1.6 2.5 Current portion of debt (note 5) 318.9 20.6 Current portion of lease liabilities 263.0 258.0
2,058.8 1,860.1 Non-current liabilitiesDebt (note 5) 2,317.2 2,612.0 Lease liabilities 1,719.9 1,811.4 Defined benefit liabilities 45.2 129.9 Provisions 19.2 19.2 Deferred taxes 873.8 833.9 Other liabilities 1.7 2.0
7,035.8 7,268.5 EquityAttributable to equity holders of the parent 6,229.3 6,142.2 Attributable to non-controlling interest 13.1 13.2
6,242.4 6,155.4 13,278.2 13,423.9
See accompanying notes
Consolidated statements of financial position(Unaudited) (Millions of dollars)
- 17 -

Attributable to the equity holders of the parent
Capital stock
(note 6)
Treasury shares (note 6)
Contributed surplus
Retained earnings Total
Non-controlling
interestTotal
equity
Balance as at September 26, 2020 1,713.8 (25.1) 22.2 4,431.3 6,142.2 13.2 6,155.4
Net earnings — — — 377.8 377.8 1.5 379.3
Other comprehensive income — — — 105.3 105.3 — 105.3
Comprehensive income — — — 483.1 483.1 1.5 484.6
Stock options exercised 1.3 — (0.2) — 1.1 — 1.1
Shares redeemed (33.5) — — — (33.5) — (33.5)
Share redemption premium — — — (246.9) (246.9) — (246.9)
Share-based compensation cost — — 4.7 — 4.7 — 4.7
Performance share units settlement — 4.6 (7.0) (0.9) (3.3) — (3.3)
Dividends — — — (118.1) (118.1) (0.6) (118.7)
Repurchase of shares in joint ventures — — — — — (1.0) (1.0)
(32.2) 4.6 (2.5) (365.9) (396.0) (1.6) (397.6)
Balance as at March 13, 2021 1,681.6 (20.5) 19.7 4,548.5 6,229.3 13.1 6,242.4
Attributable to the equity holders of the parent
Capital stock
Treasury shares
Contributed surplus
Retained earnings Total
Non-controlling
interestTotal
equity
Balance as at September 28, 2019 1,732.3 (24.6) 19.2 4,228.3 5,955.2 13.4 5,968.6
Net earnings — — — 345.4 345.4 1.0 346.4
Other comprehensive income — — — 32.4 32.4 — 32.4
Comprehensive income — — — 377.8 377.8 1.0 378.8
Stock options exercised 3.3 — (0.4) — 2.9 — 2.9
Shares redeemed (15.1) — — — (15.1) — (15.1)
Share redemption premium — — — (105.5) (105.5) — (105.5)
Acquisition of treasury shares — (6.2) — — (6.2) — (6.2)
Share-based compensation cost — — 4.2 — 4.2 — 4.2
Performance share units settlement — 5.7 (5.5) (0.2) — — —
Dividends — — — (107.7) (107.7) (0.1) (107.8)
Adoption of IFRS 16 "Leases" — — — (169.4) (169.4) — (169.4) Change in fair value of non-controlling
interest liability — — — (0.5) (0.5) — (0.5)
(11.8) (0.5) (1.7) (383.3) (397.3) (0.1) (397.4)
Balance as at March 14, 2020 1,720.5 (25.1) 17.5 4,222.8 5,935.7 14.3 5,950.0
See accompanying notes
Consolidated statements of changes in equityPeriods ended March 13, 2021 and March 14, 2020(Unaudited) (Millions of dollars)
- 18 -

12 weeks 24 weeksFiscal Year Fiscal Year
2021 2020 2021 2020Operating activitiesEarnings before income taxes 254.0 240.2 514.5 470.7 Non-cash items
Loss on disposal of a subsidiary (note 2) — — — 7.5 Depreciation and amortization 110.8 102.0 218.1 203.5 Loss (gain) on disposal and write-offs of fixed and intangible assets and
investment properties (0.1) 0.7 (0.1) 0.7 Share-based compensation cost 2.5 2.1 4.7 4.2 Difference between amounts paid for employee benefits and current
period cost 0.1 1.1 1.4 1.0 Financial costs, net 31.3 31.9 62.7 63.0
398.6 378.0 801.3 750.6 Net change in non-cash working capital items 64.4 128.2 (25.4) (102.9) Income taxes paid (46.1) (40.8) (125.6) (102.8)
416.9 465.4 650.3 544.9 Investing activitiesNet proceeds on disposal of a subsidiary (note 2) — — — 3.5 Repurchase of shares in joint ventures — — (1.0) — Buyout of a minority interest (note 7) — — — (51.6) Net change in other assets (0.4) 0.8 (2.3) 1.3 Additions to fixed assets and investment properties (78.5) (82.2) (158.7) (153.9) Disposal of fixed assets and investment properties 0.1 2.5 2.6 2.5 Additions to intangible assets (41.1) (12.9) (50.8) (17.9) Payments received from subleases 22.2 21.7 44.0 44.4 Interest received from subleases 4.0 4.3 8.1 7.2
(93.7) (65.8) (158.1) (164.5) Financing activitiesNet change in bank loans (0.5) 9.8 — 10.3 Shares issued 0.9 1.7 1.1 2.9 Shares redeemed (168.7) (81.6) (280.4) (120.6) Acquisition of treasury shares (note 6) — (6.2) — (6.2) Performance share units settlement (3.3) — (3.3) — Increase in debt 2.0 398.8 4.4 407.2 Repayment of debt (1.5) (411.9) (4.5) (419.2) Interest paid on debt (6.9) (3.4) (54.1) (52.7) Payment of lease liabilities (principal) (65.0) (62.8) (128.9) (125.3) Payment of lease liabilities (interest) (12.9) (12.9) (24.9) (24.7) Net change in other liabilities (1.1) 0.1 (0.3) — Dividends (61.8) (56.9) (118.1) (107.7)
(318.8) (225.3) (609.0) (436.0) Net change in cash and cash equivalents 4.4 174.3 (116.8) (55.6) Cash and cash equivalents — beginning of period 320.3 43.5 441.5 273.4 Cash and cash equivalents — end of period 324.7 217.8 324.7 217.8
see accompanying notes
Consolidated statements of cash flowsPeriods ended March 13, 2021 and March 14, 2020(Unaudited) (Millions of dollars)
- 19 -

1. STATEMENT PRESENTATIONMETRO INC. (the Corporation) is a company incorporated under the laws of Québec. One of Canada's leading food and pharmacy retailers and distributors, the Corporation operates a network of supermarkets, discount stores and drugstores. Its head office is located at 11011 Maurice-Duplessis Blvd., Montréal, Québec, Canada, H1C 1V6. Its two business segments, food operations and pharmacy operations, are combined into one reportable operating segment due to the similar nature of their operations.
The unaudited interim condensed consolidated financial statements for the 12 and 24-week periods ended March 13, 2021 have been prepared by management in accordance with IAS 34 Interim Financial Reporting and using the same accounting policies and methods of computation as those used in preparing the audited annual consolidated financial statements for the year ended September 26, 2020. They should be read in conjunction with the audited annual consolidated financial statements and accompanying notes which were presented in the Corporation’s 2020 Annual Report.
Notes to interim condensed consolidated financial statementsPeriods ended March 13, 2021 and March 14, 2020(Unaudited) (Millions of dollars, unless otherwise indicated)
- 20 -

2. ADDITIONAL INFORMATION ON THE NATURE OF EARNINGS COMPONENTS
12 weeks 24 weeksFiscal Year Fiscal Year
2021 % 2020 % 2021 % 2020 %
Sales 4,193.0 3,988.9 8,471.2 8,018.7
Cost of sales (3,348.0) (3,202.4) (6,782.8) (6,441.7) Gross margin 845.0 20.2 786.5 19.7 1,688.4 19.9 1,577.0 19.7
Operating expensesWages and fringe benefits (229.6) (208.3) (455.2) (410.3) Employee benefits expense (24.5) (22.7) (48.1) (45.0) Rents and occupancy charges (70.3) (64.3) (140.5) (138.0) Loss on disposal of a subsidiary — — — (7.5) Others (124.5) (117.1) (249.3) (239.0)
(448.9) 10.7 (412.4) 10.3 (893.1) 10.5 (839.8) 10.5 Operating income before depreciation
and amortization 396.1 9.4 374.1 9.4 795.3 9.4 737.2 9.2 Depreciation and amortization
Fixed assets (55.8) (49.6) (109.2) (98.8) Investment properties (0.2) (0.2) (0.3) (0.3) Right-of-use assets (36.8) (34.8) (73.2) (69.8) Intangible assets (18.0) (17.4) (35.4) (34.6)
(110.8) (102.0) (218.1) (203.5) Financial costs, net
Current interest (0.6) (0.6) (1.3) (1.4) Non-current interest (24.2) (24.5) (48.6) (48.0) Net interest on lease liabilities (7.8) (7.6) (15.7) (15.6) Interest on defined benefit obligations
net of plan assets (1.0) (1.0) (2.0) (2.0) Amortization of deferred financing costs (0.5) (0.6) (0.9) (1.3) Interest income 2.9 2.4 5.9 5.4 Passage of time (0.1) — (0.1) (0.1)
(31.3) (31.9) (62.7) (63.0) Earnings before income taxes 254.0 240.2 514.5 470.7
The Corporation disposed of the assets of subsidiary MissFresh on December 9, 2019 for a cash consideration of $3.5 and recorded a loss on disposal of $7.5 mainly related to tangible and intangible assets. The Corporation also recognized a deferred tax asset of $3.3 related to this subsidiary’s fiscal attributes.
Notes to interim condensed consolidated financial statementsPeriods ended March 13, 2021 and March 14, 2020(Unaudited) (Millions of dollars, unless otherwise indicated)
- 21 -

3. INCOME TAXESThe effective income tax rates were as follows:
12 weeks 24 weeksFiscal Year Fiscal Year
(Percentage) 2021 2020 2021 2020
Combined statutory income tax rate 26.5 26.5 26.5 26.5 Changes
Loss on disposal of a subsidiary (note 2) — — — (0.7) Others (0.6) 0.1 (0.2) 0.6
25.9 26.6 26.3 26.4
4. NET EARNINGS PER SHAREBasic net earnings per share and fully diluted net earnings per share were calculated using the following number of shares:
12 weeks 24 weeksFiscal Year Fiscal Year
(Millions) 2021 2020 2021 2020
Weighted average number of shares outstanding – Basic 247.1 252.7 248.4 253.2 Dilutive effect under:
Stock option plan 0.6 0.6 0.6 0.7 Performance share unit plan 0.5 0.5 0.5 0.5
Weighted average number of shares outstanding – Fully diluted 248.2 253.8 249.5 254.4
5. DEBTThe Corporation reclassified the Series C Notes of $300,0 to current portion of the debt as it matures on December 1, 2021. The Corporation intends to refinance the Series C Notes.
6. CAPITAL STOCK
COMMON SHARES ISSUED
The Common Shares issued were summarized as follows:
Number(Thousands)
Balance as at September 28, 2019 254,440 1,732.3 Shares redeemed for cash, excluding premium of $190.5 (3,910) (26.7) Stock options exercised 265 8.2 Balance as at September 26, 2020 250,795 1,713.8 Shares redeemed for cash, excluding premium of $246.9 (4,900) (33.5)
Stock options exercised 50 1.3
Balance as at March 13, 2021 245,945 1,681.6
Notes to interim condensed consolidated financial statementsPeriods ended March 13, 2021 and March 14, 2020(Unaudited) (Millions of dollars, unless otherwise indicated)
- 22 -
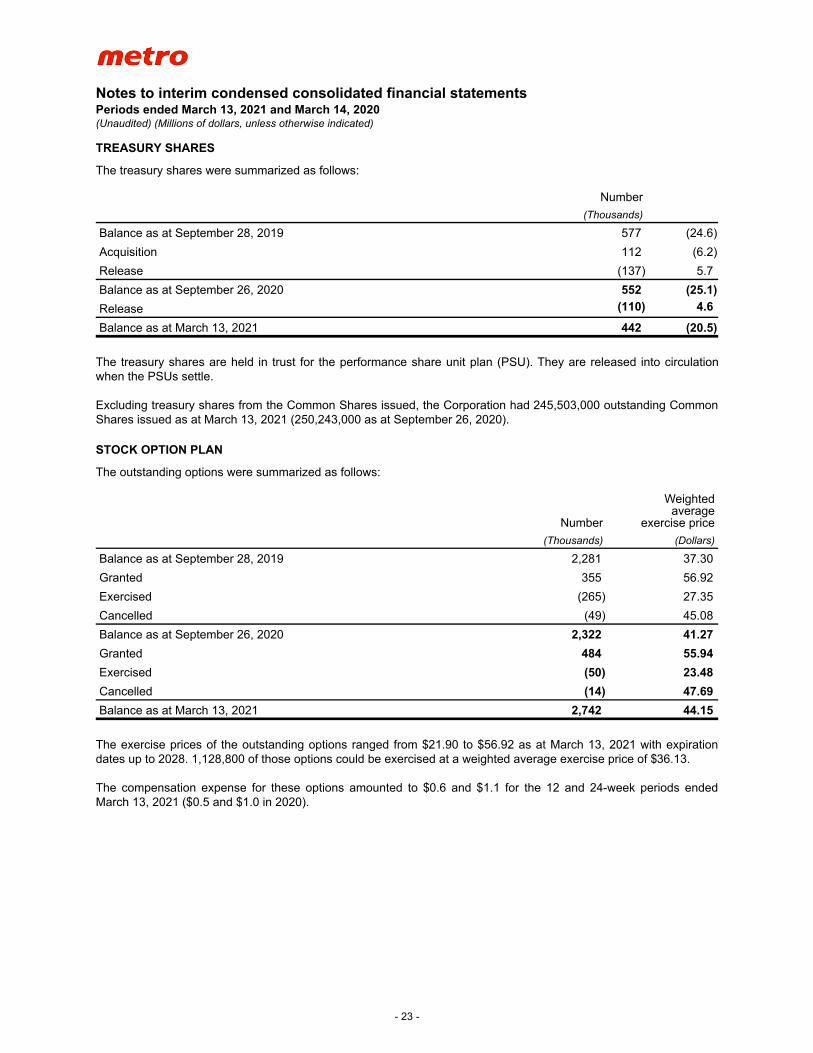
TREASURY SHARES
The treasury shares were summarized as follows:
Number(Thousands)
Balance as at September 28, 2019 577 (24.6) Acquisition 112 (6.2) Release (137) 5.7 Balance as at September 26, 2020 552 (25.1) Release (110) 4.6
Balance as at March 13, 2021 442 (20.5)
The treasury shares are held in trust for the performance share unit plan (PSU). They are released into circulation when the PSUs settle.
Excluding treasury shares from the Common Shares issued, the Corporation had 245,503,000 outstanding Common Shares issued as at March 13, 2021 (250,243,000 as at September 26, 2020).
STOCK OPTION PLAN
The outstanding options were summarized as follows:
Number
Weighted average
exercise price(Thousands) (Dollars)
Balance as at September 28, 2019 2,281 37.30 Granted 355 56.92 Exercised (265) 27.35 Cancelled (49) 45.08 Balance as at September 26, 2020 2,322 41.27 Granted 484 55.94 Exercised (50) 23.48 Cancelled (14) 47.69 Balance as at March 13, 2021 2,742 44.15
The exercise prices of the outstanding options ranged from $21.90 to $56.92 as at March 13, 2021 with expiration dates up to 2028. 1,128,800 of those options could be exercised at a weighted average exercise price of $36.13.
The compensation expense for these options amounted to $0.6 and $1.1 for the 12 and 24-week periods ended March 13, 2021 ($0.5 and $1.0 in 2020).
Notes to interim condensed consolidated financial statementsPeriods ended March 13, 2021 and March 14, 2020(Unaudited) (Millions of dollars, unless otherwise indicated)
- 23 -

PERFORMANCE SHARE UNIT PLAN
The number of PSUs outstanding was as follows:
Number(Thousands)
Balance as at September 28, 2019 605 Granted 205 Exercised (137) Cancelled (55) Balance as at September 26, 2020 618 Granted 230 Exercised (171) Cancelled (50) Balance as at March 13, 2021 627
The compensation expense for the PSU plan amounted to $1.9 and $3.6 for the 12 and 24-week periods ended March 13, 2021 ($1.6 and $3.2 in 2020).
7. FINANCIAL INSTRUMENTSThe non-current financial instruments' book and fair values were as follows:
As at March 13, 2021 As at September 26, 2020Book value Fair value Book value Fair value
Other assetsAssets measured at amortized cost
Loans to certain customers 52.8 52.8 59.8 59.8
Debt Liabilities measured at amortized costRevolving Credit Facility 2.0 2.0 — — Series C Notes (note 5) 300.0 307.5 300.0 307.9 Series F Notes 300.0 311.1 300.0 311.0 Series G Notes 450.0 487.4 450.0 503.6 Series B Notes 400.0 511.3 400.0 542.8 Series D Notes 300.0 356.5 300.0 391.0 Series H Notes 450.0 483.7 450.0 536.6 Series I Notes 400.0 367.9 400.0 416.5 Loans 47.8 47.8 47.2 47.2
2,649.8 2,875.2 2,647.2 3,056.6
The fair value of loans to certain customers and loans payable is equivalent to their carrying value since their interest rates are comparable to market rates. The Corporation categorized the fair value measurement in Level 2, as it is derived from observable market inputs.
Notes to interim condensed consolidated financial statementsPeriods ended March 13, 2021 and March 14, 2020(Unaudited) (Millions of dollars, unless otherwise indicated)
- 24 -

The fair value of notes represents the obligations that the Corporation would have to meet in the event of the negotiation of similar notes under current market conditions. The Corporation categorized the fair value measurement in Level 2, as it is derived from observable market inputs.
Under the shareholder agreement, the Corporation acquired the minority interest in Groupe Première Moisson Inc. during the first quarter of Fiscal 2020 for a cash consideration of $51.6, which represents the price payable based on Groupe Première Moisson’s Fiscal 2019 results.
8. CHANGES IN DEFINED BENEFIT PLANSThe actuarial gains of $105.4 and $159.2 recorded in the consolidated statements of comprehensive income during the 12 and 24-week periods ending March 13, 2021 are primarily due to the increase in discount rates from 2.74% as at September 26, 2020 to 3.45% as at March 13, 2021, net of changes in fair value of assets.
9. APPROVAL OF FINANCIAL STATEMENTSThe interim condensed consolidated financial statements for the 12 and 24-week periods ended March 13, 2021 (including comparative figures) were approved for issue by the Board of Directors on April 20, 2021.
INFORMATIONMETRO INC.’s Investor Relations DepartmentTelephone: (514) 643-1000
METRO INC.’s corporate information and press releases are available on the Internet at the following address: www.metro.ca
Notes to interim condensed consolidated financial statementsPeriods ended March 13, 2021 and March 14, 2020(Unaudited) (Millions of dollars, unless otherwise indicated)
- 25 -
