2021 q2 residential market survey
TRANSCRIPT
2021 Q2 RESIDENTIAL MARKET SURVEY
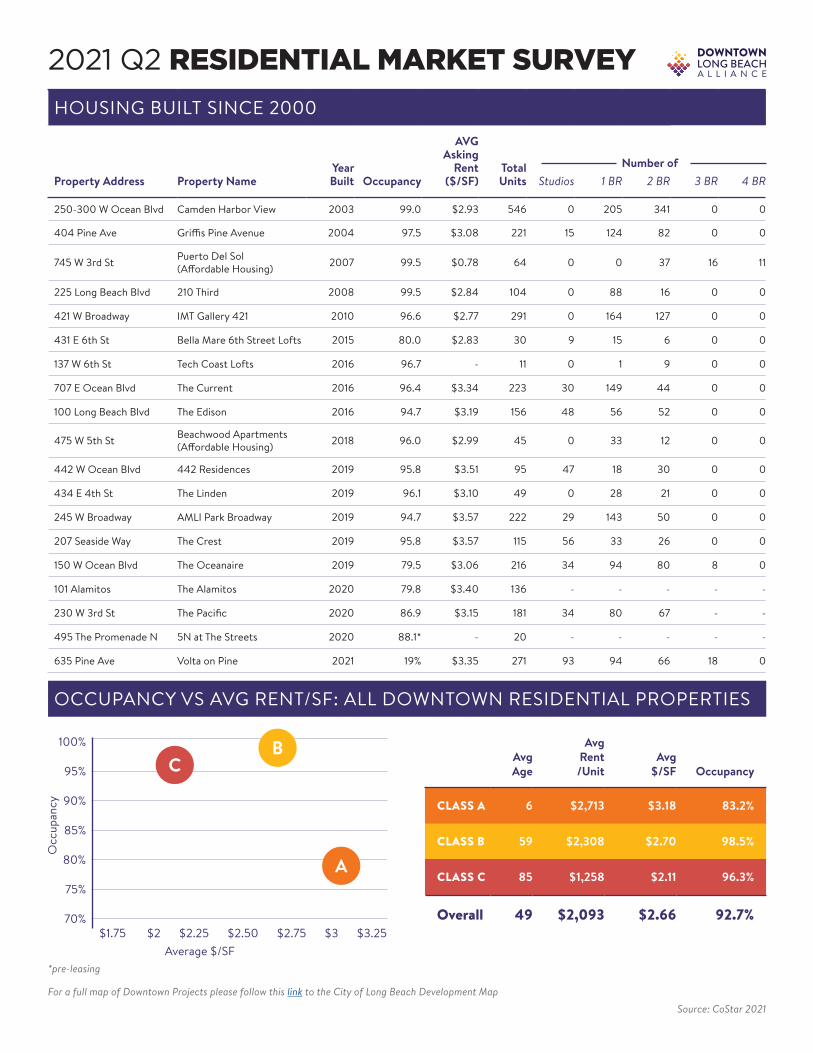
HOUSING BUILT SINCE 2000
Property Address Property NameYear Built Occupancy
AVGAsking
Rent ($/SF)
Total Units Studios 1 BR 2 BR 3 BR 4 BR
250-300 W Ocean Blvd Camden Harbor View 2003 99.0 $2.93 546 0 205 341 0 0
404 Pine Ave Griffis Pine Avenue 2004 97.5 $3.08 221 15 124 82 0 0
745 W 3rd St Puerto Del Sol (Affordable Housing) 2007 99.5 $0.78 64 0 0 37 16 11
225 Long Beach Blvd 210 Third 2008 99.5 $2.84 104 0 88 16 0 0
421 W Broadway IMT Gallery 421 2010 96.6 $2.77 291 0 164 127 0 0
431 E 6th St Bella Mare 6th Street Lofts 2015 80.0 $2.83 30 9 15 6 0 0
137 W 6th St Tech Coast Lofts 2016 96.7 - 11 0 1 9 0 0
707 E Ocean Blvd The Current 2016 96.4 $3.34 223 30 149 44 0 0
100 Long Beach Blvd The Edison 2016 94.7 $3.19 156 48 56 52 0 0
475 W 5th St Beachwood Apartments (Affordable Housing) 2018 96.0 $2.99 45 0 33 12 0 0
442 W Ocean Blvd 442 Residences 2019 95.8 $3.51 95 47 18 30 0 0
434 E 4th St The Linden 2019 96.1 $3.10 49 0 28 21 0 0
245 W Broadway AMLI Park Broadway 2019 94.7 $3.57 222 29 143 50 0 0
207 Seaside Way The Crest 2019 95.8 $3.57 115 56 33 26 0 0
150 W Ocean Blvd The Oceanaire 2019 79.5 $3.06 216 34 94 80 8 0
101 Alamitos The Alamitos 2020 79.8 $3.40 136 - - - - -
230 W 3rd St The Pacific 2020 86.9 $3.15 181 34 80 67 - -
495 The Promenade N 5N at The Streets 2020 88.1* - 20 - - - - -
635 Pine Ave Volta on Pine 2021 19% $3.35 271 93 94 66 18 0
Number of
AvgAge
AvgRent/Unit
Avg$/SF Occupancy
CLASS A 6 $2,713 $3.18 83.2%
CLASS B 59 $2,308 $2.70 98.5%
CLASS C 85 $1,258 $2.11 96.3%
Overall 49 $2,093 $2.66 92.7%
Average $/SF
Occ
upan
cy
$2 $3 $3.25$2.25 $2.50 $2.75$1.75
95%
100%
90%
85%
70%
80%
75%
OCCUPANCY VS AVG RENT/SF: ALL DOWNTOWN RESIDENTIAL PROPERTIES
Source: CoStar 2021
BC
A
*pre-leasing
For a full map of Downtown Projects please follow this link to the City of Long Beach Development Map
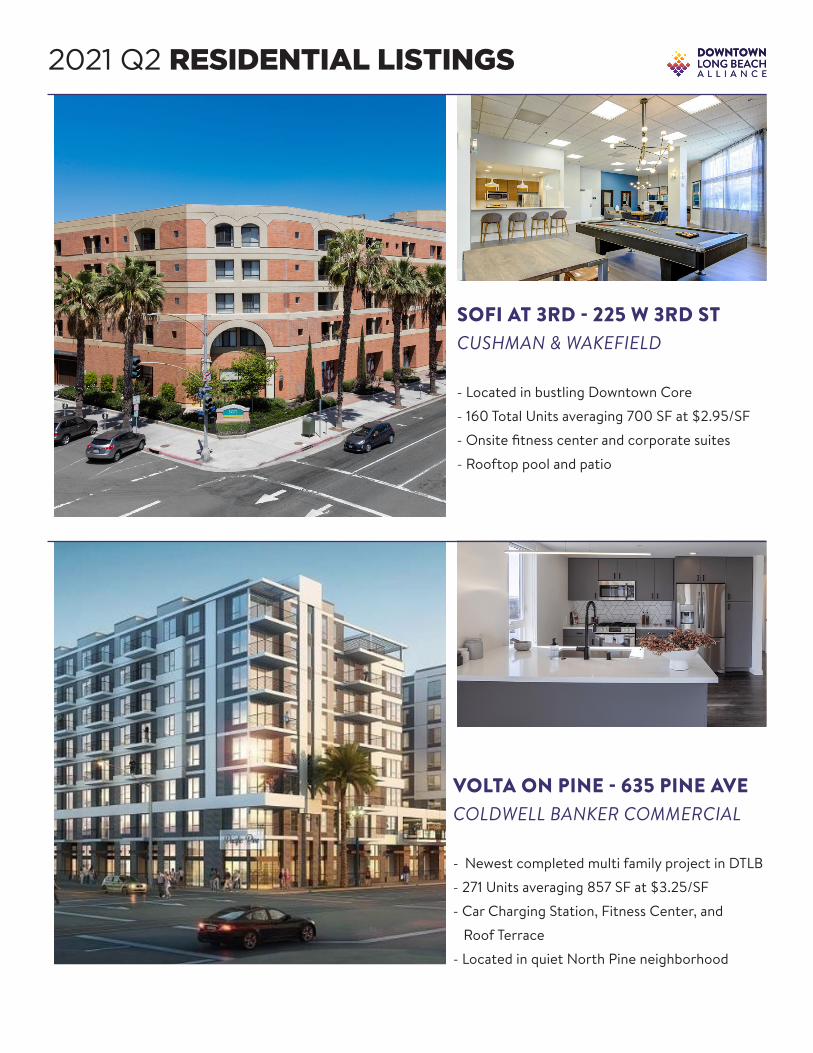
2021 Q2 RESIDENTIAL LISTINGS
SOFI AT 3RD - 225 W 3RD ST CUSHMAN & WAKEFIELD
- Located in bustling Downtown Core
- 160 Total Units averaging 700 SF at $2.95/SF
- Onsite fitness center and corporate suites
- Rooftop pool and patio
VOLTA ON PINE - 635 PINE AVE COLDWELL BANKER COMMERCIAL
- Newest completed multi family project in DTLB
- 271 Units averaging 857 SF at $3.25/SF
- Car Charging Station, Fitness Center, and
Roof Terrace
- Located in quiet North Pine neighborhood