2021 - telkom
TRANSCRIPT
Telkom SA SOC Ltd
2021
Annual ResultsPresentation For the year ended 31 March 2021
Operating environment
1
Annual Results Presentation FY2021 3
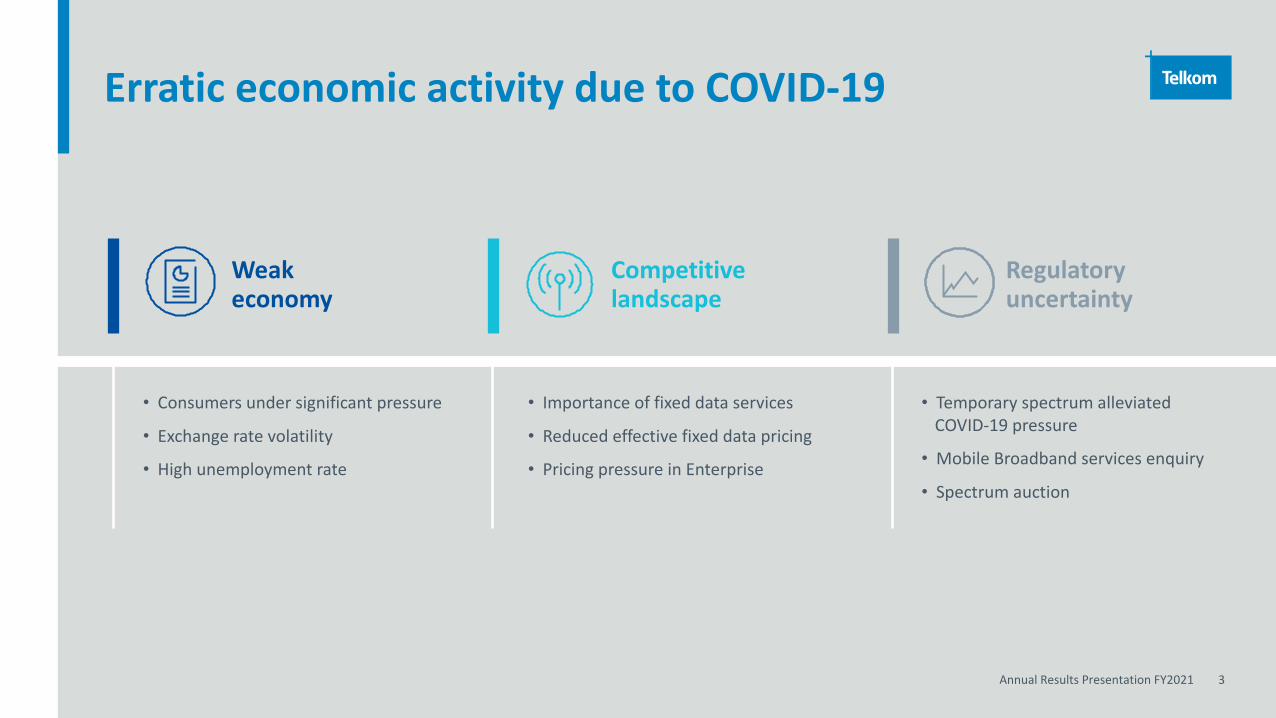
Erratic economic activity due to COVID-19
Weak economy
Regulatory uncertainty
• Consumers under significant pressure
• Exchange rate volatility
• High unemployment rate
• Importance of fixed data services
• Reduced effective fixed data pricing
• Pricing pressure in Enterprise
• Temporary spectrum alleviated COVID-19 pressure
• Mobile Broadband services enquiry
• Spectrum auction
Competitive landscape
Annual Results Presentation FY2021 4
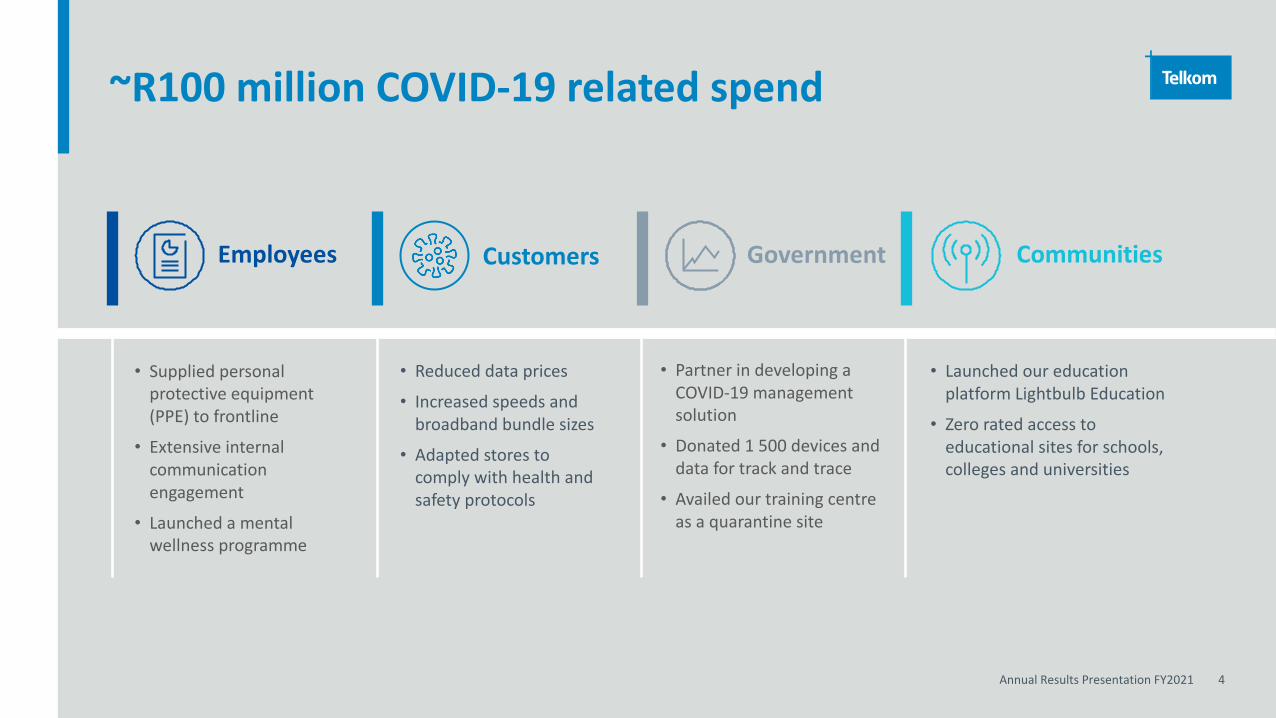
~R100 million COVID-19 related spend
• Partner in developing a COVID-19 management solution
• Donated 1 500 devices and data for track and trace
• Availed our training centre as a quarantine site
Employees Customers Government Communities
• Reduced data prices
• Increased speeds and broadband bundle sizes
• Adapted stores to comply with health and safety protocols
• Launched our education platform Lightbulb Education
• Zero rated access to educational sites for schools, colleges and universities
• Supplied personal protective equipment (PPE) to frontline
• Extensive internal communication engagement
• Launched a mental wellness programme
An evolved business
2
Annual Results Presentation FY2021 6
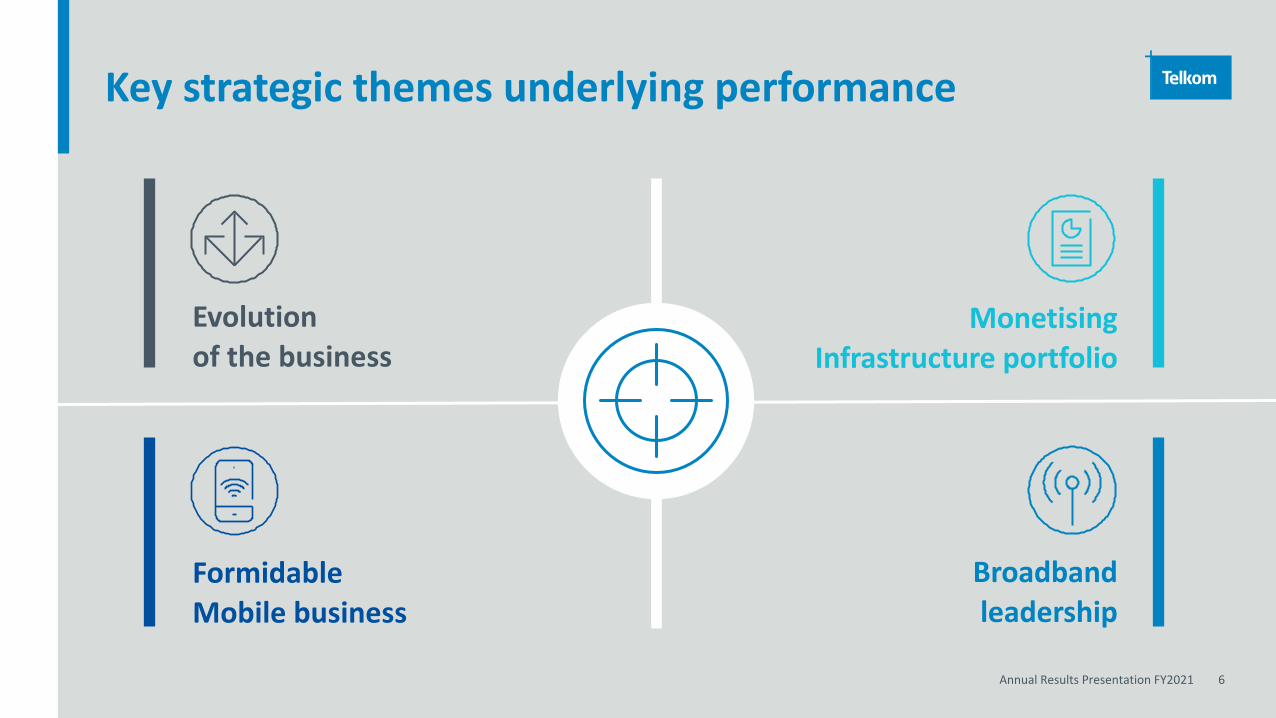
Key strategic themes underlying performance
MonetisingInfrastructure portfolio
Formidable Mobile business
Evolution of the business
Broadband leadership
Annual Results Presentation FY2021 7
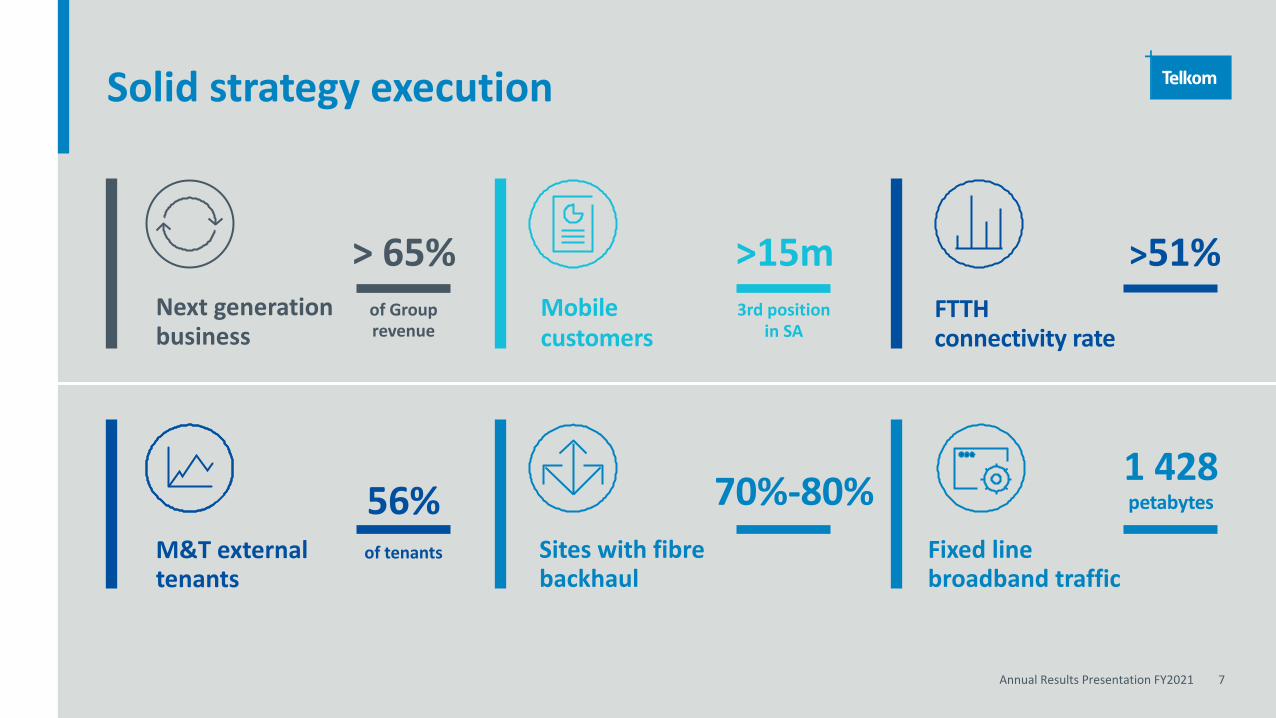
Solid strategy execution
Next generation business
M&T external tenants
> 65%
Sites with fibre backhaul
Mobile customers
FTTH connectivity rate
Fixed line broadband traffic
3rd position in SA
>15m >51%of Grouprevenue
70%-80%56%1 428petabytes
of tenants
Annual Results Presentation FY2021 8
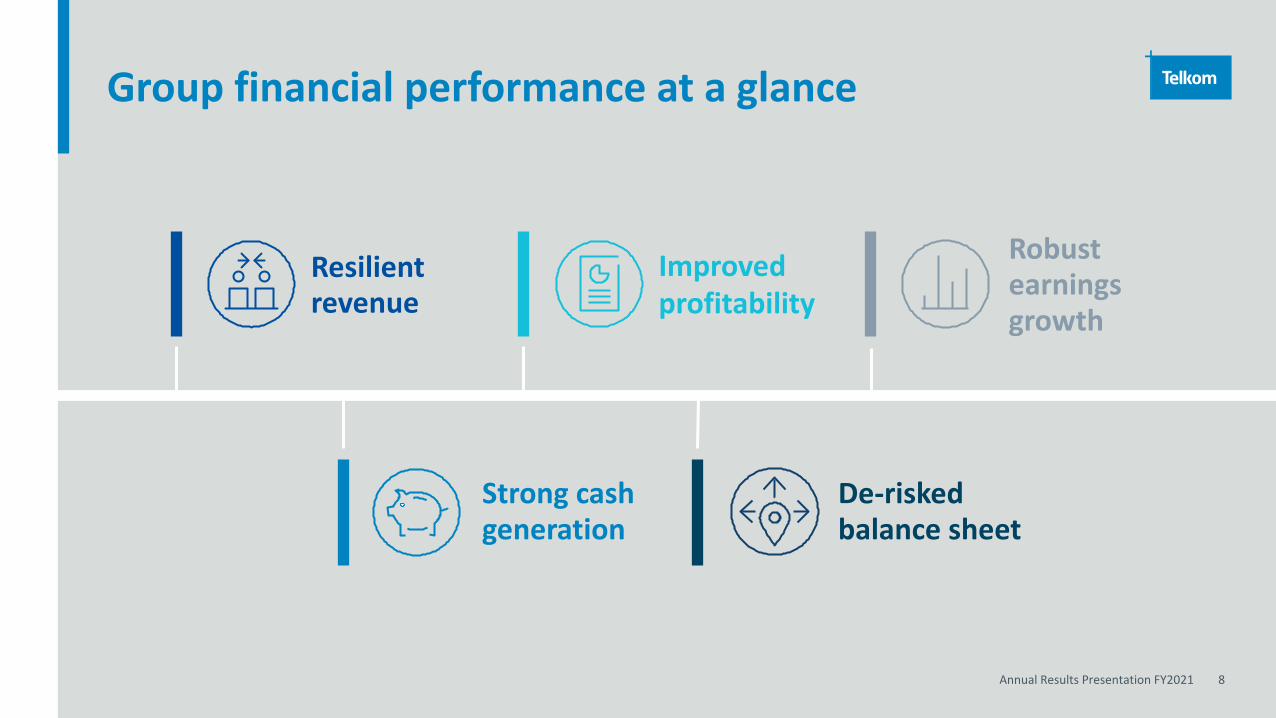
Group financial performance at a glance
Improved profitability
Resilient revenue
Strong cash generation
Robust earnings growth
De-risked balance sheet
Annual Results Presentation FY2021 9
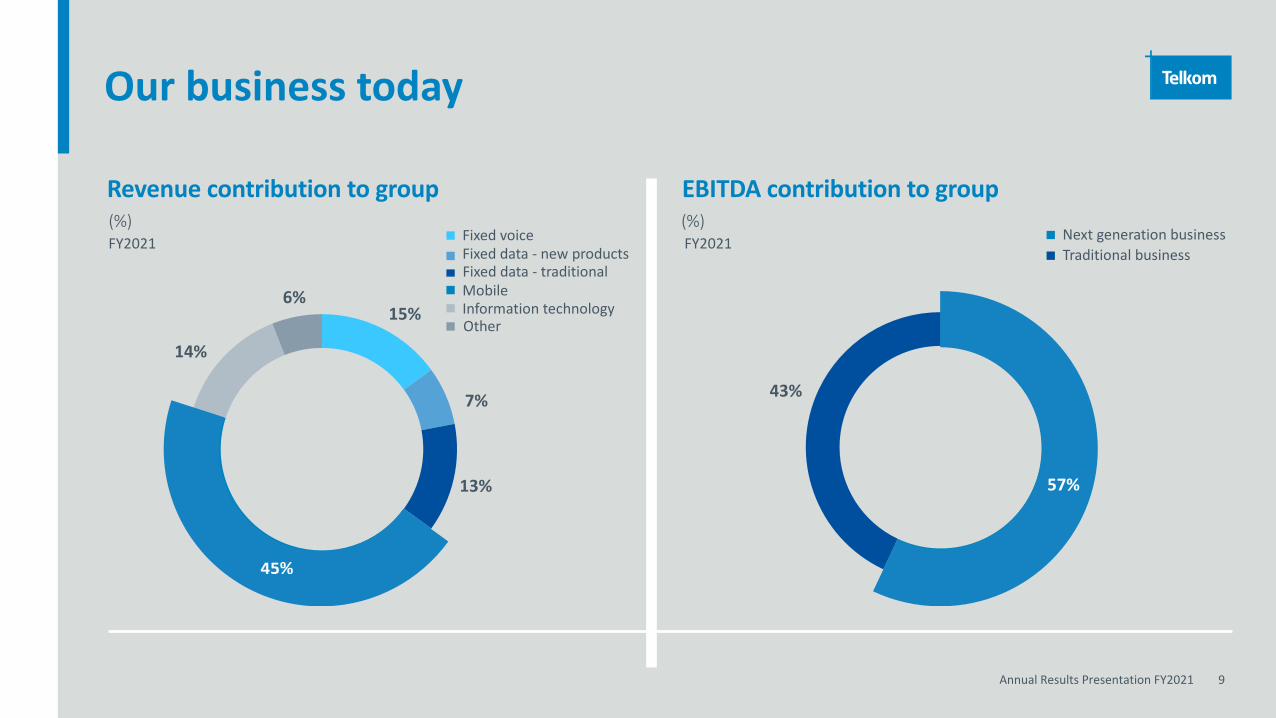
Our business today
Revenue contribution to group
FY2021(%)
14%
6%15%
FY2021(%)
Next generation business Traditional business
7%
EBITDA contribution to group
MobileInformation technology
Fixed voiceFixed data - new products
Other
Fixed data - traditional
13%
43%
57%
Business performance
3
Covid-19 impact
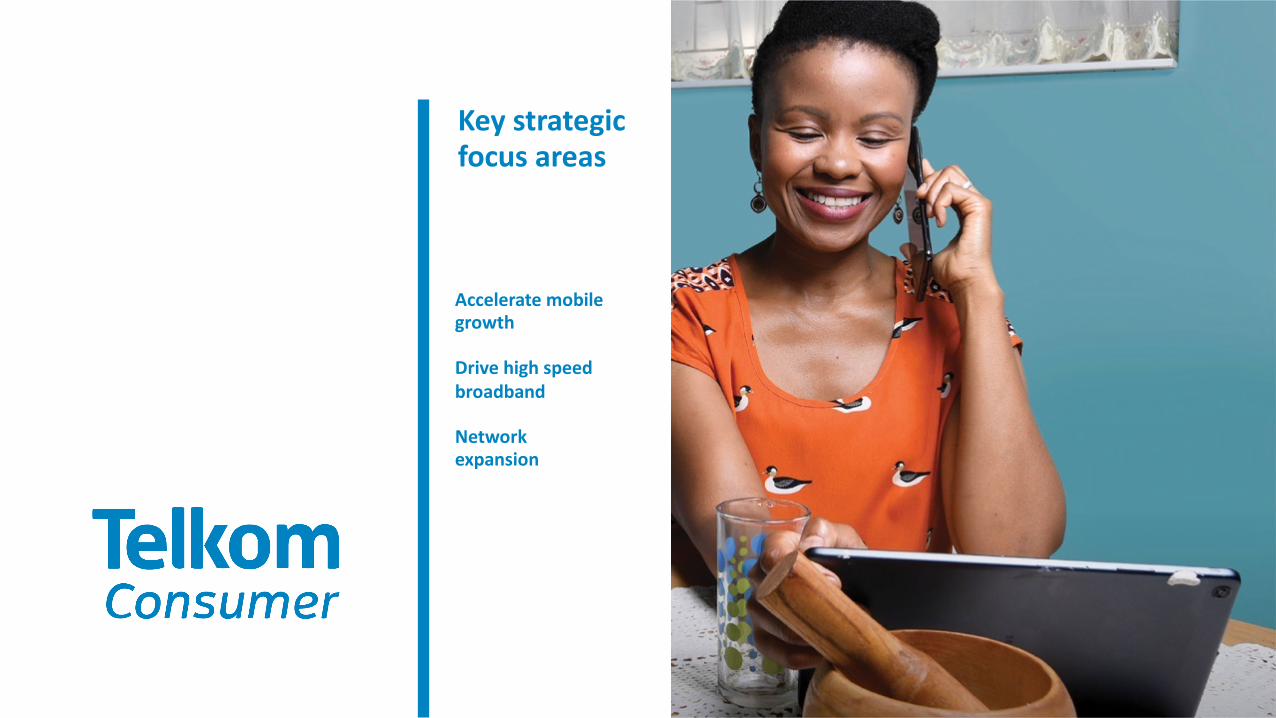
Key strategic focus areas
Accelerate mobile growth
Drive high speed broadband
Network expansion
Annual Results Presentation FY2021 12
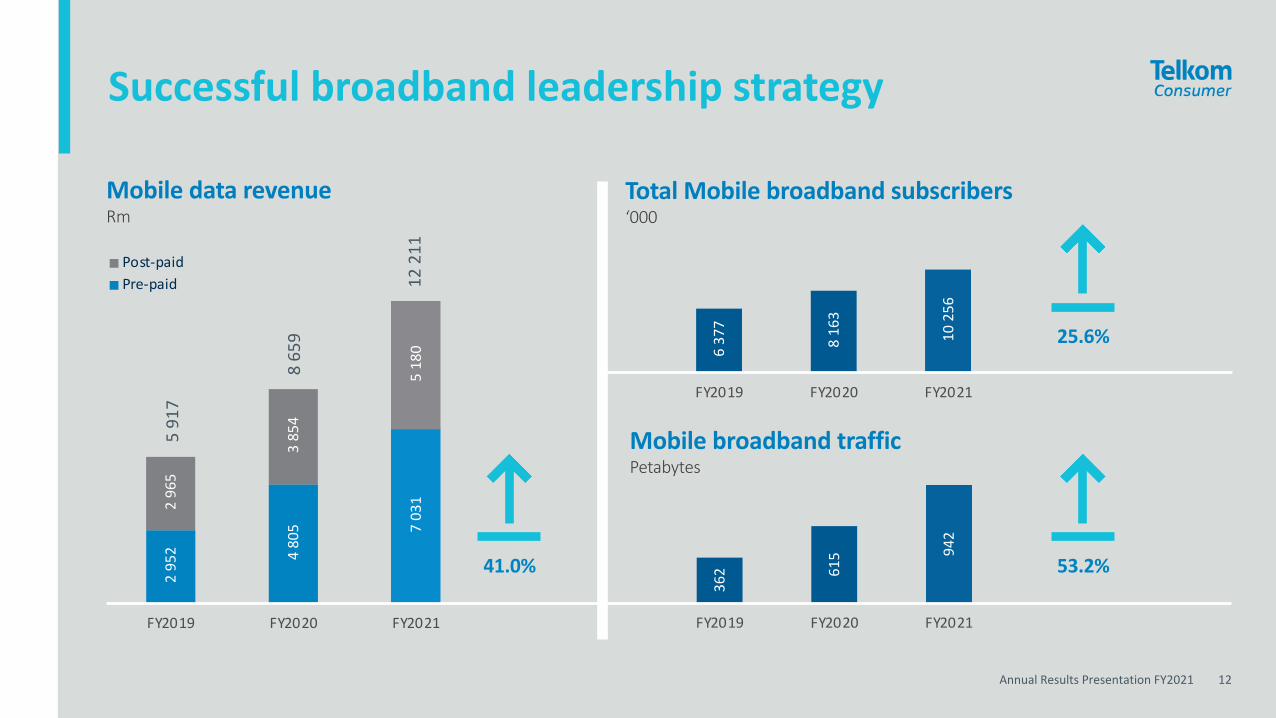
Successful broadband leadership strategy
6 37
7
8 16
3
10 2
56
FY2019 FY2020 FY2021
362 61
5 942
FY2019 FY2020 FY2021
Total Mobile broadband subscribers‘000
Mobile broadband trafficPetabytes
295
2 480
5 703
1 296
5
385
4
518
0
FY2019 FY2020 FY2021
Post-paidPre-paid
Mobile data revenueRm
5 91
7
8 65
9
12 2
11
41.0% 53.2%
25.6%

Annual Results Presentation FY2021 13
Data-led network investment underpins growth
511
6
586
2
643
0 FY2019 FY2020 FY2021
Mobile sites integrated
5
19
5
6
24
11
FY2019 FY2020 FY2021
Mobile core expansion & new elements
77%
65% 73
%
FY2019 FY2020 FY2021
Site backhaul Fibre Ratio2
859
375
9
434
2
FY2019 FY2020 FY2021
4.5G integrated sites
ExpansionNew
9.7% 8ppts
15.5%
Annual Results Presentation FY2021 14
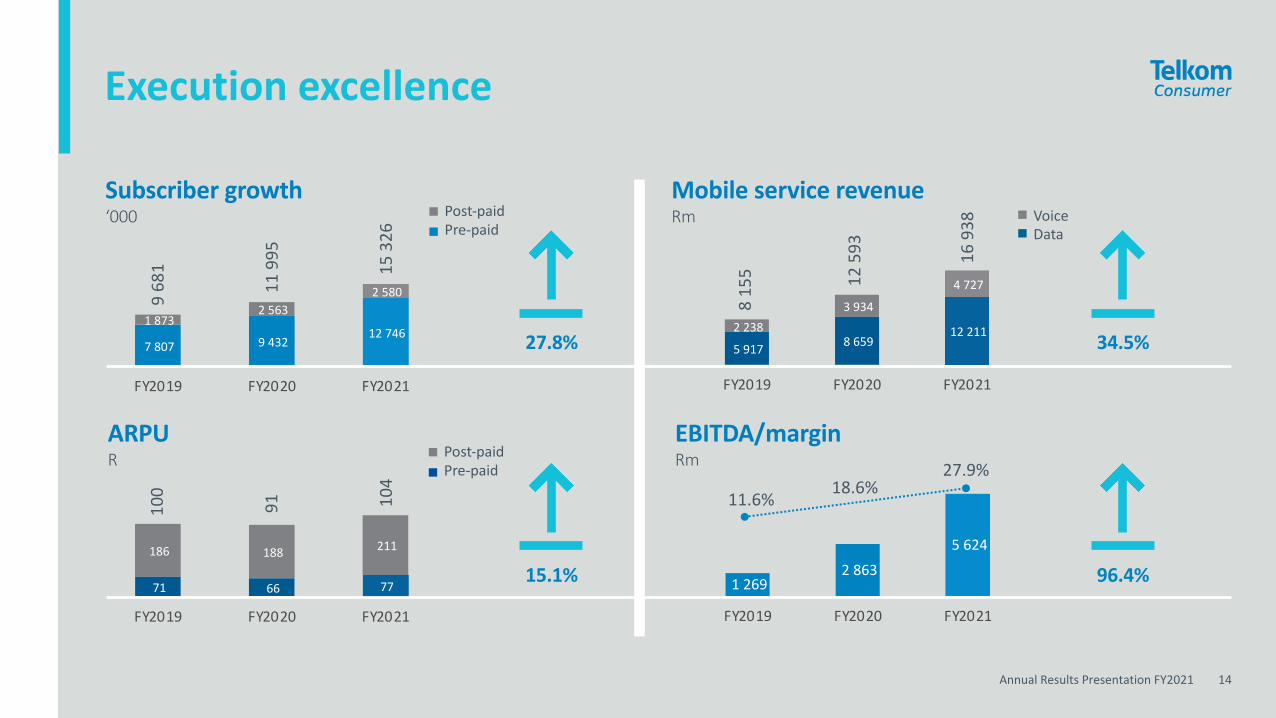
Execution excellence
71 66 77
186 188 211
FY2019 FY2020 FY2021
7 807 9 432 12 746
1 873 2 563
2 580
FY2019 FY2020 FY2021
5 917 8 659 12 211 2 238
3 934
4 727
FY2019 FY2020 FY2021
9 68
1
11 9
95
15 3
26
100
91 104
Subscriber growth‘000
ARPUR
Mobile service revenueRm Voice
Data
8 15
5 12 5
93 16 9
38
Post-paidPre-paid
EBITDA/marginRm
1 269 2 863
5 624
FY2019 FY2020 FY2021
11.6%18.6%
27.9%
15.1%
27.8%
96.4%
34.5%
Post-paidPre-paid

79%of our sites are on fibre
backhaul
Build Digital platforms
Build Financial services
Utilise the fixed business as a springboard for growth
Key strategic focus areas
Annual Results Presentation FY2021 16
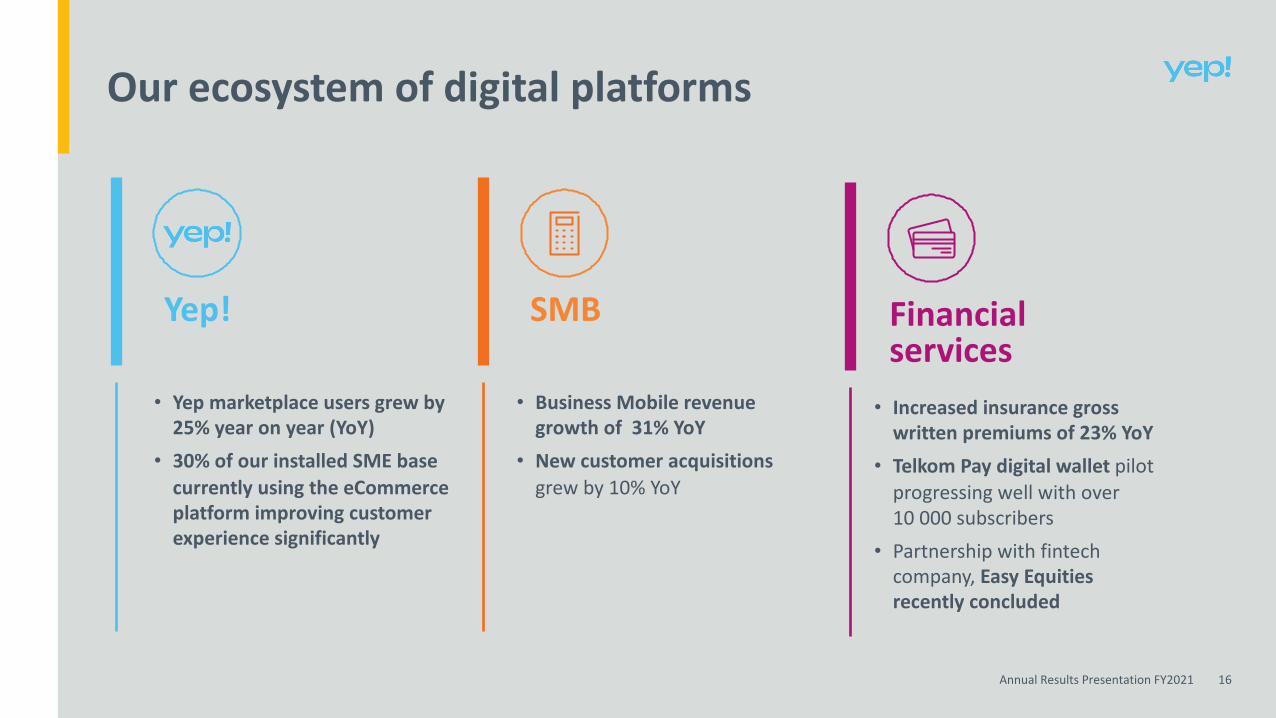
Our ecosystem of digital platforms
Yep! SMB Financial services
• Yep marketplace users grew by 25% year on year (YoY)
• 30% of our installed SME base currently using the eCommerce platform improving customer experience significantly
• Business Mobile revenue growth of 31% YoY
• New customer acquisitions grew by 10% YoY
• Increased insurance gross written premiums of 23% YoY
• Telkom Pay digital wallet pilot progressing well with over 10 000 subscribers
• Partnership with fintech company, Easy Equities recently concluded
Grow IT business
Reduce cost to serve
Key strategic focus areas
Annual Results Presentation FY2021 18
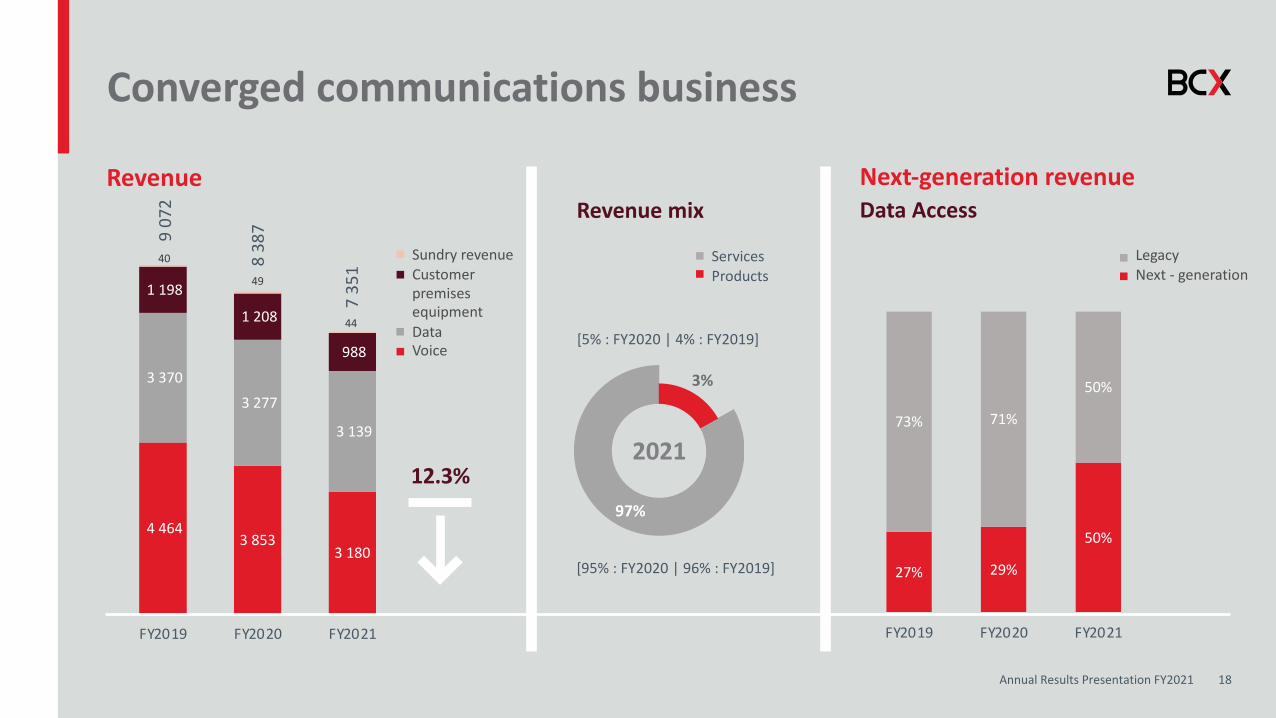
27% 29%
50%
73% 71%
50%
FY2019 FY2020 FY2021
Revenue mix
Converged communications business
Revenue
4 464 3 853
3 180
3 370 3 277
3 139
1 198
1 208
988
40
49
44
FY2019 FY2020 FY2021
9 07
2
8 38
7
7 35
13%
2021
97%
[5% : FY2020 | 4% : FY2019]
[95% : FY2020 | 96% : FY2019]
Next-generation revenueData Access
12.3%
ServicesProducts
LegacyNext - generation
Sundry revenueCustomer premises equipmentDataVoice
Annual Results Presentation FY2021 19
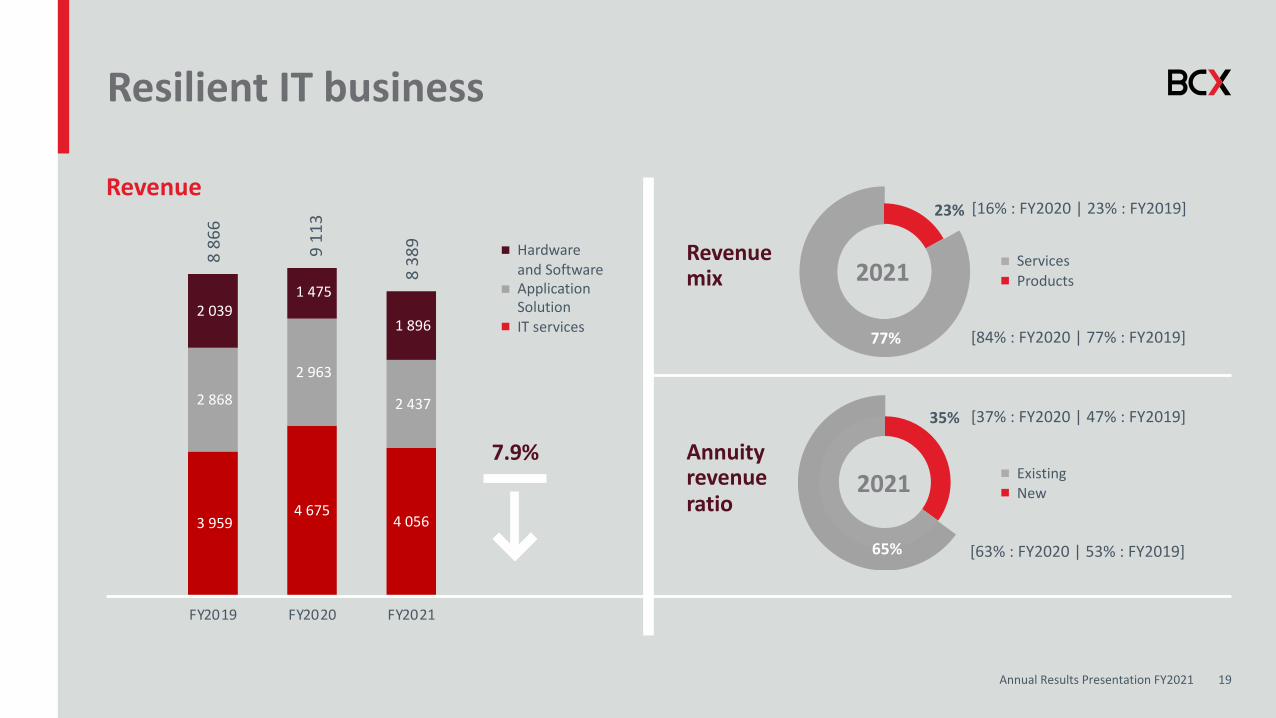
3 959 4 675
4 056
2 868
2 963
2 437
2 039 1 475
1 896
FY2019 FY2020 FY2021
Revenue mix
Resilient IT business
Revenue
Annuity revenue ratio
8 86
6
9 11
3
8 38
9
7.9%
23%
2021
77%
[16% : FY2020 | 23% : FY2019]
[84% : FY2020 | 77% : FY2019]
35%
2021
65%
[37% : FY2020 | 47% : FY2019]
[63% : FY2020 | 53% : FY2019]
ServicesProducts
ExistingNew
Hardwareand SoftwareApplicationSolutionIT services
Annual Results Presentation FY2021 20
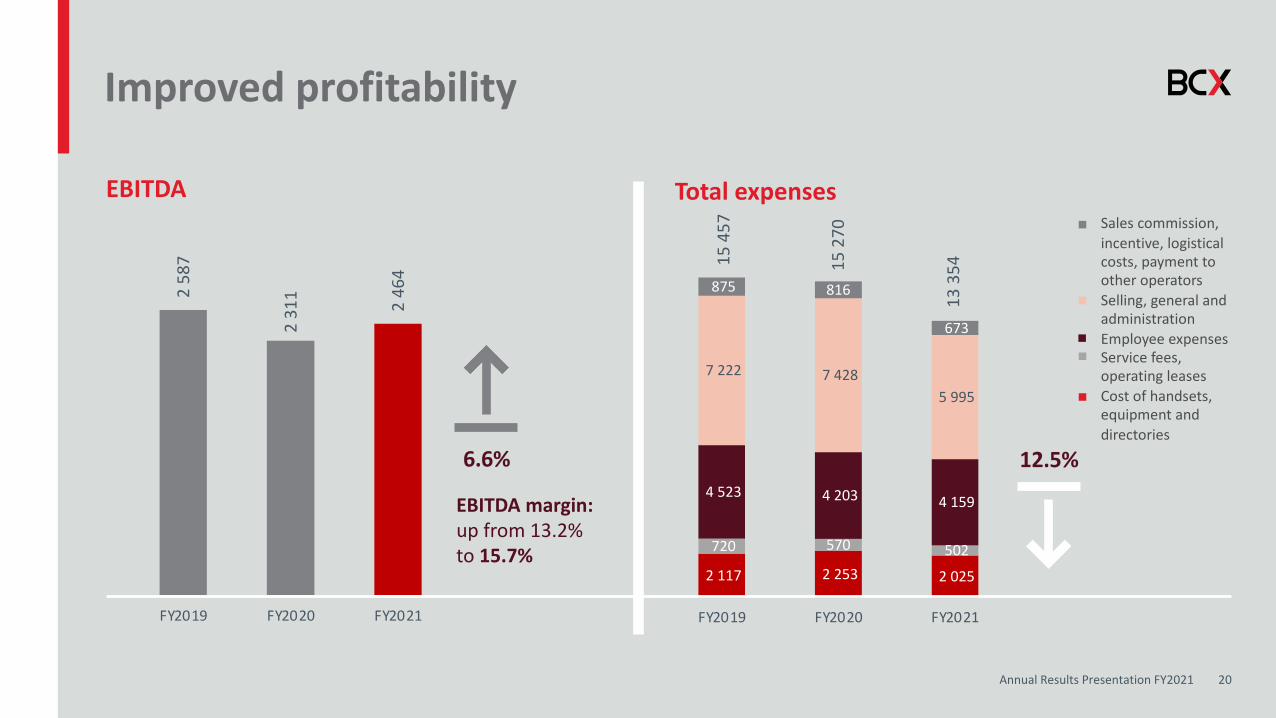
2 117 2 253 2 025
720 570 502
4 523 4 203 4 159
7 222 7 428 5 995
875 816
673
FY2019 FY2020 FY2021
Improved profitability
Total expenses
15 4
57
15 2
70
13 3
54
EBITDA2
587
2 31
1 246
4
FY2019 FY2020 FY2021
EBITDA margin:up from 13.2%to 15.7%
12.5%6.6%
Sales commission, incentive, logistical costs, payment to other operatorsSelling, general and administrationEmployee expensesService fees, operating leasesCost of handsets, equipment and directories
Modernise the network
Commercialise the network
Transforming service delivery
Key strategic focus areas
Annual Results Presentation FY2021 22
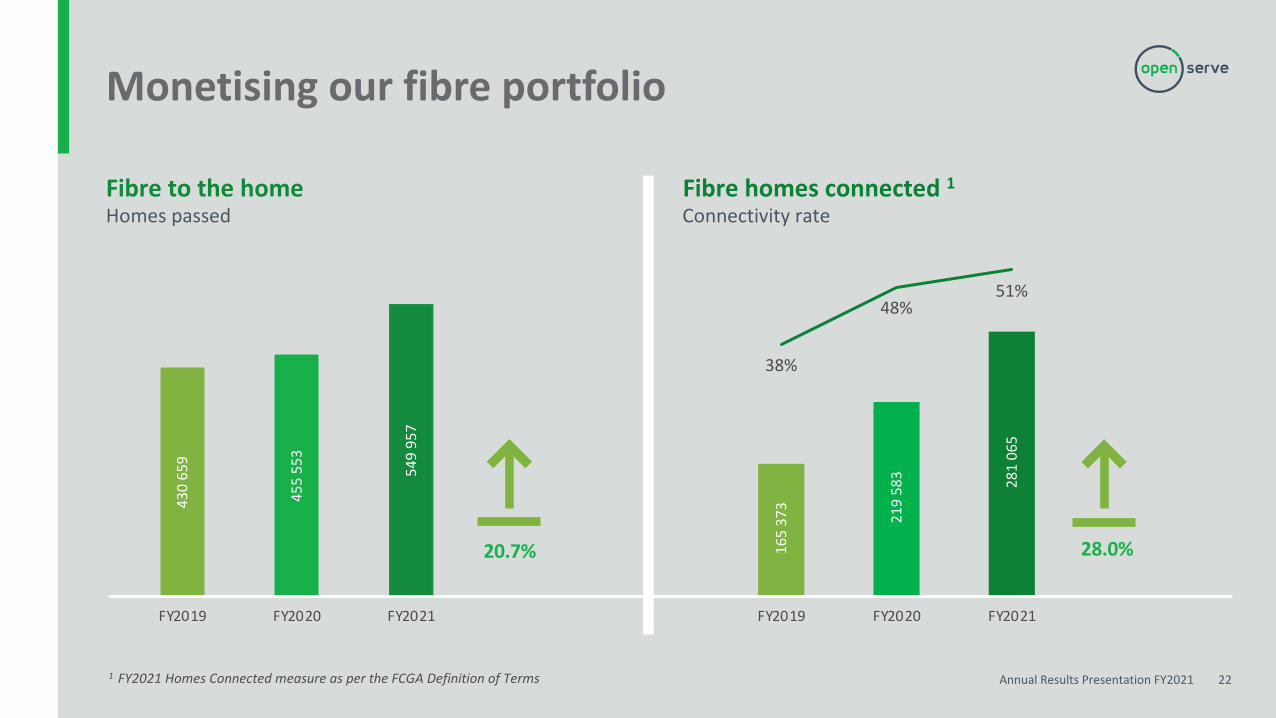
Monetising our fibre portfolio
1 FY2021 Homes Connected measure as per the FCGA Definition of Terms
430
659
455
553
549
957
FY2019 FY2020 FY2021
Fibre to the homeHomes passed
20.7%
Fibre homes connected 1
165
373
219
583 28
106
5
38%
48%51%
-6%
4%
14%
24%
34%
44%
54%
5 0 0 00
1 00 00 0
1 50 00 0
2 00 00 0
2 50 00 0
3 00 00 0
3 50 00 0
FY2019 FY2020 FY2021
28.0%
Connectivity rate
Annual Results Presentation FY2021 23
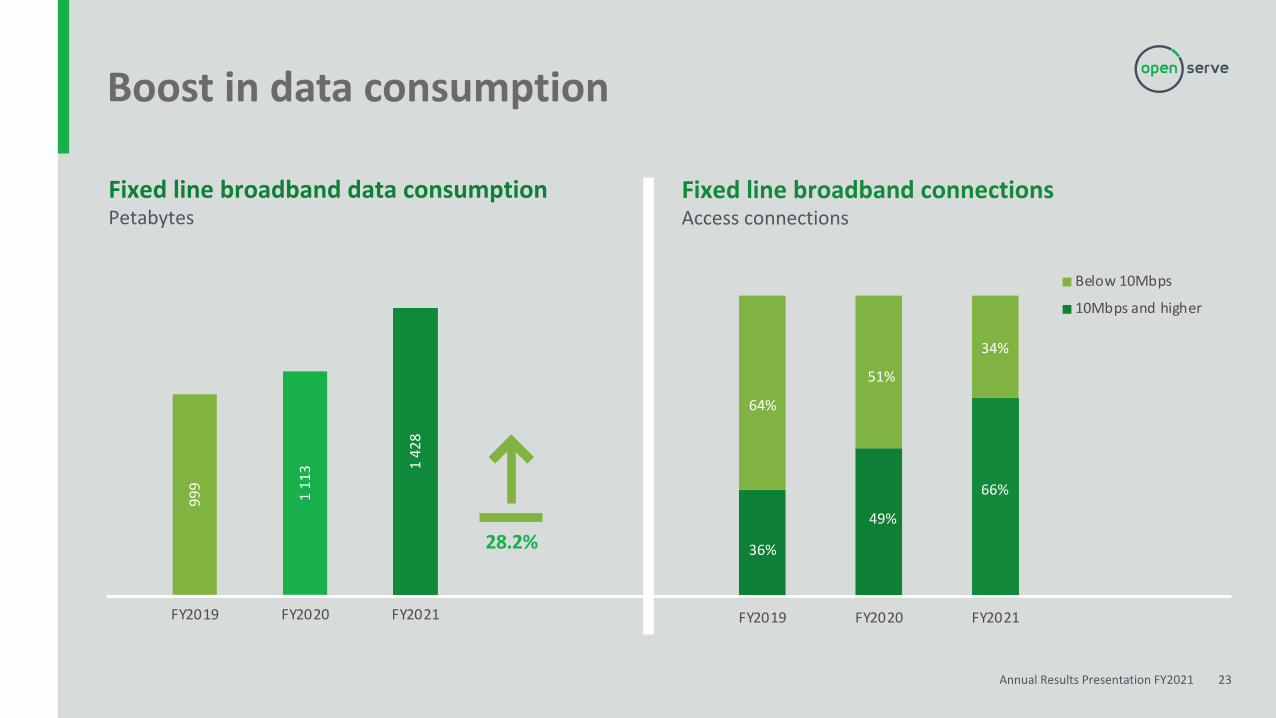
Boost in data consumption
999
111
3 142
8
FY2019 FY2020 FY2021
Fixed line broadband data consumptionPetabytes
Fixed line broadband connectionsAccess connections
28.2%
FY2019 FY2020 FY2021
Below 10Mbps
10Mbps and higher
64%
36%
51%
49%
34%
66%
Annual Results Presentation FY2021 24
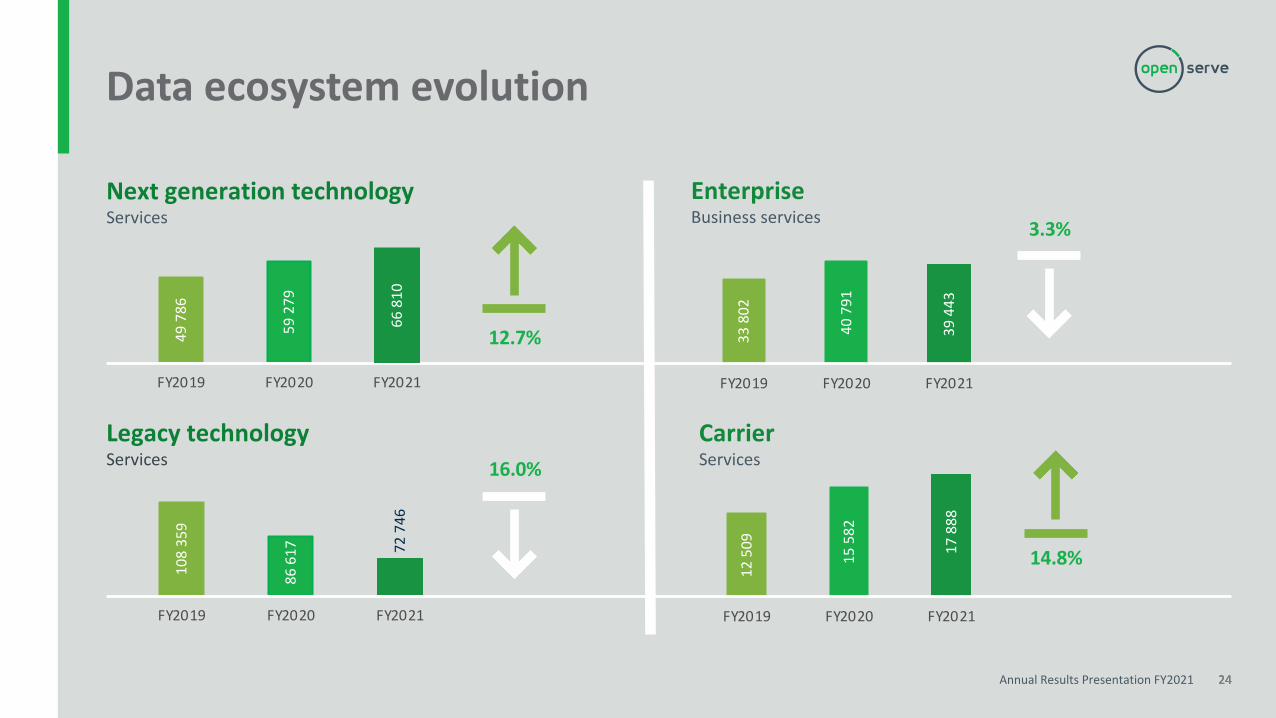
Data ecosystem evolution
2424
33 8
02
40 7
91
39 4
43
FY2019 FY2020 FY2021
12 5
09
15 5
82
17 8
88
FY2019 FY2020 FY2021
14.8%
CarrierServices
EnterpriseBusiness services 3.3%
Next generation technologyServices
49 7
86
59 2
79
66 8
10FY2019 FY2020 FY2021
Legacy technologyServices
108
359
86 6
17 72 7
46
FY2019 FY2020 FY2021
12.7%
16.0%
Annual Results Presentation FY2021 25
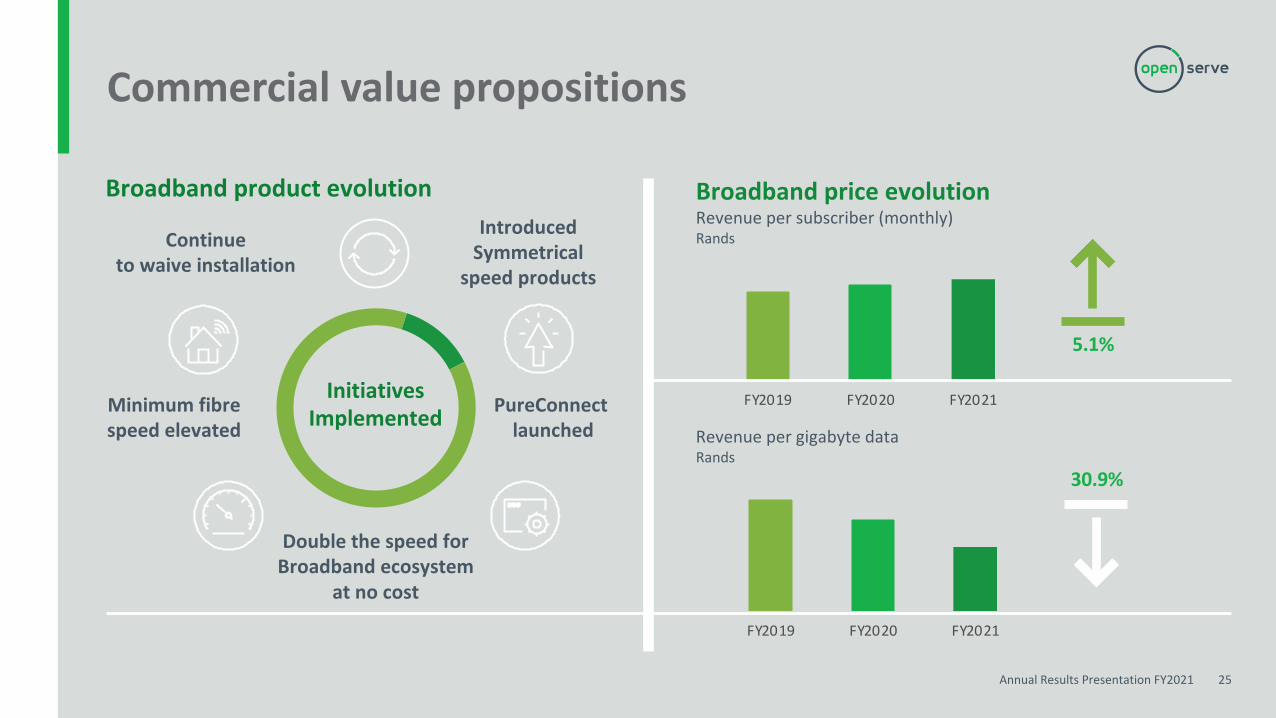
Commercial value propositions
InitiativesImplemented PureConnect
launched
Double the speed for Broadband ecosystem
at no cost
Minimum fibre speed elevated
Introduced Symmetrical
speed products
Continue to waive installation
Broadband product evolution
FY2019 FY2020 FY2021
FY2019 FY2020 FY2021
5.1%
Revenue per gigabyte dataRands
Broadband price evolutionRevenue per subscriber (monthly)Rands
30.9%
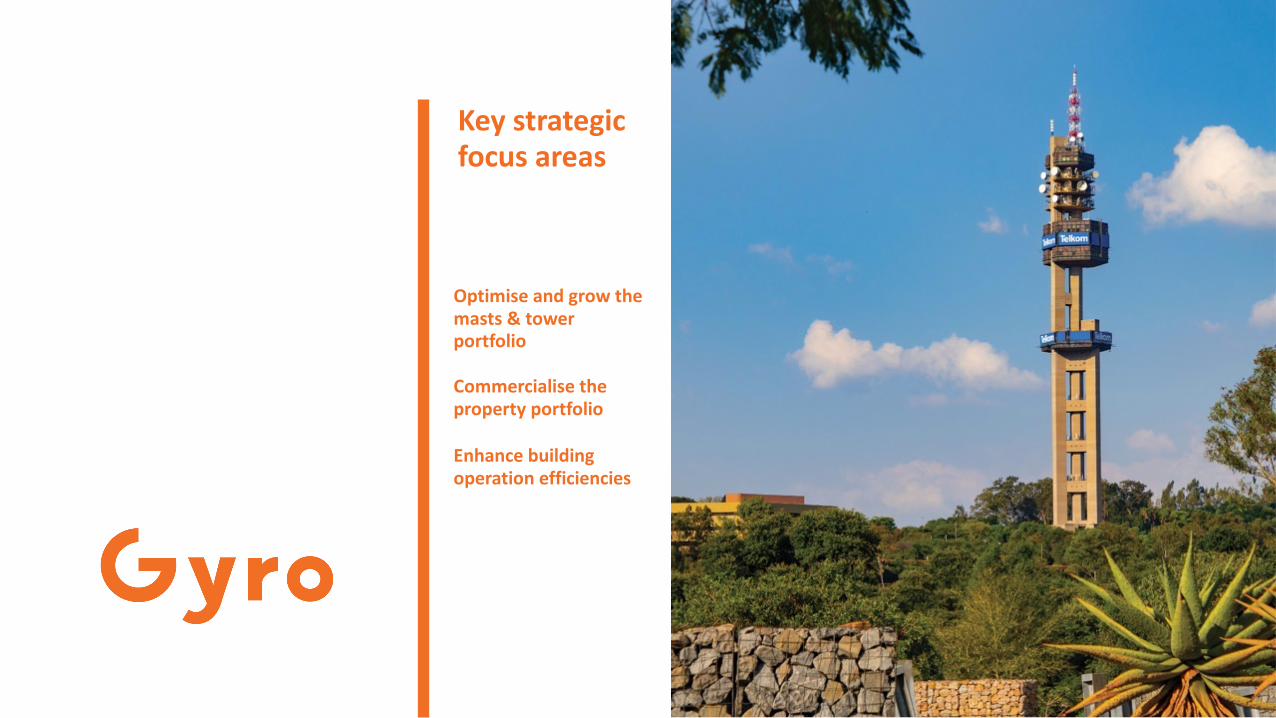
Optimise and grow the masts & tower portfolio
Commercialise the property portfolio
Enhance building operation efficiencies
Key strategic focus areas
Annual Results Presentation FY2021 27
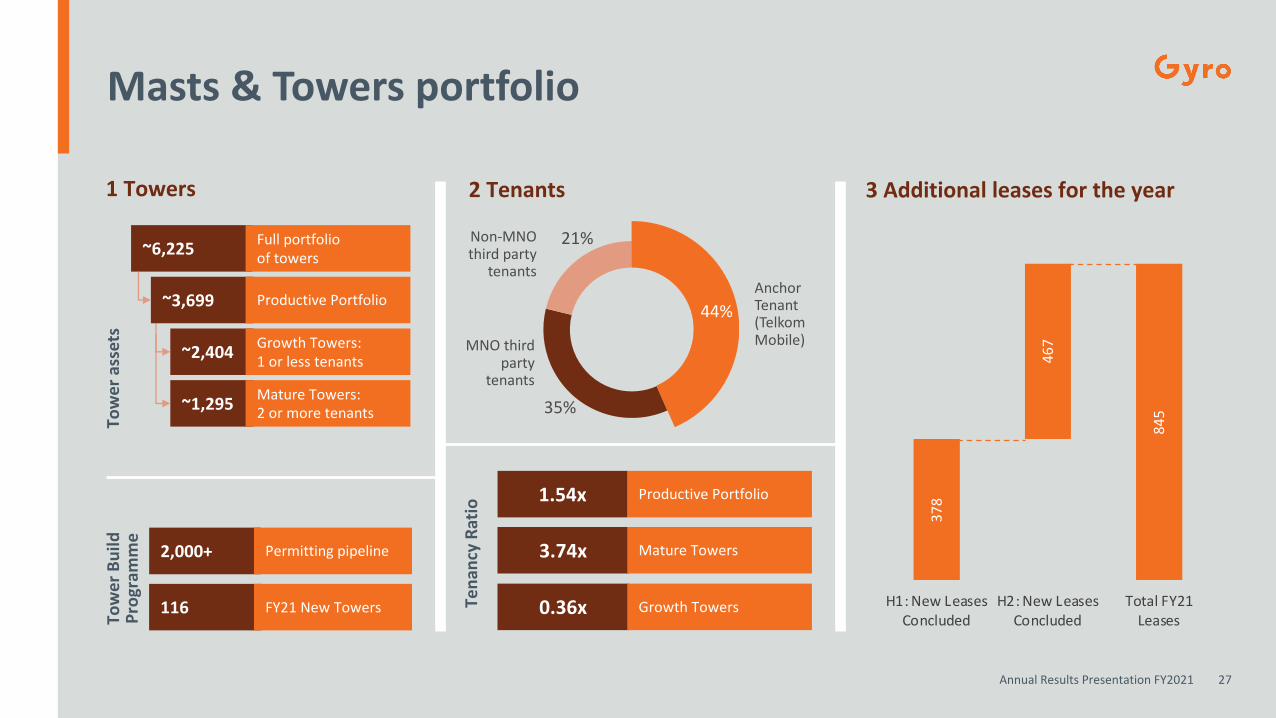
Masts & Towers portfolio
2 Tenants1 Towers
Tow
er B
uild
Pr
ogra
mm
e
2,000+
116
Permitting pipeline
FY21 New Towers Tena
ncy
Ratio
1.54x
3.74x
Productive Portfolio
Mature Towers
0.36x Growth Towers
Tow
er a
sset
s
~6,225
~3,699
Full portfolio of towers
Productive Portfolio
~2,404 Growth Towers: 1 or less tenants
~1,295 Mature Towers: 2 or more tenants
3 Additional leases for the year
378
467
845
H1: New LeasesConcluded
H2: New LeasesConcluded
Total FY21Leases
MNO third party
tenants
AnchorTenant(TelkomMobile)
Non-MNO third party
tenants
44%
21%
35%

Annual Results Presentation FY2021 28
365
807
994
FY2019 FY2020 FY2021
778 1
160
123
7
FY2019 FY2020 FY2021
EBITDARm
46.9
%
69.6
%
80.4
%
FY2019 FY2020 FY2021
419
357
243
FY2019 FY2020 FY2021
EBITDA margin (%)
RevenueRm
Operational expensesRm
6.6%
23.2%
31.9%
10.8 ppts
Commercialising M&T portfolio
Financial overview
4
Annual Results Presentation FY2021 30
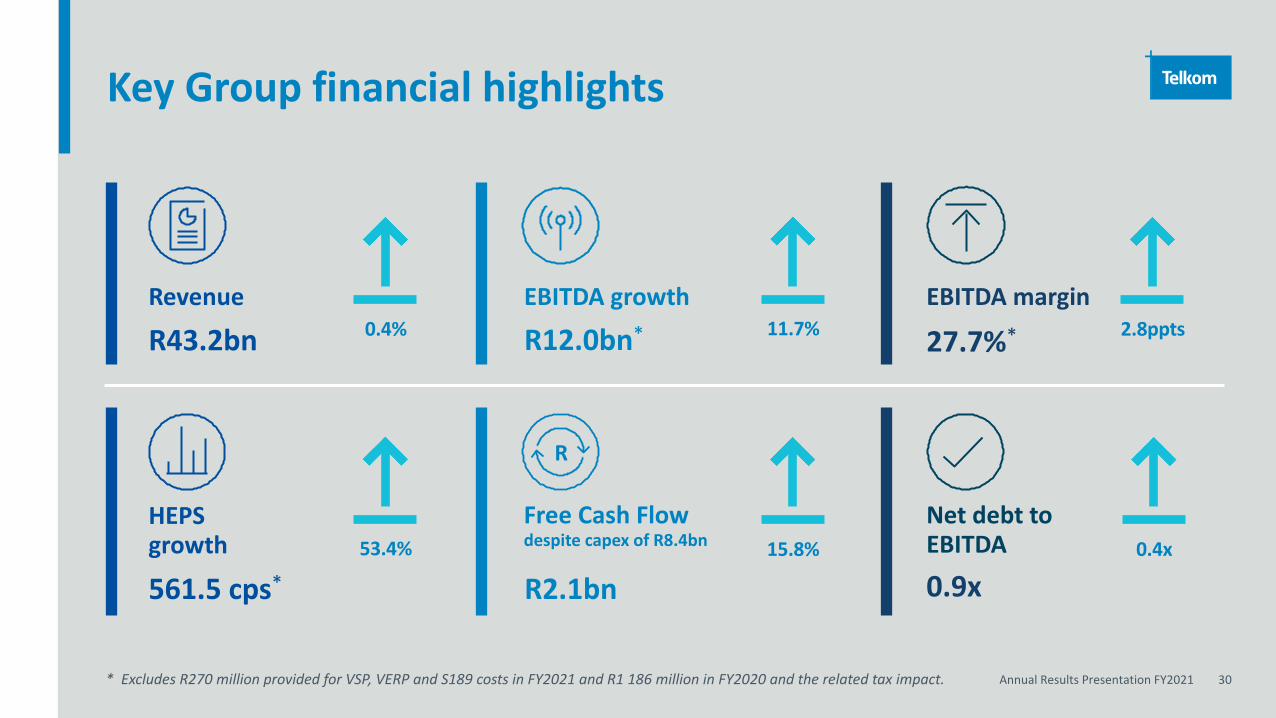
Key Group financial highlights
Revenue
Free Cash Flow despite capex of R8.4bn 15.8%
EBITDA growth 11.7%
HEPS growth
Net debt to EBITDA53.4% 0.4x
0.4%EBITDA margin
2.8pptsR43.2bn
R2.1bn
27.7%*
561.5 cps*
R12.0bn*
0.9x
* Excludes R270 million provided for VSP, VERP and S189 costs in FY2021 and R1 186 million in FY2020 and the related tax impact.
R
Annual Results Presentation FY2021 31
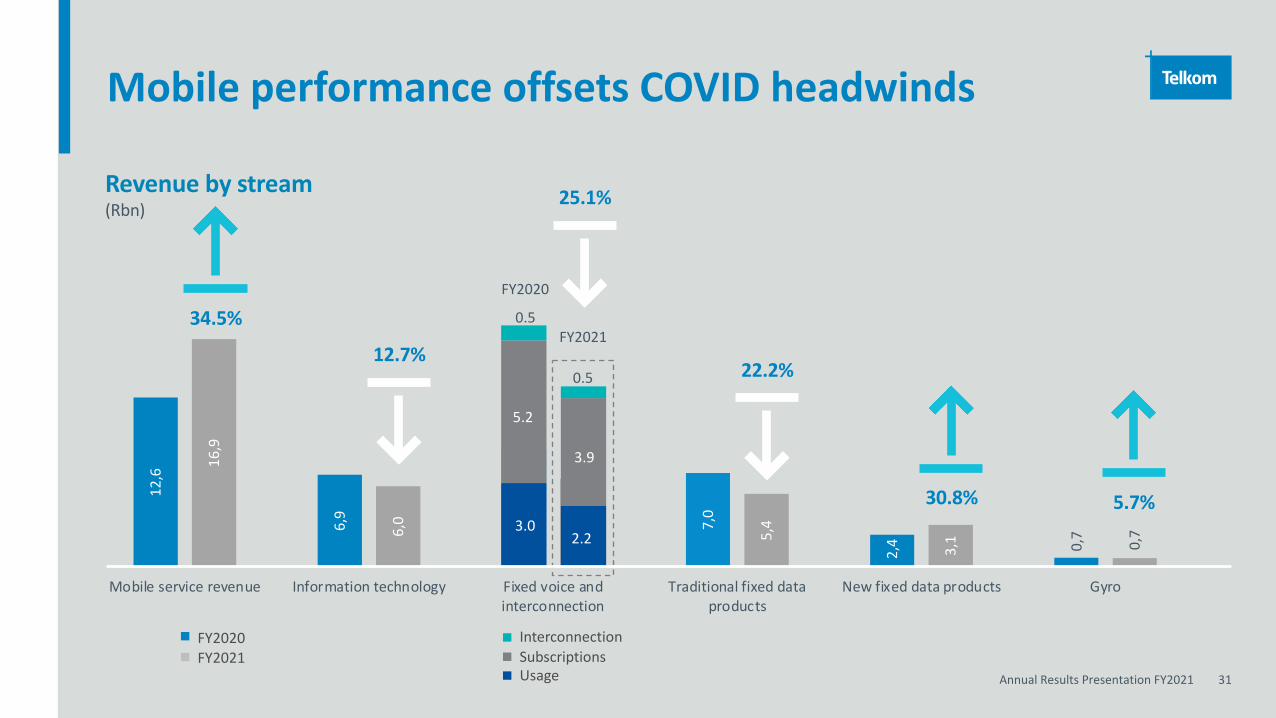
InterconnectionSubscriptionsUsage
12,6
6,9
8,7
7,0
2,4 0,
7
16,9
6,0 6,5
5,4
3,1 0,7
Mobile service revenue Information technology Fixed voice andinterconnection
Traditional fixed dataproducts
New fixed data products Gyro
Mobile performance offsets COVID headwinds
Revenue by stream(Rbn)
FY2020
FY202134.5%
30.8% 5.7%
12.7%
25.1%
22.2%
0.5
0.5
5.2
3.9
3.02.2
FY2020FY2021
Annual Results Presentation FY2021 32
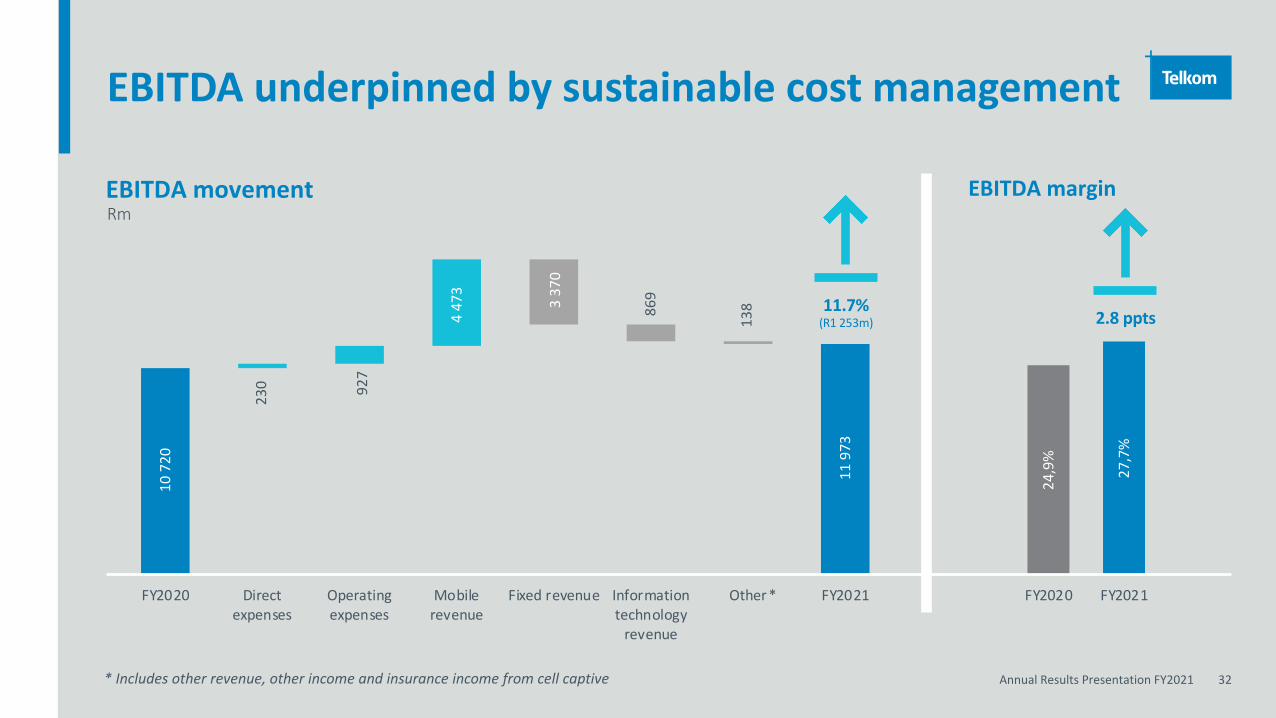
EBITDA underpinned by sustainable cost management
EBITDA movementRm
10 7
20
11 9
73
230 92
7
4 47
3
3 37
0
869
138
FY2020 Directexpenses
Operatingexpenses
Mobilerevenue
Fixed revenue Informationtechnology
revenue
Other FY2021
24,9
%
27,7
%
FY2020 FY2021
EBITDA margin
*
* Includes other revenue, other income and insurance income from cell captive
11.7%(R1 253m) 2.8 ppts
Annual Results Presentation FY2021 33
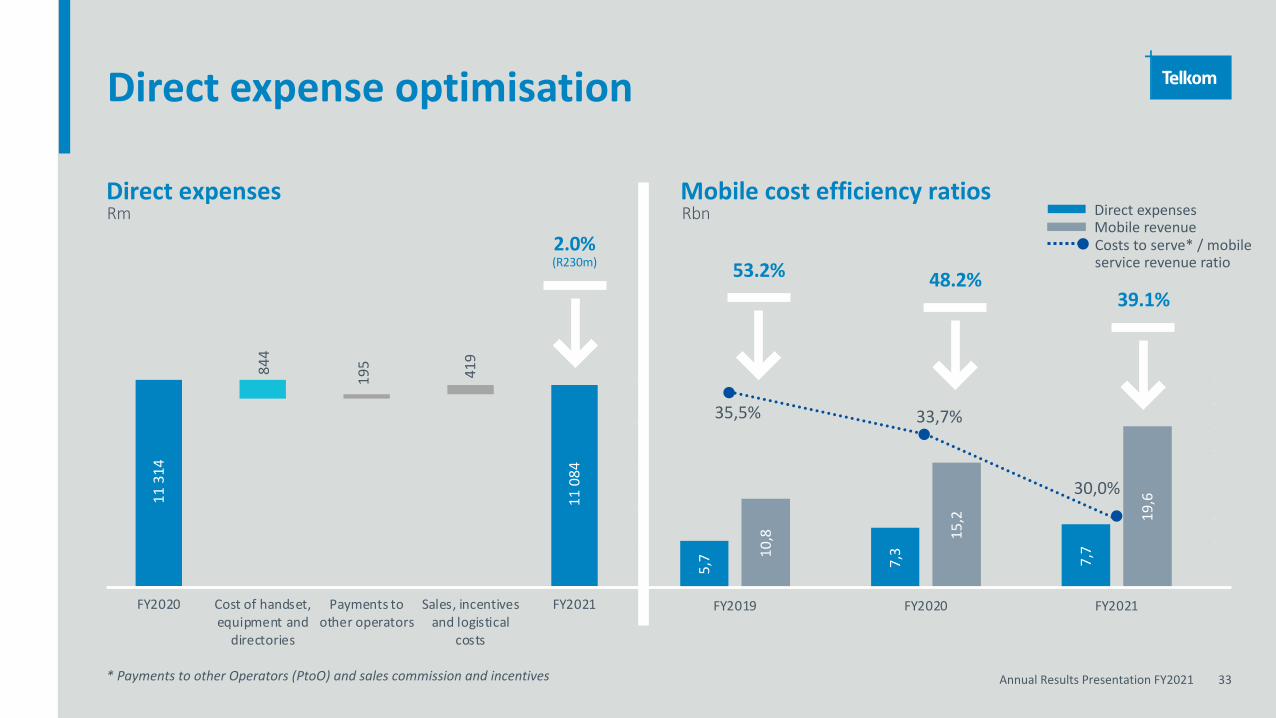
Direct expense optimisation
Direct expenses Mobile cost efficiency ratios Rbn
11 3
14
11 0
84
844
419
FY2020 Cost of handset,equipment and
directories
Payments toother operators
Sales, incentivesand logistical
costs
FY2021
* Payments to other Operators (PtoO) and sales commission and incentives
195
5,7 7,3
7,710
,8 15,2 19
,6
35,5% 33,7%
30,0%
2 7,0 %
2 8,0 %
2 9,0 %
3 0,0 %
3 1,0 %
3 2,0 %
3 3,0 %
3 4,0 %
3 5,0 %
3 6,0 %
0 ,0
5 ,0
1 0,0
1 5,0
2 0,0
2 5,0
FY2019 FY2020 FY2021
Costs to serve* / mobile service revenue ratio
Direct expenses Mobile revenue
2.0% (R230m) 53.2% 48.2%
39.1%
Rm
Annual Results Presentation FY2021 34
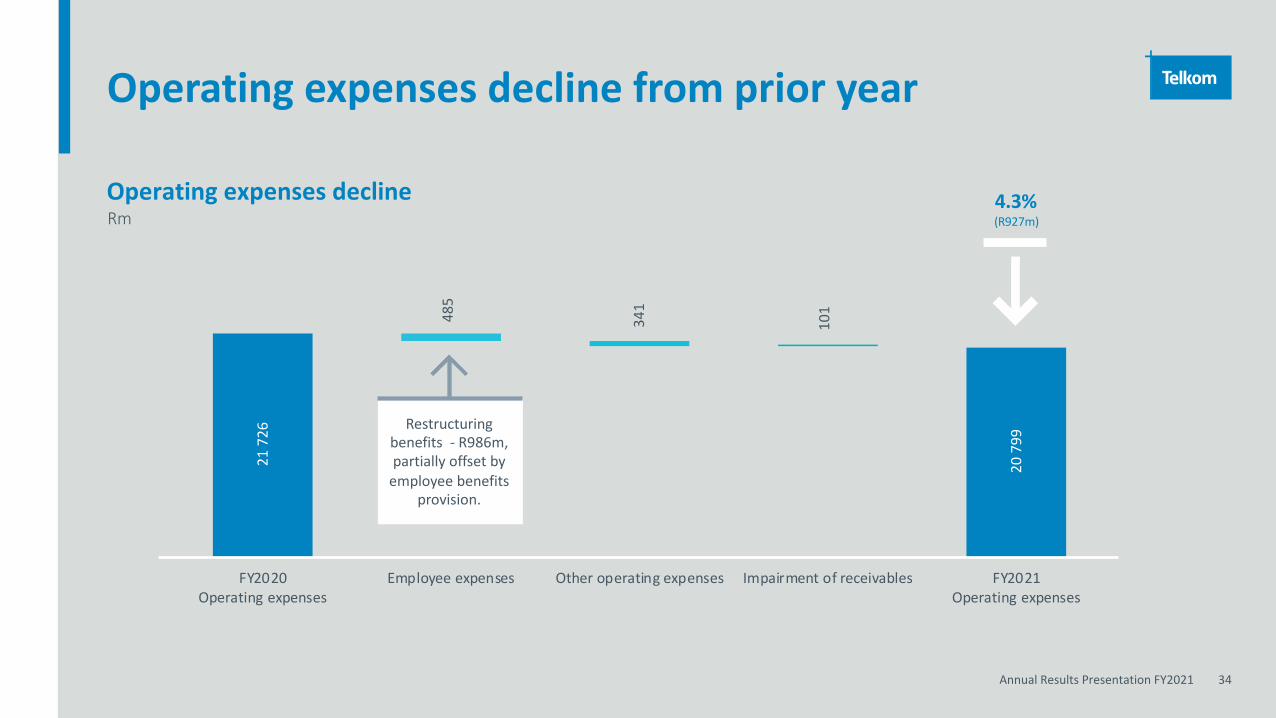
Operating expenses decline from prior year
Operating expenses declineRm
21 7
26
20 7
99
485
341
101
FY2020Operating expenses
Employee expenses Other operating expenses Impairment of receivables FY2021Operating expenses
(R927m)4.3%
Restructuring benefits - R986m, partially offset by
employee benefits provision.
Annual Results Presentation FY2021 35
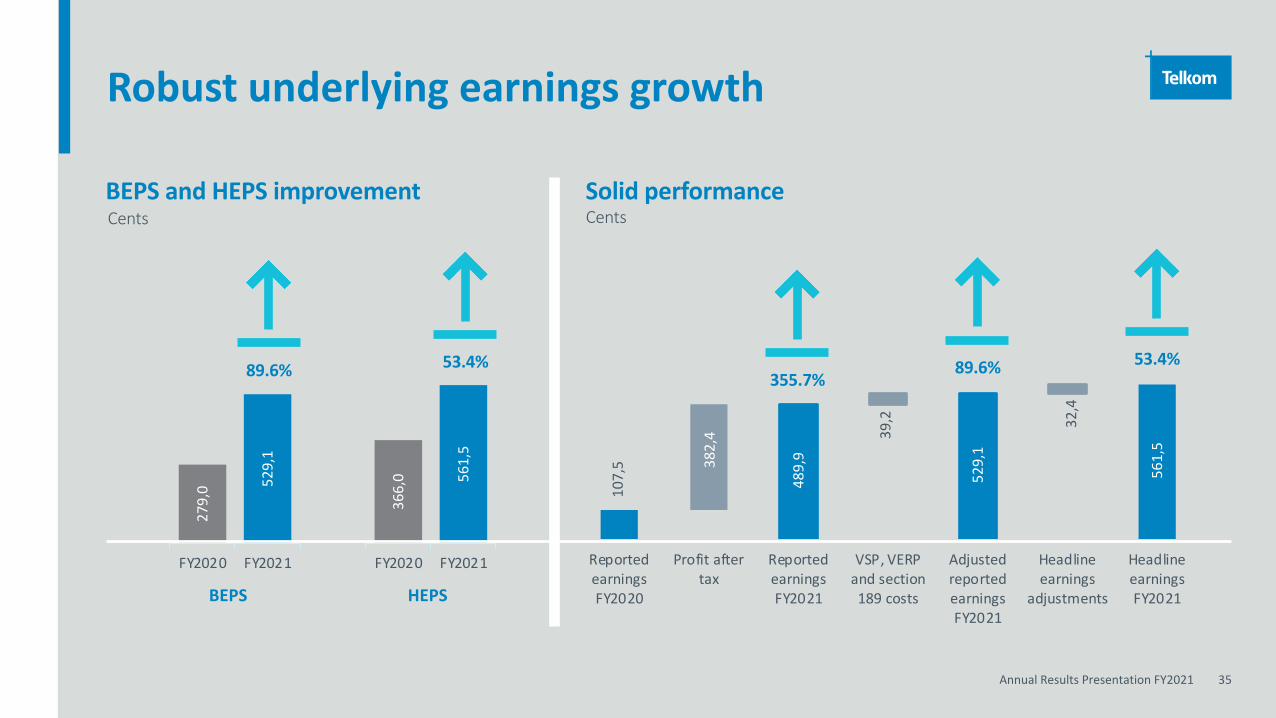
Robust underlying earnings growth
CentsBEPS and HEPS improvement
107,
5 561,
5
382,
4
489,
9
39,2
529,
1
32,4
ReportedearningsFY2020
Profit aftertax
ReportedearningsFY2021
VSP, VERPand section189 costs
AdjustedreportedearningsFY2021
Headlineearnings
adjustments
HeadlineearningsFY2021
Solid performanceCents
279,
0 529,
1
FY2020 FY2021
366,
0 561,
5
FY2020 FY2021
BEPS HEPS
53.4% 53.4%89.6% 89.6%355.7%
Annual Results Presentation FY2021 36
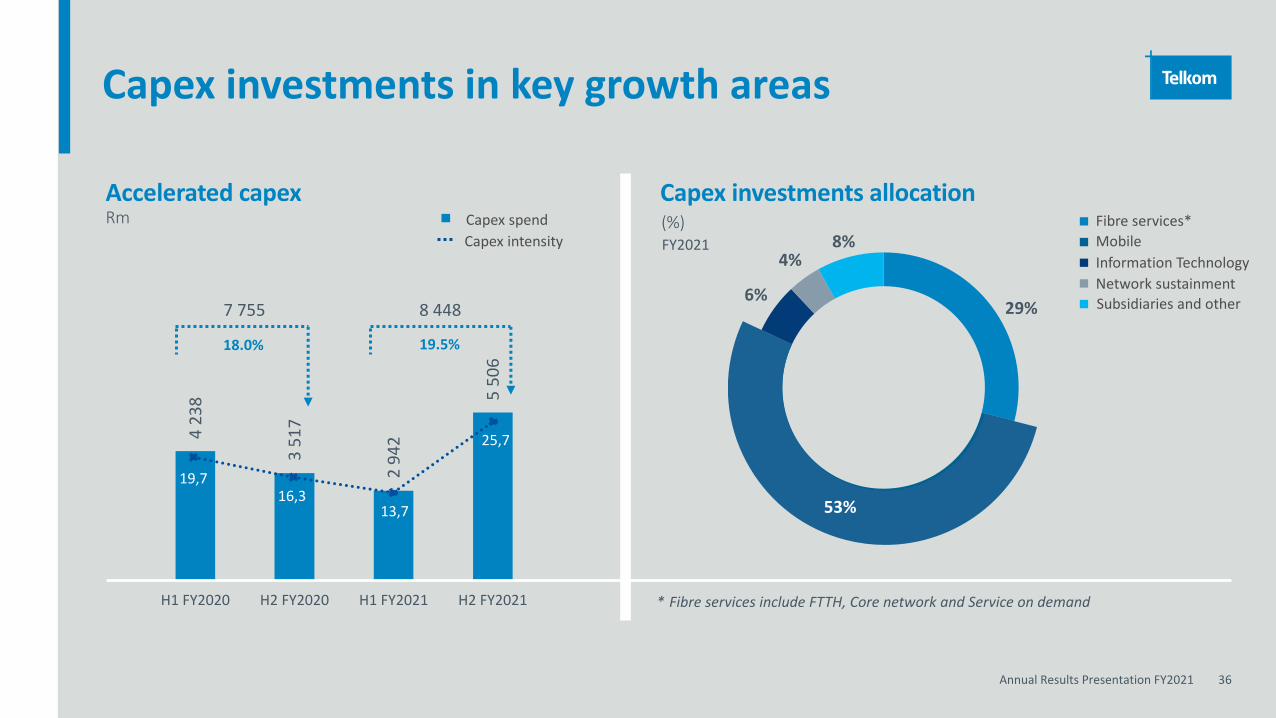
423
8
351
7
294
2
550
6
H1 FY2020 H2 FY2020 H1 FY2021 H2 FY2021
19,716,3
13,7
25,7
Capex investments in key growth areas
RmAccelerated capex Capex investments allocation
FY2021(%)
* Fibre services include FTTH, Core network and Service on demand
6%
4%8%
29%
53%
18.0% 19.5%
7 755 8 448
Fibre services*MobileInformation TechnologyNetwork sustainmentSubsidiaries and other
Capex spendCapex intensity
Annual Results Presentation FY2021 37
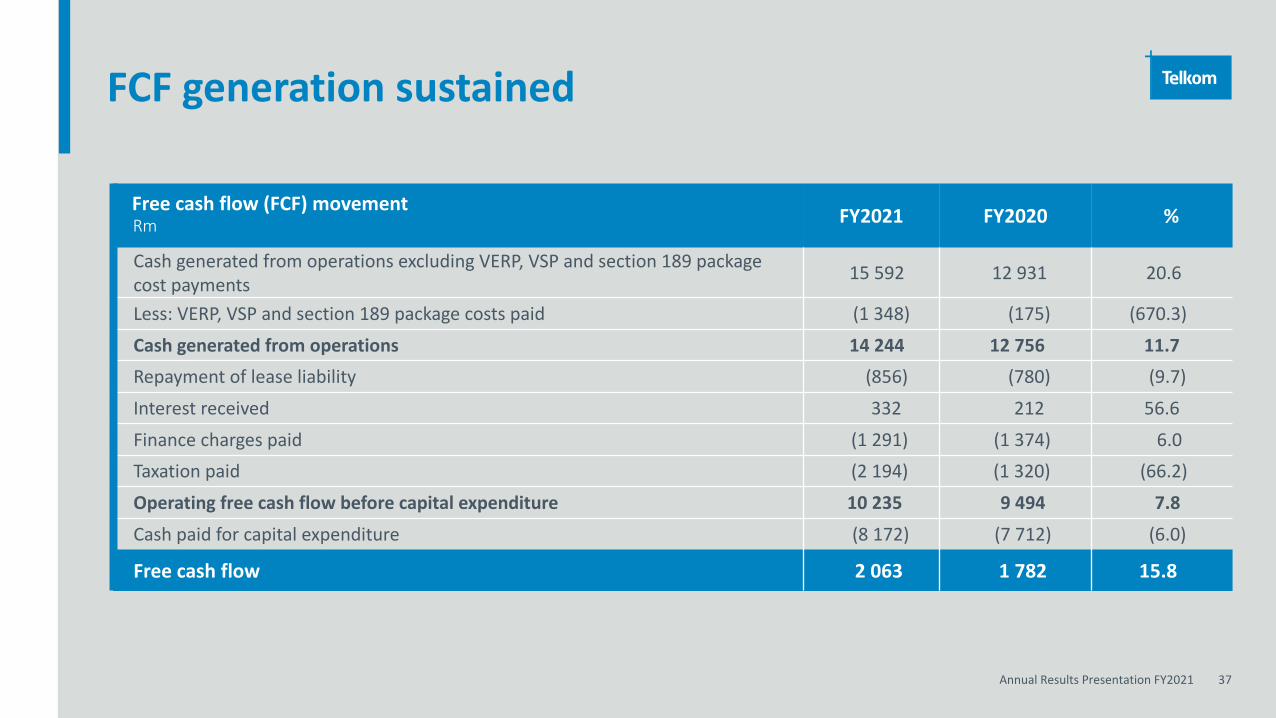
FCF generation sustained
Free cash flow (FCF) movementRm FY2021 FY2020 %
Cash generated from operations excluding VERP, VSP and section 189 package cost payments 15 592 12 931 20.6
Less: VERP, VSP and section 189 package costs paid (1 348) (175) (670.3)
Cash generated from operations 14 244 12 756 11.7Repayment of lease liability (856) (780) (9.7)
Interest received 332 212 56.6
Finance charges paid (1 291) (1 374) 6.0Taxation paid (2 194) (1 320) (66.2)
Operating free cash flow before capital expenditure 10 235 9 494 7.8
Cash paid for capital expenditure (8 172) (7 712) (6.0)
Free cash flow 2 063 1 782 15.8
Annual Results Presentation FY2021 38
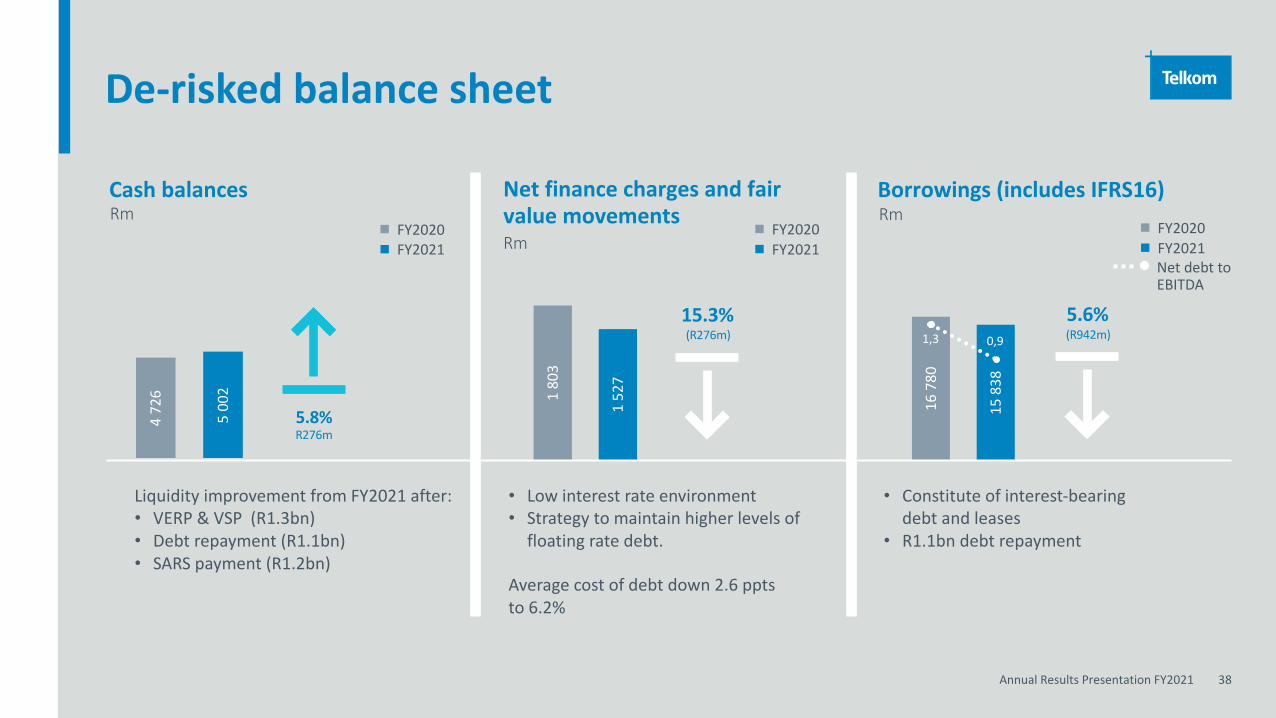
1678
0
1583
8
De-risked balance sheet
Cash balances Borrowings (includes IFRS16)Rm
472
6
500
2
Net finance charges and fair value movementsRm
FY2020FY2021
180
3
152
7
Rm
(R276m)15.3%
(R942m)5.6%
5.8%R276m
Liquidity improvement from FY2021 after:• VERP & VSP (R1.3bn)• Debt repayment (R1.1bn)• SARS payment (R1.2bn)
• Low interest rate environment • Strategy to maintain higher levels of
floating rate debt.
Average cost of debt down 2.6 ppts to 6.2%
• Constitute of interest-bearing debt and leases
• R1.1bn debt repayment
1,3 0,9
Net debt to EBITDA
FY2020FY2021
FY2020FY2021
Financial outlook
5
Annual Results Presentation FY2021 40
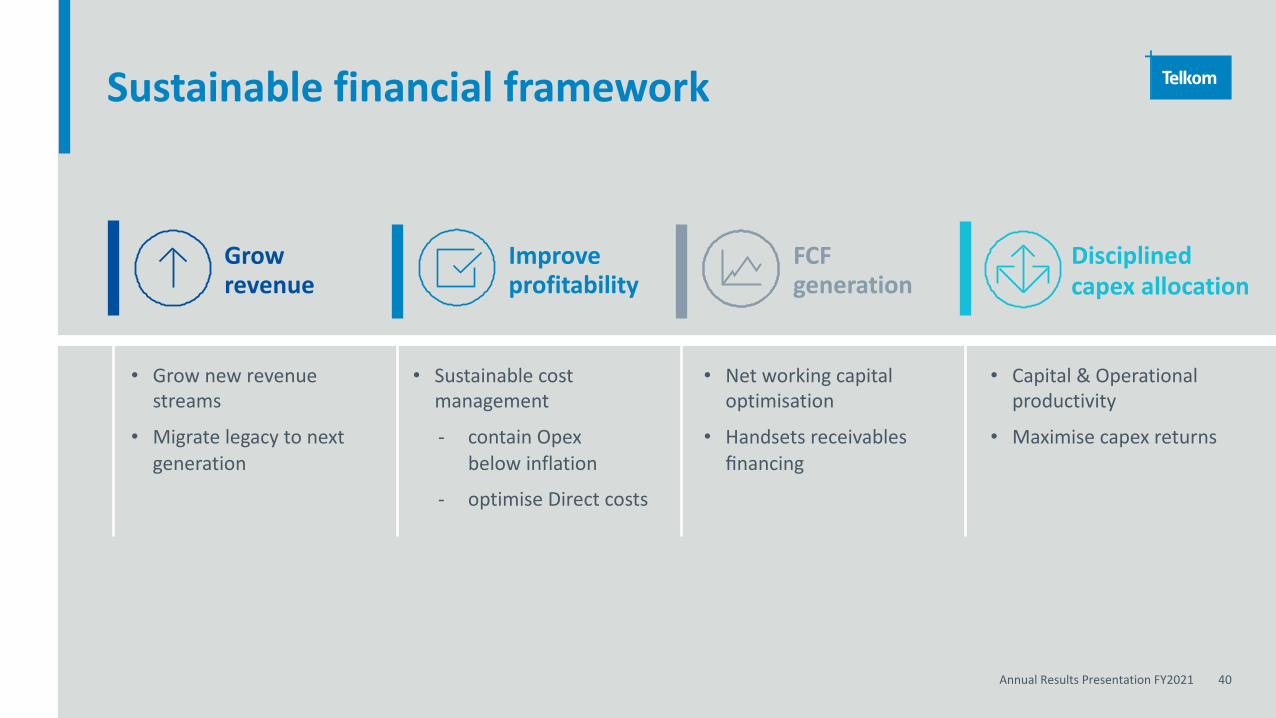
Sustainable financial framework
Grow revenue
Improve profitability
FCF generation
Disciplined capex allocation
• Grow new revenue streams
• Migrate legacy to next generation
• Sustainable cost management
- contain Opexbelow inflation
- optimise Direct costs
• Net working capital optimisation
• Handsets receivables financing
• Capital & Operational productivity
• Maximise capex returns
Annual Results Presentation FY2021 41
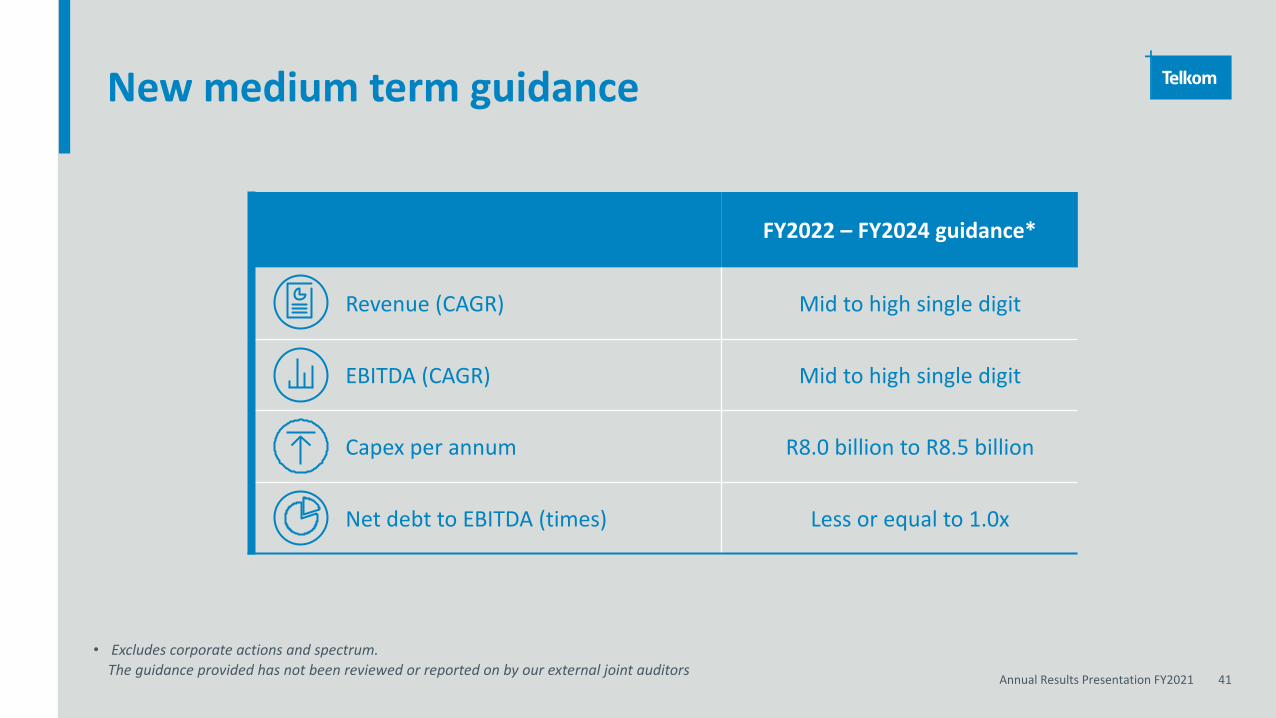
New medium term guidance
• Excludes corporate actions and spectrum. The guidance provided has not been reviewed or reported on by our external joint auditors
FY2022 – FY2024 guidance*
Revenue (CAGR) Mid to high single digit
EBITDA (CAGR) Mid to high single digit
Capex per annum R8.0 billion to R8.5 billion
Net debt to EBITDA (times) Less or equal to 1.0x
Annual Results Presentation FY2021 42
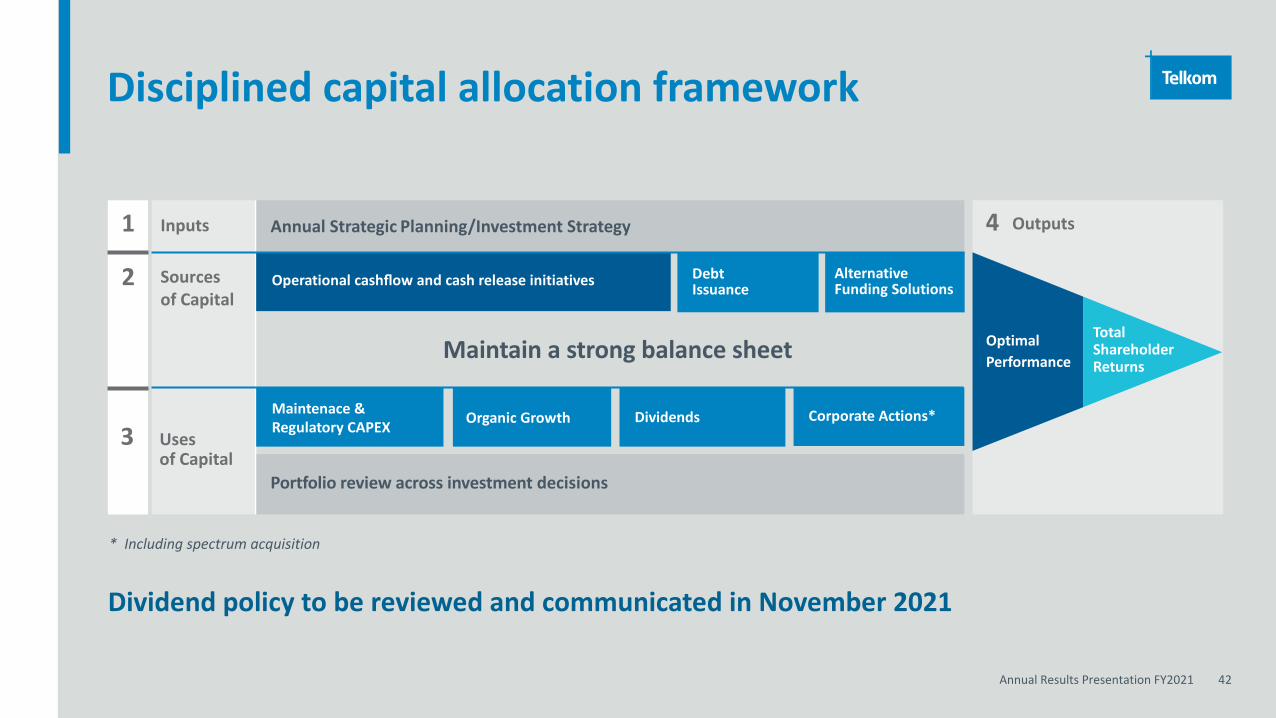
Disciplined capital allocation framework
Dividend policy to be reviewed and communicated in November 2021
Maintain a strong balance sheet
Portfolio review across investment decisions
Outputs
2
4
Operational cashflow and cash release initiatives
Maintenace & Regulatory CAPEX Organic Growth Corporate Actions*
Debt Issuance
Alternative Funding Solutions
Total Shareholder Returns
OptimalPerformance
Annual Strategic Planning/Investment Strategy
Sources of Capital
Inputs
Dividends Uses of Capital
2
1
3
* Including spectrum acquisition
Value unlock
6
Annual Results Presentation FY2021 44
Value unlock initiatives
Masts and Towers
Openserve Separation
Data Centres

Annual Results Presentation FY2021 45
Mast and Towers value unlock journey
Established a Masts & TowerCo
Market sounding exercise
• Sale a leaseback from TKG to Gyro Masts & Tower
• Commercialised the portfolio
• Independent valuation
• Exploring different options
• Maximise shareholder value
• Enhance Telkom M&T strategy
Annual Results Presentation FY2021 46
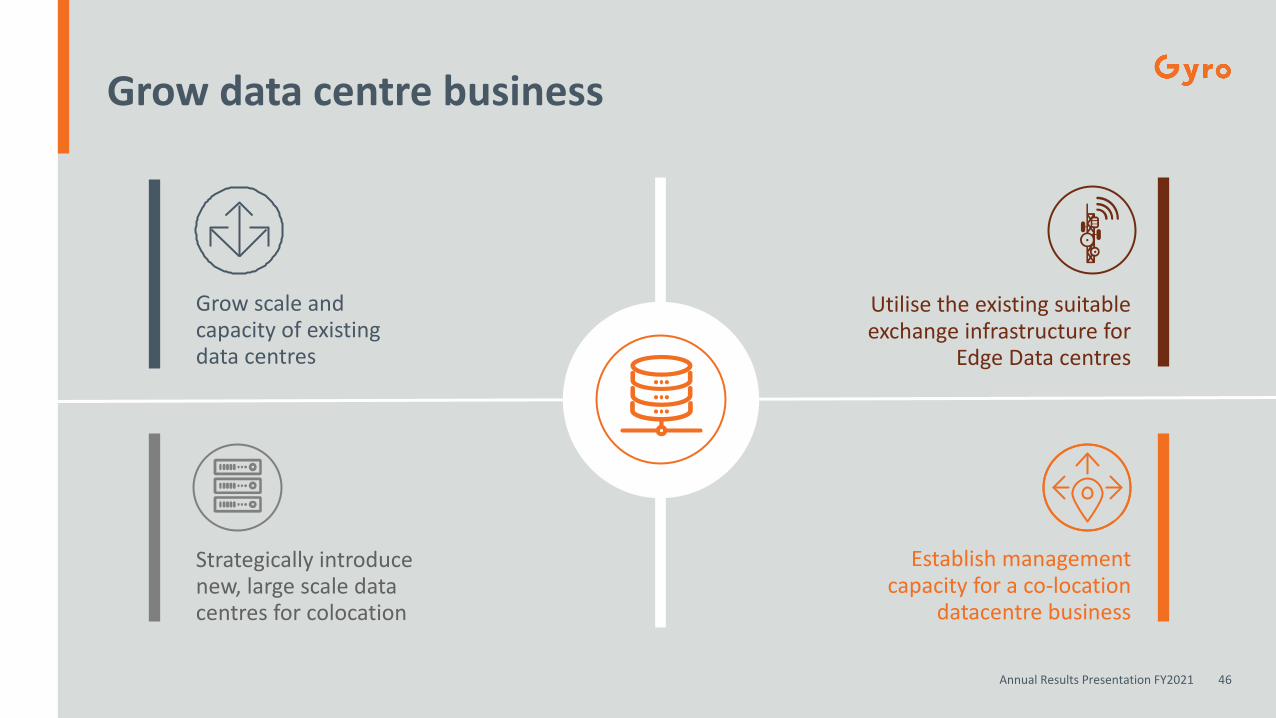
Utilise the existing suitable exchange infrastructure for
Edge Data centres
Strategically introduce new, large scale data centres for colocation
Grow scale and capacity of existing data centres
Establish management capacity for a co-location
datacentre business
Grow data centre business
Annual Results Presentation FY2021 47
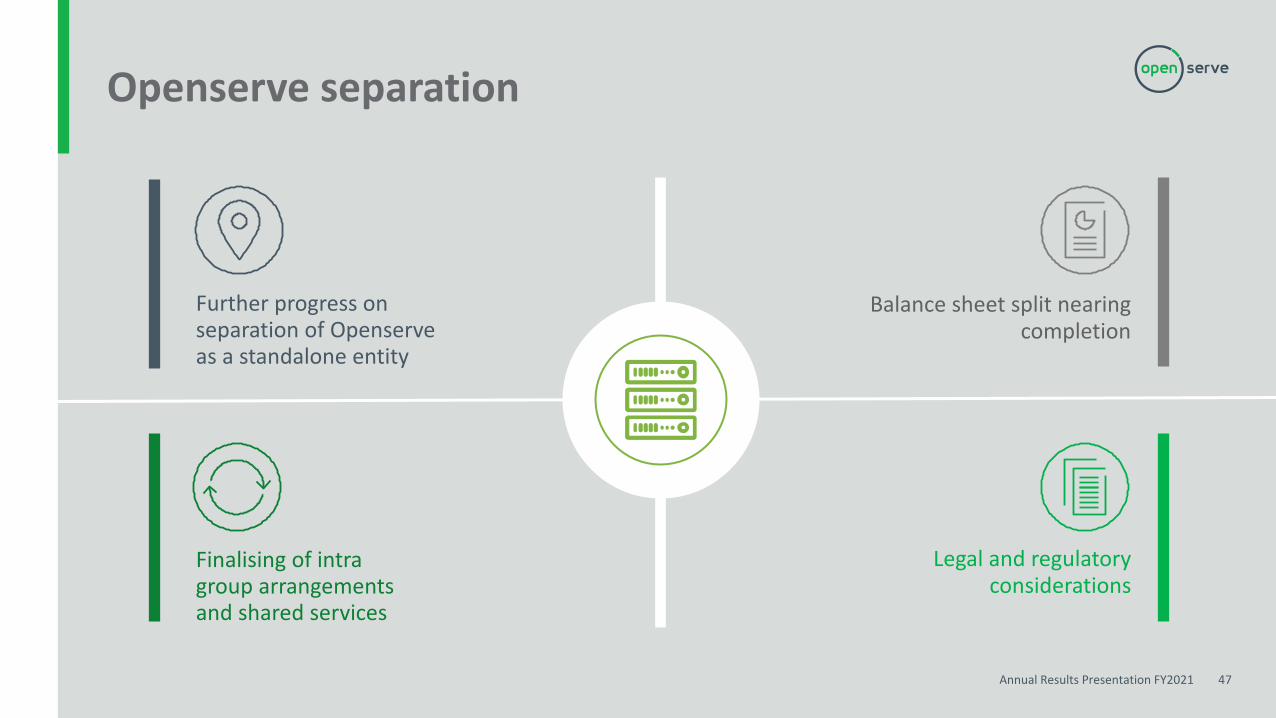
Balance sheet split nearing completion
Finalising of intra group arrangements and shared services
Further progress on separation of Openserve as a standalone entity
Legal and regulatory considerations
Openserve separation
Outlook
7
Annual Results Presentation FY2021 49
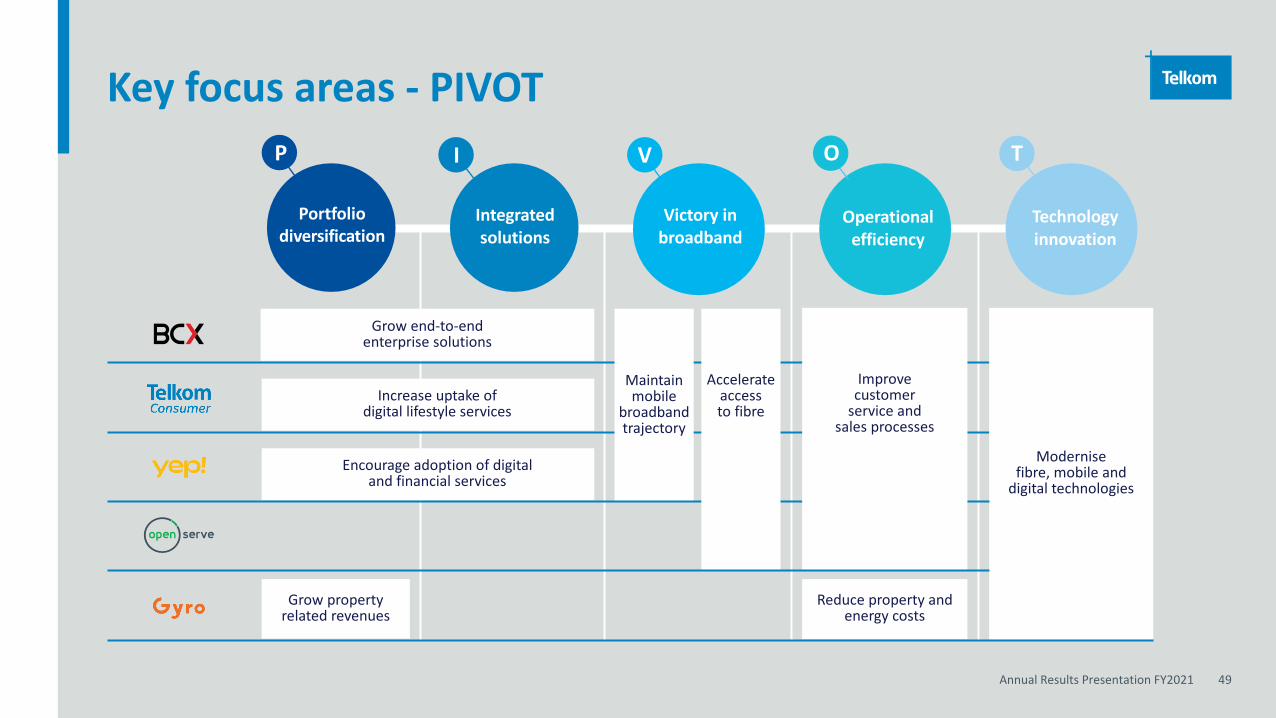
Key focus areas - PIVOT
Integrated solutions
Victory in broadband
Operational efficiency
Technologyinnovation
P
Portfoliodiversification
I V OO T
Grow end-to-endenterprise solutions
Increase uptake of digital lifestyle services
Encourage adoption of digital and financial services
Grow property related revenues
Reduce property and energy costs
Maintain mobile
broadbandtrajectory
Modernise fibre, mobile and
digital technologies
Accelerate access to fibre
Improve customer
service and sales processes
Thank youQ&A