202429orig1s000 - food and drug administration · 202429orig1s000 clinical ... relevant...
TRANSCRIPT

CENTER FOR DRUG EVALUATION AND RESEARCH
APPLICATION NUMBER:
202429Orig1s000
CLINICAL PHARMACOLOGY AND BIOPHARMACEUTICS REVIEW(S)

NDA BIOPHARMACEUTICS REVIEW Office of New Drugs Quality Assessment
Application No. NDA 202-429
Division Division of Drug Oncology Products
Reviewer Deepika Arora Lakhani, Ph.D
Sponsor Hoffman-La Roche Inc. Team Leader Angelica Dorantes, Ph.D Trade Name Zelboraf Supervisor Patrick J. Marroum, Ph.D
Generic Name Vemurafenib (RO5185426) Date Assigned April 14, 2011 Indication For the treatment of
Unresectable Stage IIIc or Stage IV BRAF mutation- positive melanoma by the cobas% 4800 BRAF V600 Mutation Test
Date of Review June 20, 2011
Formulation Tablet/ 240 mg Route of Administration Oral
SUBMISSIONS REVIEWED IN THIS DOCUMENT
Submission Date CDER Stamp Date
Date of Informal/Formal Consult
Internal Meeting
March 21, 2011 March 21, 2011 NA NA Type of Submission Original NDA 505 b(1)
REVIEW SUMMARY: NDA 202-429 was submitted in accordance with 21 CFR Part 314.50 for use of vemurafenib (RO5185426) for the treatment of unresectable Stage IIIC or Stage IV BRAF mutation-positive melanoma by the cobas° 4800 BRAF V600 Mutation Test. The application was granted an expedited review with a rolling submission. RO5185426 is a novel small molecule with the polymorphic Form II being the most stable polymorphic form with poor aqueous solubility and low bioavailability compared to Form I. The solubility of Form II at physiological pHs To overcome the low solubility and poor bioavailability of crystalline RO5185426- 000 Form II, a non-crystalline solid dispersion was developed using anti-solvent controlled precipitation.
The drug product is film-coated tablets 240 mg that are oval, biconvex, pinkish white to orange white film-coated tablets with VEM engraved on one side.
The proposed dose of vemurafenib in adult patients is 960 mg (four 240 mg tablets) twice daily. BIOPHARMACEUTICS: From the Biopharmaceutics perspective, an in-vitro dissolution test for RO5185426 film-coated tablets 240 mg was developed.
Reference ID: 2971380
(b) (4)
(b) (4)
(b) (4)
(b) (4)

2
RECOMMENDATION: From a biopharmaceutics perspective, the application is recommended for approval. The dissolution method development is deemed adequate to support the dissolution of the immediate-release film coated 240 mg Vemurafenib (RO5185426) tablets.
Deepika Arora Lakhani, Ph.D. Patrick Marroum, Ph.D. Biopharmaceutics Reviewer Biopharmaceutics Supervisor Office of New Drugs Quality Assessment Office of New Drugs Quality Assessment cc: List electronically filed in DARRTS
Reference ID: 2971380
(b) (4)
(b) (4)

NDA 202-429 Zelboraf® Tablets, Roche
Biopharmaceutics Review 3
1.0 INTRODUCTION RO5185426 (vemurafenib) is a novel small molecule selective inhibitor of the activated form of the BRAF serine-threonine kinase enzyme for the treatment of unresectable Stage IIIC or Stage IV BRAF mutation-positive melanoma. The drug substance RO5185426-000 is a white crystalline powder and exists in multiple polymorphic forms with Form II being the most stable polymorphic form with poor aqueous solubility and low bioavailability compared to Form I.
The drug product is film-coated tablets 240 mg that are oval, biconvex, pinkish white to orange white film-coated tablets with VEM engraved on one side.
The proposed dose of vemurafenib in adult patients is 960 mg (four 240 mg tablets) twice daily. Hoffmann-La Roche manufacturing facilities located at Basel, Switzerland are identified as drug manufacturing sites with a Roche site at Spain included for packaging. Relevant communication regarding Biopharmaceutics issues are summarized below: • Pre NDA CMC Meeting (Dec 2, 2010): Comments regarding dissolution
specifications were communicated to the applicant wherein it was suggested that dissolution data appeared to support a tighter specification value (i.e., Q= at 30 minutes). The applicant was recommended to consider data from primary and stability batches for setting specifications and the profiles should encompass the time frame at which at least of the drug is dissolved. It was also suggested that the dissolution method development report should be included in the NDA.
• IR dated 20-MAY-2011 (NDA Review): Based upon the data generated, it was recommended that the dissolution specifications be revised to Q= at 30 mins instead of the originally proposed Q= at 45 mins in the application.
• IR dated 17-JUN-2011 (NDA Review): The same comment was forwarded again as in the IR response to the above IR, the applicant proposed Q= at 30 mins, which was not reflective of the dissolution data.
2.0 BIOPHARMACEUTICS QUALITY ASSESSMENT
2.1 GENERAL PROPOERTIES 2.1.1 Structure INN: Vemurafenib
Molecular Formula: C23H18ClF2N3O3S Molecular Weight: 489.93 g/mole
Reference ID: 2971380
(b) (4)
(b) (4)
(b) (4)
(b) (4)
(b) (4)
(b) (4)
(b) (4)
NDA 202-429 Zelboraf® Tablets, Roche
Biopharmaceutics Review 4
Reviewer’s Comments: Vemurafenib is a, crystalline, non-hygroscopic powder which can exist in several polymorphic forms, with polymorphic form II being the most stable polymorphic form. Polymorph I has higher solubility and bioavailability, however, is unstable so formulation efforts were made to increase the solubility of Vemurafenib.
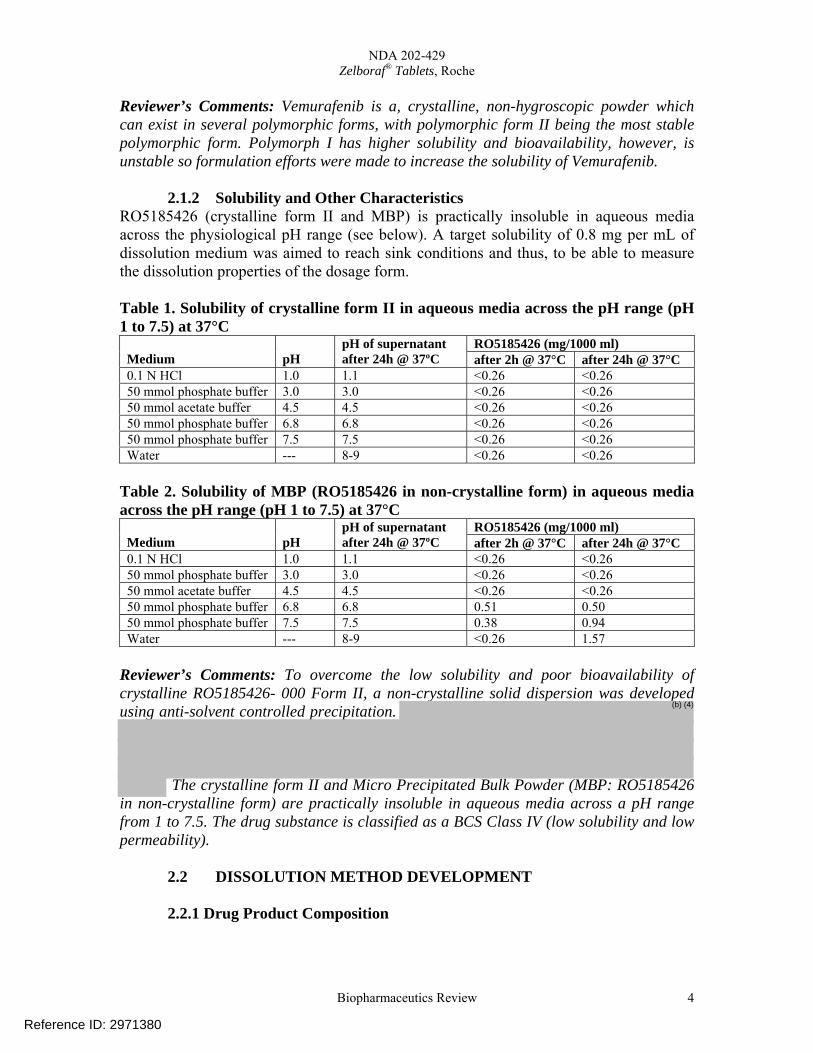
2.1.2 Solubility and Other Characteristics RO5185426 (crystalline form II and MBP) is practically insoluble in aqueous media across the physiological pH range (see below). A target solubility of 0.8 mg per mL of dissolution medium was aimed to reach sink conditions and thus, to be able to measure the dissolution properties of the dosage form. Table 1. Solubility of crystalline form II in aqueous media across the pH range (pH 1 to 7.5) at 37°C
RO5185426 (mg/1000 ml) Medium
pH
pH of supernatant after 24h @ 37ºC after 2h @ 37°C after 24h @ 37°C
0.1 N HCl 1.0 1.1 <0.26 <0.26 50 mmol phosphate buffer 3.0 3.0 <0.26 <0.26 50 mmol acetate buffer 4.5 4.5 <0.26 <0.26 50 mmol phosphate buffer 6.8 6.8 <0.26 <0.26 50 mmol phosphate buffer 7.5 7.5 <0.26 <0.26 Water --- 8-9 <0.26 <0.26
Table 2. Solubility of MBP (RO5185426 in non-crystalline form) in aqueous media across the pH range (pH 1 to 7.5) at 37°C
RO5185426 (mg/1000 ml) Medium
pH
pH of supernatant after 24h @ 37ºC after 2h @ 37°C after 24h @ 37°C
0.1 N HCl 1.0 1.1 <0.26 <0.26 50 mmol phosphate buffer 3.0 3.0 <0.26 <0.26 50 mmol acetate buffer 4.5 4.5 <0.26 <0.26 50 mmol phosphate buffer 6.8 6.8 0.51 0.50 50 mmol phosphate buffer 7.5 7.5 0.38 0.94 Water --- 8-9 <0.26 1.57
Reviewer’s Comments: To overcome the low solubility and poor bioavailability of crystalline RO5185426- 000 Form II, a non-crystalline solid dispersion was developed using anti-solvent controlled precipitation.
The crystalline form II and Micro Precipitated Bulk Powder (MBP: RO5185426 in non-crystalline form) are practically insoluble in aqueous media across a pH range from 1 to 7.5. The drug substance is classified as a BCS Class IV (low solubility and low permeability).
2.2 DISSOLUTION METHOD DEVELOPMENT 2.2.1 Drug Product Composition
Reference ID: 2971380
(b) (4)

NDA 202-429 Zelboraf® Tablets, Roche
Biopharmaceutics Review 5
During NDA development, the applicant aimed at increasing the bioavailability of the active compound by stabilizing the non-crystalline form and developing an immediate release tablet formulation of acceptable size by adding the minimal needed amount of excipients to the co-precipitate. RO5185426 film-coated tablet 240 mg contain:
Components Function Actual Weight (mg/tablet)
Tablet core RO5185426-000 Drug substance 240 Hypromellose acetate succinate
RO5185426-000 (MBP) Silica, colloidal anhydrous (Colloidal silicon dioxide) Croscarmellose sodium Hydroxypropylcellulose (Hydroxypropyl cellulose) Magnesium stearate Mass of Tablet Core Film Coating Mixture Poly(vinyl alcohol) Titanium dioxide Macrogol 3350 (Polyethylene glycol 3350) Talc Iron oxide red Mass of film-coating mixture Total Tablet Mass 870
2.2.2 Dissolution Method Development
An in-vitro dissolution test for RO5185426 film-coated tablets 240 mg was developed using Ph. Eur./USP. Apparatus: Apparatus 2 (paddles) Speed: 75 rpm Dissolution medium: 900 mL of 1% hexadecyltrimethylammonium bromide (HTAB) in 50 mmol/L phosphate buffer at pH 6.8. Analysis: Spectrophotometrically or using an isocratic HPLC method The effect of dissolution media (various pH, addition of surfactant), apparatus and agitation speed were studied. Dissolution media: Vemurafenib and MBP are practically insoluble in aqueous media (as shown in Table 1 and 2 above). Solubility/surfactant screening studies were performed in media with pH 6.8 (as HPMC-AS is insoluble in acidic media). Surfactants sodium dodecyl sulphate (SDS, anionic) and hexadecyltrimethylammonium bromide (HTAB, cationic) were added to phosphate buffer at pH 6.8 and the kinetic solubility of MBP was measured. Solubility data is provided in the NDA (Module 3; Section P.2). This study showed HTAB to be a better surfactant. Following this selection, various % of surfactants was tested (0.25%, 0.5%, 1%, 1.5% and 2% HTAB in 50 mmol/L phosphate
Reference ID: 2971380
(b) (4)
NDA 202-429 Zelboraf® Tablets, Roche
Biopharmaceutics Review 6
buffer 6.8). This study showed that 1% HTAB to provide sink condition (i.e. 800 mg/1000 mL). Comparative dissolution profiles in differing pH (pH 6.8 and 1.2):
Reviewer’s Comments: Dissolution media selection at pH 6.8 with 1% HTAB is well justified and acceptable. The media enables a good discriminating power to the dissolution testing as seen below. Equipment/Apparatus and Agitation Speed: USP Apparatus 1 and 2 were tested at 100 and 75 rpm, respectively, and showed similar dissolution profiles. Apparatus 2 was selected. 50 rpm was tested with the paddle and it showed higher variability and slow dissolution. 75 rpm was selected for the dissolution testing. Robustness during Routine Use:
• Overlapping profiles, throughout stability for the same batch upto 18 months, shows robustness.
• No significant effect on the dissolution profiles were seen while changing the following slightly (within working conditions):
o paddle rotation speed (75 ± 3 rpm) o pH of the medium (pH 6.8 ± 0.1) o ionic strength of the buffer (50 ± 5 mmol/L) o concentration of surfactant (1.0 % ± 0.1) o temperature of the medium during the dissolution run (37.0 ± 1.0°C and
37.0 ± 2.0°C) o UV-detection wavelength (307 ± 1 nm), while calculating the results with
the A(1%/1cm)-value determined at 307 nm
Reference ID: 2971380
(b) (4)

NDA 202-429 Zelboraf® Tablets, Roche
Biopharmaceutics Review 7
Discriminatory Power: • Tablets compressed to different hardness
Figure 1: Mean disintegration time and dissolution profiles obtained from tablet cores compressed to different hardness (compression forces – tablet hardness)
• Increase and decrease of water content
Figure 2: Dissolution profiles of Ro 518-5426/F17 film-coated tablets 240 mg after open storage up to 48 h at 25°C/60% R.H. and 30°C/75% R.H.
Reference ID: 2971380
(b) (4)
(b) (4)

NDA 202-429 Zelboraf® Tablets, Roche
Biopharmaceutics Review 8
Figure 3: Dissolution profiles of Ro 518-5426/F17 film-coated tablets 240 mg release and after storage at 25°C/60% R.H. and 30°C/75% R.H. in a closed container with an excess of desiccant
• Presence of RO5185426-000 crystalline form II > 5% in the drug product
Figure 4: Dissolution after 45 min as a function of % crystalline form II (by XRPD analysis) in Ro 518-5426/F17 film coated tablets 240 mg (Coefficient of correlation = -0.9715)
Reference ID: 2971380
(b) (4)
(b) (4)

NDA 202-429 Zelboraf® Tablets, Roche
Biopharmaceutics Review 9
Figure 5: Dissolution profile comparison – similarity factor Ro 518-5426/F17 film-coated tablets 240 mg after manufacturing with no evidence of crystalline form II (initial) and after 12 months open storage at 30°C/75 % R.H. (containing 5% of crystalline form II) and after 1 months open storage at 40°C/75% R.H. (containing 6% of crystalline form II) Reviewer’s Comments: Both Apparatus 1 and 2 showed similar dissolution profiles. Apparatus 2 was selected, likely due to automation purposes. Between the 50 and 75 rpm paddle speed, 50 showed much slower dissolution profile and hence 75 was selected. The method’s robustness was tested by varying the conditions within the working range, for e.g., paddle rotation speed), pH of the medium, ionic strength of the buffer, concentration of surfactant and temperature of the medium during the dissolution. The dissolution method was robust to these changes. Discriminating capabilities were proved as dissolution method could detect differences in tablets compressed to different hardness, different water content and presence of crystalline form (>5%). The dissolution method showed different profiles for the above conditions and hence, the method is sufficiently discriminating.
2.2.2 Dissolution Method Validation Validation of the RP-HPLC method and UV spectrophotometric assay used for the determination of dissolved vemurafenib is performed to demonstrate:
• Specificity/Selectivity • Linearity • Accuracy • Precision • Range • Robustness
The analytical procedures used for detection are: Content Determination by RP-HPLC:
Column: 50 x 4.6 mm i.d. Stationary phase: C8; 3.5 μm (e.g. Zorbax SB-C8) Mobile phase: 0.1% trifluoroacetic acid in water/acetonitrile (50/50% v/v) Flow rate: 2.5 mL/min Column temperature: 50°C
Reference ID: 2971380
(b) (4)

NDA 202-429 Zelboraf® Tablets, Roche
Biopharmaceutics Review 10
Injected volume: 5 μL Detection wavelength: 305 nm Run time (isocratic): approx. 1.7 min
Content Determination by UV Measurement (Alternative Method) Absorbance at 307 nm of the reference solution (nominal working concentration approximately 0.024 to 0.028 mg/mL) is measured in a cell with cell path 10 mm and the test solutions (nominal working concentration at 100% of released drug approximately 0.27 mg/mL) in a cell with cell path 1 mm. Reviewer’s Comments: The methods are validated with respect to specificity, linearity, accuracy, precision, range and robustness. Analytical data is provided under Section 3.2.P.5.3. A comparative analysis of dissolution rate determination by RP-HPLC and by UV measurement (3 batches, 12 tablets each batch, same dissolution sample at each time point analyzed by UV and HPLC). The results show good agreement and the method of analyses does not impact the dissolution data collected. Further data is provided to support the suitability of filter units used and supports that the filters do not adsorb the drug substance. The stability of the use of dissolution medium with regard to pH stability and appearance was assessed after eight days storage at ambient conditions. The dissolution profiles were superimposable between the media stored up to 8 days and freshly prepared media. Based on this, solution stability of 7 days is given.
2.2 DISSOLUTION SPECIFICATIONS AND ITS JUSTIFICATION 2.3.1 Establishing Dissolution Specifications
Figure 6: Dissolution Profiles of all Clinical and Primary Stability Batches of RO5185426 Film-Coated Tablets 240 mg
Reference ID: 2971380
(b) (4)

NDA 202-429 Zelboraf® Tablets, Roche
Biopharmaceutics Review 11
Based upon the above data, the applicant originally proposed a Q= at 45 mins. Reviewer’s Comments: The dissolution data seemed tight to support Q= at 30 mins besides the slower dissolution profile for one batch PT2319B04A. The following IR comments were communicated to the applicant and the responses obtained are subsequently summarized: • IR dated 20-MAY-2011 (NDA Review): Based upon the data generated, it was
recommended that the dissolution specifications be revised to Q= at 30 mins instead of the originally proposed Q= at 45 mins in the application. Applicant’s Response: The applicant rather proposed Q= at 30 mins. The applicant justified this new specification based upon only 11% of the batches tested needing S2-level testing at Q= rather than 41% for Q= at 30 mins.
Reviewer’s Comment: The justification provided by the applicant is overstated. 41% of batches needing S2 testing when Q= at 30 mins is adopted as specification is not justified by mean data as can be seen above (none go to S3 testing). Also dissolution testing is a critical quality attribute for this formulation. Because of this, the applicant was re-advised to revise the spec to Q= at 30 mins (in IR dated 17-JUN-2011). The applicant agreed to this. The Q= at 30 mins is set as the dissolution specification for release and stability and well-supported by the data collected from the 37 batches.
• IR dated 20-MAY-2011 (NDA Review): The applicant was asked to explain the slower dissolution rate and greater variability in dissolution data for the Batch PT2319B04A (see Fig 6, above). Applicant’s Response: The applicant provided all manufacturing data for the drug substance and MBP intermediate used to manufacture the Batch PT2319B04A. Data for particle size distribution, compaction force and other parameters used for manufacturing tablets, content uniformity data, hardness, disintegration time and water content supported that no out of specification result was obtained for either the parameters or other quality attributes. Data supporting that the same drug substance and MBP batch that was used in manufacturing Batch PT2319B04A when used in manufacturing batches PT2319B03A, PT2319B03B, PT2319B05A and PT2319B05B
Reference ID: 2971380
(b) (4)
(b) (4)
(b) (4)
(b) (4)
(b) (4)
(b) (4) (b) (4)
(b) (4)
(b) (4)
(b) (4)
(b) (4)
NDA 202-429 Zelboraf® Tablets, Roche
Biopharmaceutics Review 12
showed mean dissolution values of The Batch PT2319B04A was hence not considered an outlier. Reviewer’s Comment: Data provided by applicant supports that no abnormality was observed for Batch PT2319B04A to understand the relatively slower dissolution profile and greater variability for the batch. Nevertheless, the other 36 batches consistently supported the Q= at 30 mins and hence, this was selected as the dissolution specification.
2.3.2 Dissolution Data Over Stability 18 months stability data for batch PT9681T06 and up to 12 months data for batches PT2319B01A and PT2319B02A are provided. The batches were manufactured using the commercial process. The dissolution rate showed no change during storage. 6 months stability data for batches PT9710T03A, PT9710T04A and PT9710T05 are provided. The batches were manufactured in the commercial manufacturing site using the commercial process. The dissolution rate showed no change during storage. Reviewer’s Comment: 6 months of stability data of three full scale confirmatory primary stability batches of RO5185426 film-coated tablets 240 mg stored at 25°C/60% R.H., 30°C/75% R.H and 40°C/75% R.H support that dissolution rate showed no change on storage.
3.0 REGULATORY ISSUES All issues with respect to setting dissolution specification for RO5185426 film-coated tablets 240 mg have been resolved. A validated dissolution method using USP apparatus 2 (paddles) with Paddle Speed: 75 rpm and Dissolution medium: 900 mL of 1% hexadecyltrimethylammonium bromide (HTAB) in 50 mmol/L phosphate buffer at pH 6.8 has been developed. The method is deemed acceptable. Dissolution specification of Q= at 30 mins has been established.
Reference ID: 2971380
(b) (4)
(b) (4)
(b) (4)

---------------------------------------------------------------------------------------------------------This is a representation of an electronic record that was signedelectronically and this page is the manifestation of the electronicsignature.---------------------------------------------------------------------------------------------------------/s/----------------------------------------------------
DEEPIKA LAKHANI07/08/2011NDA is recommended for Approval from a Biopharmaceutics perspective.
PATRICK J MARROUM07/08/2011
Reference ID: 2971380

NDA 202-429 Review – Vemurafenib 1
Clinical Pharmacology Review
FDA 202-429
Submission Date: 4/27/11
Brand Name: ZelborafTM
Generic Name: Vemurafenib
Formulation: 240 mg film-coated tablets
OCP Reviewer: Jeanne Fourie Zirkelbach, PhD
OCP Team Leader: Qi Liu, PhD
Pharmacometrics Reviewer: Justin Earp, PhD
Pharmacometrics Team Leader: Christine Garnett, PharmD
OCP Division: Division of Clinical Pharmacology V
ORM Division: Division of Drug Oncology Products
Sponsor: Hoffmann-La Roche Inc.
Submission Type; Code: NME-NDA 0000/1
Dosing regimen: Twice daily oral dose of 960 mg of vemurafenib
Indication: For the treatment of BRAF V600 mutation-positive unresectable or metastatic melanoma.
OCP Briefing was held on 27 June 2011 and was attended by Song, Pengfei; Arya, Vikram; Filipski, Kelly; Grimstein, Christian; Jain, Ritesh; Jin, Runyan; Zhichkin, Pavel; Jenney, Susan; Mehta, Mehul U; Liu, Qi; Reynolds, Kellie S; Burns, Safaa; Huang, Jeffrey; Shord, Stacy; Zhang, Yongheng; Zhao, Ping; Zhao, Hong; Zhang, Huixia; Vieira, Manuela; Williams, Gene M; Murgo, Anthony; Pfuma, Elimika; Ning, Yang-Min (Max); Khandelwal, Aakanksha; Booth, Brian P; McKee, Amy; Kim, Geoffrey; Pacanowski, Michael A; Richterman, Gabrielle. Table of Contents
1 Executive Summary .........................................................................................................................2
1.1 Recommendations ...............................................................................................................3 1.3 Summary of Clinical Pharmacology Findings ....................................................................3
2 Question Based Review ...................................................................................................................5 2.1 General Attributes ...............................................................................................................5 2.2 General Clinical Pharmacology...........................................................................................6 2.3 Intrinsic Factors.................................................................................................................22 2.4 Extrinsic Factors................................................................................................................27 2.5 General Biopharmaceutics.................................................................................................31 2.6 Analytical Section .............................................................................................................33
3 Detailed Labeling Recommendations ............................................................................................35 4 Appendices .....................................................................................................................................45 4.1 pharmacometrics review.................................................................................................................45 Summary of Findings.............................................................................................................................45
Key Review Questions ...................................................................................................................45
Reference ID: 2968791

NDA 202-429 Review – Vemurafenib 2
Recommendations ..........................................................................................................................48 Label Statements ............................................................................................................................48
Pertinent regulatory background............................................................................................................49 Results of Sponsor’s Analysis ...............................................................................................................49
Clinical Trials Used In Analyses....................................................................................................49 Population Pharmacokinetics of Vemurafenib...............................................................................50 Exposure-response for Effectiveness .............................................................................................51 Exposure-response for Safety.........................................................................................................55
Reviewer’s Analysis ..............................................................................................................................58 Introduction ....................................................................................................................................58 Objectives.......................................................................................................................................58 Methods..........................................................................................................................................58 Results ……………………………………………………………………………………….59
Listing of Analyses Codes and Output Files..........................................................................................64 4.2 NDA Filing and Review Form ..........................................................................................65
1 Executive Summary
Vemurafenib (RO5185426-000, PLX4032) is a first in class, orally available, inhibitor of the oncogenic form of the BRAF serine-threonine kinase enzyme which harbors the V600E mutation. The proposed indication for vemurafenib is for the treatment of BRAF V600 mutation-positive unresectable or metastatic melanoma. The cobas® 4800 BRAF V600 Mutation Test is reviewed in parallel to this NDA by CDRH (PMA# M100022). The pivotal phase 3 trial (NO25026) was a randomized, open-label, controlled, multi-center trial in previously untreated patients with unresectable, stage 3c or stage 4 melanoma with the V600 BRAF mutation. Patients were randomized (337 patients to vemurafenib and 338 patients to the dacarbazine) and received continuous oral vemurafenib twice daily (bid) at a dose of 960 mg or a 1-hour intravenous infusion of dacarbazine at a dose of 1000 mg/m2 on Day 1 of every three weeks. The co-primary endpoints were overall survival (OS) and progression free survival (PFS). OS and PFS were statistically significantly longer on vemurafenib compared to dacarbazine. There was a statistically significant exposure-response relationship between PFS and vemurafenib exposure (Cmin) (p < 0.0001), as well as between the risk of squamous cell carcinomas development and vemurafenib exposure (Cmin) (p < 0.0001). In vivo, vemurafenib is a moderate inhibitor of human CYP1A2, a mild inhibitor of CYP2D6 and an inducer of CYP3A4. In vitro, vemurafenib is a CYP3A4 substrate. In the human mass balance trial, 94% of the oral vemurafenib dose was recovered in feces and 1% was recovered in urine. The absolute and relative bioavailability of vemurafenib are unknown. The applicant proposed drug administration under a fasted condition, however, the effect of food on the pharmacokinetics of vemurafenib is unknown, and vemurafenib was administered without regard to food in the phase 3 trial. Therefore, administration without regard to food is recommended. Dose reductions for mild and moderate renal impairment are not needed. Dose reductions for mild and moderate hepatic impairment are not needed. The effect of severe hepatic impairment on the pharmacokinetic of vemurafenib is not known, and vemurafenib should be administered with caution in patients with severe hepatic impairment.
Reference ID: 2968791

NDA 202-429 Review – Vemurafenib 3
1.1 Recommendations The Office of Clinical Pharmacology Divisions of Clinical Pharmacology 5 and Pharmacometrics have reviewed the information contained in NDA 202-429. This NDA is considered acceptable from a clinical pharmacology perspective. Labeling Recommendations Please refer to Section 3 - Detailed Labeling Recommendations. 1.2 Phase IV Requirements
1. Conduct a drug interaction trial to evaluate the effect of a strong CYP3A4 inhibitor (e.g., ketoconazole) on the pharmacokinetics of vemurafenib. The proposed trial protocol must be submitted for review prior to trial initiation.
2. Conduct a drug interaction trial to evaluate the effect of a strong CYP3A inducer (e.g., rifampin)
on the pharmacokinetics of vemurafenib. The proposed trial protocol must be submitted for review prior to trial initiation.
3. Conduct a clinical trial in patients with normal hepatic function and patients with pre-existing
severe hepatic impairment to assess the effect of severe hepatic impairment on the pharmacokinetics of vemurafenib. The proposed protocol must be submitted for review prior to trial initiation.
4. Perform an in vitro screen to determine if vemurafenib is an inhibitor of human CYP2C8 and
CYP2B6. Based on results from the in vitro screen, a clinical drug-drug interaction trial may be needed.
Comments: Submit the final study report for the ongoing food effect trial. 1.3 Summary of Clinical Pharmacology Findings Vemurafenib is inhibitor of the oncogenic form of the BRAF serine-threonine kinase enzyme which harbors the V600E mutation. The oncogenic mutations in BRAF kinase (e.g., V600E) are reported to occur in 50 to 60% of metastatic melanomas. The proposed indication for vemurafenib is for the treatment of BRAF V600 mutation-positive unresectable or metastatic melanoma. The proposed dosing regimen is 960 mg administered twice daily (bid), with each dose approximately 12 hours apart.
the effect of food on the pharmacokinetics (PK) of vemurafenib is unknown, and vemurafenib was administered without regard to food in the phase 3 trial. Therefore, administration without regard to food is recommended. The applicant conducted phase 1 trials (PLX0602, NP22676, NP25158, NP25163), a population PK analysis and a phase 2 trial (NP2657) and a phase 3 trial (NO25026) in patients with metastatic melanoma to characterize the pharmacokinetics of vemurafenib. The mean AUC and Cmax values following on Day 1 (240 mg to 960 mg single dose) and Day 15 (240 to 960 mg bid) showed dose proportionality over the dose range of 240 mg to 960 mg. Following administration of a single oral dose of vemurafenib in
Reference ID: 2968791
(b) (4)

NDA 202-429 Review – Vemurafenib 4
metastatic melanoma patients, the median Tmax ranged from 4 to 5 hours. The population PK analysis estimated the median vemurafenib elimination half life to be 56.9 hours. Most patients achieved steady state within 22 days of dosing at 960 mg bid. The median accumulation ratio for the bid regimen was estimated by the population PK analysis to be 7.36 for the metastatic melanoma patient population. The mean ratio between the morning dose peak concentration (Cmax) and the concentration pre-morning dose for vemurafenib at steady state ranged from 1.1 to 1.3 over the dose range of 240 mg to 960 mg bid, indicating consistent exposure of vemurafenib in plasma for the bid dosing schedule. At steady state for the 960 mg bid dosing regimen, the mean (± SD) Cmax was 61.7 ± 17.2 µg/mL and the mean AUC0-12h was 601 ± 170 µg.h/mL. The intersubject variability (CV%) values for Cmax and AUC0-12h were 28% each for the 960 mg bid dose at steady state. The FDA’s population PK analysis did not identify significant effects of baseline total bilirubin, AST and ALT, baseline creatinine clearance, age, gender, weight or age as covariates on clearance or volume of distribution of vemurafenib. After oral administration of 14C-vemurafenib, in the human mass balance trial, vemurafenib is the major component circulating in human plasma, with metabolites (M3 mono-hydroxyl metabolite, M6 glucosylation metabolite and M8 glucuronide metabolite) representing < 5% of the total chromatographic radioactivity, and < 5% of the radioactivity associated with the parent compound. Human CYP3A4 is responsible for the formation of the M3 metabolite. The in vivo effect of strong CYP3A4 inhibitors and inducers on vemurafenib pharmacokinetics was not assessed. Following oral administration of 14C-vemurafenib in the human mass balance trial, approximately 94% of the 14C-vemurafenib related material was recovered in feces and approximately 1% was recovered in urine. Based on the result from the mass balance trial and the population PK analysis, renal clearance does not appear to be an important elimination pathway for vemurafenib, and no dose adjustments are needed for mild and moderate renal impairment. Vemurafenib clearance was similar in patients with normal hepatic function and patients with mild and moderate hepatic impairment. Therefore, dose adjustments are not needed for mild and moderate hepatic impairment. The effect of severe hepatic impairment on vemurafenib exposure is unknown. An in vivo cocktail approach drug-drug interaction trial using the Cooperstown 5 +1 cocktail assessed whether vemurafenib is an inhibitor or inducer of CYP1A2, 3A4, 2D6, 2C9 and 2C19. Results indicated that vemuravenib is an inducer of human CYP3A4, a moderate inhibitor of CYP1A2 and a weak inhibitor of CYP2D6. Coadministration of vemurafenib decreased the AUC0-last of midazolam (CYP3A4 substrate) by 39%, while it increased the AUC0-last of caffeine (CYP1A2 substrate) by 2.6-fold and increased the AUC0-last of dextromethorphan (CYP2D6 substrate) by 47%. In vitro, vemurafenib is a substrate and inhibitor of human p-glycoprotein. Based on safety, pharmacological activity and tumor regression shown in the phase 1 dose escalation trial (PLX0602), 960 mg bid was selected for phase 2 and phase 3 development in patients with metastatic melanoma. The applicant conducted a phase 3 trial (NO25026) in previously untreated patients with unresectable, stage 3c or stage 4 melanoma with the V600 BRAF mutation. Patients were randomized (337 patients to vemurafenib and 338 patients to the dacarbazine) and received continuous oral vemurafenib twice daily (bid) at a dose of 960 mg (without regard to food intake) or a 1-hour intravenous infusion of dacarbazine at a dose of 1000 mg/m2 on Day 1 of every three weeks. Statistically significant improvements were observed for the co-primary endpoints of overall survival (OS) (p < 0.0001) and progression free survival (PFS) (p < 0.0001). There was a statistically significant exposure-response relationship between PFS and vemurafenib exposure (Cmin) (p < 0.0001). Important adverse events in the phase 3 trial (NO25026) were squamous cell carcinomas, and grade 3/4 liver function abnormalities. There was a significant exposure-response relationship between the risk of squamous cell carcinoma development and vemurafenib exposure (Cmin) (p < 0.0001). A reduced
Reference ID: 2968791

NDA 202-429 Review – Vemurafenib 5
starting dose or dose reductions to decrease squamous cell carcinoma events is not recommended. It is unclear whether exposure-response exists for grade 3 or any grade liver function abnormalities due to the small number of events observed. The exposure-QTc response analysis using data from trial NP2657 showed that following the treatment of vemurafenib 960 mg bid, vemurafenib prolonged the QTc interval in a concentration dependent manner (p < 0.0001). No large changes (i.e., > 20 ms) in the mean QTc interval were detected. Signatures: Reviewer: Jeanne Fourie Zirkelbach, PhD Division of Clinical Pharmacology 5 Team Leader: Qi Liu, PhD
Division of Clinical Pharmacology 5 Reviewer: Justin Earp, PhD Division of Pharmacometrics Team Leader: Christine Garnett, PharmD
Division of Pharmacometrics Cc: DDOP: CSO - T Ferarra; MTL - J Johnson; MO - G Kim, Safety MO - A McKee DCP-5: Reviewers - J Fourie Zirkelbach (CP), J Earp (PM)
CP TL - Q Liu , PM TL - C Garnett DDD - B Booth DD - A Rahman
2 QUESTION BASED REVIEW
2.1 GENERAL ATTRIBUTES
2.1.1 What are the highlights of the chemistry and physical-chemical properties of the drug substance and the formulation of the drug product as they relate to clinical pharmacology and biopharmaceutics review? Vemurafenib film-coated tablets 240 mg for oral administration are oval, biconvex, pinkish white to orange white film-coated tablets with VEM engraved on one side. Physical-chemical properties
1. Structural formula:
Figure 1: Structural Formula of Vemurafenib
2. Established names: Vemurafenib (RO5185426-000) 3. Molecular Weight: 489.93 g/mol 4. Molecular Formula: C23H18ClF2N3O3S 5. Chirality: Achiral 6. Partition coefficient (log P (water)): 3.0 7. Dissociation Constant (pKa (Acidic)): 7.9 and 11.1 8. Chemical Name: Propane-1-sulfonic acid {3-[5-(4-chlorophenyl)-1H-pyrrolo[2,3-b]pyridine-3-
carbonyl]-2,4-difluoro-phenyl}-amide
Reference ID: 2968791

NDA 202-429 Review – Vemurafenib 6
9. Melting Point (RO5185426-000 crystalline form II): 271 °C 10. Crystal Forms: RO5185426-000: Several polymorphs and solvates of RO5185426 have been
identified of which crystalline Form II is thermodynamically the most stable form. Form II is produced consistently by the manufacturing process.
11. Solubility: RO5185426-000 is insoluble in aqueous media at 37°C, and is soluble in organic solvents at 25°C.
12. Isomerization: RO5185426-000 is achiral and does not contain stereocenters.
2.1.2 What are the proposed mechanisms of action and therapeutic indications? Vemurafinib is an inhibitor of mutant (ongogenic) BRAF serine-threonine kinase enzyme. Through suppression of BRAF kinase activity, vemurafenib is proposed to suppress downstream RAF-MEK-ERK kinase signaling leading to decreased cellular proliferation in tumors expressing mutated BRAF proteins. The proposed indication for vemurafenib is for the treatment of BRAF V600 mutation-positive unresectable or metastatic melanoma.
2.1.3 What are the proposed dosage(s) and route(s) of administration? The applicant proposes a dosing regimen of 960 mg vemurafenib orally, twice daily
2.2 GENERAL CLINICAL PHARMACOLOGY
2.2.1 What are the design features of the clinical pharmacology and clinical studies used to support dosing or claims? Two clinical trials (NO25026 and NP22657) were submitted to support the efficacy and safety of vemurafenib for the treatment of unresectable or advanced metastatic melanoma. Randomized Phase 3 trial in patients with BRAFV600 Mutation-Positive Metastatic Melanoma (NO25026): This phase 3 trial was a randomized, open-label, controlled, multi-center trial in previously untreated patients with unresectable, stage 3c or stage 4 melanoma with the V600 BRAF mutation. Patients were randomized (337 patients to vemurafenib and 338 patients to the dacarbazine) and received continuous oral vemurafenib twice daily (bid) at a dose of 960 mg (four 240 mg film-coated tablets) or a 1-hour intravenous infusion of dacarbazine at a dose of 1000 mg/m2 on Day 1 of every three weeks. The co-primary endpoints were overall survival (OS) and progression free survival (PFS). Supportive Phase 2 Trial in patients with BRAFV600 Mutation-Positive Stage 4 Metastatic Melanoma (NP22657): NP22657 was a single-arm multi-center, multinational phase 2 trial conducted in 132 metastatic melanoma patients who had received at least one prior therapy, and had BRAFV600 mutation-positive tumors. Patients received continuous oral vemurafenib twice daily (bid) at a dose of 960 mg for at least 28 days. The primary endpoint was confirmed best overall response rate (CR + PR) as assessed by an independent review committee. Table 1 below summarizes the clinical trials that were used to support the Clinical Pharmacology and Biopharmaceutics Section of the NDA.
Reference ID: 2968791
(b) (4)

NDA 202-429 Review – Vemurafenib 7
Clinical Pharmacology Reports of data from more than one study: The vemurafenib plasma concentration data from NP25163, NP22657 and NO25026 were used to develop a population pharmacokinetic (PopPK) model (report 1043816) to investigate the potential influence of covariates that contribute significantly to between-patient variability in pharmacokinetic (PK) parameters of vemurafenib. The model was also used to characterize the exposure-efficacy and exposure safety ((1043816) relationships for select efficacy and safety endpoints (population PK/PD). Clinical trials to support the Clinical Pharmacology of vemurafenib: The clinical pharmacokinetics of vemurafenib were characterized using pharmacokinetic data from seven clinical studies: Five phase 1 studies (PLX06-02, PLX102-01, NP22676, NP25163 and NP25158), a phase 2 trial (NP22657) and a phase 3 trial (NO25026). PLX06-02 used a capsule formulation of the original crystalline form (Form 1) of vemurafenib. All subsequent studies including NP22657, NO25026 and the 3 clinical pharmacology studies (NP22676, NP25158 and NP25163) were conducted in patients using the 240 mg phase 3 to-be-marketed tablet formulation (microprecipitated bulk powder (MBP) formulation). A population concentration–QT/QTc prolongation analysis was conducted (study report 1043817) using data from the QT/QTc prolongation substudy in protocol NP22657. Table 1: Clinical trials to support the Clinical Pharmacology of vemurafenib. Study Phase
Protocol Number
Study Objective
Study Design Study Population
Dosing Regimen/Routes
Duration of vemurafenib Treatment (days)
No. of Patients Planned
No. of Patients Enrolled
Phase 1 PLX0602 vemurafenib safety and PK determine maximum tolerated dose (MTD)
Open-label, dose escalation study followed by a treatment extension phase
Dose Escalation patients with solid tumors Treatment Extension Patients with BRAFV600 Mutation positive melanoma and patients with BRAFV600 Mutation positive CRC
Dose Escalation Original formulation: 200, 400, 800, and 1600 mg bid MBP formulation (capsules): 160, 240, 320, 360, 720, 960, and 1120 mg bid Treatment Extension MBP formulations (capsules and film-coated tablets): 960 mg bid
PK determined between Days 1 and 15 Ongoing treatment was provided until death, disease progression, premature withdrawal, or lost to follow up
Escalation n = 45 to 55 Treatment Extension n = 20 to 26 per cohort
Escalation Original Formulation n = 26 MBP Formulations n = 30 Treatment Extension BRAFV600 Mutation positive melanoma n = 32 BRAFV600 Mutation positive CRC n = 21 TOTAL n = 109
Phase 1 PLX102-01
Evaluate the relative bioavailability of two MBP formulations vs original crystalline formulation
Randomized, open-label, 3-period cross-over study
Male healthy volunteers
Treatment A: Reference original phase 1 crystalline formulation 900 mg (3 x 300 mg capsules), oral. Note: In period 3, this reference formulation was replaced with a new batch and dosed at 300 mg (3 x 100 mg
Three single-dose periods with a 14- 21 day washout period between each dose
n = 18 n = 18
Reference ID: 2968791

NDA 202-429 Review – Vemurafenib 8
capsules), oral Treatment B: MBP-1 (dry granulation) 160 mg (4 x 40 mg capsules), oral Treatment C: MBP-2 (wet granulation) 160 mg (4 x 40 mg capsules), oral
Phase 1 NP22676 Evaluate the effect of vemurafenib on the PK of five CYP450 substrates given as a drug cocktail
Nonrandomized, open-label, uncontrolled, multicenter study
Previously treated and untreated patients with BRAFV600 Mutation positive, stage IV metastatic melanoma
240 mg MBP film-coated tablets at 960 mg bid, oral Period A (Days 1 – 6): Day 1: cocktail Days 1 to 6: washout Period B (Days 6 – 19): vemurafenib Period C (Days 20 – 25): Cocktail + vemurafenib Period D (Day 26+): vemurafenib
Starting on Day 6, ongoing treatment was provided until death, disease progression, premature withdrawal, or lost to follow up
n = 20 n = 25
Phase 1 NP25158 Characterize the mass balance, metabolism, routes and rates of elimination of 14Cvemurafenib
Nonrandomized, open-label, uncontrolled, single center study
Previously treated and untreated patients with BRAFV600- Mutation positive unresectable Stage IIIc/IV melanoma
240 mg MBP film-coated tablets at 960 mg bid, oral Period A (Days 1 – 14): non-labeled vemurafenib Period B (Day 15+): Single morning dose of radio labeled vemurafenib at 960 mg (6 X 120 mg capsules of unlabeled drug and 4 X 60 mg capsules each containing a maximum of 17.3 μCi of radioactive material) Evening dose of non-labeled vemurafenib 960 mg in 240 mg tablets Period C (after recovery criteria met) : non-labeled vemurafenib Batch # 240 mg tablets: PT9681T18A
Starting on Day 1, ongoing treatment was provided until death, disease progression, premature withdrawal, or lost to follow up
n = 6 n = 7
Reference ID: 2968791

NDA 202-429 Review – Vemurafenib 9
and PT9681T18D. Batch # unlabeled capsules 120 mg: 111793. Batch # 14C-labeled 60 mg capsules: GPF0198/1
Phase 1 NP25163 Evaluate the PK of vemurafenib using the 240 mg MBP tablet formulation
Randomized, open-label, uncontrolled, multicenter study
Previously treated patients with BRAFV600 Mutation positive unresectable Stage IIIc/IV melanoma
240 mg MBP film-coated tablets, oral Period A (Days 1 – 15) (Four vemurafenib dose cohorts): 240 mg bid 480 mg bid 720 mg bid 960 mg bid Period B (Days 16 – 21): Washout period Period C (Day 22+):
960 mg bid
With the exception of the washout period, ongoing treatment was provided until death, disease progression, premature withdrawal, or lost to follow up 240 mg tablet batch #: PT9681T11, PT2319B03B, PT2319B08B
n = 12 in each cohort
n = 52 (n = 12 in each of Cohorts 1, 2 and 3; n = 16 in Cohort 4)
Phase 2 NP22657 Evaluate efficacy (BORR) of vemurafenib with substudy to assess QTc interval and vemurafenib exposure
Nonrandomized, single-arm, open-label, uncontrolled, multicenter study
Previously treated patients with BRAFV600 Mutation positive Stage IV melanoma
240 mg MBP film-coated tablets at 960 mg bid, oral
Starting on Day 1, ongoing treatment was provided until death, disease progression, premature withdrawal, or lost to follow up Trial drug batch: 122064, 122175, 124432, 125696, 125697, 130030, 131964, 133970.
n = 90 N=132
Phase 3 NO25026
Evaluate the efficacy (OS and PFS) of vemurafenib vs DTIC and assess PK of 240 mg film-coated tablets
Randomized, open-label, active treatment controlled, multicenter study
Previously untreated patients with BRAFV600 Mutation positive unresectable Stage IIIc/IV melanoma
RO5185246 group: 240 mg MBP film-coated tablets at 960 mg bid, oral DTIC group: IV 1000 mg/m2 Day 1 q3w
Starting on Day 1, ongoing treatment was provided until death, disease progression, premature withdrawal, or lost to follow up
n = 680 (n = 340 in each group)
vemurafenib n = 337 DTIC n = 338
Reference ID: 2968791

NDA 202-429 Review – Vemurafenib 10
2.2.2 What is the basis for selecting the response endpoints (i.e., clinical or surrogate endpoints) or biomarkers (collectively called pharmacodynamics (PD)) and how are they measured in clinical pharmacology and clinical studies? The co-primary efficacy endpoints for the NO25026 trial were OS and PFS. These endpoints are well accepted as primary endpoints in pivotal phase 3 trials in oncology.
2.2.3 Are the active moieties in the plasma (or other biological fluid) appropriately identified and measured to assess pharmacokinetic parameters and exposure response relationships? Yes, all the submitted clinical pharmacology related studies analyzed plasma samples for the parent compound, vemurafenib, which is also the major component in human plasma after oral administration of vemurafenib. Exposure-response There are three trials relevant to the population pharmacokinetic analysis and exposure response analyses for efficacy and safety (NP25163, NP22657 and NO25026). An independent population pharmacokinetic analysis and exposure-response analyses for both efficacy and safety were done by the pharmacometrics reviewer. An independent exposure-QTc response analysis was done by the QT-IRT using data from trial NP2657. 2.2.4 What are the characteristics of the exposure-response relationships (dose-response, concentration-response) for efficacy? The exposure response analysis by the pharmacometrics reviewer concluded that there is a significant exposure-response relationship for the endpoint of progression-free survival (PFS). This was determined by a multivariate Cox-proportional hazards analysis that tested the exposure metric (ln of time-normalized Cmin) and potential risk factors at baseline (lactate dehydrogenase (LDH) elevation, melanoma classification, ECOG score) as model covariates. The final model included the ln of time-normalized Cmin (Cmin,tn) and LDH as independent variables. Table 2 shows the results of this analysis. Vemurafenib exposure increased the probability for PFS while elevated LDH concentrations decreased the probability for PFS. This relationship supports the proposed dose of vemurafenib. Table 2. Results of proportional hazards analysis indicate there is a significant exposure-response relationship for progression free survival. Parameter Hazard Ratio 95% CI p-valueln(Cmin,tn) 0.653 (0.503 - 0.848) 0.0014LDH Elevated 2.74 (1.79 - 4.20) <0.0001 2.2.5 What are the characteristics of the exposure-response relationships (dose-response, concentration-response) for safety? The exposure response analysis by the pharmacometrics reviewer concluded that there is exposure-response for squamous cell carcinomas (SCCs). Figure 1 shows that there is an increased probability of SCC with increasing exposure using a logistic regression model (p < 0.0001).
Reference ID: 2968791

NDA 202-429 Review – Vemurafenib 11
0
20
40
60
80
100
0 20 40 60
| | | | |1/289 7/60 10/60 16/60 20/60P
roba
bilit
y of
Squ
amou
s C
ell C
arci
nom
as
Vemurafenib Time-Averaged Cmin (μg/mL) Figure 1. There is a significant exposure-response relationship for SCCs. Symbols indicate the observed probability of SCCs for vemurafenib exposure quartiles (blue) and dacarbazine treatment (red). The black solid line and shaded region indicate the model prediction and 95% CI for the logistic regression (Pharmacometrics Review). A reduced starting dose or dose reductions for SCCs events are not recommended, because the survival benefit with vemurafenib therapy outweighs the risk of SCCs. SCC lesions in the skin layer can be excised. Although dose reductions were not required for SCCs during the trial and are not recommended for this event in the labeled dosing, physicians should be aware of this potential event. The exposure-response relationship is sufficient evidence to support labeling statements that make it clear; there is a risk of SCCs in patients being treated with vemurafenib. Based on the exposure response analysis by the pharmacometrics reviewer, it is unclear whether exposure-response exists for grade 3 or any grade liver function abnormalities. There are increased liver function abnormalities in the vemurafenib treated groups; however, there is no clear exposure-response relationship (Figure 2). This may be due to the small number of grade 3 events and is consistent with the sponsor’s findings. A reduction in the starting dose for grade 3 liver function abnormalities is not recommended, because a patient should not be precluded survival benefit because 7% of vemurafenib treated individuals experienced a grade 3 adverse event. The proposed dosing regimen permits dose-interruptions and dose-reductions for this event.
0
10
20
30
40
0 20 40 60
| | | | |
4/289 2/61 3/60 8/60 6/61
Prob
abili
ty o
f Gra
de 3
+ Li
ver A
bnor
mal
ities
Vemurafenib Time-Averaged Cmin (μg/mL)
0
10
20
30
40
0 20 40 60
| | | | |
17/293 16/63 10/62 17/62 12/62
Prob
abili
ty o
f Any
Gra
de L
iver
Abn
orm
ality
Vemurafenib Time-Averaged Cmin (μg/mL)
Figure 2. There is no clear evidence of exposure-response liver function abnormalities (Pharmacometrics review).
Reference ID: 2968791

NDA 202-429 Review – Vemurafenib 12
2.2.6 Does this drug prolong the QT or QTc interval? Yes. An open-label, multi-center Phase 2 study of continuous oral dosing of vemurafenib (960 mg BID) in previously treated patients with metastatic melanoma (Study NP22657) was conducted. The effect of vemurafenib on QT interval was assessed in 132 patients. The dose selection was reasonable, based on 960 mg bid being the maximum tolerated dose, and 960 mg bid being the proposed dosing regimen. The effect of food was not evaluated. The QT-IRT reviewer used mixed model to analyze the ΔQTcP effect. No large changes in mean QTc interval (i.e., >20 ms) from baseline were detected in the trial. Vemurafenib is associated with concentration-dependent QTc interval prolongation (Figure 3). The largest mean change from baseline was 11.9 ms with the upper bound of the 2-sided 90% confidence interval (CI) of 14.8 ms, observed at 6 hours post-dose on Day 15 in Cycle 1. A moxifloxacin arm was not included, so the assay sensitivity cannot be established.
Vemurafenib concentration (ng/mL) Figure 3. ΔQTcP vs. vemurafenib concentrations (QT-IRT review). 2.2.7 Is the dose and dosing regimen selected by the applicant consistent with the known relationship between dose-concentration-response, and are there any unresolved dosing or administration issues? The applicant proposes a 960 mg (four 240 mg tablets) oral dose of vemurafenib taken twice daily. The first dose should be taken in the morning and the second dose should be taken in the evening approximately 12 hours after the first dose.
The rationale for the selection of the applicant’s proposed dose and dosing regimen is supported by the following:
• Nonclincial in vitro evidence and xenograft models demonstrate cell cycle arrest at lower vemurafenib concentrations and apoptosis only at higher concentrations. There was also no exposure plateau in the xenograph models, while higher vemurafenib concentrations were associated with greater tumor shrinkage and longer survival duration (range of exposure required: AUC0-24hr 400 μM·h to > 2000 μM·h).
• Based on the preclinical data, the goal of the phase 1 dose escalation trial (PLX06-02) was to identify the highest dose of vemurafenib that could be tolerated in order to maximize the therapeutic index for metastatic melanoma.
• The dose escalation phase 1 trial (PLX06-02) evaluated the dose range of 160 mg bid to 1120 mg bid. A dose was considered higher than the maximum tolerated dose (MTD) if 2 or more DLTs
Reference ID: 2968791
(b) (4)
NDA 202-429 Review – Vemurafenib 13
were observed in the cohort of 6 patients. • Tumor regressions were first observed in the dose range of 240 mg bid to 360 mg bid, which on
average exceeded the target exposure threshold identified in nonclinical in vitro studies (AUC0-24h ≥ 400 μM·h). More pronounced tumor regression was observed at the 720 mg bid and 1120 mg bid doses, however DLTs, (Grade 3 rash and fatigue) were observed in 4 of 6 patients at the 1120 mg bid dose. Therefore, the maximum tolerated dose was selected as the midpoint between the 720 mg bid and 1120 mg bid doses, and 960 mg bid dose (not studied in the PLX06-02 trial) was selected for Phase 2 and Phase 3 trials. Selection of the 960 mg bid dosing regimen rather than the 720 mg bid regimen for further development appears acceptable to the reviewer, based on the applicant’s rationale to maximize the therapeutic index of vemurafenib through administration of the highest dose that could be tolerated, and which exceeds the exposure shown to be effective in the xenograph models.
• The exposure response analyses for safety conducted by the pharmacometrics reviewer support the selected dosage and administration of vemurafenib. Despite the presence of an exposure response for SCCs and elevated liver function abnormalities with vemurafenib treatment, the starting dose is acceptable. The key point for keeping the 960 mg BID starting dose is that there is increased probability for PFS with higher concentrations of vemurafenib and that the applicant has chosen a dose that is near the maximum tolerated dose.
Unresolved dosing/administration issues: The effect of food on vemurafenib PK is unknown. A dedicated food effect trial (NP25396) is currently ongoing. In all of the phase 1 trials, the phase 2 trial (NP22657) and the phase 3 trial (NO25026) vemurafenib was administered as a 960 mg oral dose, twice daily, without regard to food.
The safety and efficacy of vemurafenib were
established in the phase 3 trial when vemurafenib was administered without regard to food. Therefore, it is recommended that vemurafenib is administered without regard to food, as to avoid potential unknown effects of administration under the fasted state on vemurafenib efficacy and safety. Pharmacokinetic characteristics of the drug and its major metabolites 2.2.8 What are the single dose and multiple dose pharmacokinetic (PK) parameters? Trials describing the PK of vemurafenib in patients with metastatic melanoma: The NP25163 and NP22657 trials characterized the single dose (Day 1) and multiple dose steady state PK (Day 15) of vemurafenib using 240 mg vemurafenib tablets administrated orally bid, without regard to food, in patients with metastatic melanoma. Medication was taken under fasted conditions (8 hours over night and 4 hours post dose) only on days when PK samples were obtained. Study NP22676 assessed the multiple dose PK of vemurafenib in patients metastatic melanoma using the 240 mg MBP tablet formulation. Patients received continuous oral doses of 960 mg bid of vemurafenib without scheduled dose interruption starting on Day 6. On the morning of Day 19 patients were to take the second dose of vemurafenib at 12 hours after the first dose. Patients had to have at least 8 hours of pre-dose overnight fasting and then 4 hours post-dose fasting on PK collection days only. The steady state levels of vemurafenib were determined over a 24-hour period. Single Dose PK in Patients with metastatic melanoma: The single dose PK parameters of vemurafenib were determined on Day 1 (240, 480, 720 or 960 mg bid
Reference ID: 2968791
(b) (4)

NDA 202-429 Review – Vemurafenib 14
oral dose) using noncompartmental PK analysis in study NP25163 (Figure 4 and Table 3). At the 960 mg dose, the median Tmax occurred at 5 hours after dosing, and was similar across the 4 dose cohorts (range: 4 to 5 hours). The concentration of vemurafenib for each dose cohort continued to increase following the second dose (approximately 12 hours after the first dose) (Figure 4), as assessed at the 24 hour time point. Following a single dose of vemurafenib, the ranges of CV% values for Cmax and AUC0-8h across the dose range of 240 mg to 960 mg were approximately 45 to 85% and 56 to 74%, respectively (Table 3). At Day 1 the CV% values for Cmax and AUC0-8h following a single 960 mg dose were 70% and 70%, respectively (Table 3).
Figure 4: Mean (± SD) vemurafenib concentration vs. time profile on Day 1 (Linear and Log scale) from study NP25163 (bid dosing). The first dose of vemurafenib was administered 12 hours before the second dose. Table 3: Single dose vemurafenib pharmacokinetic parameters following bid dosing, where the first dose is administered 12 hours prior to the second dose.
Study NP25163 Vemurafenib dose
Parameter Statistics 240 mg 480 mg 720 mg 960 mg
AUC0-8hrs (µg.h/mL)
N Arithmetic mean
Median SD
% CV
12 8.3 6.3 6.13 73.9
12 13.8 15.0 7.72 55.8
12 21.9 20.2 12.97 59.3
12 27.0 22.9
18.87 69.9
Cmax 0-8hrs
(µg/mL) N
Arithmetic mean Median
SD % CV
12 1.9 1.3 1.66 85.3
12 2.6 2.8 1.56 60.5
12 4.4 4.1
1.98 44.6
16 4.8 4.1 3.34 69.9
Tmax 0-8hrs (hr) N Median
12 4.0
12 4.0
12 5.0
16 5.0
Multiple Dose PK in Patients with metastatic melanoma: The multiple dose PK parameters of vemurafenib were determined on Day 15 (240, 480, 720 or 960 mg bid oral dose) using noncompartmental PK analysis in study NP25163 (Table 4 and Figure 5 and 6), study NP22657 (Table 5), and study NP22676. In study NP22676, PK samples were obtained at 12 hours post-dosing to characterize the full 12-hour dosing interval at steady state (Table 6). The mean plasma concentrations of vemurafenib remained stable throughout 8 hours after the morning dose across the dose range studied (Figure 5). The median Tmax ranged from 2 to 4 hours after the morning dose on Day 15 over the dose range studied. Most patients achieved steady state within 22 days
Reference ID: 2968791

NDA 202-429 Review – Vemurafenib 15
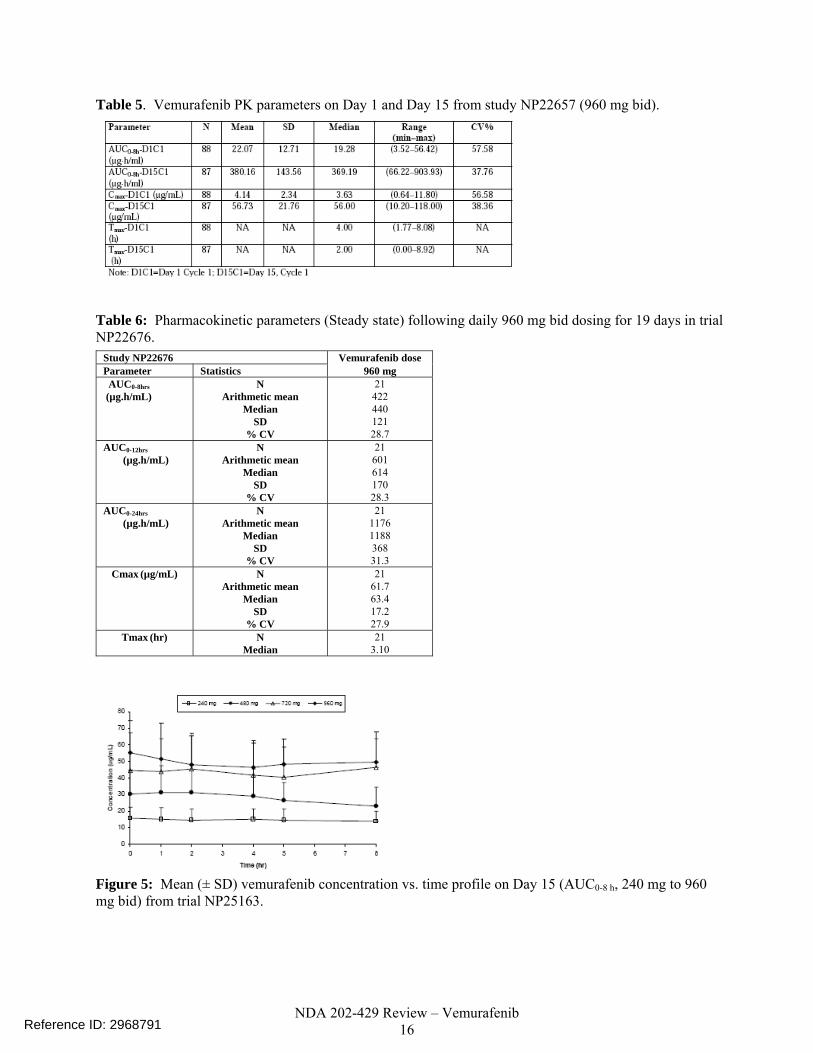
of dosing at 960 mg bid. The mean ratio between the steady state morning dose peak concentration (Cmax) and the concentration pre-morning dose for vemurafenib on Day 15 ranged from 1.1 to 1.3 over the dose range of 240 mg to 960 mg bid (NP25163), indicating consistent exposure of vemurafenib in plasma for the bid dosing schedule. At the 960 mg bid dose, the steady state mean values of Cmax and AUC0-12h were, 60 μ/mL and 600 μ*hr/mL, respectively. (Table 6). The mean Cmin was 53 µg/mL and was determined from the pre-dose value on Day 22 in the Phase 3 study, NO25026 (n = 204 patients). The pharmacometrics reviewer’s population PK analysis estimated the median vemurafenib elimination half life to be 56.9 h (5th and 95th percentile range is 29.8 to 119.5 hours) for the metastatic melanoma patient population. In studies NP22676 and NP25163, following multiples doses at steady state (960 mg bid), the CV% values for Cmax ranged from 28% to 37%, while the CV value for AUC0-12h was approximately 28%, and the CV values for AUC0-8h ranged from 28% to 32%. (Table 4 and Table 6). Table 4: Pharmacokinetic parameters (Steady state) following daily bid dosing for 15 days in trial NP25163.
Study NP25163 Vemurafenib dose Parameter Statistics 240 mg 480 mg 720 mg 960 mg AUC0-8hrs (µg.h/mL)
N Arithmetic mean
Median SD
% CV
10 117.8 94.2 40.52 42.9
9 233.8 254.7
106.93 45.7
9 343.3 424.2
151.23 44.1
11 392.2 426.2
126.37 32.2
AUC0-24hrs (µg.h/mL)
N Arithmetic mean
Median SD
% CV
10 317.7 268.9
133.34 42.0
10 598.9 669.5
297.44 49.7
9 1003.7 1171.5 441.36
44.0
11 1126.0 1204.0 423.01
37.7 AUC0-168hrs
(µg.h/mL) N
Arithmetic mean Median
SD % CV
10 920.3 747.6
538.35 58.5
8 2243.5 2453.4 1336.15
59.6
9 3127.1 3253.7 1789.97
57.2
11 3530.3 3322.5 1811.43
51.3 Cmax0-168hrs
(µg/mL) N
Arithmetic mean Median
SD % CV
10 17.2 13.4 7.43 43.1
9 35.4 38.9 17.44 49.2
9 52.7 59.1 22.40 42.5
11 61.4 59.7 22.76 37.1
Tmax0-168hrs (hr) N Median
10 4.0
9 2.3
9 2.0
11 2.0
CL/F (L/hr) N Arithmetic mean
Median SD
% CV
10 0.3 0.3
0.13 39.3
8 0.8 0.2
1.45 189.3
9 0.4 0.2
0.28 81.0
11 0.3 0.3
0.19 53.5
T1/2 (hr) N Arithmetic mean
Median SD
% CV
10 31.5 25.9 19.05 60.4
10 38.4 36.7 24.18 63.0
9 34.9 28.6 19.48 55.9
11 34.1 25.4 19.66 57.7
Reference ID: 2968791
NDA 202-429 Review – Vemurafenib 16
Table 5. Vemurafenib PK parameters on Day 1 and Day 15 from study NP22657 (960 mg bid).
Table 6: Pharmacokinetic parameters (Steady state) following daily 960 mg bid dosing for 19 days in trial NP22676.
Study NP22676 Vemurafenib dose Parameter Statistics 960 mg AUC0-8hrs (µg.h/mL)
N Arithmetic mean
Median SD
% CV
21 422 440 121 28.7
AUC0-12hrs (µg.h/mL)
N Arithmetic mean
Median SD
% CV
21 601 614 170 28.3
AUC0-24hrs (µg.h/mL)
N Arithmetic mean
Median SD
% CV
21 1176 1188 368 31.3
Cmax (µg/mL) N Arithmetic mean
Median SD
% CV
21 61.7 63.4 17.2 27.9
Tmax (hr) N Median
21 3.10
Figure 5: Mean (± SD) vemurafenib concentration vs. time profile on Day 15 (AUC0-8 h, 240 mg to 960 mg bid) from trial NP25163.
Reference ID: 2968791

NDA 202-429 Review – Vemurafenib 17
Figure 6: Mean (± SD) vemurafenib concentration vs. time profile from predose on Day 15 to predose Day 22 (AUC0-168 h, linear scale and log-linear scale) from trial NP25163. 2.2.9 How does the PK of the drug and its major active metabolites in healthy volunteers
compare to that in patients? Because of the risk of cutaneous SCCs with use of vemurafenib, characterization of the PK of vemurafenib in healthy subjects was not feasible using the 240 mg MBP tablet formulation. 2.2.10 What are the characteristics of drug absorption? The absolute and relative bioavailability of vemurafenib have not been determined. At steady state, vemurafenib has a median Tmax of ranging from 2 to 4 hours. Vemurafenib shows accumulation after repeat dosing at 960 mg bid, with a median accumulation ratio of 7.36 estimated from the pharmacometrics reviewer’s population PK analysis. In vitro studies showed that vemurafenib has low permeability, and low aqueous solubility (study 1040857). Based on these data, vemurafenib has limited oral absorption, and it is classified as a BCS Class IV compound with low solubility and low permeability. In vitro studies showed that vemurafenib is a P-glycoprotein (Pgp) substrate and inhibitor (study 1041536). Vemurafenib has not been characterized with respect to the potential effect of food on the absorption of vemurafenib. In all clinical trials including the phase 3 trial, in the current application, vemurafenib was administered without regard to food. However, all PK samples were obtained following an overnight fast of 8 hours, which continued 4 hours after administration of the morning dose of vemurafenib. This single 8 hour fasting condition is not expected to truly represent the steady state PK of vemurafenib under fasted conditions, as the drug has significant accumulation, and was administered without regard to food on all other study days. There appears to be limited inter-individual variability in the multiple dose vemurafenib PK parameters at the 960 mg bid dosing regimen (CV% Cmax: 37% and CV% AUC0-8h: 32%, Table 4). 2.2.11 What are the characteristics of drug distribution? Based on the pharmacometrics reviewer population PK analysis, the population apparent volume of distribution for vemurafenib in metastatic melanoma patients is estimated to be 106 L, with 65.7% inter-patient variability. In vitro Plasma Protein Binding Assays: At clinically relevant concentrations, the mean overall percent binding of vemurafenib to human plasma protein is 99.86 ± 0.06 (study 1031038), and this binding is concentration independent. At clinically relevant concentrations, the mean overall percent binding of
Reference ID: 2968791

NDA 202-429 Review – Vemurafenib 18
vemurafenib to human serum albumin and alpha-1 acid glycoprotein was 99.80 ± 0.13 and 99.18 ± 0.23, respectively (study 1031038). Blood to Plasma Ratio: The overall percent of 14C-vemurafenib associated with red blood cells is low compared to plasma proteins (study 1031038). The mean blood to plasma ratio for 14C- vemurafenib was 0.58 ± 0.03 for human. The mean percent of 14C-vemurafenib associated with red blood cells was 11.40 ± 3.75 for human. 2.2.12 Does the mass balance study suggest renal or hepatic as the major route of elimination? Based on the mass balance trial, the hepatic route appears to be the major route of vemurafenib elimination. The absolute and relative bioavailability of vemurafenib are not known, and therefore a definitive conclusion regarding the relative importance of renal elimination cannot be made. The mass balance trial (NP25158) was conducted in patients with metastatic melanoma. Vemurafenib (MBP formulation) was administered orally to seven patients at a dose of 960 mg bid from Days 1 to 14. On Day 15, the morning dose was substituted with a single dose of 960 mg of 14C-vemurafenib. The relative proportions of 4C-vemurafenib and its 14C-labeled metabolites in human plasma, feces and urine samples were characterized (Figure 7). A mean of 95.0% ± 2.40 (range, 91.0% to 98.3%) of the 14C-vemurafenib related material was recovered from urine and feces within 432 hrs (18 days) post-dose: 94.1% (mean) was recovered in feces and 0.97% (mean) was recovered in urine.
Figure 7: Mean cumulative 14C-vemurafenib related material excretion in urine and feces (N=7, Dash: Total, Closed Circle: Feces, Open circle: Urine). (Study NP25158).
2.2.13 What are the characteristics of drug metabolism?
In vitro screens show that CYP3A4 is responsible for the metabolism of vemurafenib to mono-hydroxyl metabolites.
In vitro metabolic profile and identification of metabolites:
Study 1033024 characterized the in vitro metabolite profiles of vemurafenib in human liver microsomes and cryopreserved human primary hepatocytes (10 donor pool, male and female). It characterized the cytochrome P450 isozymes (CYPs) responsible for the in vitro metabolism using human cDNA expressed isozymes (CYP 1A2, 2A6, 2C9, 2C8, 2C19, 2D6, 2E1 and 3A4) and human liver microsomes with
Reference ID: 2968791

NDA 202-429 Review – Vemurafenib 19
isoform specific P450 chemical inhibitors. Following in vitro incubations of vemurafenib with human liver microsomes and hepatocytes, the qualitative metabolite patterns were generally comparable to that in mouse, rat, dog and monkey. Unchanged 14C-vemurafenib was the major component in liver microsome incubations (97.5%) in the presence of NADPH. The metabolic profiles of 14C-vemurafenib in human liver microsomes were characterized by formation of mono-hydroxyl metabolites M1, M2, M3 in the presence of NADPH, and comprised of 0.6%, 0.2% and 1.7% of the total radioactivity, respectively. Approximately 0.1-0.3% of these metabolites were seen in control incubation of 14C-vemurafenib with liver microsomes in the absence of NADPH. Unchanged 14C-vemurafenib was the major component following incubations with hepatocytes in all the species (>91.5%). The metabolic profiles of 14C-vemurafenib in human hepatocytes were characterized by formation of mono-hydroxyl metabolites M1 (0.6%) and M3 (1.3%); vemurafenib-glucuronides M7 (3.2%) and M8 (0%), and glucosylation metabolite M6 (2.3%). Metabolite M6 was only formed with human hepatocytes. M3 was the predominant metabolite (1.4% of the total 2.3% of metabolism) formed upon incubation of 14C-vemurafenib with human liver microsomes in the presence of NADPH. The CYP3A4/5 chemical inhibitor, ketoconazole, in the presence of NADPH, inhibited the formation of the mono-hydroxyl metabolites of 14C-vemurafenib by ~82.4% when compared to the control incubation in absence of cytochrome P450 chemical inhibitors. The results indicate that CYP3A4 is the major enzyme responsible in the metabolism of vemurafenib in liver microsomes.
Metabolic profile from human mass balance trial: The biotransformation results from the human mass balance trial (NP25158) indicated that vemurafenib undergoes metabolism to three metabolites (M6, M3 and M8), and these metabolites can be present in the systemic circulation, urine and feces (see Section 2.2.12). An additional human metabolite (M7) was identified in the in vitro study 1033024 (see above and Figure 8). Plasma samples were pooled over three time intervals for this analysis based on available radioactive counts (4 + 6 hours, 12 + 24 hours, and 36 + 48 hours). Across these time intervals, mean parent compound represented 97 to 99% (mean values) of the radioactivity in the pooled plasma samples. Mean data from plasma samples pooled over time intervals up to 48 hours indicated that potential metabolites in human plasma represented < 5% of the total chromatographic radioactivity, and < 5% of the radioactivity associated with the parent compound. The mean percentage of M3 (mono-hydroxy metabolite) increased with time from 0.5% to approximately 4% between 12 + 24 hours and remained constant in the 48-hour pool. After conversion to μg/mL units based on an average density of 1.025 g/mL for plasma, the mean plasma concentrations of 14C-vemurafenib were approximately 4.6 to 6.0 μg/mL during the time intervals analyzed while 14C-M3 concentrations ranged from approximately 0.06 to 0.31 μg/mL (approximately 7% of the concentration of parent compound) over the same time intervals. An in vivo trial to assess the effect of a strong CYP3A4 inhibitor and inducer will be requested as a post marketing requirement:
• CYP3A4 is responsible for the formation of the M3 metabolite in vitro. • The absolute bioavailability of vemurafenib is unknown. • If vemurafenib has a low oral bioavailability, then CYP3A4 may be an important metabolic
pathway for vemurafenib elimination.
Reference ID: 2968791

NDA 202-429 Review – Vemurafenib 20
Figure 8: Proposed metabolites of vemurafenib in humans (M1, M2, M3, M7 and M8) and animals. (study NP25158). 2.2.14 What are the characteristics of drug excretion? Elimination From the human mass balance trial (NP25158), the mean percent of 14C-vemurafenib related material recovered in feces and urine within 432 hrs post-dose was 94.1% and 0.97%, respectively. 14C-vemurafenib was observed in the profile of human fecal samples taken up to 48 hours post administration of the radioactive dose. At up to 48 hours post dose, the parent compound accounted for ≥ 94% of the total radioactivity. Three additional regions of radioactivity (M6, M3 and M8) were resolved by HPLC in the 0–48 hour pooled human fecal samples however these mean values each represented ≤ 3% of the total chromatographic peak area. In the profile of the pooled human fecal samples taken 48 to 96 hours post-administration, the proportion of the profile represented by the parent compound showed notable variation between individual patients (33% to 95%, with a mean value of 56%). M6, M3, and M8 represented approximately 19%, 14% and 12%, of the total chromatographic peak area, respectively (mean values). Data from 7 patients indicated that over the period investigated (0–96 hours), potential metabolites each accounted for < 0.5% of the total administered dose in urine. The relative abundance of these components showed significant differences between the individual patients. The parent compound was not detected in samples from two of the patients, but accounted for 99% of the profile for one patient. M6 was detected in the urine of five of the seven patients, where it accounted for up to 64% of the total chromatographic peak area. M3 was detected in urine samples from two patients, where it accounted for up to 30% of the profile. Clearance The pharmacometrics reviewer’s population PK analysis estimated the population apparent steady state clearance of vemurafenib in patients with metastatic melanoma to be 31.2 L/day with 31.9% inter-patient variability. The clearance (noncompartmental PK analysis) appeared constant over the dose range studied (240 mg to 960 mg bid) (Table 4).
Reference ID: 2968791

NDA 202-429 Review – Vemurafenib 21
Half-life The pharmacometrics reviewer’s population PK analysis reported a median elimination half-life of 56.9 h (the 5th and 95th percentile range is 29.8 to 119.5 hours) in patients with metastatic melanoma. The elimination half life (noncompartmental PK analysis) appeared constant over the dose range studied (240 mg to 960 mg bid) (Table 4). 2.2.15 Based on PK parameters, what is the degree of linearity or non-linearity based in the dose-concentration relationship? The single dose and multiple dose PK parameters of vemurafenib were determined on Day 1 (240, 480, 720 or 960 mg bid oral dose) and Day 15 using noncompartmental PK analysis in study NP25163 (Table 3 and Table 4). The mean AUC and Cmax values showed dose proportionality over the dose range studied (Figure 9).
Day 15, Cmax y = 0.0683xR2 = 0.9675
0
50
100
0 240 480 720 960
Dose cohort (mg bid)
Geo
met
ric M
ean
(ug*
h/m
L)
Day 15, AUC0-8 hours
y = 0.4422xR2 = 0.9494
0
100
200
300
400
500
600
0 240 480 720 960
Dose Cohort (mg bid)
Geo
met
ric
Mea
n (u
g*h/
mL)
Day 15, AUC0-24 hours
y = 1.2543xR2 = 0.9602
0
200
400
600
800
1000
1200
1400
1600
1800
0 240 480 720 960
Dose Cohort (mg bid)
Geo
met
ric m
ean
(ug*
h/m
L)
Day 15, AUC0-168 hours
y = 4.0153xR2 = 0.9344
0
1000
2000
3000
4000
5000
6000
0 240 480 720 960
Dose cohort (mg bid)
Geo
met
ric
Mea
n (u
g*h/
mL)
Figure 9: Mean AUCs and Cmax ± SD for 4 dose cohorts on Day 15 in NP25163, with trendline that has a y-intercept of zero. 2.2.16 How do the PK parameters change with time following chronic dosing? Exposure increases with multiple dosing, and Table 7 shows single dose and multiple dose (steady state) PK parameters for vemurafenib from the NP22657 and NP25163 trials. Based on the pharmacometrics reviewer’s population PK analysis, the median accumulation ratio for the population was estimated to be 7.36. The steady-state was reached within 22 days for most patients. The interindividual variability (%CV) values for Cmax and AUC were larger following a single dose of vemurafenib (960 mg) vs. at steady state for the 960 mg bid dosing regimen. At Day 1 the CV% values for Cmax and AUC0-8h following a single 960 mg dose were 70% and 70%, respectively (Table 3). At Day 15 (steady state) the CV% values for Cmax and AUC0-8h at the 960 mg bid dosing regimen were 37% and 32%, respectively (Table 4).
Reference ID: 2968791

NDA 202-429 Review – Vemurafenib 22
Table 7: Comparison of PK parameters on Day 1 and Day 15 are similar across studies (NP25163, NP22676) with the 960 mg bid dose.
2.2.17 What is the inter- and intra-subject variability of PK parameters in volunteers and patients, and what are the major causes of variability? The PK parameters could not be compared between patients and volunteers due to the risk of SCCs in volunteers. The inter-subject variability was relatively small at 37% for Cmax and 32% for AUC0-8h on Day 15 at the 960 mg bid dose in study NP25163 (Table 4). The clearance and volume of distribution of vemurafenib were estimated from the pharmacometrics reviewer’s population PK analysis, and the between-subject variability (CV%) was 31.9 and 65.7 respectively. The population PK analysis assessed the influence of covariates age, body weight, height, body mass index, gender, race ethnicity and liver metatstasis, baseline liver function (total bilirubin, AST and ALT) and baseline renal function (creatinine clearance) on the between-patient differences in pharmacokinetic parameters. The pharmacometrics reviewer concluded that none of these covariates had a clinically significant influence on the clearance (CL/F) and the volume of distribution (V/F) of vemurafenib. Currently, the potential effect of food on the PK of vemurafenib is unknown. 2.3 INTRINSIC FACTORS 2.3.1 What intrinsic factors (age, race, weight, height, genetic polymorphisms and organ dysfunction) influence exposure (PK usually) and/or response, and what is the impact of any differences in exposure on efficacy or safety responses? No formal studies have been conducted to assess the effect of age, race, weight, height, genetic polymorphisms or organ dysfunction on exposure and response to vemurafenib. The pharmacometrics reviewer’s population PK analysis did not identify clinical significant effects of age, gender, weight, age, baseline renal function and baseline hepatic function as covariates on clearance or volume of distribution of vemurafenib. Relationship between Gender and Exposure Based on the pharmacometrics reviewer’s population pharmacokinetic analysis, gender has no effect on vemurafenib pharmacokinetics. Relationship between Race and Exposure The effect of race was not possible to assess using the population PK analysis as 100% of the patients were Caucasian in the clinical trials. Relationship between Weight and Exposure Based on the pharmacometrics reviewer’s population pharmacokinetic analysis, there was no clinically relevant effect of body weight on vemurafenib exposure.
Reference ID: 2968791

NDA 202-429 Review – Vemurafenib 23
Relationship between Age and Exposure Based on the pharmacometrics reviewer’s population pharmacokinetic analysis, age has no statistically significant effect on vemurafenib pharmacokinetics. Relationship between Renal Impairment and Exposure: The applicant did not conduct a dedicated organ impairment trial to assess the effect of renal impairment on vemurafenib exposure. The pharmacometrics reviewer’s population PK analysis (using the dataset from the population PK analysis) indicated that baseline renal function (creatinine clearance estimated using Cockroft-Gault) did not have a significant effect on the clearance or volume of distribution of vemurafenib (Figure 10). The baseline renal function data included in the analysis comprised of 353 patients with normal renal function, and 94, 11 and 1 patients with mild, moderate and severe pre-existing renal impairment, respectively. As only one patient was enrolled that had severe renal impairment, a definitive conclusion regarding the effect of severe renal impairment on vemurafenib exposure in cannot be made.
-0.5
0.0
0.5
1.0
0 50 100 150
Creatinine CL (mL/min)
Inte
r-Ind
ivid
ual V
aria
bilit
y fo
r CL/
F
-1.0
-0.5
0.0
0.5
0 50 100 150
| | | | | | | | | |
Creatinine CL (mL/min)
Inte
r-In
divi
dual
Var
iabi
lity
for C
L/F
Figure 10. FDA population PK analysis: Final model results of inter-individual variation versus creatinine CL suggest that creatinine clearance is not a covariate for CL/F. Relationship between Hepatic Impairment and Exposure: The pharmacometrics reviewer’s population PK analysis indicated that baseline hepatic function (total bilirubin range) from patients enrolled in the phase 3 trial (NO25026) did not have significant effects on the clearance or volume of distribution of vemurafenib (Figure 11). The baseline hepatic function data included in the analysis comprised of 158 patients with normal hepatic function and 58, 27 and 3 patients with mild, moderate and severe hepatic impairment, respectively as defined by the NCI criteria for hepatic impairment. As only three patients were enrolled that had severe hepatic impairment, a definitive conclusion regarding the effect of severe hepatic impairment on vemurafenib exposure cannot be made. The results based on the baseline AST and ALT were similar, and are not shown.
Reference ID: 2968791

NDA 202-429 Review – Vemurafenib 24
-0.5
0.0
0.5
1.0
0 20 40 60 80
Bilirubin
Inte
r-Ind
ivid
ual V
aria
bilit
y fo
r CL/
F
-2.0
-1.5
-1.0
-0.5
0.0
0.5
1.0
0 20 40 60 80
| | | || | | |
Bilirubin
Inte
r-In
divi
dual
Var
iabi
lity
for C
L/F
-
0
2
3
0 20 40 60 80
Bilirubin
Inte
r-In
divi
dual
Var
iabi
lity
for V
/F
-2
-1
0
1
0 20 40 60 80
| || | || | | |
Bilirubin
Inte
r-Ind
ivid
ual V
aria
bilit
y fo
r V/F
Figure 11. FDA population PK analysis: Final model results of inter-individual variation versus bilirubin suggest that bilirubin is not a covariate for CL/F and V/F. Note: Bilirubin units for all four plots: (μmol/L). 2.3.2 Based upon what is known about exposure-response relationships and their variability and the groups studied, healthy volunteers vs. patients vs. specific populations, what dose adjustments, if any, are recommended for each of these groups? If dose adjustments are not based upon exposure-response relationships, describe the alternative basis for the recommendation. Renal and Hepatic Impairment: Patients with metastatic melanoma and normal renal function or baseline mild, moderate and severe renal impairment were included in clinical trials with vemurafenib. In the FDA population pharmacokinetic analysis using data from subjects in clinical trials with metastatic melanoma, baseline renal function did not influence the clearance of vemurafenib (Figure 10). Data from patients enrolled in trial NP25163, NP22657 and NO25026 were categorized based on the renal impairment classifications in the FDA guidance. Specifically, 352 patients had normal renal function, and 94, 11 and 1 patients had pre-existing mild moderate and severe renal impairment, respectively (Figure 12 and Table 8). Vemurafenib exposure (CL) appeared similar when comparing patients with normal renal function to those with mild and moderate renal impairment. Therefore, no dose adjustments are needed for mild and moderate renal impairment. Vemurafenib should be administered with caution in patients with severe renal impairment, or patients undergoing peritoneal dialysis or hemodialysis, as clinical data or pharmacokinetic data from only one patient with end stage renal disease (Creatinine Clearance calculated using Cockcroft Gault = 0.086) were available. Based on discussion with the medical team, patients with metastatic melanoma do not present with severe renal
Reference ID: 2968791

NDA 202-429 Review – Vemurafenib 25
impairment, as the disease does not typically metastasize to the kidney. 0
2040
6080
••••••••••
••
••
••••
Normal Mild Moderate Severe
"CrCL Group"
"CL
(L/d
ay)"
n=352 n=94 n=11 n=1
Figure 12. Patient data ere categorized based on the renal impairment classifications in the FDA guidance. There was no trend towards increased exposure (decreased CL) to vemurafenib with increasing renal impairment (mild and moderate impairment). Vemurafenib should be administered with caution in patients with severe renal impairment or patients undergoing peritoneal dialysis or hemodialysis, as clinical data or pharmacokinetic data from only one patient with severe renal impairment (CLcr = 0.086 mL/min) were available for the analysis. Table 8. Data from patients enrolled in trial NP25163, NP22657 and NO25026 were categorized based on the renal impairment classifications in the FDA guidance (Data from Figure 12). Renal Function Normal Mild Moderate Severe N 353 94 11 1 Min CLcr (mL/min) 90.4 60.3 31.7 0.086 Max CLcr (mL/min) 295 (150) 89.9 59.0 0.086 CL geometric least squares mean 32.2 29.8 30.7 30.4 CL Test/Reference ratio of geometric least squares means
0.93 (Mild vs. Normal)
0.95 (Moderate vs. Normal)
0.94 (Severe vs. Normal)
Patients with metastatic melanoma and baseline mild, moderate and severe hepatic impairment were included in the phase 3 trial (NO25026). In the FDA population pharmacokinetic analysis using data from clinical trials in subjects with metastatic melanoma, baseline hepatic function did not influence the clearance of vemurafenib (Figure 11). The total bilirubin values at baseline were used to classify patients into hepatic impairment categories. Specifically, the NCI criteria for hepatic impairment were used to classify patients into hepatic impairment categories. There were 158, 58, 27, and 3 individuals that would be classified as having baseline normal hepatic function and mild, moderate and severe pre-existing hepatic impairment,
Reference ID: 2968791

NDA 202-429 Review – Vemurafenib 26
respectively (Figure 13 and Table 9). The results indicated that vemurafenib exposure (CL) appeared similar when comparing patients with normal hepatic function to those with mild and moderate pre-existing hepatic impairment (Figure 13). Therefore, pre-existing mild and moderate hepatic impairment are not expected to influence vemurafenib exposure, and dose adjustment is not necessary. Based on the small number of patient data in the pre-existing severe hepatic impairment category (n=3), it cannot be ruled out that severe hepatic impairment does not affect the PK of vemurafenib. Vemurafenib should be administered with caution in patients with pre-existing severe hepatic impairment. A clinical trial to assess the effect of severe hepatic impairment on the PK of vemurafenib will be a post marketing requirement.
020
4060
80
••••••
••
•••
••
Normal Mild Moderate Severe
"NCI Group"
"CL
(L/d
ay)"
n=158 n=58 n=27 n=3
Figure 13. NCI criteria for hepatic impairment were used to classify patients into categories of normal hepatic function, and mild, moderate and severe hepatic impairment. The results indicated that vemurafenib exposure (CL) was similar for patients with normal hepatic function and pre-existing mild and moderate hepatic impairment. Table 9. Data from patients enrolled in trial NO25026 were categorized based on the NCI hepatic impairment classifications. Hepatic Function Normal Mild Moderate Severe N 158 58 27 3 Min Total Bilirubin (mg/dL) 0.5 3.42 6.84 4 Max Total Bilirubin (mg/dL) 16000 28000 59.9 152 Min Fold Change from ULN 0.25 1.033 1.54 3.54 Max Fold Change from ULN 1 1.5 2.95 9.5 CL geometric least squares mean 33.1 28.8 28.5 38.7 CL Test/Reference ratio of geometric least squares means
0.87 (Mild vs. Normal)
0.86 (Moderate vs. Normal)
1.17 (Severe vs. Normal)
Reference ID: 2968791

NDA 202-429 Review – Vemurafenib 27
Pediatric patients Safety and effectiveness have not been established in pediatric patients.
2.3.3 What pregnancy and lactation use information is there in the application?
The safety and effectiveness of vemurafenib have not been established in pregnancy and in lactating women.
2.4 EXTRINSIC FACTORS 2.4.1 What extrinsic factors (drugs, herbal products, diet, smoking, and alcohol use) influence dose-exposure and/or -response and what is the impact of any differences in exposure on response? The effects of extrinsic factors such as herbal products, diet, smoking and alcohol use on the dose-exposure and/or dose-response for vemurafenib were not assessed in a formal study. Drug-drug interactions 2.4.2 Is there an in vitro basis to suspect in vivo drug-drug interactions? As a substrate (in vitro) The in vitro screen suggests that CYP3A4 is responsible for the formation of the human metabolite M3 (1033024). Similarly, the mass balance trial shows that the M3 metabolite found in plasma, urine and feces. Since the absolute bioavailability of vemurafenib is not known, the PK of vemurafenib may be affected by strong CYP3A4 inhibitors or inducers in vivo. As an inhibitor (in vitro) The PK drug-drug interaction potential of vemurafenib was evaluated (study 1028057) using gender-pooled human liver microsomes and probe substrates for, and IC50 values are shown below (Table 10). All CYP substrates used were FDA preferred and acceptable chemical substrates for in vitro experiments. The mean Cmax at steady state in humans is approximately 125 µM and exceeds the concentration of vemurafenib used in this study. In addition, the I/IC50 values are all >1. Therefore, an in vivo evaluation of the drug-drug interaction potential was conducted using an in vivo cocktail approach (Section 2.4.4). Table 10: IC50 values (µM) and I/IC50 ratios for vemurafenib inhibition of CYP activities in human liver microsomes (1028057). Values represent the Mean of N=6.
P450 Isozyme Substrate R05185426 IC50 (µM) Cmax (µM) Cmax/IC50 ratio CYP1A2 ethoxyresorufin 32.5 125 3.8 CYP2A6 coumarin > 50 125 2.5 CYP2C9 tolbutamide 5.9 125 21.2 CYP2C19 S-mephenytoin 22.5 125 5.6 CYP2D6 bufuralol 33.2 125 3.8 CYP2E1 chlorzoxazone > 50 125 2.5
CYP3A4/5 midazolam > 50 125 2.5 The inhibition of clinically relevant enzymes (based on the recent FDA guidance for industry) CYP2C8 and CYP2B6 was not evaluated, and a study to address this will be requested as a post-marketing requirement. Study 1028057 also evaluated the time dependent inhibition (TDI) of CYP3A4/5 by preincubation of vemurafenib with pooled human liver microsomes, followed by assessment of CYP3A4/5 activity. After the preincubation with vemurafenib, the loss of CYP3A4/5 activity was 8.6% of control, whereas the positive control (ethynylestradiol, moderate TDI of CYP3A4/5) caused a 20% decrease in activity (Table 11). The concentration of vemurafenib used in this study is below clinically relevant
Reference ID: 2968791

NDA 202-429 Review – Vemurafenib 28
concentrations. The applicant conducted an in vivo cocktail approach drug-drug interaction trial to assess the potential inhibition of CYP3A4 by vemurafenib (see Section 2.4.4). Table 11: TDI of CYP3A4/5 by R05185426 (1028057)
As an inducer (in vitro) Study 1027875 evaluated vemurafenib mediated induction of CYP isozymes in primary human hepatocytes cultures from three human donors. Based on the FDA guidance for industry studies using human hepatocytes in culture are acceptable and if the increase in enzyme activity for the NME treated cells is > 40% of the positive control, the NME is considered an enzyme inducer and an in vivo induction study is recommended. The applicant evaluated induction of CYP1A2, 2B6, 2C9 and 3A4/5 by vemurafenib. The > 40% threshold was reached for CYP3A4 mRNA induction with vemurafenib for two of the three hepatocytes donor cultures, however enzyme activity did not increase. The mean Cmax at steady state in humans is approximately 125 µM and exceeds the concentration of vemurafenib used in this study. Therefore, an in vivo evaluation of the drug-drug interaction potential was conducted using an in vivo cocktail approach (see Section 2.4.4). 2.4.4 Is the drug an inhibitor and/or an inducer of CYP enzymes? In vivo evaluation of vemurafenib drug interaction potential: A drug “cocktail approach” was used in trial NP22676 to investigate the potential drug-drug interactions of vemurafenib with multiple CYP enzymes in patients with metastatic melanoma. The applicant used a combination of probe drugs known as the “Cooperstown 5+1 cocktail” in trial NP22676. The reviewer notes that the experimental design used corresponded with published validation reports for this specific cocktail and appeared acceptable from a clinical pharmacology perspective. Each of the five drugs in the cocktail is a substrate for a specific cytochrome P450: caffeine (CYP1A2); warfarin (CYP2C9) (co-administered with vitamin K as an antidote for the anticoagulation effect); omeprazole (CYP2C19); dextromethorphan (CYP2D6); and midazolam (CYP3A4). The drug-drug interaction evaluation period was from Day 1 to Day 25. On Day 1, patients received single doses of the five probe drugs followed by a 5-day washout period. Blood samples were collected from Days 1 through 5 (treatment period A) to establish a baseline PK profile for the five probe drugs and their major metabolites when administered without vemurafenib. On Day 6, patients began receiving oral doses of vemurafenib at 960 mg bid. (treatment period B). Blood samples were collected on Day 19 to establish a steady-state PK profile for vemurafenib monotherapy. On Day 20, the five probe drugs and vemurafenib were co-administered. Blood samples were collected from Days 20 through 25 (treatment period C) to establish PK profiles for the five probe drugs and their respective metabolites when co-administered with vemurafenib. Patients could not be poor metabolizers of CYP2C9, 2C19 or 2D6 as determined by genotyping. The probe-alone treatment group was the reference, while the vemurafenib treatment group was the test group. The nominal 90% CI was compared with a range of 0.8–1.25 used as the reference range for the equivalence boundary to determine the effect of vemurafenib on the PK parameter of interest for the metabolic probe and (where applicable) its metabolite. The applicant assessed the drug-drug interaction
Reference ID: 2968791

NDA 202-429 Review – Vemurafenib 29
potential by calculating first the parent/metabolite ratios for each probe, and then calculating the geometric mean test/reference ratio and 90% CI for the parent/metabolite ratios for each probe. If the 90% CI was within the 0.80 to 1.25 limit, it was concluded that a drug-drug interaction is not likely. FDA recommends assessment of drug-drug interaction potential using the cocktail approach by calculating the geometric mean test/reference ratio of the probe substrate (parent) and not the geometric mean test/reference ratio of the parent/metabolite ratio as was done by the applicant. FDA recommends that the statistical analysis for determination of equivalence between each probe (parent drug) plasma exposures, with and without vemurafenib should be determined by using a pre-defined equivalence boundary of 0.8 to 1.25 of the 90% confidence interval for the test/reference ratio for the parent (probe substrate). A drug-drug interaction will not be likely, if the 90% CI of the geometric mean test/reference ratio for the parent (probe) is within the 0.80 to 1.25 equivalence limit. Therefore, the initial analysis conducted by the applicant was not appropriate to determine the potential for interactions between vemurafenib and each of the CYP probe substrates. The results from the repeated analysis using the appropriate geometric mean test/reference ratio for the parent (probe), after and before treatment with vemurafenib, are summarized below (Table 12 and Table 13). Table 12. AUC0-last (ng.hr/mL): Effect of steady state vemurafenib on CYP probes.
Table 13. Cmax (ng/mL): Effect of steady state vemurafenib on CYP probes.
N=20 for all probes except caffeine (N=19), bTest/Reference ratio of geometric least squares mean (period C/A). Overall, the duration of PK sampling was adequate to characterize the complete elimination phase of the probes in the presence and absence of vemurafenib concluded from the limited extrapolation of AUClast to AUC0-infinity. For caffeine, dextromethorphan and midazolam, the equivalence of the extent of exposure (AUC0-last)
Reference ID: 2968791

NDA 202-429 Review – Vemurafenib 30
ratios was not observed between each probe as a single dose alone compared with that particular probe when co-administered with vemurafenib (Table 12 and Table 13). A similar analysis for the metabolites of the probes for these CYPs supported this conclusion (data not shown). The estimated ratios and corresponding 90% CIs were outside the pre-specified equivalence boundary of (0.8, 1.25) for all three probes, and indicate CYP1A2 and CYP2D6 inhibition and CYP3A4 induction by vemurafenib. Vemurafenib decreased the AUC0-last of the CYP3A4 substrate (midazolam) by 39%. The FDA’s drug interaction guidance states that a drug that increases the AUC of substrates by more than 2-fold but less than 5-fold are considered moderate inhibitors. Vemurafenib increased the AUC0-last of the CYP1A2 substrate (caffeine) by 2.6-fold, and therefore can be classified as a moderate inhibitor of CYP1A2 based on the FDA guidance. Vemurafenib increased the AUC0-last of the CYP2D6 substrate (dextromethorphan) by 47%, and therefore can be classified as a weak inhibitor of CYP2D6 based on the FDA guidance. For S-warfarin (substrate for CYP2C9), the constructed 90% CIs for the ratio of the PK parameter of AUC0-last were within the equivalence boundary (Table 11). However, there was an increase in the extent of S-warfarin exposure (AUC0-last) of 18% (Table 12). In addition, in vitro data suggest that vemurafenib is a CYP2C9 inhibitor. Therefore, even though the data suggest that vemurafenib is not an inhibitor of CYP2C9, the applicant recommends labeling to use caution when vemurafenib is co-administered with warfarin in patients with melanoma, and when co-prescribing medications primarily metabolized by CYP2C9. The reviewer agrees with this rationale to increase safety. For omeprazole, the upper bound of the 90% CI for AUC0-last was not contained within the equivalence boundary, however vemurafenib increased the AUC of omeprazole by only 13%, which is less than the required increase in AUC to be classified as a weak inhibitor (Table 12). Therefore, the potential for an interaction between vemurafenib and omeprazole is not clinically relevant. 2.4.5 Are other metabolic/transporter pathways important? Vemurafenib is a substrate and inhibitor of Pgp as shown by in vitro assays, and in vitro interactions are predicted to be likely. Vemurafenib was shown not to be an inhibitor of OATP1B1 and OATP1B3. Transporter Proteins: In an in vitro study (study 1041536), the bi-directional transport of vemurafenib was measured in MDCKII (wt) and MDCKII-MDR1 cells in the A to B and B to A directions. Vemurafenib had a low permeability in both A to B and B to A directions in MDCKII (wt) cells, resulting in an efflux ratio of 0.6. The compound displayed low permeability in the A to B direction and low-medium permeability in the B to A direction, resulting in an efflux ratio of 7.7. The calculated net flux ratio (ERMDR1/ERwt) was 12.8. In the presence of the Pgp inhibitor, elacridar, the transport of vemurafenib was significantly reduced in the B to A direction, resulting in a reduced efflux ratio of <1. Since the inhibitor decreased the flux ratio by more than 50% the results indicate that vemurafenib is a Pgp substrate. An in vitro study (study 1041536) was performed to assess the Pgp inhibitory effect of vemurafenib. This was done by measuring 3H-digoxin (40 nM) and 3H-quinidine (2 μM) as probe substrates in MDCKII-MDR1 cells. Six concentrations of vemurafenib (0.3, 1, 3, 10, 30 and 50 μM) were used for the study. Vemurafenib inhibited digoxin and quinidine transport by increasing influx permeability in the apical (A) to basolateral (B) direction and decreasing efflux permeability in the B to A direction, resulting in reduced efflux ratios. The calculated IC50 values for digoxin and quinidine transport were 17.0 ± 1.2 μM and 3.5 ± 0.3 μM, respectively. The [I]/IC50 ratios (where [I] is the steady state vemurafenib Cmax concentration) are both > 1, and therefore these results indicate that vemurafenib is an inhibitor of human Pgp, with a ‘likely’ risk of in vivo drug-drug interactions.
Reference ID: 2968791

NDA 202-429 Review – Vemurafenib 31
In vitro experiments (study 1041536) showed that vemurafenib is not a substrate for OATP1B1 or OATP1B3. Results also showed that vemurafenib is not an inhibitor of OATP1B1 and OATP1B3. 2.4.6 Does the label specify co-administration of another drug and, if so, has the interaction potential between these drugs been evaluated? The label does not specify co-administration of another drug with vemurafenib. 2.4.7 Are there any in vivo drug-drug interaction studies that indicate the exposure alone and/or exposure-response relationships are different when drugs are co-administered? See section 2.4.4.
2.5 GENERAL BIOPHARMACEUTICS 2.5.1 Based on BCS principles, in what class is this drug and formulation? What solubility, permeability and dissolution data support this classification? Vemurafenib (micro-precipitated bulk powder (MBP) form used in clinical trials) is classified as a BCS Class IV drug due to low solubility and low permeability characteristics. It has not received official BCS classification/designation from the FDA. Solubility: The solubility studies is aqueous media were performed at 37°C, and the results indicate that vemurafenib is practically insoluble in aqueous media across a pH range of 1 to 7.5 (Table 14). Vemurafenib is soluble in organic solvents at 25 °C (Table 15). Table 14: Solubility of vemurafenib (MBP form) in Aqueous Media across the pH range of 1 to 7.5 at 37 oC.
Table 15: Solubility of vemurafenib (MPB form) in Organic Solvents as a 25 °C.
Permeability: Results from study 1040857 showed reported the Caco-2 cell permeability. Permeability values for vemurafenib are significantly lower than the low permeability reference compound ranitidine.
Reference ID: 2968791

NDA 202-429 Review – Vemurafenib 32
Permeability to vemurafenib was slightly higher in the basolateral-to-apical direction, compared to apical-to-basolateral direction (Table 16). Table 16: Caco-2 cell permeability of PLX4032 in vitro (1040857).
2.5.2 What is the composition of the to-be-marketed formulation? The composition of the to-be marketed formulation is summarized in Table 17. Table 17: Composition of a single vemurafenib film-coated tablet.
2.5.3 What moieties should be assessed in bioequivalence studies? The parent active compound, vemurafenib (PLX4032, or RO5185426), was assessed in all the clinical studies, and this is appropriate based on current knowledge. 2.5.4 What is the effect of food on the bioavailability (BA) of the drug from the dosage form? What dosing recommendation should be made, if any, regarding administration of the product in relation to meals or meal types? The effect of food on the PK of vemurafenib is not known. A dedicated food effect study (NP25396) has been initiated. The phase 2 and phase 3 trials (NP22657, NO25026) vemurafenib was administered as a 960 mg oral dose, twice daily (doses approximately 12 hours apart), without regard to food. All PK samples in all clinical trials were obtained following an 8 hour overnight fast, with continued fasting for 4 hours after administration of the morning vemurafenib dose. There was limited inter individual variability in vemurafenib PK parameters at steady state. It is also important to note, that due to the significant accumulation of vemurafenib (accumulation ratio: 7.3) with multiple dosing, the single day fasting condition will not accurately characterize the PK of vemurafenib under true fasted conditions.
Reference ID: 2968791
(b) (4)
(b) (4)
(b) (4)
(b) (4)
NDA 202-429 Review – Vemurafenib 33
There may be three hypothetical effects of food on the PK of vemurafenib. If there is no food effect, then the drug may be administered without regard to food, as in the phase 3 trial.
The efficacy and toxicity of vermurafenib
were characterized in the phase 3 trial when administered without regard to food intake. Therefore, it is recommended that vemurafenib be administered without regard to food, similar to the phase 3 trial. 2.5.5 Has the applicant developed an appropriate dissolution method and specification that will assure in vivo performance and quality of the product? Yes. 2.6 ANALYTICAL SECTION 2.6.1 Were relevant metabolite concentrations measured in the clinical pharmacology and biopharmaceutics studies? Metabolite concentrations were not measured in clinical pharmacology and biopharmaceutics trials. All the submitted clinical pharmacology related studies analyzed samples for vemurafenib only. 2.6.2 Which metabolites have been selected for analysis and why? Not applicable, see above. 2.6.3 For all moieties measured, is free, bound, or total measured? What is the basis for that decision, if any, and is it appropriate? Vemurafenib is highly bound to human plasma proteins. The total concentration of vemurafenib in plasma was measured in the clinical trials, and this was appropriate. 2.6.4 What bioanalytical methods are used to assess concentrations? (Refer to the guidance for industry on Bioanalytical Method Validation, http://www.fda.gov/downloads/Drugs/GuidanceComplianceRegulatoryInformation/Guidances/ucm070107.pdf) Vemurafenib has been analyzed in plasma from humans by two methods. Both methods used High Performance Liquid Chromatogtaphy (HPLC), and analyte detection using positive ion electrospray tandem mass spectrometry (LC/MS/MS). Methods used for each study are summarized in Table 18. Details of both methods are described in validation reports (1040720, 1040721).
Reference ID: 2968791
(b) (4)
(b) (4)

NDA 202-429 Review – Vemurafenib 34
Table 18: Bioanalytical Methods Used for vemurafenib Human Plasma Analyses. (BAR: bioanalytical report number)
• Clinical samples from PLX-06-02 and PLX102-01 were analyzed at The assay was validated over the concentration range of 2.50 to 5000 ng vemurafenib/mL of human plasma using a 0.050 mL plasma sample and crossvalidated over a concentration range of 2.50 to 1200 ng vemurafenib/mL. (1040720) PK samples from the remaining clinical studies in Table 25 were analyzed at where a validated assay with a range of 25.0 to 50000 ng vemurafenib/mL using a sample volume of 0.050 mL (1040721).
• Concentrations of five probe drugs (midazolam, (S)-warfarin, omeprazole, caffeine
dextromethorphan and their metabolites) for CYP450-dependent metabolism were measured in human plasma samples from study NP22676 at by LC/MS/MS using assays validated at
2.6.5 What is the range of the standard curve? How does it relate to the requirements for clinical studies? What curve fitting techniques are used? 1040720 A high performance liquid chromatography tandem mass spectrometry (HPLC/MS/MS) method was validated in this study for the determination of vemurafenib concentration in human plasma. The assay was validated over the concentration range of 2.50 to 5000 ng PLX4032/mL of human plasma using a 50-μL sample. Using Analyst® software version 1.4.1 or 1.4.2, the vemurafenib/IS peak area ratios (y) and the theoretical vemurafenib concentrations of the calibration samples (x) were fit to the linear function using least-squares regression analysis with 1/x2 weighting, excluding the origin: y = ax + b Concentrations and percent relative errors (%RE) were calculated using Analyst®. The concentration data were transferred to a Microsoft® Excel spreadsheet, where appropriate summary statistics (mean, standard deviation [SD], relative standard deviation [RSD] and %RE) were calculated and presented in tabular form. Calibration samples of the standard curve contained 2.50 to 5000 ng vemurafenib/mL. The mean steady state Cmax reported at the clinically relevant proposed dose of 960 mg (bid) was 61.7 µg/mL (approximately 125 µM) in trial NP22676. The concentration range in the calibration curve using diluted samples (20 fold dilution) was in the appropriate range for analysis of vemurafenib
Reference ID: 2968791
(b) (4)
(b) (4)
(b) (4)
(b) (4)
(b) (4)
(b) (4)
(b) (4)
(b) (4)
(b) (4)
(b) (4)
(b) (4)
(b) (4)

NDA 202-429 Review – Vemurafenib 35
concentrations in the clinical trials. 1040721 A high performance liquid chromatography tandem mass spectrometry (HPLC/MS/MS) method was validated for the determination of vemurafenib concentration in human plasma over the concentration range of 25.0 to 50 000 ng/mL. The method utilized a sample volume of 0.0500 mL. Calibration curves for vemurafenib in human plasma were generated using a weighted (1/x2) linear least-squares regression. Only calibration standards having back-calculated values that were accurate within the range 85.0 to 115.0% (80.0 to 120.0% at the LLOQ), were included in the calibration curve. The concentration range in the calibration curve using diluted samples was in the appropriate range for analysis of vemurafenib concentrations in the clinical trials. Validated bioanalytical methods for probe drugs used in drug-drug interaction cocktail study (NP22676): Concentrations of midazolam, (S)-warfarin, omeprazole, caffeine and dextromethorphan and their metabolites (1’-hydroxymidazolam, 5-hydroxyomeprazole, paraxanthine and dextrorphan) in human plasma samples were quantified by HPLC with MS/MS detection. For midazolam and 1’-hydroxymidazolam, calibration curves ranged from 0.100 to 100 ng/mL and were generated using a weighted (1/x2) linear least-squares regression. Calibration curves for (S)-warfarin in human plasma ranged from 5.00 to 1500 ng/mL and were generated using a weighted (1/x2) linear least-squares regression. Calibration curves for omeprazole and 5-hydroxyomeprazole in human plasma ranged from 0.500 to 1000 ng/mL and were generated using a weighted (1/x2) linear least-squares regression. Calibration curves for caffeine and paraxanthine in human plasma ranged from 25.0 to 20000 ng/mL and were generated using a weighted (1/x2) linear least-squares regression. Calibration curves for dextromethorphan and dextrorphan in human plasma ranged from 0.0100 to 10.0 ng/mL and 0.300 to 300 ng/mL, respectively, and were generated using a weighted (1/x2) linear least-squares regression. The concentration range in the calibration curve using diluted samples was in the appropriate range for analysis of all probes and their metabolite concentrations. 2.6.6 What is the QC sample plan? 1040720 QC samples at 7.00, 800, and 4000 ng PLX4032/mL were prepared in triplicate. The inter-session variability, expressed as RSD, of the back-calculated concentrations at each calibration level was ≤ 15%, except at the lowest calibration level where ≤ 20% was acceptable; and 2) the mean back-calculated concentrations at each calibration level were within ± 15% of the theoretical values (%RE within ± 15%) except at the lowest calibration level where %RE within ± 20% was acceptable. 1040721 Six replicates of QC samples at each of the LLOQ, low QC [LQC (75.0 ng/mL)], medium QC [MQC (2000 ng/mL)], and high QC [HQC (37500 ng/mL)] concentrations. Validated bioanalytical methods for probe drugs used in drug-drug interaction cocktail study (NP22676): Batches were considered acceptable if at least one-half of the undiluted QC samples at each concentration and two-thirds of all undiluted QC samples in the curve range were within the range of 85.0% to 115.0% of theoretical. 3 DETAILED LABELING RECOMMENDATIONS Only relevant clinical pharmacology sections are included. The red text is the proposed changes added by the clinical pharmacology reviewer and the sponsors proposed language that has not been accepted is crossed out.
Reference ID: 2968791
(b) (4)
(b) (4)
(b) (4)
(b) (4)
9 Pages of Draft Labeling have been Withheld in Full as b4 (CCI/TS) immediately following this page.

NDA 202-429 Review – Vemurafenib 45
4 APPENDICES
4.1 PHARMACOMETRICS REVIEW
SUMMARY OF FINDINGS
KEY REVIEW QUESTIONS The purpose of this review is to address the following key questions.
Reference ID: 2968791
(b) (4)
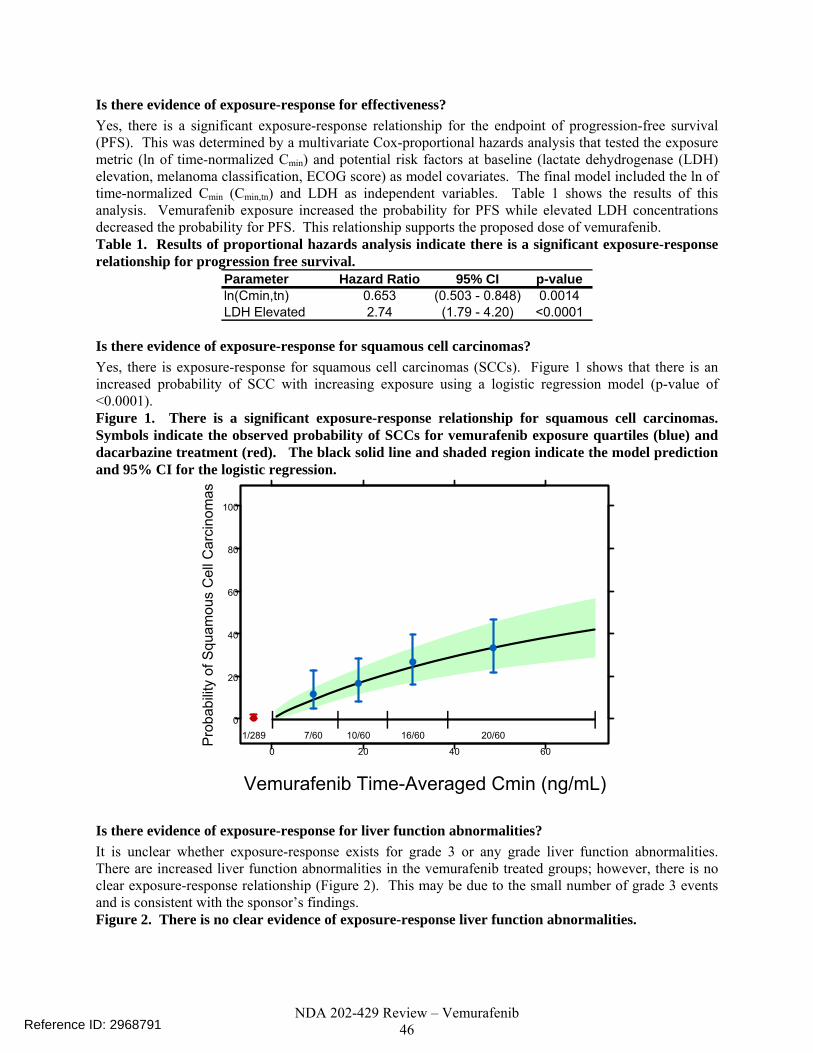
NDA 202-429 Review – Vemurafenib 46
Is there evidence of exposure-response for effectiveness? Yes, there is a significant exposure-response relationship for the endpoint of progression-free survival (PFS). This was determined by a multivariate Cox-proportional hazards analysis that tested the exposure metric (ln of time-normalized Cmin) and potential risk factors at baseline (lactate dehydrogenase (LDH) elevation, melanoma classification, ECOG score) as model covariates. The final model included the ln of time-normalized Cmin (Cmin,tn) and LDH as independent variables. Table 1 shows the results of this analysis. Vemurafenib exposure increased the probability for PFS while elevated LDH concentrations decreased the probability for PFS. This relationship supports the proposed dose of vemurafenib. Table 1. Results of proportional hazards analysis indicate there is a significant exposure-response relationship for progression free survival.
Parameter Hazard Ratio 95% CI p-valueln(Cmin,tn) 0.653 (0.503 - 0.848) 0.0014LDH Elevated 2.74 (1.79 - 4.20) <0.0001
Is there evidence of exposure-response for squamous cell carcinomas? Yes, there is exposure-response for squamous cell carcinomas (SCCs). Figure 1 shows that there is an increased probability of SCC with increasing exposure using a logistic regression model (p-value of <0.0001). Figure 1. There is a significant exposure-response relationship for squamous cell carcinomas. Symbols indicate the observed probability of SCCs for vemurafenib exposure quartiles (blue) and dacarbazine treatment (red). The black solid line and shaded region indicate the model prediction and 95% CI for the logistic regression.
0
20
40
60
80
100
0 20 40 60
| | | | |1/289 7/60 10/60 16/60 20/60
Vemurafenib Time-Averaged Cmin (ng/mL)
Pro
babi
lity
of S
quam
ous
Cel
l Car
cino
mas
Is there evidence of exposure-response for liver function abnormalities? It is unclear whether exposure-response exists for grade 3 or any grade liver function abnormalities. There are increased liver function abnormalities in the vemurafenib treated groups; however, there is no clear exposure-response relationship (Figure 2). This may be due to the small number of grade 3 events and is consistent with the sponsor’s findings. Figure 2. There is no clear evidence of exposure-response liver function abnormalities.
Reference ID: 2968791

NDA 202-429 Review – Vemurafenib 47
0
10
20
30
40
0 20 40 60
| | | | |
4/289 2/61 3/60 8/60 6/61
Vemurafenib Time-Averaged Cmin (ng/mL)
Pro
babi
lity
of G
rade
3+
Live
r Abn
orm
aliti
es
0
10
20
30
40
0 20 40 60
| | | | |
17/293 16/63 10/62 17/62 12/62
Vemurafenib Time-Averaged Cmin (ng/mL)
Prob
abili
ty o
f Any
Gra
de L
iver
Abn
orm
ality
Is the proposed dose acceptable? Yes. Despite the presence of an exposure response for SCCs and elevated liver function abnormalities with vemurafenib treatment, the starting dose is acceptable. The key point for keeping the 960 mg BID starting dose is that there is increased probability for PFS with higher concentrations of vemurafenib and that the sponsor has chosen a dose that is near the maximum tolerated dose. We are not recommending reducing the starting dose or implementing dose reductions for SCC events, because the survival benefit with vemurafenib therapy outweighs the risk of squamous cell carcinomas. Squamous cell carcinoma lesions in the skin layer can be excised. Although dose reductions were not required for SCCs during the trial and are not recommended for this event in the labeled dosing, physicians should be aware of this potential event. The exposure-response relationship is sufficient evidence to support labeling statements that make it clear; there is a risk of squamous cell carcinomas in patients being treated with vemurafenib. We are not recommending a reduction in the starting dose for grade 3 liver function abnormalities because a patient should not be precluded survival benefit because 7% of vemurafenib treated individuals experienced a grade 3 adverse event. The proposed dosing regimen permits dose-interruptions and dose-reductions for this event.
Is the labeling claim that vermurafenib PK differs by gender accurate? No, the sponsor’s claim that gender affects clearance and volume of distribution is not justified. The difference in apparent clearance (CL/F) and apparent volume of distribution (V/F) between males and females can be explained by body weight. In the sponsor’s model, body weight was not identified as a covariate, yet no physiological reason was provided as to why gender was necessary as a covariate on both CL/F and V/F. Body weight was tested as a covariate on CL/F and V/F in an FDA revised model where gender was not a covariate on CL/F or V/F. The results indicated that body weight explains differences between gender (Figure 3) and reduces inter-subject variability for individuals with low or high body weight (see Section 0). Figure 3. Body weight as a covariate on vemurafenib CL/F explains differences in CL/F between males and females.
Reference ID: 2968791

NDA 202-429 Review – Vemurafenib 48
FDA Revised Model: w. Weight In
ter-
indi
vidu
al v
aria
bilit
y fo
r CL/
F
-0.5
0.0
0.5
1.0
(N=190) (N=268)
Females Males
Sponsor’s Final Model: w. Gender
Inte
r-in
divi
dual
var
iabi
lity
for C
L/F
-0.5
0.0
0.5
1.0
(N=190) (N=268)
Females Males
RECOMMENDATIONS The office of clinical pharmacology division of pharmacometrics has reviewed this application and found the vemurafenib NDA acceptable.
LABEL STATEMENTS
Reference ID: 2968791
(b) (4)

NDA 202-429 Review – Vemurafenib 49
PERTINENT REGULATORY BACKGROUND Hoffman La-Roche is seeking approval for TRADENAME® (vemurafenib) as a single agent, first-line therapy for the treatment of BRAFV600 mutation-positive unresectable or metastatic melanoma. Vemurafenib is a first-in-class small molecule drug and a new molecular entity. This is the first NDA submission/efficacy supplement for vemurafenib.
RESULTS OF SPONSOR’S ANALYSIS The sponsor performed population PK analysis to determine important covariates affecting vemurafenib clearance and disposition. The results are described in the proposed label. The sponsor also performed exposure-response analyses for both effectiveness and safety. The results were provided as supportive evidence of 1) pharmacological activity of vemurafenib and 2) safety.
CLINICAL TRIALS USED IN ANALYSES The clinical development of vemurafenib consisted of 6 trials. A phase 1 dose escalation trial with an extension phase, a phase 2 trial in previously treated patients with the BRAFV600 mutation, and a phase 3 trial in treatment naive patients with the BRAF mutation were conducted to evaluate efficacy and safety of vemurafenib. Three clinical pharmacology trials were also performed. These included a mass balance study, cytochrome P450 metabolism study, and pharmacokinetic study. The three trials relevant to the population PK and exposure-response analyses are described in more detail below.
Phase I PK/PD (Trial NP25163) This was a randomized, open-label, uncontrolled, multicenter trial in previously treated patients with BRAFV600 mutation-positive unresectable Stage IIIc/IV melanoma. The trial was designed to determine the PK of the 240 mg tablet formulation in patients given 240 mg, 480 mg, 760 mg, and 960 mg of twice-daily vemurafenib. Fifty-two patients enrolled in the trial. There were 12 patients in each of the lowest three dose groups and 16 patients in the 960 mg BID dose group. This was a three period trial. In the first period, patients received one of the four dose levels twice-daily for fifteen days. The second period was a washout for 6 days. In the third period (day 22 onward), patients received 960 mg bid until death, disease progression, premature withdrawal, or lost to follow up. Pharmacokinetic samples were collected at pre-dose, 1, 2, 4, 5, 8, and 24 hours post dose on study days 1, 9, and 15. Samples were collected pre-dose, and 2-4 hours post dose at the beginning of each cycle (3 weeks) in the extension period of the trial. Starting with cycle 9 samples were collected at the beginning of every other cycle. Secondary objectives of the study included evaluation of the 1) safety and tolerability of vemurafenib and 2) effectiveness on best-overall response rate (BORR) and overall survival (OS).
Phase 2 Trial, NP22657 This was a nonrandomized, single-arm, open-label, uncontrolled, multicenter study in previously treated patients with BRAFV600 mutation-positive Stage IV melanoma. The objective of this study was to evaluate the efficacy (BORR) of vemurafenib with sub-study to assess QTc interval and vemurafenib exposure. One hundred thirty-two patients enrolled in the trial. All patients received 960 mg BID as a starting dose. Temporary dose reductions, in increments of 240 mg, were permitted for intolerable grade
Reference ID: 2968791
(b) (4)

NDA 202-429 Review – Vemurafenib 50
2 or higher safety events until the patient’s grade of safety event was one or lower. Patients were continually dosed with oral vemurafenib 960 mg bid until progression of disease, unacceptable toxicity, withdrawal of consent, or other reason as determined by the investigator. The primary trial endpoint was BORR as adjudicated by an independent review committee. Secondary endpoints included time to response, progression free survival (PFS) and OS. Safety and tolerability data were also collected over the course of the trial. Pharmacokinetic samples were collected on Days 1 and 15 of Cycle 1 at predose and 2, 4, 6 and 8 hours post dose, and on Day 1 of Cycles 2, 3, 4, 6, 8 and 10 at predose and 4 hours post dose. PK samples were also collected at disease progression when study treatment was stopped indefinitely and when the biopsy sample from the progressing lesion was taken. Starting after Cycle 10, samples were collected predose on Day 1 of every other 3-week cycle (every 6 weeks, i.e., Cycle 12, 14, 16, etc.).
Phase 3 Trial, NO25026 This was a randomized, open-label, active treatment controlled, multicenter study in previously untreated patients with BRAFV600 mutation-positive unresectable Stage IIIc/IV melanoma. The objectives of this study were to evaluate the efficacy (OS and PFS) of vemurafenib compared to dacarbazine treatment (DTIC) and to assess the PK of the 240 mg film-coated tablet formulation. There were 337 patients randomized to the 960 mg BID vemurafenib treatment group and 338 patients randomized to the DTIC group. Temporary dose reductions were permitted for intolerable grade 2 or higher safety events until the patient’s grade of safety event was one or lower. Patients were continually dosed with oral vemurafenib 960 mg bid until death, disease progression, premature withdrawal, or lost to follow-up. The co-primary efficacy endpoints were OS and PFS. Other secondary endpoints included time to response, BORR, and tumor size. Safety data were collected over the course of the trial. Pharmacokinetic samples were collected pre-dose and 2-4 hr post-dose at the beginning of cycles 1, 2, 3, and 4 and at the beginning of every other cycle thereafter.
POPULATION PHARMACOKINETICS OF VEMURAFENIB The sponsor used data from studies NP25163, NP22657, and NO25026 in patients with BRAFV600 mutation-positive unresectable Stage IIIc/IV melanoma to develop their population PK model. The sponsor’s objectives were to describe vemurafenib PK, identify covariates that contribute significantly to the between-patient differences, and determine individual estimates for derived PK parameters (i.e. AUC) for exposure-safety and efficacy graphical analyses.
Methods A total of 5515 plasma concentrations from 459 patients in the Phase 1, Phase 2, and Phase 3 studies were used to develop the population PK model. Descriptions of these studies and sampling schedules can be found in Sections 0 – 0. The population pharmacokinetic analysis and all simulations were performed using NONMEM version 7.1.0. The sponsor identified a basic structural model followed by a final model that incorporated covariates. An automated GAM analysis and bootstrap was implemented to identify potential covariates to include in the model. Forward selection followed by backward elimination was performed to finalize the covariate model structure. Standard diagnostics including goodness-of-fit plots and plots of weighted residual error were also used to elucidate model structure and covariate correlation. The sponsor conducted simulations with the patient’s PK parameters to determine secondary parameters that were then used for exposure-safety and exposure-efficacy analyses.
Results & Sponsor’s Conclusions • The pharmacokinetics of vemurafenib were described by a one-compartment open model with first-
order absorption and first-order elimination. Final model parameters are shown in Table 2.
Reference ID: 2968791
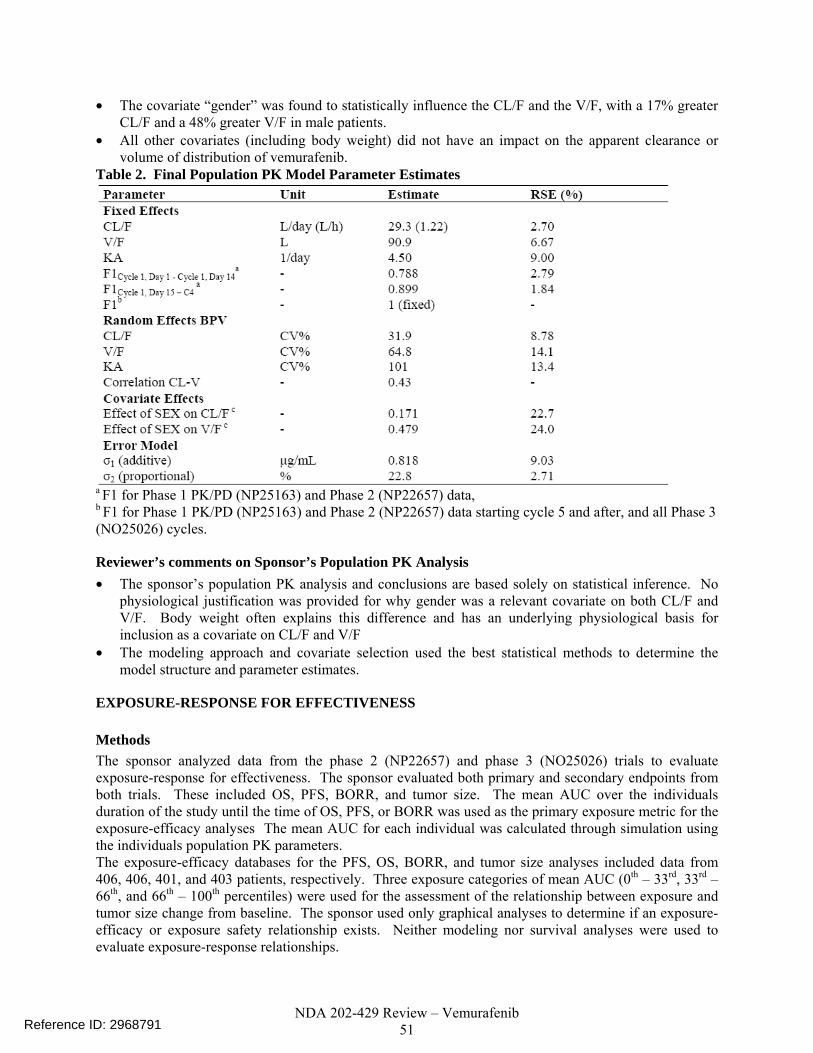
NDA 202-429 Review – Vemurafenib 51
• The covariate “gender” was found to statistically influence the CL/F and the V/F, with a 17% greater CL/F and a 48% greater V/F in male patients.
• All other covariates (including body weight) did not have an impact on the apparent clearance or volume of distribution of vemurafenib.
Table 2. Final Population PK Model Parameter Estimates
a F1 for Phase 1 PK/PD (NP25163) and Phase 2 (NP22657) data, b F1 for Phase 1 PK/PD (NP25163) and Phase 2 (NP22657) data starting cycle 5 and after, and all Phase 3 (NO25026) cycles.
Reviewer’s comments on Sponsor’s Population PK Analysis • The sponsor’s population PK analysis and conclusions are based solely on statistical inference. No
physiological justification was provided for why gender was a relevant covariate on both CL/F and V/F. Body weight often explains this difference and has an underlying physiological basis for inclusion as a covariate on CL/F and V/F
• The modeling approach and covariate selection used the best statistical methods to determine the model structure and parameter estimates.
EXPOSURE-RESPONSE FOR EFFECTIVENESS
Methods The sponsor analyzed data from the phase 2 (NP22657) and phase 3 (NO25026) trials to evaluate exposure-response for effectiveness. The sponsor evaluated both primary and secondary endpoints from both trials. These included OS, PFS, BORR, and tumor size. The mean AUC over the individuals duration of the study until the time of OS, PFS, or BORR was used as the primary exposure metric for the exposure-efficacy analyses The mean AUC for each individual was calculated through simulation using the individuals population PK parameters. The exposure-efficacy databases for the PFS, OS, BORR, and tumor size analyses included data from 406, 406, 401, and 403 patients, respectively. Three exposure categories of mean AUC (0th – 33rd, 33rd – 66th, and 66th – 100th percentiles) were used for the assessment of the relationship between exposure and tumor size change from baseline. The sponsor used only graphical analyses to determine if an exposure-efficacy or exposure safety relationship exists. Neither modeling nor survival analyses were used to evaluate exposure-response relationships.
Reference ID: 2968791

NDA 202-429 Review – Vemurafenib 52
Results & Sponsor’s Conclusions
Overall Survival The sponsor concluded there was no apparent trend between vemurafenib mean AUC and OS. Their results are shown in Figure 4. Figure 4. Overall Survival vs. Mean AUC. Open symbols represent individual observed survival times and model predicted AUC values. The solid yellow line is the loess fitting of the data.
(Source: Sponsor’s PopPK and PK/PD Report, Figure 18)
Progression-Free Survival The sponsor concluded there was no apparent trend between vemurafenib mean AUC and PFS. Results are shown for data from patients who dropped out for any reason in Figure 5 and for those who dropped out of the study due or disease progression in Figure 6. Figure 5. Progression Free Survival vs. Mean AUC for Patients who Dropped Out for Any Reason. Open symbols represent individual observed survival times and model predicted AUC values. The solid yellow line is the loess fitting of the data.
(Source: Sponsor’s PopPK and PK/PD Report, Figure 19)
Reference ID: 2968791
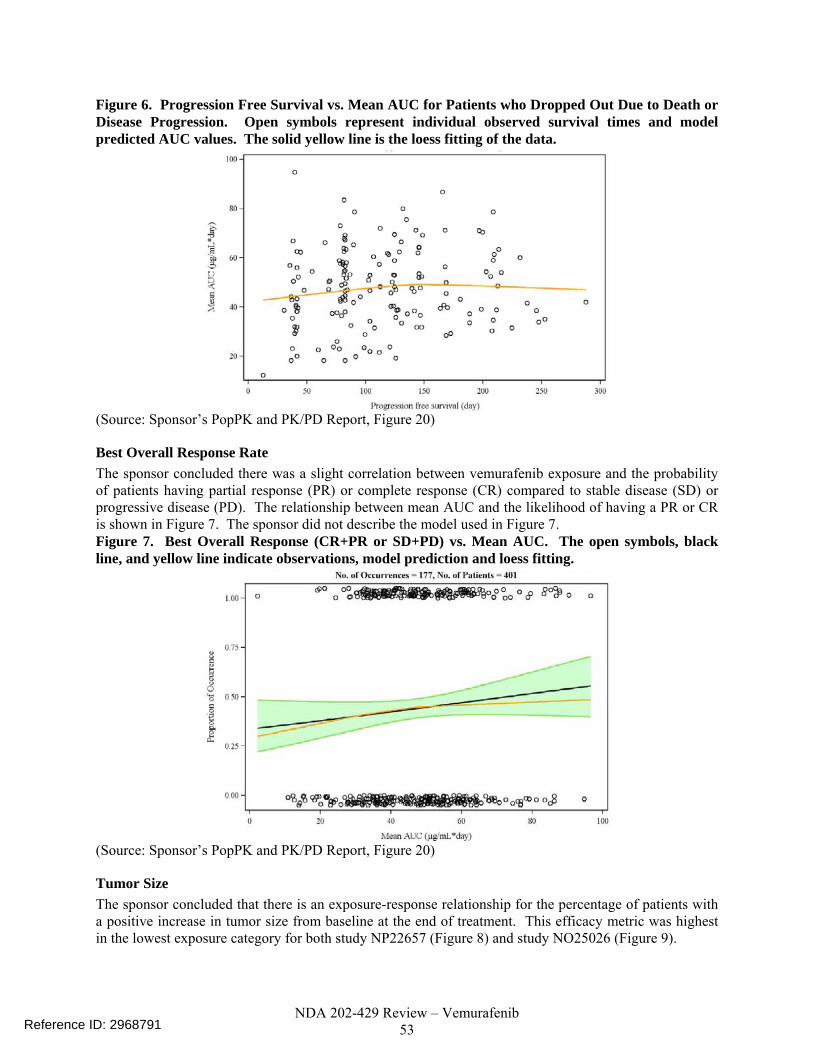
NDA 202-429 Review – Vemurafenib 53
Figure 6. Progression Free Survival vs. Mean AUC for Patients who Dropped Out Due to Death or Disease Progression. Open symbols represent individual observed survival times and model predicted AUC values. The solid yellow line is the loess fitting of the data.
(Source: Sponsor’s PopPK and PK/PD Report, Figure 20)
Best Overall Response Rate The sponsor concluded there was a slight correlation between vemurafenib exposure and the probability of patients having partial response (PR) or complete response (CR) compared to stable disease (SD) or progressive disease (PD). The relationship between mean AUC and the likelihood of having a PR or CR is shown in Figure 7. The sponsor did not describe the model used in Figure 7. Figure 7. Best Overall Response (CR+PR or SD+PD) vs. Mean AUC. The open symbols, black line, and yellow line indicate observations, model prediction and loess fitting.
(Source: Sponsor’s PopPK and PK/PD Report, Figure 20)
Tumor Size The sponsor concluded that there is an exposure-response relationship for the percentage of patients with a positive increase in tumor size from baseline at the end of treatment. This efficacy metric was highest in the lowest exposure category for both study NP22657 (Figure 8) and study NO25026 (Figure 9).
Reference ID: 2968791

NDA 202-429 Review – Vemurafenib 54
Figure 8. Percent Change from Baseline in Tumor Size by Category of Mean AUC. The percentage of patients with a positive increase in tumor size from baseline at the end of treatment are denoted by *
(Source: Sponsor’s Pop PK and PK/PD Report, Figure 15) Figure 9. Percent Change from Baseline in Tumor Size by Mean AUC Category. The percentage of patients with a positive increase in tumor size from baseline at the end of treatment are denoted by *
Reference ID: 2968791

NDA 202-429 Review – Vemurafenib 55
(Source: Sponsor’s Pop PK and PK/PD Report, Figure 16)
Reviewer’s comments on Sponsor’s Exposure-Efficacy Analyses • The sponsor’s plots present the data in a way that do not take into account the effect of censoring for
patient dropout for reasons other than OS or PFS. Kaplan-Meier plots and Cox-proportional hazards analysis are methods that take censoring into consideration.
• The exposure-response analysis also does not include consider other factors relevant to disease progression (e.g. elevated LDH, ECOG score, disease classification). See the reviewer’s analysis for additional analyses.
• It is not possible to comment on the sponsor’s model for BORR because they did not provide a description of the model.
• The sponsor’s analysis for the tumor size is acceptable. Both the time course of tumor size and the percentage of patients with an increase in tumor size at their last measurement are shown. Metrics such as percentage of patients with a certain degree of tumor reduction or time-averaged tumor reduction were not provided for the phase 2 and phase 3 data combined.
EXPOSURE-RESPONSE FOR SAFETY
Methods The sponsor analyzed data from the phase 2 (NP22657) and phase 3 (NO25026) trials to evaluate exposure-response for safety. The sponsor evaluated exposure-response for liver laboratory abnormalities and skin toxicities. The mean AUC over the individuals duration of the study until the time of the safety event was used as the primary exposure metric for the exposure-safety analyses The mean AUC for each individual was calculated by simulation using the population PK model and the individual’s PK parameter estimates. The exposure-safety database included data from 406 patients (132 from trial NP22657 and 274 from trial
Reference ID: 2968791

NDA 202-429 Review – Vemurafenib 56
NO25026). Ninety-six patients (24%) had an elevated liver laboratory measurement. Sixty-four patients (16%) had SCC and 29 patients (7%) had keratoacanthoma. The sponsor used graphical analyses to determine if an exposure-efficacy or exposure safety relationship exists.
Results & Sponsor’s Conclusions
Liver Abnormalities Based on Figure 10, the sponsor concluded there was no apparent effect of vemurafenib exposure on occurrences of liver laboratory abnormalities for ALT, AST, GGT, and total bilirubin. Additionally, an analysis that grouped the data by Cmin did not shown a trend for increasing percentage of liver abnormalities with increasing exposure quartile (Table 3). Figure 10. Proportion of occurrence for ALT elevation (top left panel), AST elevation (top right panel), GGT elevation (bottom left panel), and total bilirubin elevation (bottom right panel) versus mean AUC. The open symbols, yellow line, and black line indicate observations, loess fitting, and model prediction. (The model was not described in detail)
(Source: Sponsor’s Population PK and PK/PD Report, Figure 12)
Reference ID: 2968791

NDA 202-429 Review – Vemurafenib 57
Table 3. Percentage of patients with grade ≥3 liver abnormalities by Cmin Quartiles.
(Source: Sponsor’s Summary of Clinical Pharmacology Studies, Table 30)
Skin Toxicities Based on Figure 11, the sponsor stated higher exposures appear to slightly increase the probability of occurrences for cutaneous squamous cell carcinoma (cuSCC), SCC of the skin, and keratoacanthoma. Additionally, an analysis that grouped the data by Cmin indicated a trend for increasing percentage of patients with cutaneous SCC with increasing exposure quartile for only the lowest three exposure quartiles (Table 4). Figure 11. Proportion of occurrence for cutaneous SCC (top left panel), SCC of skin (top right panel), and keratoacanthoma (bottom center panel) versus mean AUC. The open symbols, yellow line, and black line indicate observations, loess fitting, and model prediction. (The sponsor did not describe the model used for the predictions in the plots)
(Source: Sponsor’s Population PK and PK/PD Report, Figure 13)
Reference ID: 2968791

NDA 202-429 Review – Vemurafenib 58
Table 4. Percentage of patients with cutaneous SCC by Cmin quartiles.
(Source: Sponsor’s Summary of Clinical Pharmacology Studies, Table 31)
Reviewer’s comments on Sponsor’s Exposure-Efficacy Analysis • In general the graphical analyses are acceptable, however it is difficult to discern relationships from
the dichotomous scatter plots used for this analysis. Further, the sponsor should have described, in-detail, the model used for the prediction and 95% confidence intervals in each plot.
• The table analyses by exposure quartile help supplement the scatter plots and are consistent with the sponsors conclusions regarding exposure-response for safety.
REVIEWER’S ANALYSIS
INTRODUCTION An independent pharmacometric analysis is presented that evaluates the conclusions made by the sponsor. With regards to population PK it is unusual that gender, instead of body weight, be a covariate on CL/F and V/F. This review aims to determine if gender differences for CL/F and V/F can be explained by body weight. Exposure-response for effectiveness and safety were also conducted to determine if the dose was optimally chosen.
OBJECTIVES Analysis objectives are: 1. To determine if there is evidence of ER for efficacy and safety endpoints
2. To determine if the label claims regarding the PK of vemurafenib are accurate
METHODS
Data Sets Data sets used are summarized in Table 5. Table 5. Analysis Data Sets Study Number
Name Link to EDR
25026 pconpks.xpt \\Cdsesub1\evsprod\NDA202429\0002\m5\datasets\no25026\analysis
25026 demo.xpt \\Cdsesub1\evsprod\NDA202429\0002\m5\datasets\no25026\analysis
25026 medtext.xpt \\Cdsesub1\evsprod\NDA202429\0002\m5\datasets\no25026\analysis
25026 pat.xpt \\Cdsesub1\evsprod\NDA202429\0002\m5\datasets\no25026\analysis
Reference ID: 2968791

NDA 202-429 Review – Vemurafenib 59
25026 aeext.xpt \\Cdsesub1\evsprod\NDA202429\0002\m5\datasets\no25026\analysis
Population PK Analysis
poppk.xpt \\Cdsesub1\evsprod\NDA202429\0002\m5\datasets\model-and-simulation\analysis
Software S-Plus (Tibco) was used to generate all plots and conduct the logistic regression analysis. SAS version 9.2 was used for the Cox-proportional hazards analysis. NONMEM version 7.0 (Icon) was used to evaluate the population PK model.
Models The sponsor’s population PK model was revised based on the results of the reviewer’s analysis of the population PK model (see Section 0). The FDA’s revised model is presented herein and is used to determine the population mean PK parameters for the relevant label statements. Revisions were only to made to the sponsor’s covariate model. The structural model was not changed (see Section 0). Gender was removed as a covariate on both CL/F and V/F. Body weight was included as a covariate on CL/F and V/F using the sponsor’s base structural model. Power functions centering weight around 70 kg were used to describe the effect of body weight on CL/F and V/F. The exponents of these functions were estimated for both CL/F and V/F.
RESULTS
Population PK Figure 12 shows that for the sponsor’s final model there appears to be a correlation between body weight and both CL/F and V/F of vemurafenib. Figure 12. Sponsor’s final model results of inter-individual variation versus body weight suggest that weight may be a covariate for CL/F and V/F.
Weight (kg)
Inte
r-in
divi
dual
var
iabi
lity
for C
L/F
-0.2
-0.1
0.0
0.1
0.2
40 60 80 100 120 140 160
| | | | | | | | | | |
Weight (kg)
Inte
r-in
divi
dual
var
iabi
lity
for V
/F
-0.4
-0.2
0.0
0.2
40 60 80 100 120 140 160
| | | | | | | | | | |
Table 6 and Figure 13 show the parameter estimates and results for the revised model with body weight as covariate instead of gender on both CL/F and V/F. The results indicate reduced inter-subject variability for CL/F and V/F with body weight compared to the sponsor’s model (Figure 13).
Reference ID: 2968791

NDA 202-429 Review – Vemurafenib 60
Table 6. Parameter estimates for final FDA revised model.
Parameter Estimate %RSE
Structural ModelCL/F (L/day) 31.2 1.96V/F (L) 106 6.65Ka (1/day) 4.51 9.71F1, Phase 1 & 2, Day 1-14 0.789 2.83F1, Phase 1 & 2, Cycle 1, day 15 - Cycle 4 0.899 1.82Covariate ModelWT_CL 0.319 20.9WT_V 0.740 20.4IIV (%CV)CL/F 31.9 15.2V/F 65.7 19.5Ka 101 18.7Residual ErrorAdditive 0.814 9.05Proportional (%) 22.8 2.70
Figure 13. Inter-individual variation versus body weight plots for the revised model show less correlation with body weight than the sponsor’s final model. (Note: the scales are different between Figure 12 and Figure 13)
Weight (kg)
Inte
r-ind
ivid
ual v
aria
bilit
y fo
r CL/
F
-0.15
-0.10
-0.05
0.00
0.05
0.10
40 60 80 100 120 140 160
| | | | | | | | | | |
Weight (kg)
Inte
r-in
divi
dual
var
iabi
lity
for V
/F
-0.3
-0.2
-0.1
0.0
0.1
0.2
40 60 80 100 120 140 160
| | | | | | | | | | |
The inter-individual variability for CL/F (Figure 3) and V/F (Figure 14) by gender for the FDA revised model is similar to that for the sponsors final model.
Reference ID: 2968791

NDA 202-429 Review – Vemurafenib 61
Figure 14. Body weight as a covariate on vemurafenib V/F explains differences in V/F between males and females.
FDA Revised Model
Inte
r-ind
ivid
ual v
aria
bilit
y fo
r V/F
-1
0
1
2
3
(N=190) (N=268)
Females Males
Sponsor’s Final Model
Inte
r-in
divi
dual
var
iabi
lity
for V
/F
-1
0
1
2
(N=190) (N=268)
Females Males
The sponsor did not provide physiological justification for using gender as a covariate in population PK model. Body weight as a covariate was able to account for differences in gender and account for inter-individual variability over the complete weight range.
The predicted values of CL/F and V/F across the range of weight values do not exceed 30% greater or less than those for the median body weight. Thus, dose-adjustments by body weight are not recommended.
Exposure-Response for Effectiveness
Exposure Metric: Time-Normalized Cmin Time-normalized Cmin (Cmin,tn) was determined by the observed AUC normalized by the duration of treatment. Only pre-dose concentrations were used. The concentration from the last sample until the patient’s last dose date was assumed to remain constant (LOCF).
Overall Survival Overall survival (OS) data from trial 25026 were reviewed to determine if there was a significant exposure-response relationship. Kaplan-Meier curves were plotted by low and high exposure as an initial examination of the relationship between Cmin,tn and OS. Figure 15 shows only slight separation between the Kaplan-Meier plots for the low and high exposure groups. This figure also highlights the fact that this OS data is not mature as 50% survival has not been reached for the treatment group. Thus, PFS data are useful to support effectiveness.
Reference ID: 2968791
(b) (4)

NDA 202-429 Review – Vemurafenib 62
Figure 15. Kaplan-Meier plots of overall survival data from trial 25026 show a trend for exposure-response. Low and high vemurafenib exposure were defined by patients with Cmin,tn values < or ≥ 39.0 μg/mL.
0.0
0.2
0.4
0.6
0.8
1.0
0 2 4 6 8 10
Time (months)
DacarbazineLow VemurafenibHigh Vemurafenib
A Cox-proportional hazards analysis was conducted to determine the effect of risk factors on the probability for OS. A multivariate analysis was conducted with forward inclusion (p=0.1) and backward elimination (p=0.05) for the selection of model covariates. Covariates tested included Cmin,tn, ln(Cmin,tn), baseline melanoma classification, baseline ECOG score, and baseline LDH status. Table 7 shows the results of the proportional hazards analysis. No significant exposure-response relationship was identified for overall survival. The p-value for ln(Cmin,tn) was 0.39. Elevated LDH and ECOG score were significant factors in the multivariate analysis that decreased the probability for survival. Table 7. Results of proportiona hazards analysis indicate no significant exposure-response relationship for overall survival.
Parameter Hazard Ratio 95% CI p-value Included in Final Model?
ln(Cmin,tn) 0.821 (0.525 - 1.29) 0.39 NoLDH Elevated 3.11 (1.54 - 6.28) 0.0015 YesECOG Score (0) 0.411 (0.212 - 0.798) 0.0086 Yes
Regardless of the lack of exposure-response for OS there is a clear survival benefit for the vemurafenib treatment group. It remains a possibility that a maximal effect was reached at the studied doses and that exposure-response could be observed for overall survival across a broader range of vemurafenib exposures.
Progression-Free Survival Progression-free survival data from trial 25026 were reviewed to determine if there was a significant exposure-response relationship. Both disease progression and deaths were considered events. Kaplan-Meier curves were plotted by low or high exposure as an initial examination of the relationship between Cmin,tn and PFS. Figure 16 shows that a trend for exposure-response for PFS may exist.
Pro
porti
on fo
r Sur
viva
l
Reference ID: 2968791

NDA 202-429 Review – Vemurafenib 63
Figure 16. Kaplan-Meier plots of PFS data from trial 25026 are suggestive of a trend for exposure-response. Low and high vemurafenib exposure were defined by patients with Cmin,tn values < or ≥ 39.0 μg/mL.
0.2
0.4
0.6
0.8
1.0
0 2 4 6 8
Time (months)
Pro
porti
on P
rogr
essi
on F
ree
DacarbazineLow VemurafenibHigh Vemurafenib
Consistent with the OS analysis, Figure 16 does not account for the potential effects of risk factors such as LDH, metastatic melanoma classification, or ECOG performance score. Thus, a multivariate cox-proportional hazards analysis was conducted. Table 1 shows the results of the propotional hazards analysis. A significant exposure-response relationship was identified for overall survival. Elevated LDH was a significant risk factor that decreased the probability for PFS. The presence of exposure-response for PFS led to the question is it possible to determine who the patients are in the lower exposure group and increase their exposures in order to increase the probability of PFS. To answer this question we needed to know whether the range of Cmin,tn values in each exposure group was due to differences in body weight across exposure groups, dose reductions in the lower exposure group, or unexplained inter-individual variability in vemurafenib PK. Figure 17 summarizes patient body weight and dose reductions for each exposure-quartile. The results for the low and high exposure groups are the combined results of the first two or last two exposure quartiles. The data were sufficient in number (n=238) to break into quartiles to determine if a trend existed for the lowest to highest Cmin,tn groups. Figure 17. Dose reductions, not body weight differences, explain reduced Cmin,tn values in low versus high exposure groups and quartiles. Exposure Group
Exposure Range N % of Pt w. Dose
ReductionAverage # of
Dose ReductionsTime on Trt
(mo.)Cumulative
Dose (g)Average Body
Weight (kg)[0.27 - 26.8] 60 65 0.70 3.3 144 80[26.8 - 39.0] 59 51 0.59 3.9 190 79[39.0 - 50.6] 59 44 0.32 4.5 232 81[50.6 - 94.9] 60 42 0.33 5.0 267 78
Low
High
Figure 17 indicates that dose reductions or interruptions may have led to reduced exposures in patients.
Exposure-Response for Safety Exposure-response was evaluated for the occurrence of squamous cell carcinomas (SCCs) and liver abnormalities.
Reference ID: 2968791

NDA 202-429 Review – Vemurafenib 64
Exposure Metric: Time-Normalized Cmin Prior To Event The exposure metric for safety was time-normalized Cmin prior to the adverse event (Cmin,saf). The metric Cmin,tn was not used as interuptions and dose reductions were made for individuals with adverse events. Although dose reduction was not required for squamous cell carcinoma, doses for 5 patients were reduced as a result. Only the first occurrence of the adverse event for each type of event per individual were included in the analysis.
Squamous Cell Carcinomas and Related Skin Toxicities Figure 1 indicates that binning the safety data into for quartiles shows an increase in the probability of squamous cell carcinomas for higher exposures. A logistic regression was performed to determine if the exposure-response relationship was significant. The results are shown in Figure 1 and indicate a significant exposure-response relationship for squamous cell carcinomas (p-value of <0.0001). The model coefficient for ln(Cmin,saf) was 0.956 with a relative standard error of 15%. We are not recommending reducing the starting dose or dose reductions for vemurafenib despite the significant exposure-response relationship for SCCs, because the overall survival benefit of therapy outweighs the risk of squamous cell carcinomas. Squamous cell carcinoma lesions in the skin layer can be excised. Although dose reductions were not required for SCCs during the trial and are not recommended subsequently, physicians should be aware of this AE. The exposure-response relationship is sufficient evidence to support the labeling statements.
Liver Function Abnormalities Grade 3 liver function abnormalities were considered a serious adverse event that occurred in 7% of the vemurafenib group and 1% of the dacarbazine group. Dose reductions were made for 42 of 106 liver function abnormalities and there were 3 treatment discontinuations. Exposure-response for grade 3 liver abnormalities was evaluated to determine if the current dosing regimen increased the risk of liver function abnormalities. The left panel of Figure 2 shows there may be evidence of exposure-response for grade 3 liver function abnormalities, but the numbers of events are low. The right panel of Figure 2 was constructed to determine if vemurafenib exposure increase the probability of any grade liver function abnormality.
Grade 3 Rash Events The primary reason for dose-reduction was grade 3 or higher rash. In the vemurafenib treatment group 28 patients had grade 3 rash. No individual had grade 4 rash. There were 54 dose interuptions for 250 total rash events. There were 202 patients with grade 1 or 2 rash. PK data before the onset of rash was only available in two patients, thus exposure-response for rash is not evaluable.
LISTING OF ANALYSES CODES AND OUTPUT FILES File Name Description Location in
\\cdsnas\pharmacometrics\ Reviews\PM Review Archive\2011\Vemurafenib NDA202429 JCE\
run83.mod NONMEM Control Stream for Sponsor’s Final Pop PK Model
\PK Analyses\Final Model\
run2.mod NONMEM Control Stream for FDA Revised Pop PK Model
\PK Analyses\BasePlusWT2\
Reference ID: 2968791
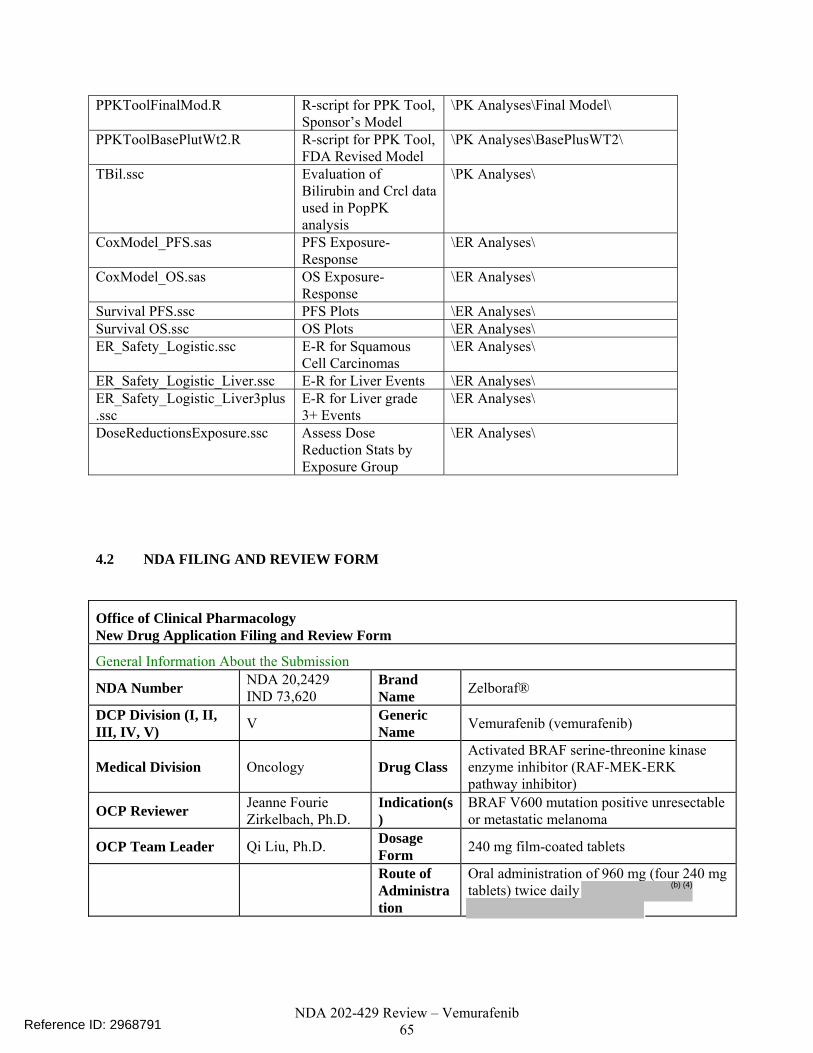
NDA 202-429 Review – Vemurafenib 65
PPKToolFinalMod.R R-script for PPK Tool, Sponsor’s Model
\PK Analyses\Final Model\
PPKToolBasePlutWt2.R R-script for PPK Tool, FDA Revised Model
\PK Analyses\BasePlusWT2\
TBil.ssc Evaluation of Bilirubin and Crcl data used in PopPK analysis
\PK Analyses\
CoxModel_PFS.sas PFS Exposure-Response
\ER Analyses\
CoxModel_OS.sas OS Exposure-Response
\ER Analyses\
Survival PFS.ssc PFS Plots \ER Analyses\ Survival OS.ssc OS Plots \ER Analyses\ ER_Safety_Logistic.ssc E-R for Squamous
Cell Carcinomas \ER Analyses\
ER_Safety_Logistic_Liver.ssc E-R for Liver Events \ER Analyses\ ER_Safety_Logistic_Liver3plus.ssc
E-R for Liver grade 3+ Events
\ER Analyses\
DoseReductionsExposure.ssc Assess Dose Reduction Stats by Exposure Group
\ER Analyses\
4.2 NDA FILING AND REVIEW FORM
Office of Clinical Pharmacology New Drug Application Filing and Review Form
General Information About the Submission
NDA Number NDA 20,2429 IND 73,620
Brand Name Zelboraf®
DCP Division (I, II, III, IV, V) V Generic
Name Vemurafenib (vemurafenib)
Medical Division Oncology Drug Class Activated BRAF serine-threonine kinase enzyme inhibitor (RAF-MEK-ERK pathway inhibitor)
OCP Reviewer Jeanne Fourie Zirkelbach, Ph.D.
Indication(s)
BRAF V600 mutation positive unresectable or metastatic melanoma
OCP Team Leader Qi Liu, Ph.D. Dosage Form 240 mg film-coated tablets
Route of Administration
Oral administration of 960 mg (four 240 mg tablets) twice daily
Reference ID: 2968791
(b) (4)
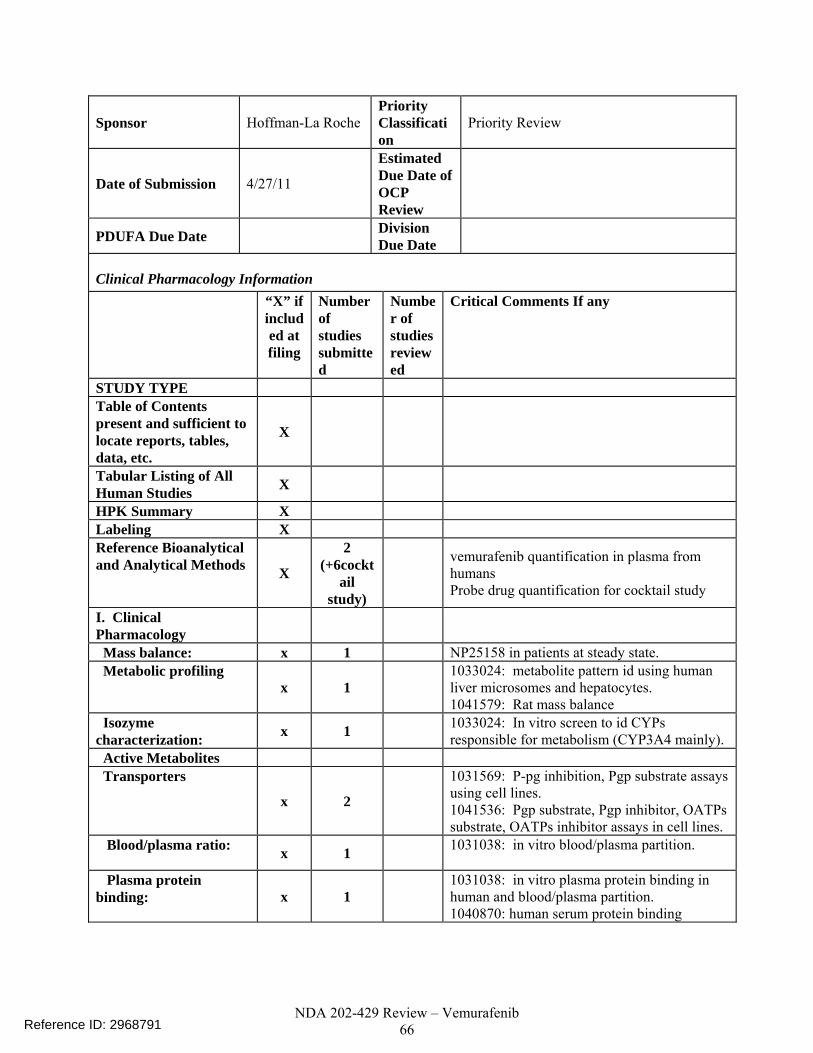
NDA 202-429 Review – Vemurafenib 66
Sponsor Hoffman-La Roche Priority Classification
Priority Review
Date of Submission 4/27/11
Estimated Due Date of OCP Review
PDUFA Due Date Division Due Date
Clinical Pharmacology Information “X” if
included at filing
Number of studies submitted
Number of studies reviewed
Critical Comments If any
STUDY TYPE Table of Contents present and sufficient to locate reports, tables, data, etc.
X
Tabular Listing of All Human Studies X
HPK Summary X Labeling X Reference Bioanalytical and Analytical Methods X
2 (+6cockt
ail study)
vemurafenib quantification in plasma from humans Probe drug quantification for cocktail study
I. Clinical Pharmacology
Mass balance: x 1 NP25158 in patients at steady state. Metabolic profiling
x 1 1033024: metabolite pattern id using human liver microsomes and hepatocytes. 1041579: Rat mass balance
Isozyme characterization: x 1 1033024: In vitro screen to id CYPs
responsible for metabolism (CYP3A4 mainly). Active Metabolites Transporters
x 2
1031569: P-pg inhibition, Pgp substrate assays using cell lines. 1041536: Pgp substrate, Pgp inhibitor, OATPs substrate, OATPs inhibitor assays in cell lines.
Blood/plasma ratio: x 1 1031038: in vitro blood/plasma partition.
Plasma protein binding: x 1
1031038: in vitro plasma protein binding in human and blood/plasma partition. 1040870: human serum protein binding
Reference ID: 2968791

NDA 202-429 Review – Vemurafenib 67
Pharmacokinetics (e.g., Phase I)
Healthy Volunteers x
single dose: x 1
PLX102-01 Relative bioavailability of original phase 1 formulation vs. subsequent final formulation.
multiple dose:
Patients- X single dose:
x 2
PLX06-02 Open label dose escalation with PK on Day 1 and Day 15 NP25163 Single and multiple dose PK of 240 mg tablets
multiple dose:
x 4
PLX06-02 Open label dose escalation with PK on Day 1 and Day 15 NP25163 Single and multiple dose PK of 240 mg tablets NP22657 PK on Day 1 and Day 15. Efficacy trial (960 mg bid) with QTc sub-study in patients at dose of 960 mg bid NO25026 in patients (960 mg bid). At each cycle, pre-dose and 2-hour post dose sampling.
Dose proportionality -
x
NP25163 Single and multiple dose PK of 240 mg tablets –accumulation ratio and dose proportionality between 240 and 960 mg BID and time to steady state.
Drug-drug interaction studies
In-vivo effects on primary drug:
In-vivo effects of primary drug on other drugs: x 1 NP22676: In vivo cocktail approach DDI
study In-vitro:
x 2
10422 (and 1040871): Induction of MRD-1 (P-gp), CYP1A2, 2B6, 3A4 using primary human hepatocytes. 102057 CYP1A2, 2A6, 2C9, 2C19, 2D6, 2E1, 3A4/5 inhibition by vemurafenib, using human liver microsomes 1033024: In Vitro Metabolic Profiles of vemurafenib in Liver Microsomes and Hepatocytes and human cDNA expressed CYPs (CYP1A2, CYP2A6, CYP2B6, CYP2C8, CYP2C9, CYP2C19,CYP2D6, CYP2E1 or CYP3A4)
Subpopulation studies -
Reference ID: 2968791

NDA 202-429 Review – Vemurafenib 68
Body size gender:
geriatrics: renal impairment:
Race/Ethnicity:
hepatic impairment: pediatrics: Orphan drug designation granted.
PD: Phase 2: Phase 3:
PK/PD: x Population Analyses - x
Data rich:
x 3
1043816: Pop PK analysis: NP25163, NP22657 and NO25026 1043816: PK/PD analysis for efficacy: NP226557, NO25026 1043817: PK/PD analysis for safety: Exposure vs. QTc interval prolongation and grade 3 AEs
Data sparse:
II. Biopharmaceutics Absolute bioavailability:
Relative bioavailability -
solution as reference: alternate formulation as
reference: x 1 PLX102-01 Relative bioavailability of original phase 1 formulation vs. subsequent final formulation.
Bioequivalence studies -
traditional design; single / multi dose:
replicate design; single / multi dose:
Food-drug interaction studies:
QTC studies x 1 NP22657 In patients In-Vitro Release BE (IVIVC): Bio-wavier request based on BCS
BCS class III. Other CPB Studies Genotype/phenotype studies:
Reference ID: 2968791

NDA 202-429 Review – Vemurafenib 69
Chronopharmacokinetics
Pediatric development plan
Literature References Total Number of Studies
Filability and QBR comments
“X” if yes Commen
ts
Comments sent to firm?
QBR questions (key issues to be considered)
Other comments or information not included above
Primary reviewer Signature and Date
Jeanne Fourie Zirkelbach, Ph.D. 05/16/2011
Secondary reviewer Signature and Date
Qi Liu, PhD
Reference ID: 2968791

---------------------------------------------------------------------------------------------------------This is a representation of an electronic record that was signedelectronically and this page is the manifestation of the electronicsignature.---------------------------------------------------------------------------------------------------------/s/----------------------------------------------------
JEANNE FOURIE07/01/2011
JUSTIN C EARP07/01/2011Christine Garnett was the secondary pharmacometric reviewer for this document and isunavailable for signature. She has reviewed this document.
QI LIU07/13/2011
BRIAN P BOOTH07/18/2011
Reference ID: 2968791

1
Office of Clinical Pharmacology New Drug Application Filing and Review Form
General Information About the Submission
NDA Number NDA 20,2429 IND 73,620 Brand Name Zelboraf®
DCP Division (I, II, III, IV, V) V Generic Name Vemurafenib (RO5185426)
Medical Division Oncology Drug Class Activated BRAF serine-threonine kinase enzyme inhibitor (RAF-MEK-ERK pathway inhibitor)
OCP Reviewer Jeanne Fourie Zirkelbach, Ph.D. Indication(s) BRAF V600 mutation positive unresectable or
metastatic melanoma OCP Team Leader Qi Liu, Ph.D. Dosage Form 240 mg film-coated tablets
Route of Administration
Oral administration of 960 mg (four 240 mg tablets) twice daily
Sponsor Hoffman-La Roche
Priority Classification Priority Review
Date of Submission 4/27/11 Estimated Due Date of OCP Review
PDUFA Due Date Division Due Date
Clinical Pharmacology Information
“X” if included at filing
Number of studies submitted
Number of studies reviewed
Critical Comments If any
STUDY TYPE
Table of Contents present and sufficient to locate reports, tables, data, etc.
X
Tabular Listing of All Human Studies X
HPK Summary X
Labeling X
Reference Bioanalytical and Analytical Methods X
2 (+6cocktail
study)
RO5185426 quantification in plasma from humans Probe drug quantification for cocktail study
I. Clinical Pharmacology Mass balance: x 1 NP25158 in patients at steady state. Metabolic profiling
x 1 1033024: metabolite pattern id using human liver microsomes and hepatocytes. 1041579: Rat mass balance
Isozyme characterization: x 1
1033024: In vitro screen to id CYPs responsible for metabolism (CYP3A4 mainly).
Active Metabolites
Transporters
x 2
1031569: P-pg inhibition, Pgp substrate assays using cell lines. 1041536: Pgp substrate, Pgp inhibitor, OATPs substrate, OATPs inhibitor assays in cell lines.
Blood/plasma ratio: x 1 1031038: in vitro blood/plasma partition.
Plasma protein binding: x 1
1031038: in vitro plasma protein binding in human and blood/plasma partition. 1040870: human serum protein binding
Pharmacokinetics (e.g., Phase I)
Reference ID: 2969729
(b) (4)

2
Healthy volunteers-
x
single dose: x 1
PLX102-01 Relative bioavailability of original phase 1 formulation vs. subsequent final formulation.
multiple dose:
Patients- X
single dose:
x 2
PLX06-02 Open label dose escalation with PK on Day 1 and Day 15 NP25163 Single and multiple dose PK of 240 mg tablets
multiple dose:
x 4
PLX06-02 Open label dose escalation with PK on Day 1 and Day 15 NP25163 Single and multiple dose PK of 240 mg tablets NP22657 PK on Day 1 and Day 15. Efficacy trial (960 mg bid) with QTc sub-study in patients at dose of 960 mg bid NO25026 in patients (960 mg bid). At each cycle, pre-dose and 2-hour post dose sampling.
Dose proportionality -
x
NP25163 Single and multiple dose PK of 240 mg tablets –accumulation ratio and dose proportionality between 240 and 960 mg BID and time to steady state.
Drug-drug interaction studies
In-vivo effects on primary drug:
In-vivo effects of primary drug on other drugs: x 1 NP22676: In vivo cocktail approach DDI study
In-vitro:
x 2
10422 (and 1040871): Induction of MRD-1 (P-gp), CYP1A2, 2B6, 3A4 using primary human hepatocytes. 102057 CYP1A2, 2A6, 2C9, 2C19, 2D6, 2E1, 3A4/5 inhibition by RO5185426, using human liver microsomes 1033024: In Vitro Metabolic Profiles of RO5185426 in Liver Microsomes and Hepatocytes and human cDNA expressed CYPs (CYP1A2, CYP2A6, CYP2B6, CYP2C8, CYP2C9, CYP2C19,CYP2D6, CYP2E1 or CYP3A4)
Subpopulation studies -
Body size gender:
geriatrics: renal impairment:
Race/Ethnicity:
hepatic impairment:
pediatrics: Orphan drug designation granted.
PD:
Phase 2:
Phase 3:
Reference ID: 2969729

3
PK/PD: x
Population Analyses - x
Data rich:
x 3
1043816: Pop PK analysis: NP25163, NP22657 and NO25026 1043816: PK/PD analysis for efficacy: NP226557, NO25026 1043817: PK/PD analysis for safety: Exposure vs. QTc interval prolongation and grade 3 AEs
Data sparse:
II. Biopharmaceutics
Absolute bioavailability:
Relative bioavailability -
solution as reference:
alternate formulation as reference: x 1
PLX102-01 Relative bioavailability of original phase 1 formulation vs. subsequent final formulation.
Bioequivalence studies -
traditional design; single / multi dose:
replicate design; single / multi dose:
Food-drug interaction studies:
QTC studies x 1 NP22657 In patients In-Vitro Release BE
(IVIVC):
Bio-wavier request based on BCS
BCS class
III. Other CPB Studies
Genotype/phenotype studies:
Chronopharmacokinetics
Pediatric development plan
Literature References
Total Number of Studies
Filability and QBR comments
“X” if yes Comments
Comments sent to firm?
QBR questions (key issues to be considered)
Other comments or information not included above
Primary reviewer Signature and Date Jeanne Fourie Zirkelbach, Ph.D. 05/16/2011
Secondary reviewer Signature and Date Qi Liu, PhD
CC: HFD-150 (CSO – T Ferrrara; MTL –Patricia Cortazar; MO – A McKee) HFD-860 (Reviewer – J Fourie Zirkelbach; TL – Q Liu; DDD-B Booth; DD - A Rahman) On initial review of the NDA/BLA application for filing:
Content Parameter Yes No N/A Comment Criteria for Refusal to File (RTF)
Reference ID: 2969729

4
1 Has the applicant submitted bioequivalence data comparing to-be-marketed product(s) and those used in the pivotal clinical trials?
X TMP is same as product in pivotal trials.
2 Has the applicant provided metabolism and drug-drug interaction information?
X
3 Has the sponsor submitted bioavailability data satisfying the CFR requirements?
X
4 Did the sponsor submit data to allow the evaluation of the validity of the analytical assay?
X
5 Has a rationale for dose selection been submitted?
X
6 Is the clinical pharmacology and biopharmaceutics section of the NDA organized, indexed and paginated in a manner to allow substantive review to begin?
X
7 Is the clinical pharmacology and biopharmaceutics section of the NDA legible so that a substantive review can begin?
X
8 Is the electronic submission searchable, does it have appropriate hyperlinks and do the hyperlinks work?
X
Criteria for Assessing Quality of an NDA (Preliminary Assessment of Quality) Data 9 Are the data sets, as requested during pre-
submission discussions, submitted in the appropriate format (e.g., CDISC)?
x
10 If applicable, are the pharmacogenomic data sets submitted in the appropriate format?
PG reviewer will answer this question.
Studies and Analyses 11 Is the appropriate pharmacokinetic
information submitted? X
12 Has the applicant made an appropriate attempt to determine reasonable dose individualization strategies for this product (i.e., appropriately designed and analyzed dose-ranging or pivotal studies)?
X
13 Are the appropriate exposure-response (for desired and undesired effects) analyses conducted and submitted as described in the Exposure-Response guidance?
X
14 Is there an adequate attempt by the applicant to use exposure-response relationships in order to assess the need for dose adjustments for intrinsic/extrinsic factors that might affect the pharmacokinetic or pharmacodynamics?
X
15 Are the pediatric exclusivity studies adequately designed to demonstrate effectiveness, if the drug is indeed effective?
X
Reference ID: 2969729

5
16 Did the applicant submit all the pediatric exclusivity data, as described in the WR?
X
17 Is there adequate information on the pharmacokinetics and exposure-response in the clinical pharmacology section of the label?
X
General 18 Are the clinical pharmacology and
biopharmaceutics studies of appropriate design and breadth of investigation to meet basic requirements for approvability of this product?
X
19 Was the translation (of study reports or other study information) from another language needed and provided in this submission?
X
IS THE CLINICAL PHARMACOLOGY SECTION OF THE APPLICATION FILEABLE? _Yes__ Jeanne Fourie Zirkelbach Ph.D. 5/5/2011 Reviewing Clinical Pharmacologist Date Qi Liu, Ph.D. 5/5/2011 Team Leader/Supervisor Date
Reference ID: 2969729

---------------------------------------------------------------------------------------------------------This is a representation of an electronic record that was signedelectronically and this page is the manifestation of the electronicsignature.---------------------------------------------------------------------------------------------------------/s/----------------------------------------------------
JEANNE FOURIE07/06/2011
QI LIU07/13/2011
Reference ID: 2969729

1
BIOPHARMACEUTICS FILING REVIEW Office of New Drugs Quality Assessment
Application No.: NDA 202429 Submission Date: March 21, 2011
Reviewer: Deepika Arora Lakhani, PhD
Division: Division of Medical Imaging and Hematology Products
Team Lead: Angelica Dorantes, PhD
Sponsor: Hoffman-La Roche Inc. Supervisor: Patrick Marroum, PhD Trade Name: Not yet established Date Assigned: Apr 14, 2011 Generic Name: Vemurafenib (RO5185426) Date of Review: May 17, 2011 Indication: For the treatment of Unresectable
Stage IIIc or Stage IV BRAF mutation- positive melanoma by the cobas% 4800 BRAF V600 Mutation Test
Formulation/ strengths Tablet/ 240 mg
Route of Administration Oral
Type of Submission: New Drug Application
SUBMISSION: An original New Drug Application (NDA 202429) for the use of vemurafenib (RO5185426) for the treatment of unresectable Stage IIIC or Stage IV BRAF mutation-positive melanoma by the cobas° 4800 BRAF V600 Mutation Test is submitted by Hoffman-La Roche under rolling basis. RO5185426 is a novel small molecule with the polymorphic Form II being the most stable polymorphic form and has poor aqueous solubility. The solubility of Form II at physiological pHs (SGF and SIF) is 0.0001 mg/mL at 37°C. The composition of the proposed market formulation of RO5185426 film-coated tablets 240 mg is:
Components Function Tablet core RO5185426-000 Drug substance Hypromellose acetate succinate Silica, colloidal anhydrous (Colloidal silicon dioxide) Croscarmellose sodium Hydroxypropylcellulose (Hydroxypropyl cellulose) Magnesium stearate Film Coating Mixture Poly(vinyl alcohol) Titanium dioxide Macrogol 3350 (Polyethylene glycol 3350) Talc Iron oxide red
BIOPHARMACEUTICS: The Biopharmaceutics review for this submission is focused on the evaluation of the in vitro dissolution methodology and results. The solubility studies show that the drug substance is a poorly soluble compound. The proposed method for the vemurafenib (RO5185426) film-coated tablets 240 mg is Ph. Eur./USP apparatus 2 (paddles) operating at 75 rpm (dissolution medium is 900 mL of 1% HTAB in 50 mmol/L phosphate buffer at pH 6.8). The dissolution samples are measured spectrophotometrically or using an isocratic HPLC method.
Reference ID: 2953903
(b) (4)

2
Dissolution data: Dissolution data from 37 clinical and pilot scale batches is provided in the application, as shown below:
Based upon the data generated, the applicant has proposed a dissolution specification of Q= at 45 mins. However, the data shows that besides Batch PT2319B04A (batch shows a mean of dissolved in 30 mins), the remaining 36 batches have greater than dissolution at 30 mins. The reason for this particular batch showing slower dissolution is not clear and has not been addressed in the application. The applicant will be asked to address this and revise the specification to truly reflect the data generated to Q= at 30 mins. Complete method development and data is provided under the Pharmaceutical Development section. RECOMMENDATION: The ONDQA/Biopharmaceutics team upon review of NDA 202-429 for filing purposes, found the application to be fileable, from Biopharmaceutics perspective. The below comments must be communicated to the applicant. Comments to the applicant:
The dissolution data provided in the application supports Q value at 30 minutes. The proposed dissolution specification of Q value at 45 minutes is permissive and does not truly reflect the mean values of the dissolution data, as provided in Justification of Specifications section. Please note that besides, Batch PT2319B04A (Q= at 30 minutes), all other batches demonstrate Q> at 30 minutes.
Please explain the slower dissolution rate and greater variability in dissolution data for the Batch PT2319B04A.
Deepika Arora Lakhani, Ph.D. Angelica Dorantes, Ph.D. Biopharmaceutics Reviewer Biopharmaceutics Team Leader or Supervisor Office of New Drugs Quality Assessment Office of New Drugs Quality Assessment cc: P. Marroum
Reference ID: 2953903
(b) (4)
(b) (4)
(b) (4)
(b) (4)
(b) (4)
(b) (4)
(b) (4)
(b) (4)
(b) (4)

---------------------------------------------------------------------------------------------------------This is a representation of an electronic record that was signedelectronically and this page is the manifestation of the electronicsignature.---------------------------------------------------------------------------------------------------------/s/----------------------------------------------------
DEEPIKA LAKHANI05/31/2011NDA is fileable, from Biopharmaceutics perspective.
PATRICK J MARROUM06/03/2011
Reference ID: 2953903