2035 long range transportation plan - broward...
TRANSCRIPT
Technical Report # 4 Model Application Methodology
Broward MPO
2035 Long Range Transportation
Plan Update
Technical Report # 4 Model Application
Methodology
Created by:
December 2009

Technical Report # 4 Model Application Methodology
TABLE OF CONTENTS 1.0 Introduction to the Travel Demand Model ............................................................................... 1 2.0 Review of the Base Year Model .............................................................................................. 2 2.1 Highway Validation ............................................................................................................ 2 2.2 Transit Validation ............................................................................................................... 7 3.0 Travel Demand Model Network Coding Methodology ............................................................ 8 3.1 Managed Lanes (I-95) ........................................................................................................ 8 3.2 Reversible Lanes (I-595) .................................................................................................... 8 3.3 Open Road Tolling (ORT) .................................................................................................. 8 3.4 Premium Transit Service .................................................................................................... 8 3.5 Coordinating PT and TRNBUILD Mode Numbers Using PT2TRNB Program ................... 9 4.0 Summary ............................................................................................................................... 10 5.0 Regional Modeling Coordination ........................................................................................... 11
LIST OF EXHIBITS
Exhibit 1: Characteristics of Roadway Facilities in 2005 ............................................................... 2 Exhibit 2: Estimated Percent RMSE Plot Versus Desirable Percent RMSE for Various Volume Groups .......................................................................................................................................... 3 Exhibit 3: Estimated Volume and Ground Count (AADT) ............................................................. 4 Exhibit 4: Illustration of the Over and Under-Estimation of Volumes in the Base Year Model ...... 5 Exhibit 5: Comparison of Estimated Volumes and Count at Various Screenlines and Cutlines ... 6 Exhibit 6: Transit Ridership Results for the Base Year ................................................................. 7 Exhibit 7: Coordination between PT modes and TRNBUILD modes Using PT2TRNB ................. 9 Exhibit 8: Volume Adjustment Process ....................................................................................... 10

Technical Report # 4 Model Application Methodology
1
1.0 Introduction to the Travel Demand Model This report summarizes the travel demand model review and development process and explains the model application methodology used for the technical analyses. The Time of Day version of the Southeast Florida Regional Model (SERPM) version 6.5 is used as the technical tool for the highway and the transit systems planning. In addition to Broward County, this model also includes Palm Beach and Miami-Dade Counties. The model is calibrated to the year 2005 travel behaviors and has the capability of estimating traffic flows by period of the day (AM peak, off-peak and PM peak) on roadways. The regional LRTP model includes the following changes to the released version of SERPM v6.5:
• Includes logic to model reversible managed lanes;
• Includes a modified version of PT2TRNB program to take care of new transit modes (e.g. BRT, LRT, etc.) that may be added to the system for the long range plan;
• Includes logic to handle open toll road modeling; and
• Transit speeds are defaulted to 5 mph on the streets where the model estimates extremely slow congested auto speed (<5 mph).
For the previous long range plans, county specific FSUTMS travel demand models were used. This is the first time a regional model that also encompasses Miami-Dade and Palm Beach Counties is being used. Since, the three participating MPOs are using the same model and there are significant inter-county trips and interactions, it is beneficial to coordinate with the neighboring MPOs in order to update the transportation networks within Broward County. In addition to the three MPO’s LRTPs, a regional plan is also being independently developed. The Regional Transportation Technical Advisory Committee (RTTAC) Modeling Subcommittee is coordinating with the three MPOs, FDOT District IV and District VI and their consultants to reach a common ground on the network and the modeling issues.

Technical Report # 4 Model Application Methodology
2
2.0 Review of the Base Year Model Since a regional model is being used for the long range plan efforts, it is necessary to evaluate the strengths and the weaknesses of this model especially within the Broward County. This section discusses the results for the base year obtained from the model. Unless otherwise specifically mentioned, the data shown in this section are only for Broward County.
2.1 Highway Validation There are 921 internal traffic analysis zones (TAZs) in Broward County. The highway network has about 7,700 links with 2005 AADT (AADT is bi-directional and count is directional) on about 2,225 links. The volumes estimated by the model are validated using these AADT. The overall RMSE for the county is about 29% and the average volume-to-count ratio is about 1.11. The vehicle-miles traveled (VMT) ratio calculated using the estimated volume and the counts on links with AADT is 1.02 and the vehicle-hours traveled (VHT) ratio using the congested speeds is about 1.03. The model performs fairly well and below the generally accepted margin of errors.
At a more disaggregate level; the overall county statistics were broken down by different roadway facility types. Exhibit 1 shows some parameter values for different facility types. The model over-estimates the volume on low speed collectors by about 20%. It performs very well on the freeways, HOV, and TOLL roadways. The average congested speed is approximately 11% lower than the free flow speeds.
Exhibit 1: Characteristics of Roadway Facilities in 2005
Facility Type Number of Links With
Counts
Average Volume-to-count Ratio
Free Flow Speed
Congested Speed
VMT (Estimated/ Observed)
Freeways 78 0.99 62.5 58.0 0.99
Uninterrupted roadways 74 0.92 40.8 40.6 0.91
High speed arterials 1451 1.11 37.8 33.4 1.04
Low speed collectors 429 1.20 34.4 30.4 1.02
Ramps 8 0.83 43.8 21.9 0.86
HOV 41 1.01 61.0 53.7 0.98
Toll 144 1.00 54.8 50.0 1.01
Total 2,225 1.11 39.7 35.4 1.02
Technical Report # 4 Model Application Methodology
3
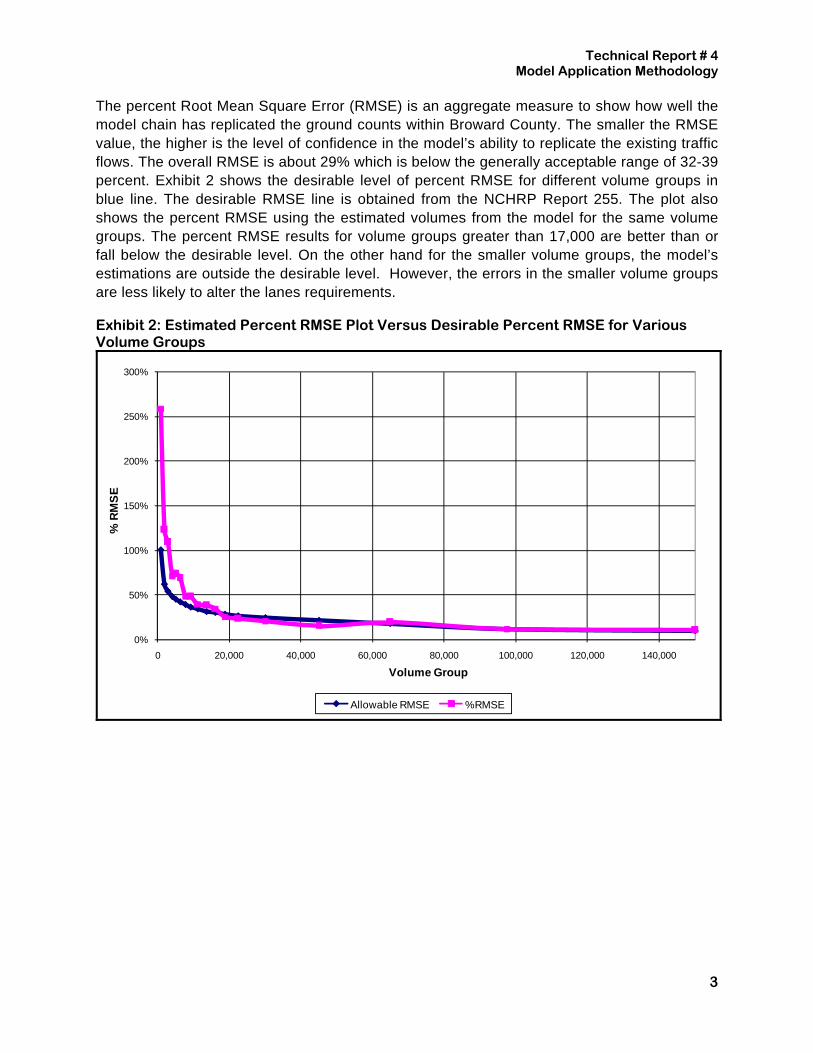
The percent Root Mean Square Error (RMSE) is an aggregate measure to show how well the model chain has replicated the ground counts within Broward County. The smaller the RMSE value, the higher is the level of confidence in the model’s ability to replicate the existing traffic flows. The overall RMSE is about 29% which is below the generally acceptable range of 32-39 percent. Exhibit 2 shows the desirable level of percent RMSE for different volume groups in blue line. The desirable RMSE line is obtained from the NCHRP Report 255. The plot also shows the percent RMSE using the estimated volumes from the model for the same volume groups. The percent RMSE results for volume groups greater than 17,000 are better than or fall below the desirable level. On the other hand for the smaller volume groups, the model’s estimations are outside the desirable level. However, the errors in the smaller volume groups are less likely to alter the lanes requirements.
Exhibit 2: Estimated Percent RMSE Plot Versus Desirable Percent RMSE for Various Volume Groups
0%
50%
100%
150%
200%
250%
300%
0 20,000 40,000 60,000 80,000 100,000 120,000 140,000
% R
MS
E
Volume Group
Allowable RMSE %RMSE

Technical Report # 4 Model Application Methodology
4
Comparisons were then made at the traffic counting stations. The bi-directional estimated volumes at a station were compared against the AADT at these stations. Exhibit 3 is a plot showing the estimated volumes against the AADT at each station. The linear fit with zero intercept almost follows a 45 degree line. Most of the dots are close to this line which means the estimated volumes are close to the AADT values. However, the volume estimation at some stations with high AADT (marked within green box) is not creditable.
Exhibit 3: Estimated Volume and Ground Count (AADT)
y = 0.983xR² = 0.938
0
50,000
100,000
150,000
200,000
250,000
300,000
350,000
0 50,000 100,000 150,000 200,000 250,000 300,000 350,000
Estimated
Volum
e
AADT

Technical Report # 4 Model Application Methodology
5
A plot of volume-to-count ratio for individual links with count data, however, shows a trend. In general, the regional model over-estimates volumes on north-south roadways and performs reasonably well on the east-west roadways. Exhibit 4 illustrates this trend.
Exhibit 4: Illustration of the Over and Under-Estimation of Volumes in the Base Year Model
Under-estimation
Over-estimation

Technical Report # 4 Model Application Methodology
6
Screenlines (SL) and cutlines (CL) are groups of roadways carrying traffic in the same direction. These lines are used to evaluate the quality of volume estimation by the model using volume to count ratios. A screenline crosses the entire model area while a cutline is drawn to intersect several parallel roadways forming a corridor. The counts of the roadways comprising these lines are summed and are compared to the estimated volume on these links with counts. The information presented in Exhibit 5 is gathered from the SERPM 6.5 validation report. It shows the results at various screenlines and cutlines falling within the county. The model over-estimates trips crossing the Palm Beach and Miami-Dade counties by 14% and 9% respectively. It is desirable that the model estimates the volumes within +/-10% of the counts. However, at some screenlines and cutlines the model estimates are off by more than 10%.
Exhibit 5: Comparison of Estimated Volumes and Count at Various Screenlines and Cutlines
Screenline/
Cutline Number of Links
Number of Links
with Counts
Total Count
Total Volume
Volume/ Count
EW: Palm Beach/ Broward County Line
SL
17 15 489,192 559,434 1.14
EW: Broward/ Miami-Dade County Line
24 24 874,930 949,664 1.09
EW: Along Pompano Canal (south of Atlantic Blvd)
25 20 686,698 740,767 1.08
EW: Along Oakland Park Blvd 29 25 950,792 937,840 0.99
EW: Along River Canal (south of Griffin Rd)
25 23 807,498 935,528 1.16
NS: Between I-75 and Turnpike 23 19 603,100 561,463 0.93
NS: Along Turnpike (west) 32 26 1,047,300 1,126,238 1.08
NS: I-95 from Miami-Dade to I-595
CL
11 9 300,508 342,030 1.14
NS: I-95 from Palm Beach to I-595 24 24 1,009,300 965,305 0.96
NS: Along University Dr from Palm Beach to Oakland Park Blvd
20
19
487,000
406,043
0.83
EW: Collier County Line 2 2 23,672 23,530 0.98

Technical Report # 4 Model Application Methodology
7
2.2 Transit Validation Exhibit 6 compares the observed transit boardings and the estimated boarding for Broward County. The information was taken from the SERPM 6.5 calibration and validation report. These are daily boardings and do not include the community buses. The model over-estimates the transit boardings by 11% in Broward County. The ridership on the east-west routes are over-estimated by 9% and on the north-south routes, the model over-estimates the ridership by 14%. It is also noteworthy to observe that the model over-estimates ridership by 34% on the east-west routes north of Commercial Blvd and 32% on the north-south routes west of SR 7. These are the areas with low transit ridership compared to other parts of the county. Exhibit 6 also shows the observed and estimated boarding on the top 5 performing routes (in terms of ridership). These are over generally over-estimated except for Route 36 running along Sunrise Blvd. The model also under-estimates the ridership on Route 441 Breeze by 29%. However, the ridership on Route 441 should be considered in conjunction with Route 18 which runs along the same street due to the fact that the transit path-building process combines them as one if the boarding and alighting stops are the same.
Exhibit 6: Transit Ridership Results for the Base Year
Group Count Observed Ridership
(A)
Model Estimates
(B)
Difference [(B)-(A)]
Ratio [(B)/(A)]
EW Routes
South of I-595 (Route 3, 5, 7, 28)
4 10,048 10,525 204 1.02
Between I-595 & Commercial Boulevard (Route 22, 20, 36, 40, 55, 72)
6 28,877 29,863 986 1.03
North of Commercial Boulevard (Route 34, 42, 57, 62, 83, 92)
6 8,619 11,535 2,916 1.34
EW Routes Total: 16 47,544 51,650 4,106 1.09
NS Routes
East of I-95 (Route 1, 4, 6, 10, 11, 20, 50, 60)
8 32,013 39,579 7,566 1.24
Between I-95 and SR 7 (Routes 9, 14, 15, 17, 18, 31, 93, 97, 441)
9
28,154
27,787
-367
0.99
West of SR 7 (Route 2, 23, 88)
3
8,672
11,453
2,781
1.32
NS Routes Total: 20 68,839 78,819 9,980 1.14
Other Routes (12, 56, 81, 95) Total: 4 6,812 6,477 -335 .095
Total BCT: 40 123,195 136,946 13,751 1.11
Top 5 Routes
Route 18 (SR 7) 14,272 15,108 836 1.06
Route 1 (US 1) 8,069 10,769 2,700 1.33Route 36 (Sunrise Blvd) 7,642 7,050 -592 0.92
Route 72 (Oakland Park Blvd) 7,552 7,853 301 1.04Route 2 (University Drive) 7,006 8,813 1,807 1.26
Limited Stop
Route 441 Breeze (along SR 7) 1,712 1,216 -496 0.71

Technical Report # 4 Model Application Methodology
8
3.0 Travel Demand Model Network Coding Methodology The network coding procedures described in the Model Application Guidelines (Technical Report 3: Model Application Guidelines, Southeast Regional Planning Model 6.5, August 2008, Florida Department of Transportation – District IV) and Calibration and Validation Report (Technical Report 1&2: Model Data, Calibration and Validation, Southeast Regional Planning Model 6.5, October 2008, Florida Department of Transportation – District IV) of the SERPM model have been followed for coding the highway and transit projects for the long range plan. Special attention was paid in coding new types of facilities that did not exist in the region when SERPM was developed. These include open road tolling facilities, HOT lane facilities, reversible lane facilities and new types of premium transit service.
3.1 Managed Lanes (I-95) The managed lanes on I-95 are coded in the network using the methodology described in the SERPM 6.5 Model Data Development documentation. These lanes are coded with FACILITY TYPE 82 and the indicator HOT field on the links is set to 1.
3.2 Reversible Lanes (I-595) A new link field attribute named REVERSIBLE is added to the networks to identify the facilities with reversible lanes in the region. On I-595, the reversible lanes are coded as 3 lanes operating only during the peak periods. The only access points on I-595 reversible lanes are at the Florida’s Turnpike and Sawgrass interchanges. They are coded in eastbound direction for AM peak period, and in westbound direction for PM peak period. In the highway network, they are coded as one-way links in both directions. The REVERSIBLE attribute is populated with 1’s on the links operating during the AM period, and with 2’s on links operating in the PM direction. The model scripts were also modified to include reversible lane modeling. On links in the highway network with REVERSIBLE either 1 or 2, no traffic is assigned during the off-peak periods. Traffic is not assigned during AM peak period on links with REVERSIBLE coded as 2; while it is not assigned during PM peak period on links with REVERSIBLE coded as 1. Since these are managed lanes, HOT attribute is populated with a code of 1. Congestion based toll is applied similar to those applied on I-95 HOT lanes.
3.3 Open Road Tolling (ORT) In the highway network, the open road tolling (ORT) stations are coded with TOLLTYPE=3 on the links. SVCMINUTES field values are set to 0 and SVCSECONDS field values are set to 1 second. The toll amount is coded in dollars in CARTOLL field on these links. The model scripts were modified to remove any acceleration and deceleration delays at these toll stations.
3.4 Premium Transit Service The premium transit service in Broward County is either rapid buses or high capacity transit. The high capacity transit is assumed to operate on exclusive lanes with signal preemption and off-board fare collection. In the model, both rapid buses and high capacity routes are coded as “new mode” (mode number 10 and operator number 7). The rapid buses are coded on regular streets with a TIMEFAC of 0.8. This means that they are subjected to auto congestion but they run 20% faster than the local buses. The high capacity routes are coded on exclusive lanes with an assumed speed of 23.41 mph.

Technical Report # 4 Model Application Methodology
9
For coding purposes, the rapid buses are assumed to operate in mixed traffic with limited stops and improved amenities, compared to limited stop service that Broward County Transit currently operates.
3.5 Coordinating PT and TRNBUILD Mode Numbers Using PT2TRNB Program The transit network in SERPM is coded in PT-format in Cube-Voyager. The PT-format networks are converted to TRNBUILD-format using a FORTRAN program, PT2TRNB. This is needed because the pathbuilding and assignment in SERPM is done using TRNBUILD module. Based on the mode and operator number coded in the PT-format transit network, PT2TRNB reassigns new mode numbers for TRNBUILD module. During the initial stages of the LRTP process, it was discovered that PT2TRNB incorrectly assigned limited stop and “new” modes in two situations. A limited stop bus mode and a BCT local operator resulted in a mode number for Palm Beach Limited Stop Bus being assigned for pathbuilding and assignment. In another case, a new mode and a BCT local operator resulted in a Palm Beach New Mode. These two situations were corrected. Two new operator codes (12 and 13) reflecting Miami-Dade New Mode and Palm Beach New Mode were added. The functionality to read in RUNTIME and TIMEFAC parameters was also added in the program. The new version of the executable was provided to FDOT. Exhibit 7 is the lookup table that shows the PT2TRNB logic as it processes the PT modes and operators.
Exhibit 7: Coordination between PT modes and TRNBUILD modes Using PT2TRNB
PT TRNBUILD
Mode Operator Mode No. Name County No. Description No. Description
4 Bus Palm Beach and Broward
1 Palm Beach Local 4 Palm Beach Bus 11 Palm Beach Express 16 Palm Beach Express Bus
3 BCT Local 14 BCT Bus 5 BCT Express 6 BCT Express Bus
5 Bus Miami-Dade 4 Miami-Dade Local 5 Miami-Dade Bus 6 Miami-Dade Express 15 Miami-Dade Express Bus
6 Express Bus All 11 Palm Beach Express 16 Palm Beach Express Bus 5 BCT Express 6 BCT Express Bus 6 Miami-Dade Express 15 Miami-Dade Express Bus
7 Metrorail Miami-Dade 8 Metrorail 7 Metrorail 8 Tri-Rail All 10 Tri-Rail 8 Tri-Rail 9 Metromover Miami-Dade 9 Metromover 9 Metromover
10 New Mode (BRT or LRT)
All 7 BCT New Mode 10 BCT New Mode 12 Miami-Dade New Mode 17 Miami-Dade New Mode 13 Palm Beach New Mode 20 Palm Beach New Mode
11 Project Mode All Any 11 Project Mode 12 Tri-Rail Shuttle All 2 Tri-Rail Shuttles 12 Tri-Rail Shuttle 13 Limited-Stop
Bus All 11 Palm Beach Express 19 Palm Beach Limited Stop
Bus 5 BCT Express 18 BCT Limited Stop Bus 6 Miami-Dade Express 13 Miami-Dade Limited Stop
Bus

Technical Report # 4 Model Application Methodology
10
4.0 Summary Overall, the model’s ability to estimate the highway volumes is reasonable within the county. However, being a regional model, there are areas (at a disaggregate level) where the model falls short. Therefore the forecast traffic volumes on these links will be adjusted based how well the base year model estimates the volumes compared to the observed data.
The results on the transit ridership presented in this report are at the county level and the overall results estimated by the model at this level are reasonable; hence no adjustments were made to the estimated transit ridership.
The long range plan tries to identify the projects that are needed beyond previously committed projects to increase the mobility and relieve congestion. These are plans for year 2035. Hence, in order to determine the deficiency in the network, an alternative with E+C highway and transit networks and 2035 socio-economic data was run (“No Build” scenario). The results of this alternative run are used to identify the congestion level in the county if no new projects are added in the transportation system. The 2035 Transportation Needs Assessment Technical Report provides a detailed explanation on deficiency analysis and future travel demand.
As shown earlier in Exhibit 4, the model does not perform well in estimating volumes on some sections of the roadways. The forecast volumes on these segments may not be reliable. Hence, the estimated volumes for the future year will be adjusted based on the procedure explained in the NCHRP Report 255. This procedure is described in Exhibit 8.
Exhibit 8: Volume Adjustment Process Forecasted volume adjustment process (NCHRP #255 procedure)
2
2035+2035=2035
diffvolratiovolfinalvol
Where: vol2035final=final adjusted volume for the future year
20052005
*2035=2035volaadt
estvolratiovol
)20052005(+2035=2035 volaadtestvoldiffvol aadt2005=base year ground counts vol2005=base year estimated volume vol2035est=estimated volume for the future year
Exception: No adjustment if the ‘desirable’ range of deviation of the base year volume is: +/‐ 15% where aadt2005 <= 15,000 +/‐ 10% where aadt2005 is between 15,000 and 60,000 +/‐ 5% where aadt2005 > 60,000

Technical Report # 4 Model Application Methodology
11
5.0 Regional Modeling Coordination The Regional Transportation Technical Advisory Committee (RTTAC) Modeling Subcommittee comprises representatives from the Broward Metropolitan Planning Organization, Miami-Dade Metropolitan Planning Organization, Palm Beach Metropolitan Planning Organization FDOT District IV, and FDOT District VI. The primary purpose of RTTAC was to coordinate the travel demand modeling process between the Broward, Miami-Dade, and Palm Beach MPOs, FDOT Districts IV and VI. The RTTAC provided direction and resolved transportation network and modeling issues raised during the development of individual MPO’s 2035 LRTPs and the 2035 Regional Transportation Plan.
The RTTAC Modeling Subcommittee held its first meeting on August 4, 2008. During this meeting, the subcommittee decided to use the Time of Day version of the Southeast Florida Regional Planning Model (SERPM 6.5). The subcommittee subsequently met six more times to help coordinate the development of transportation networks for the existing plus committed (E+C) network, needs plan network, and cost feasible plan network. The network development process involved the MPOs providing project lists for completed, committed, and the needs plan and FDOT District IV coded the networks and set up the model runs. The networks and the model runs were then reviewed by the respective MPOs. The MPOs provided comments to FDOT District IV for updating the networks and the model. Once an agreement was reached within the subcommittee, a final network and a model run was distributed to each MPO. The MPOs thereafter made minor changes to the networks and made their own model runs for understanding the needs plan and cost feasible plan performance. The RTTAC made sure that the important elements from the three MPOs were incorporated into the transportation network, to fully understand the regional implications of future transportation improvements. The meeting minutes of the RTTAC modeling subcommittee are attached in the Appendix.

X:\PROJFILE\9338 South Florida Regional LRTP\Task16Meetings\RTTACMS\9338_RTTACMS_080408_minutes_2.doc
MEMORANDUMRTTAC Modeling SubcommitteeAugust 4, 2008 Meeting Minutes
Date: August 14, 2008 Project #: 9338.0
To: Wilson Fernandez, RTTAC Modeling Subcommittee Chair
From: Jessica Josselyn, Kittelson & Associates, Inc.John Zegeer, PE, Kittelson& Associates, Inc.Rob Schiffer, Cambridge Systematics
The following is a summary of the RTTAC Modeling Subcommittee meeting held on August 4,2008. Meeting handouts may be found in Attachment A.
MEETING TIME AND LOCATIONFlorida Department of Transportation, District IVFirst Floor Administration Conference RoomFort Lauderdale, Florida
MEETING ATTENDEES1. Ashutosh Kumar, AECOM Consult2. David Schmitt, AECOM Consult3. Sung Ryong Han, BCC Engineering4. Ed Sirianni, Broward County MPO5. Lina Kulikowski, Broward County MPO6. Ossama Al Aschkar, Broward County MPO7. Rob Schiffer, Cambridge Systematics, Inc.8. Dan Glickman, Citizen9. Yongqiang Wu, FDOT Central Office10. Min Tang Li, FDOT D411. Shi Chang Li, FDOT D412. Phil Steinmiller, FDOT D613. Franco Saraceno, Gannett Fleming14. Myung Sung, Gannett Fleming15. Kapil Arya, Gannett Fleming16. Jessica Josselyn, Kittelson & Associates, Inc.17. John Zegeer, Kittelson & Associates, Inc.18. Scot Leftwich, Leftwich19. Arturo Perez, Leftwich20. Carlos Roa, Miami Dade MPO21. Larry Foutz, Miami Dade MPO22. Wilson Fernandez, Miami Dade MPO
RTTAC Modeling Subcommittee August 4th Meeting Minutes Project #: 9338.0August 14, 2008 Page 2
Kittelson & Associates, Inc. Ft. Lauderdale, Florida
23. Nellie Fernandez, Palm Beach MPO24. Paul Larsen, Palm Beach MPO25. Vinod Somdanasamy, Palm Beach MPO26. Srin Varanasi, The CorradinoGroup27. Sandeep Obulaveddy, The CorradinoGroup28. Sunil Saha, The Corradino Group
MEETING NOTESBelow is a summary of the key points discussed at the meeting. The comments have beenorganized by agenda topic.
I. Call to Order and IntroductionsWilson Fernandez introduced the first RTTAC Óodeling Subcommittee meeting.
II. Socio Economic DataRob Schiffer presented a summary and comparison of socio economic data receivedfrom the three counties. Palm Beach County is concerned with the school file databecause the school board does not forecast school locations beyond the year 2015.Thus, the MPO had previously assumed the location of future schools (at 1500students per school) based on population growth and the availability of vacant land.There could be a 60,000 school student shortfall in the 2035 model if a methodology isnot selected for locating new schools. Unless the MPO is aware of plans for theconstruction of a private school, they do not assume the construction of additionalschools. Paul Larsen plans to carry over the school location data that was used for the2030 plan for the 2035 plan. The assumption used in Broward County considered theschool children population by zone in identifying new school locations. Paul Larsenwill make some revisions to the Palm Beach County socioeconomic data (includingschools) and submit these revisions to Rob Schiffer this week.
It is anticipated that a large area around Belle Glade, South Bay, and Pahokee will bepurchased by the state from US Sugar. This could result in the loss of 10,000 jobs in thewestern part of Palm Beach County, resulting in the need for a double set of socioeconomic data for projecting growth. Shi Chiang Li suggested that this second set ofdata be used for comparison purposes when alternative transportation improvementsare being evaluated. Wilson Fernandez suggested that one baseline data set beestablished for regional coordination and that alternative data sets be used by theindividual counties for their own analysis of alternative improvements. Ossama AlAschkar said that data that he has submitted for Broward County reflects the existingapproved land use plan. Miami Dade County was told by FHWA to use what theMPO knows today.
Miami Dade County auto ownership rate data will be reviewed next week.Revisions will be made and submitted within two weeks.
RTTAC Modeling Subcommittee August 4th Meeting Minutes Project #: 9338.0August 14, 2008 Page 3
Kittelson & Associates, Inc. Ft. Lauderdale, Florida
III. 2035 External TripsMin Tang and Srin (Corradino Group) prepared 2035 external trip forecasts (E I, I E,and E E trips) based on extrapolating count trends at external stations. These tripswere developed using existing growth factors. Two corrections were made: First, theexisting model has an error at the SR A1A station in Palm Beach County. The externaltrip forecasts at this location were revised. Second, at SR 710 (Beeline Highway), aPD&E study projected a 2030 volume that is different from the historic counts. ThePD&E projection was used. Rob Schiffer described an independent assessment byCambridge Systematics staff and found generally similar results overall.
Ossama Al Aschkar is concerned about the external loading on I 75 west into CollierCounty. The growth rate appears to be high. In addition, the U.S. 1 increase from23,000 to over 40,000 south of Miami Dade County into Monroe County appears to behigh and the percentage of E E trips appears to be high as well. The Corradino Groupwill recheck and adjust both of these projections. Rob Schiffer looked at these twostations and found the suggested 2035 forecast was somewhat higher than the latesttraffic count extrapolations from the FDOT CD as calculated by CambridgeSystematics staff. Shi Chiang Li asked if there was a solution (an alternativemethodology) for resolving these two discrepancies. Phil Steinmiller suggested amethodology based on revised count trend analyses (e.g., different number of years,different current year, different count station, etc.) to resolve the US 1 issue intoMonroe County. Ossama Al Aschkar suggested that one paragraph be prepared foreach external count station to document the methodology that was used to projectfuture external station traffic. Srin, Min Tang, and Rob Schiffer will take anotherlook at the growth trends for each external station and report back to this group byAugust 11th.
IV. E+C Project Review and Network Coding SpecificationsJessica thanked the three counties for submitting E+C project data. For Palm BeachCounty, there are no new transit projects proposed other than the east west corridorproject planned for the year 2013. (The years 2008 2013 represent committed projectsfor the E+C network.) Transit routes are being cut due to budget limitations.
In Broward County, the US 1 bypass inside Port Everglades is not in the TIP. It is notfunded. Thus, this project will not be included in the E+C network. More detail isneeded for the I 595 committed projects. FDOT District 4 will provide thisadditional project description information. These projects will include reversiblelanes and ramp braiding. Ossama Al Aschkar will provide Broward County busroute information to KAI by the end of the week.
In Miami Dade County, there are some roadway grade separations and transit BRTprojects. For the grade separations, Carlos Roa will provide a sheet that describes thegeometric improvements as a back up to the E+C network. The SR 826/SR 836interchange configuration needs to be described for the E+C network.
RTTAC Modeling Subcommittee August 4th Meeting Minutes Project #: 9338.0August 14, 2008 Page 4
Kittelson & Associates, Inc. Ft. Lauderdale, Florida
For BRT routes that operate in mixed flow conditions with traffic signal priority, theone mile station spacing on the State Road 7 Breeze service has provided a reductionin travel time by about 25% as compared with local bus service. BRT service could becoded as local bus with improved headways or coded as a BRT mode with limitedstop service (with improved travel times). Transit service levels on the E+C networkmust be based on input from the transit agencies as to the cuts in service that areanticipated.
In late August, FDOT District 4 will begin coding the E+C network. All E+C projectsneed to be specified by the counties and submitted to District 4 by August 18th.Larry Foutz cannot guess what other Miami Dade transit services will be eliminatedbeyond the service cuts that already have been implemented. By 2013, some of theexisting transit service cuts may be restored. Paul Larsen suggested that if a transitagency has reduced service by resolution as of today, then that service should not bereflected in the E+C network. Phil Steinmiller agreed that existing agency cuts shouldbe reflected in the E+C network. He anticipates that the decrease in transit ridershipmay not be as great as the reduction in service because the least efficient routes arebeing reduced or eliminated. The group unanimously agreed that the transit service asit is currently will be used for the E+C network and should any changes occur the E+Cnetwork will be amended in 2009 when the updated TIP is adopted.
The 2005 (baseline conditions) model is completed. The Corradino Group willprovide E+C transit project coding (in the form of a set of tables) information to thethree counties to confirm its accuracy.
Shi Chiang Li raised an issue regarding how to code a posted speed based on thenumber of lanes and the facility type for a roadway. The signal locations are alsoimportant in determining the proper speed to be coded. When a link volume isunderreported in model output, this needs to be documented. When links haveunderreported volumes, the volumes might need to be adjusted subjectively. All ofthe posted speeds for the E+C network need to be reviewed by the three counties. Itwas agreed that by August 18th, The Corradino Group/D4/KAI will receive postedspeed assumptions from each of the three counties for the E+C network .
V. TOD model for Managed LanesSunil presented a description of the HOT lanes concept. As demand increases, the tollrate increases. SERPM65 is a time of day (TOD) model that implements the HOTlanes. Vehicle occupancy (two persons per auto or 3+ persons per auto) is treated as aseparate mode. The model uses separate facilities for the HOT lanes distinguishedfrom General Purpose lanes in the same corridor. It was suggested that the CorradinoGroup consider data from the State Route 91 Managed Lanes project in OrangeCounty, California to validate the relationship between v/c ratios and speeds.Corradino did not review the Wilbur Smith I 95 revenue studies. The Wilbur Smithtoll rates should be used for the SERPM model. The I 95 HOT lanes are not funded
RTTAC Modeling Subcommittee August 4th Meeting Minutes Project #: 9338.0August 14, 2008 Page 5
Kittelson & Associates, Inc. Ft. Lauderdale, Florida
north of the Golden Glades interchange. Thus the HOT lanes will not be considered asan E+C project north of the Golden Glades interchange.
Miami Dade County sees a need for the LRTP process to use the TOD model ratherthan a 24 hoiur model so that any managed lanes project can be properly analyzed.Both the 24 hour model and the time of day model have been validated in SERPM.Ossama Al Aschkar is concerned that the TOD model is based on percentages of 24hour trip tables and does not accurately represent peak period volumes. Thus, theTOD model does not provide a higher level of accuracy than the 24 hour model. A 24hour model run takes 12 hours. A TOD model run takes 16 hours. This TOD run timecan be reduced if the number of feedback loops is reduced. Miami Dade CountyMPO staffs believe that a TOD model is necessary to evaluate HOT lane use since acomparison of the speed in the HOT lanes vs. the General Purpose lanes for differenttimes of the day is needed. Phil Steinmiller says that we have committed to a regionalmodel. It is his understanding that this group has already made a decision to go witha TOD model. Palm Beach County is not certain that the TOD model has been fullyvalidated but will agree to go with a TOD model if that is the desire of this group.Broward County agreed to go with the group decision, albeit with previously statedconcern. Therefore, all subcommittee voting members unanimously agreed that theTOD model would be used.
VI. Use of Auto ownership ModelDue to time constraints, the auto ownership discussion was postponed until the nextface to face RTTAC Modeling Subcommittee Meeting.
VII. Capacity and V/C Reporting IssueThe SERPM 6.5 model uses the FDOT Generalized Tables (in the Quality/Level ofService Handbook) to determine volume to capacity ratios. The interrupted anduninterrupted facility types are considered. The capacities in the existing model arebased on Level of Service E (not LOS D) threshold service volumes. In the model, thecapacities have been reduced to reflect the peak hour factors. Eventually, this groupwill need to take action to decide whether or not the Level of Service D capacity(service volume) values will be used in determining the adequacy of roadways in thefuture conditions analysis. The SERPM65 Model Validation documentation andUsers Guide will be provided to the group by The Corradino Group by the end ofAugust. Rob Schiffer will respond with his thoughts on LOS reporting forconsideration. This issue will be discussed in detail at the next meeting.
VIII. Key LRTP modelingMilestone Dates and CoordinationTravel Demand Model Milestone #1 (submittal of SE data and E+C project lists) hasbeen completed. Milestone #2 (Regional SE data and coding the E+C network) will becompleted by each of the three counties and turned over to FDOT District 4 in onemonth. (This is consistent with the schedule that was distributed to the meetingattendees.) There is a milestone date for travel demand modeling activities every
RTTAC Modeling Subcommittee August 4th Meeting Minutes Project #: 9338.0August 14, 2008 Page 6
Kittelson & Associates, Inc. Ft. Lauderdale, Florida
month for the next 14 months. LRTP Plan adoption is scheduled for October 2009 inPalm Beach and Miami Dade Counties and in November 2009 for Broward County.The schedule that is shown for the Goals and Objectives activities will be updated. TheNeeds Plan activity start date will need to be moved back to October 2008 in theschedule.
IX. Subcommittee Meeting Coordination / Vice ChairIt was suggested that either a face to face meeting or a teleconference should be heldat each major milestone during the travel demand modeling activities. It was agreedthat a teleconference would be held on Tuesday, September 9, 2008 (if needed). Inaddition, the group agreed to a face to face meeting on Tuesday, October 14, 2008 inthe FDOT District 4 offices at 1:30 pm.
Prior to adjournment, it was voted on that Ossama Al Aschkar from Broward CountyMPO will Vice Chair the RTTAC Modeling Subcommittee Meeting.

X:\PROJFILE\9338 South Florida Regional LRTP\Task16Meetings\RTTAC MS\October 142008\9338_RTTACMS_10142008_mtgnotes.doc
OCTOBER 14, 2008 MEETING NOTESRegional Transportation Technical Advisory Committee (RTTAC)Modeling Subcommittee
Date: November 12, 2008 Project #: 9338.0
To: Wilson Fernandez, RTTAC Modeling Subcommittee Chair
From: Jessica Josselyn, Kittelson & Associates, Inc.John Zegeer, PE, Kittelson& Associates, Inc.Rob Schiffer, Cambridge Systematics
The following is a summary of the RTTAC Modeling Subcommittee meeting held on October 14,2008. Meeting presentations may be found in Attachment A.
MEETING TIME ANDLOCATIONFlorida Department of Transportation, District IVExecutive Conference RoomFort Lauderdale, Florida
MEETING ATTENDEES1. Ashutosh Kumar (by phone), AECOM Consult, [email protected]. David Schmitt (by phone), AECOM Consult, [email protected]. Ed Sirianni, Broward County MPO, [email protected]. Lina Kulikowski, Broward County MPO, [email protected]. Ossama Al Aschkar, Broward County MPO, [email protected]. Rob Schiffer, Cambridge Systematics, Inc., [email protected]. Dan Glickman, Citizen, [email protected]. Min Tang Li, FDOT D4, min [email protected]. Shi Chang Li, FDOT D4, shi [email protected]. Ken Jeffries, FDOT D6, [email protected]. Phil Steinmiller, FDOT D6, [email protected]. Mohammed Hadi, FIU, [email protected]. Yan Xiao, FIU, [email protected]. Halit Ozbn, FIU, [email protected]. Vidya Mysore, FDOT, [email protected]. Yongqiang Wu, Gannett Fleming, [email protected]. Franco Saraceno, Gannett Fleming, [email protected]. Jessica Josselyn, Kittelson & Associates, Inc., [email protected]. John Zegeer, Kittelson & Associates, Inc., [email protected]. Scot Leftwich, Leftwich (by phone), scot.leftwich@lce fl.com
RTTAC Modeling Subcommittee October 14th Meeting Notes Project #: 9338.0November 12, 2008 Page 2
Kittelson & Associates, Inc. Ft. Lauderdale, Florida
21. Arturo Perez (by phone), Leftwich, ajp@lce fl.com22. Larry Foutz, Miami Dade MPO, [email protected]. Wilson Fernandez, Miami Dade MPO, [email protected]. Paul Larsen, Palm Beach MPO, [email protected]. Srin Varanasi, The Corradino Group, [email protected]. Sandeep Obulareddy, The Corradino Group, [email protected]
MEETING NOTESBelow is a summary of the key points discussed at the meeting. The comments have beenorganized by agenda topic.
I. Call to Order and IntroductionsWilson Fernandez called the meeting to order and everyone introduced themselves. Afterintroductions Wilson made the point that work quality and maintaining the schedule is critical tothe process. All participants must do their part at 100% if we are to be successful.
II. Approval of August 4thMeeting MinutesThe August 4th meeting minutes were approved by the committee.
III. Subsequent Socioeconomic Assumptions/RevisionsSrin Varanasi presented the Input Data that was developed (see Attachment A for thepresentation). A final memorandum that describes the methodology for external tripdevelopment has been prepared. All comments have been addressed in response to the review ofthis memorandum. A final data summary has been prepared. One concern was at the I 75Broward County external station. A second concern was on US 1 at the northern external stationboundary.
Special generators have been addressed. Airport enplanements were received from CambridgeSystematics. Employment growth factors were used from 2025 to 2035 to increase airport trips.Seaport growth factors were based on annual growth rates. Growth rates for both seaports andairports will be linear growth rates.
IV. Existing plus Committed Network CodingSrin Varanasi presented on the existing plus committed network coding (see Attachment A forthe presentation). A successful model run was completed on October 9th. For the highwaynetwork, the I 95 Managed Lanes north of the GoldenGlades Interchange needs to be converted from Managed Lanes to HOV Lanes. The I 595Reversible Lanes in Broward County are committed by the year 2013. The model runs willprovide peak period and daily volume output.
Open Road Tolling will be incorporated into the model. Toll gantry locations are coded as tolllinks with minimal service times. Acceleration and deceleration times at the toll plazas are alsosources of impedance. For the year 2013, the Committed Network will have no toll plazas allMDX and HEFT facilities will have open road tolling only.

RTTAC Modeling Subcommittee October 14th Meeting Notes Project #: 9338.0November 12, 2008 Page 3
Kittelson & Associates, Inc. Ft. Lauderdale, Florida
Transit coding assumes two BRT routes: Biscayne BRT and Kendall BRT. It is recommended theBRT route speeds not be hard coded. The actual operation for the service will be in mixed flow.This service will be coded either as a limited stopmode (a 20% 25% increase in speed) or a BRTmode should be coded. David Schmitt will be providing a recommended BRT modeling approachto the group in the near term.
V. Review and Discussion on SERPM 2035 Model ResultsRob Schiffer presented his review on the SERPM 2035 model results (see Attachment A for thepresentation). He noted that since the model results were distributed just a few days prior to thismeeting, the review is still in process and that his presentation is an overview of the initialfindings.
Input files checks were conducted for the socio economic data. The school enrollment andhotel/motel figures are a little bit off in comparing the spreadsheets against the final figures. Inprojecting enplanements, the FAA approach and the BEBR approach were considered. There isneed to clarify how the E+C network was built. A comparison was made between the 2035volume projections and the 2005 volume counts. The number of HBW trips and total trips areincreasing from 2005 to 2030 to 2035.
VI. ITS ToolboxMohammed Hadi from FIU presented to the group on the Evaluation Tools to Support ITSPlanning Process FDOT research (see Attachment A for the presentation).
IDAS has limitations for ITS applications. Fourteen ITS deployments are covered with the FDOTmethod. The tool is built within a FSUTMS/Cube environment. Benefits and costs are determined.A methodology has been developed for each ITS application. The analysis can be conductedusing a time of day model. Accident severity is predicted based on curves obtained from IDAS(based on v/c ratios).
VII. Performance EvaluationThe regional measures of effectiveness will be discussed with the RTTAC. The level of servicetables should be considered for evaluation of model results rather than just consideration of thevolume to capacity ratio. This subject will be revisited at the next meeting.
VIII. Upcoming Schedule MilestonesJessica distributed the RLRTP schedule. We have completed the modeling milestones 1, 2, and 3.The model runs will be completed in November. The E+C network and the 2035 socio economicdata will be included. On that basis, the three LRTP consultants will develop Needs alternativesin December.
The I 95 Managed Lanes will be assumed to be completed by the year 2014. The adopted WorkPlan will go through the year 2014. The next set of E+C runs will not include any anticipatedprojects to be funded in 2014. By this Friday, October 17th, all comments from today s meeting willbe incorporated into the model for a set of E+C runs. The next set of E+C model runs will bedistributed to the three counties by October 24th. The three counties will then use this network toproceed with the Needs Assessment.
RTTAC Modeling Subcommittee October 14th Meeting Notes Project #: 9338.0November 12, 2008 Page 4
Kittelson & Associates, Inc. Ft. Lauderdale, Florida
The schedule for the Needs Assessment will require that alternate networks will be tested:Highway Emphasis, Transit Emphasis, and Balanced Network. At this time, we are assuming thateach county submits two runs: one for the transit emphasis and one for the highway emphasis.These two runs will be stitched together for each county and a regional model run will beconducted. Ossama Al Aschkar suggested that a final Needs Assessment network will bedistributed for a regional model run. This issue will be resolved at the next meeting.
IX. Next StepsThe next meeting will occur on December 1st (afternoon) to discus the Needs Plan assessment. TheI 595 Managed Lanes methodology will be provided by the Corradino Group by the end of thisweek. A teleconference will be scheduled on the morning of October 21st (tentatively).
X. Other Discussion ItemsNone addressed.
XI. AdjournmentWilson Fernandez adjourned the meeting.
2 4 5 7 Ca r e Dr i ve, Su i te 1 0 1T a l l a h a ssee, F L 3 2 3 0 8
t el 8 5 0 2 1 9 6 3 8 8 www.camsys.com f a x 8 5 0 2 1 9 6 3 8 9
December 3, 2008 Meeting MinutesRegional Transportation Technical Advisory Committee (RTTAC)Modeling Subcommittee
Date: December 16, 2008 Project #: 8055.002
To: Wilson Fernandez, RTTAC Modeling Subcommittee Chair
From: Rob Schiffer, Cambridge Systematics, Inc.Jessica Josselyn, Kittelson & Associates, Inc.John Zegeer, PE, Kittelson & Associates, Inc.
The following is a summary of the RTTAC Modeling Subcommittee meeting held on December3, 2008. Meeting presentations may be found in Attachment A.
MEETING TIME AND LOCATIONFlorida Department of Transportation, District IVExecutive Conference RoomFort Lauderdale, Florida
MEETING ATTENDEES (alphabetical order by agency/firm)
1. Ashutosh Kumar (by phone), AECOM Consult, [email protected]. David Schmitt (by phone), AECOM Consult, [email protected]. Sung Ryong Han, BCC Engineering, [email protected]. Ed Sirianni, Broward County MPO, [email protected]. Lina Kulikowski, Broward County MPO, [email protected]. Ossama Al Aschkar, Broward County MPO, [email protected]. Rob Schiffer, Cambridge Systematics, Inc., [email protected]. Dan Glickman, Citizen, [email protected]. MinTang Li, FDOT D4, min[email protected]. ShiChang Li, FDOT D4, shi[email protected]. Ken Jeffries, FDOT D6, [email protected]. Phil Steinmiller, FDOT D6, [email protected]. Yongqiang Wu, Gannett Fleming, [email protected]. Franco Saraceno, Gannett Fleming, [email protected]. Jessica Josselyn, Kittelson & Associates, Inc., [email protected]. Thuha Lyew, Kittelson & Associates, Inc., [email protected]. John Zegeer, Kittelson & Associates, Inc., [email protected]. Arturo Perez (by phone), Leftwich, ajp@lcefl.com19. Larry Foutz, MiamiDade MPO, [email protected]. Wilson Fernandez, MiamiDade MPO, [email protected]. Carlos Roa, MiamiDade MPO, [email protected]. Paul Larsen, Palm Beach MPO, [email protected]
2
23. Vinod Sandanasomy, Palm Beach MPO, [email protected]. Sandeep Obulareddy, The Corradino Group, [email protected]. Srin Varanasi, The Corradino Group, [email protected]. Andrew Velasquez, URS/FDOT Turnpike, [email protected]
MEETING NOTES
Below is a summary of the key points discussed at the meeting. The comments have beenorganized by agenda topic.
I. Call to Order and IntroductionsWilson Fernandez called the meeting to order and everyone introduced themselves. Afterintroductions Wilson made the point that we have an ambitious agenda with lots of actionitems that we need to get passed today.
II. Needs Plan Development MethodologyRob Schiffer presented the methodology for developing the Needs Assessment. A commonbackground network is needed for developing the Needs Plan. The E+C and 2030 CostFeasibleplans are available in the current version of SERPM. Rob suggested that the 2030 CostFeasiblePlan would be a good background network since these projects would likely be included in any2035 needs alternatives. Recent LRTP amendments could also be incorporated.
Ossama said that it would be much easier if we were to use the E+C network. We wouldcoordinate crosscounty improvements to make the appropriate adjustments. If FDOT takescharge of the coding, then we could use the 2030 network. ShiChiang Li asked the question: dowe need to identify the regional needs to develop a Needs Plan for an individual county? If yes,then we need to determine how to use the model to create this network. Larry Foutz said at thetime that the scope for this RLRTP project was developed, the assumption was that the NeedsNetwork would serve as a basis for testing alternatives. . In determining the needs assessments,the E+C network is sufficient. Then the three county Needs Plans can be aggregated by theregional LRTP team and identify inconsistencies. Carlos Roa said that all three counties havealready used the E+C plans to identify deficiencies. Phil Steinmiller said that the starting pointwould be the E+C network except for the crosscounty (regional) corridors, where the CostFeasible Plan projects should prevail.
Rob reminded the group that the 2030 CostFeasible Plans have already been coded, except forproject amendments. Larry Foutz said that each county should have the ability to run Needsscenarios on any network that they choose. Wilson noted that each county would still developtheir own Needs networks (lists of projects to be considered). The background network wouldbe provided to the MPOs and their consultants to code these projects into a Needs Plan. Eachcounty would then run scenarios to test specific projects. The E+C network requires the countyto make assumptions about what will happen in the other two counties. In Palm Breach County,the transit needs will not be based on the travel demand model. One Needs Plan will bedeveloped. Three CostFeasible Plans will be developed (roadway emphasis, transit emphasis,and blended). One plan will then be selected. Phil Steinmiller says that since there is divergenceamong the CostFeasible Plans, then in each county, the problem is that needs projects will need

3
to be removed and then recoded. Phil thinks that the 2030 costfeasible network could represent2035 needs projects since 2035 funds will be less than 2030 funds. In MiamiDade, there aresome major facilities under consideration for the 2035 Needs Plan that are not in the 2030 CostFeasible Plan.
This motion was passed unanimously: In order to create a regional needs network, each countywill individually develop a list of projects that describes their project needs. The three countieswill provide this list of projects to FDOT D4 and their consultants, who will then code anetwork that includes the three county lists of projects. The regional consultant will then reviewthe list of projects for inconsistencies and bring those inconsistencies to this group for comment.(At that point, each county can test alternative needs scenarios using the regional model.)
III. Model Performance Measurement Tools and StatisticsRob presented a set of performance measures that have been derived from models duringprevious LRTPs and that could be used to assess projects either for the regional plan or for theindividual county plans. He led the group through a presentation and discussion ofquantitative measures by model step and indicated which of these are currently produced bySERPM as outputs and which are not, or are only measured regionally (i.e., not by individualcounty). FDOT and their consultants indicated that most regional performance statistics couldalso be summed by County through additional scripting work with SERPM. FDOT D4 agreed toadd average trip lengths and transit trips by county as SERPM outputs.
A discussion ensued on the pros and cons of intrazonal trips –relates not only to land use mix,but also the zone size and congestion on adjacent corridors. A point was made that percent ofpopulation and employment within ¼ mile of transit can also be impacted by the transitprojects in the alternative. We could substitute “attractions” within ¼ mile in place of“employment”. VHT/HH might be a better mobility measure than VMT/HH. HBW transittrips are still the same thing as AM trips in mode choice within SERPM. It was suggestedlooking at the relationship between linked and unlinked transit trips as a passengerconvenience measure.
After measures of effectives (performance measures) have been chosen by the counties, thesemeasures will be provided to the regional consultant, FDOT, and their consultants. Themeasures of effectiveness should be quantitative, not qualitative, as the alternatives will largelybe judged based on differences in quantitative measures. “Cost per unit of facility” addedshould be considered against improvement in travel time or mode shift to transit. An integratedtransportationland use model (which is not available to us) would allow us to measuresustainability. While the group had a few comments, there was no motion provided at this time.
IV. Understanding v/c RatiosA study was conducted at the intersection of Atlantic Boulevard and U.S. 1. This intersection isoperating at a volumetocapacity ratio of approximately 1.0 for the westbound through lanegroup. The approach delay averages at about 70 seconds per vehicle. The average queue lengthis about 34 vehicles at a v/c ratio of 1.0. The conclusion of this research was that v/c is notnecessarily a good surrogate for highway levelofservice. However, when we convey v/c ratios
4
to the public, we can relate this to measures that they understand, like queue length, signalfailures, or seconds of delay. Likewise, no motion was made to address the use of v/c ratios.
V. Other BusinessThis group was formed to deal with projectbased modeling issues in addition to the regionalLRTP. FTA will have a modeling workshop in March that may provide guidance on thequestion of what background network will be assumed for the FEC Corridor in the Needs Planfor the region. The question that we should address is whether any major capital transitimprovement is costfeasible. The FTA New Starts process includes an attempt to verify themodeling for a future transit corridor. There is separation between the New Starts process andthe LRTP.
ETDM will be required for all Needs Plan projects that are federallyfunded. The CostFeasibleprojects must have projected volumes included with the list of projects.
The minutes from the last meeting were approved.
VI. ScheduleThe Needs assessment list should be submitted and ready for coding no later than February 13.A midMarch review of the Needs network will then occur. The projects should have terminiand number of lanes. A GIS format or model format would be preferred. This network will thenbe coded by the Corradino Group. We will tentatively have our next meeting on Wednesday,March 11. This will allow for the Regional Needs model to be completed in April.

2 4 5 7 Ca r e Dr i ve, Su i te 1 0 1T a l l a h a ssee, F L 3 2 3 0 8
t el 8 5 0 2 1 9 6 3 8 8 www.camsys.com f a x 8 5 0 2 1 9 6 3 8 9
March 18, 2009 Meeting MinutesRegional Transportation Technical Advisory Committee (RTTAC)Modeling Subcommittee
Date: March 19, 2009 Project #: 8055.002
To: Wilson Fernandez, RTTAC Modeling Subcommittee Chair
From: Rob Schiffer, Cambridge Systematics, Inc.Jessica Josselyn, Kittelson & Associates, Inc.John Zegeer, PE, Kittelson & Associates, Inc.
The following is a summary of the RTTAC Modeling Subcommittee meeting held on March 18,2009. Meeting presentations should be provided separately via email and ftp.
MEETING TIME AND LOCATIONFlorida Department of Transportation, District IVAdministrative Conference Room, First FloorFort Lauderdale, Florida
MEETING ATTENDEES (alphabetical order by agency/firm)
1. Ashutosh Kumar (by phone), AECOM, [email protected]. David Schmitt (by phone), AECOM, [email protected]. Ed Sirianni, Broward County MPO, [email protected]. Lina Kulikowski, Broward County MPO, [email protected]. Ossama Al Aschkar, Broward County MPO, [email protected]. Rob Schiffer, Cambridge Systematics, Inc., [email protected]. Dan Glickman, Citizen, [email protected]. MinTang Li, FDOT D4, min[email protected]. ShiChang Li, FDOT D4, shi[email protected]. Scott Seeburger, FDOT D4, [email protected]. Carlton Card, FDOT D6, [email protected]. Franco Saraceno, Gannett Fleming, [email protected]. Jessica Josselyn, Kittelson & Associates, Inc., [email protected]. John Zegeer, Kittelson & Associates, Inc., [email protected]. Arturo Perez, Leftwich Consulting Engineers, ajp@lcefl.com16. Larry Foutz, MiamiDade MPO, [email protected]. Wilson Fernandez, MiamiDade MPO, [email protected]. Carlos Roa, MiamiDade MPO, [email protected]. Nellie Fernandez, Palm Beach MPO, [email protected]. Paul Larsen, Palm Beach MPO (by phone), [email protected]. Vinod Sandanasomy, Palm Beach MPO, [email protected]. Joe Quinty, South Florida RTA, [email protected]
2
23. Sandeep Obulareddy, The Corradino Group, [email protected]. Srin Varanasi, The Corradino Group, [email protected]. Andrew Velasquez, URS/FDOT Turnpike, [email protected]
MEETING NOTES
Below is a summary of the key points discussed at the meeting. The comments have beenorganized by agenda topic.
I. Call to Order and IntroductionsWilson Fernandez called the meeting to order at 1:50 pm and everyone introduced themselves.Wilson said we must get through all agenda items today. First, we will be going through theNeeds Plan status report and summary. We must assess where we are with modeling work andto see how it fits into the respective schedule and then determine key milestones and dates.
II. Update on SERPM Needs Plan Network CodingCoding for the MiamiDade and Broward County highway and transit networks has beencompleted. For Palm Beach County, highway and transit maps have been provided. Palm Beachtransit coding is complete. There are a few Palm Beach County highway gradeseparatedprojects that remain to be coded.
The following coding assumptions have been made:
1) I75 BRT uses Managed Lanes (not reversible lanes) from Gratigny Parkway toSawgrass Mills. Parknride (PNR) connections are via “transit only” links.2) SR 836 and SR 112 –conversion made from openroad tolling to Managed Lanes withvariable tolling based on congestion levels (verification is needed on all vs. some lanes).3) The FEC Corridor has been coded to have 7.5minute peak hour headways from theMiamiDade County Government Center to the Pompano Beach crossover.4) South of 71st Street in MiamiDade County, there is additional service on the CSXtracks with 7.5minute headways.5) PNR – service miles assumed to be five miles at end stations and less at otherstations.6) The I95 Managed Lanes in Palm Beach County had been terminated at LintonBoulevard in Delray Beach. In the Palm Beach County Needs Plan, the Managed Lanesnow extend to Indiantown Road.7) SR 710 Rail –SFRTA believes this will only be for “intercity” rail passenger servicealong with some possible bus service.
Coding will be completed by The Corradino Group this Thursday, March 19th. The threecounties are requested to consider the transit coding mode that is used for premium transitroutes (BRT, LRT, and commuter rail) between March 19th and March 26th. (Speed and servicecharacteristics would be different between BRT and LRT. BRT in mixedflow will have speedsthat are comparable to express bus service.) Between March 19th and March 26th, the threecounties will review the network coding and provide review comments to Srin and RobSchiffer. The final Needs Plan network will be completed by The Corradino Group by April 3rd.At that time, The Corradino Group will run the Needs Plan model.

3
III. Summary of Needs Plan Consistency ReviewRob presented on a consistency review that was conducted for the three county Needs Planlistings. There were 14 potential inconsistencies identified including projects where onlyclarification was needed. Additional clarifications were sought and resolved via both theFebruary 27th meeting and followup telephone calls. The later map identified additionalregional corridors, mostly hubs (airports, ports, etc.) and other modes (freight rail, waterways,etc.). These new regional corridors, connectors, and hubs should not create any newinconsistencies. If any are found, they will be identified and provided to The Corradino Groupby March 26th.
IV. MPO Plans/Schedules for Needs Alternatives TestingBroward County will take the final Needs Assessment from The Corradino Group on April 3rd
and conduct the testing of alternate Needs configurations to develop a CostFeasible Plan in 3 to6 weeks thereafter. When the MiamiDade County TIP is approved at the end of May, the E+Cnetwork will be modified (June). The Needs Plan projects will be evaluated by the SteeringCommittee in MiamiDade County on April 20th and 21st. In Palm Beach County, many of theNeeds projects will be removed to create the 2035 CostFeasible Plan. The first review of thePalm Beach County CostFeasible Plan will be presented on April 1st. CostFeasible projects onregional corridors will be identified and evaluated by the regional consultant beginning in thefirst week of July.
V. Outstanding Needs Plan Coding IssuesThere are no outstanding coding issues. There was a general satisfaction expressed withtimeliness and coordination on everyone’s part.
VI. Other BusinessWe are on schedule for the development of a regional CostFeasible Plan. The SERPM E+Cnetwork will be updated in June/July to reflect new TIPS and economic stimulus projects.Updating the E+C network will be mainly for the benefit of future model users and should havea negligible impact on LRTP modeling efforts.
VII. Schedule/Next MeetingThe next meeting of this subcommittee will occur on Tuesday, June 23rd at 1:30 pm. We canidentify revisions to the E+C network at that time. Other topics will include a final look at theNeeds Plans, discussions of the Cost Feasible Plans, and regional measures of effectiveness.

2 4 5 7 Ca r e Dr ive, Sui te 101T a l l a h a ssee, F L 3 2 3 0 8
t el 8 5 0 2 1 9 6 3 8 8 www.camsys.com f a x 8 5 0 2 1 9 6 3 8 9
June 23, 2009 Meeting MinutesRegional Transportation Technical Advisory Committee (RTTAC)Modeling Subcommittee
Date: June 23, 2009 Project #: 8055.002
To: Wilson Fernandez, RTTAC Modeling Subcommittee Chair
From: Rob Schiffer, Cambridge Systematics, Inc.Jessica Josselyn, Kittelson & Associates, Inc.
The following is a summary of the RTTAC Modeling Subcommittee meeting held on June 23,2009.
MEETING TIME AND LOCATIONFlorida Department of Transportation, District IVExecutive Conference Room, Third FloorFort Lauderdale, Florida
MEETING ATTENDEES (alphabetical order by agency/firm)1. Ashutosh Kumar, AECOM, [email protected]. David Schmitt, AECOM, [email protected]. Ed Sirianni, Broward MPO, [email protected]. Lina Kulikowski, Broward MPO, [email protected]. Ossama Al Aschkar, Broward MPO, [email protected]. Rob Schiffer, Cambridge Systematics, Inc., [email protected]. Dan Glickman, Citizen, [email protected]. ShiChang Li, FDOT D4, shi[email protected]. Derek Miura, FDOT D4, [email protected]. Sung Ryong Han, FDOT D6 (BCC Engineering), [email protected]. Andrew Velasquez, FDOT Turnpike, [email protected]. Franco Saraceno, Gannett Fleming, [email protected]. Myung Sung, Gannett Fleming, [email protected]. Jessica Josselyn, Kittelson & Associates, Inc., [email protected]. Arturo Perez, Leftwich Consulting Engineers (by phone), ajp@lcefl.com16. Larry Foutz, MiamiDade MPO, [email protected]. Wilson Fernandez, MiamiDade MPO, [email protected]. Carlos Roa, MiamiDade MPO, [email protected]. Nellie Fernandez, Palm Beach MPO, [email protected]. Paul Larsen, Palm Beach MPO, [email protected]. Vinod Sandanasomy, Palm Beach MPO, [email protected]. Steve Anderson, South Florida RTA, [email protected]. Joe Quinty, South Florida RTA (by phone), [email protected]. Ken Kaltenbach, The Corradino Group, [email protected]
2
25. Sandeep Obulareddy, The Corradino Group, [email protected]. Srin Varanasi, The Corradino Group, [email protected]
MEETING NOTES
Below is a summary of the key points discussed at the meeting. The comments have beenorganized by agenda topic.
I. Call to Order and IntroductionsWilson Fernandez called the meeting to order at 1:30 pm and everyone introduced themselves.Wilson gave a brief overview of the agenda and key items to get through. Paul Larsen wasrecognized for his years of service to the Palm Beach MPO, Southeast Florida/RTTAC, and theFlorida Model Task Force. With Paul’s retirement, Nellie and Vinod will handle his duties forthe remainder of this LRTP cycle.
II. Update on Recent MPO LRTP Modeling Activitiesa. Broward – needs assessment nearly complete… a few cities still have some
projects they wish to see added to the Needs Plan; went with mode neutraltechnologies (modeled as BRT); anticipate sending out a spreadsheet summary of2035 Needs Plan in late July; minor coding issues but need to run final network
b. MiamiDade – needs plan was done by scratch through public workshops; TIPwas downsized due to funding issues and dropped projects were added to theNeeds Plan; MDX, Turnpike, and MDTA have all had funding issues to contendwith but 2035 Needs Plan is finished. No problem getting out spreadsheet to us
c. Palm Beach – CFP is underway… 3 alternatives; SE data change was madebecause of BEBR change and a sector plan not being approved; minor networkchanges recently made to CFP network to account for coding errors; summary ofcoding errors and SE data changes will be sent out in July
III. E+C Network Update Reflecting TIP AdoptionsEach MPO and the Turnpike must provide listings of newly adopted TIP changes and theimpacts these may have on the E+C network. July 20th was set as a deadline for getting out E+Cnetwork changes to Li, Srin, Jessica, Wilson, and Rob.
IV. SE FL RTP Needs Assessment ReportRob mentioned this report, provided to all when transmitting today’s meeting agenda.Comments are not required but are welcomed from RTTAC members. Following the meeting,comments were provided by Joe Quinty regarding TriRail ridership forecasts. A teleconferencewith SFRTA, FDOT D4, Corradino, and Cambridge Systematics is being discussed.
V. Modeling Metrics for use in PrioritizationRob went over a range of potential measures and would like to see an exchange on what eachMPO has been using. There was general agreement to share on what’s been used by each MPOin terms of model metrics, performance measures, and evaluation criteria. Regional measuresshould be selected that aren’t overwhelming or contradictory. The regional transportation plan

3
should use metrics that are reasonably common to what the MPOs are already doing… don’treinvent the wheel and create additional work in terms of assessments.
VI. Cost Feasible Plan CoordinationJessica noted that deadlines are needed such that regional prioritization work can proceed ontime. August 20th was suggested for providing a conceptual cost feasible project list. Once draftCFPs in place, the RTP CFP can begin. Jessica will send out a list of what she needs to the group.Draft CFP will be coded for prioritization purposes in August/September/October. FinalSERPM network coding would likely wait until after adoption (November/December).Deadline for RTP CFP is January 2010.
VII. Ongoing SERPM 6.x EnhancementsOctober version of SERPM (v. 6.5) will be used for all LRTP modeling.
VIII. Socioeconomic Forecasts wrt BEBR AdjustmentsPalm Beach County has made changes 2035 socioeconomic forecasts as discussed earlier.Broward County does not intend to change their SE forecasts and no changes in MiamiDadeCounty are planned either. Any socioeconomic changes should be documented NLT July 20th.
IX. Other BusinessWilson wanted the group to discuss how we should deal with ongoing PD&E projects inrelation to SERPM versions, network assumptions, SE data forecasts, etc. Li responded that suchdecisions should be based on timing of project deliverables as adopted 2030 model should beused until 2035 LRTP/model is adopted. Wilson added that all should be sensitive tofundamental change in going from 2030 to 2035.Utilization and transition of model
X. Schedule/Next MeetingThe next meeting of this subcommittee will occur either on Thursday, September 10th orTuesday, September 22nd at 1:30 pm. All attendees will be notified in advance as to which dateis selected for the meeting.
2 4 5 7 Ca r e Dr i ve, Su i te 1 0 1T a ll a h as see, F L 3 2 3 0 8
t el 8 5 0 2 1 9 6 3 8 8 www.camsys.com f a x 8 5 0 2 1 9 6 3 8 9
September 22, 2009 Meeting MinutesRegional Transportation Technical Advisory Committee (RTTAC)Modeling Subcommittee
Date: September 22, 2009 Project #: 8055.002
To: Wilson Fernandez, RTTAC Modeling Subcommittee Chair
From: Rob Schiffer, Cambridge Systematics, Inc.Jessica Josselyn, Kittelson & Associates, Inc.John Zegeer, PE, Kittelson & Associates, Inc.
The following is a summary of the RTTAC Modeling Subcommittee meeting held on September22, 2009. Meeting presentations should be provided separately via email and ftp.
MEETING TIME AND LOCATION1:30 pmFlorida Department of Transportation, District IVAdministrative Conference Room, First FloorFort Lauderdale, Florida
MEETING ATTENDEES (alphabetical order by agency/firm)1. Ashutosh Kumar (by phone), AECOM, [email protected]. David Schmitt (by phone), AECOM, [email protected]. Ed Sirianni, Broward MPO, [email protected]. Lina Kulikowski, Broward MPO, [email protected]. Ossama Al Aschkar, Broward MPO, [email protected]. Rob Schiffer, Cambridge Systematics, Inc., [email protected]. Dan Glickman, Citizen, [email protected]. Derek Miura, FDOT D4, @dot.state.fl.us9. ShiChang Li, FDOT D4, shi[email protected]. Carlton Card, FDOT D6, [email protected]. Franco Saraceno (by phone), Gannett Fleming, [email protected]. Jessica Josselyn, Kittelson & Associates, Inc., [email protected]. Arturo Perez (by phone), Leftwich Consulting Engineers, ajp@lcefl.com14. Larry Foutz, MiamiDade MPO, [email protected]. Wilson Fernandez, MiamiDade MPO, [email protected]. Nellie Fernandez, Palm Beach MPO, [email protected]. Vinod Sandanasomy, Palm Beach MPO, [email protected]. Steve Anderson, South Florida RTA, [email protected]. Sandeep Obulareddy, The Corradino Group, [email protected]. Srin Varanasi, The Corradino Group, [email protected]. Andrew Velasquez, URS/FDOT Turnpike, [email protected]
2
MEETING NOTES
Below is a summary of the key points discussed at the meeting. The comments have beenorganized by agenda topic.
I. Call to Order and IntroductionsWilson Fernandez called the meeting to order at 1:35 pm and everyone introduced themselves.No preliminary discussions.
II. Status Report on E+C Update Reflecting TIP AdoptionsSrin made a presentation on the process to update the E+C network. Palm Beach and Browardstill need final review. Wilson established a deadline of October 1st for receiving all remainingcomments on the E+C network with a final version of network distributed by October 8th.
III. Status of Draft Cost Feasible Plan CodingSrin made a presentation on the process to code the CFP network. Unfunded fixed guidewayswere removed for the Cost Feasible Plan but transit only links were left in the CFP networkbecause these will not affect the results and can be used in the future for alternatives testing.Srin will review MiamiDade MPO comments that were already submitted and update basedon that. Several partially funded projects were coded in the network, but those errors havebeen flagged in comments from the MiamiDade MPO. For clarification purposes, Arturo willsend a new list for Palm Beach County with projects highlighted that should have been coded.
IV. Cost Feasible Consistency ReviewThe following projects were discussed as part of Rob’s presentation on the consistency review:
• CS will provide a listing of unfunded Needs Plan projects not removed from CFP networkcoding.
• Turnpike 8laning in MiamiDade County is not cost feasible… 4 lanes per direction endsat northside ramps to the football stadium.
• I95 at Broward/MiamiDade County line is apparently ok.• I95 at Broward/Palm Beach County line is wrong on the Broward County side (Broward
MPO made the wrong assumption that the managed lanes project was unfunded).• Turnpike should show 6 lanes from Sawgrass Expressway to PB County line. Turnpike
staff will review the E+C network and provide comments on this as well as the CFP net.• Dixie Highway and Federal Highway might be flipflopped at the Broward/Palm Beach
County line (Dixie should be 4 lanes and US 1 is 6 lanes).• TriRail should not have a new station at Glades Road and headways should be 20/30/60.• Griffin Road should be “as is” at 6 lanes east of Flamingo Road.• SR A1A lane drop at Broward/MiamiDade County line is correct and reflects today.• SW 10th Avenue should be 6lane divided arterial in CFP (uninterrupted coding is wrong).• It appears that the same situation exists on Flamingo Road, except with 6 lanes in Miami.• Hillsboro Blvd extension coding is actually correct, as strange as it looks.• Dolphin Expressway SW Extension –remove project.• Dolphin Expressway Managed Lanes –remove west of SR 826.

3
• HEFT laneage reductions needed north of Kendall Drive.• I75 Express Lanes –not cost feasible but discussed whether or not to keep for future use.• Tamiami Trail/SW 8th Street/87th Ave –remove interchange and reconnect crossroads.• CS will provide listing of E+C revisions that should also be made to the CFP.
Lina will forward the Broward Cost Feasible Plan transit projects listing to Rob for review.
V. Comments on Draft Cost Feasible Plan CodingGannett Fleming provided their comments in advance of the meeting. The North Corridor wasdiscussed, as well as interlining future MiamiDade BRT (since MetroRail extension will not befunded) with BRT proposed in Broward County. A few additional comments from Browardand Palm Beach MPO consultants were discussed. Each consultant will submit their own list ofcomments. Wilson requested that remaining CFP comments be provided by the end of thisweek (9/25). Revised CFP networks will be provided to the consultants on October 1st.
VI. Remaining Work Efforts/ScheduleFinal network cleanup, development of regional plan, regional performance statistics, andongoing network maintenance will be the topics for our final meeting. Regional plan isscheduled for adoption in January, including interim years. Wilson questioned whether or notinterim year networks were needed in this postair quality maintenance era. Jess needs GISshape files for MPO Needs Plan and eventually the Cost Feasible Plan as well (after adoption).
VII. Other Businessnone.
VIII. Schedule/Next MeetingFinal meeting was tentatively scheduled for December 3rd at 9am. See item VI for meetingtopics.