21% 33% 38% - aciano
TRANSCRIPT


21% 33% 38%

Our Vision & Mission 03
Company Information 06
Company Profile 10
Code of Conduct 12
Milestones 14
Highlights of the Accounts 16
Six Years at a Glance 22
Horizontal Analysis 24
Vertical Analysis 26
Statement of Value Addition & its Distribution 28
Products Launching & Conferences 30
Inauguration of Dealerships 31
Visits & Events 32
Chairman’s Review 34
Directors’ Report 44
Statement of Compliance with the Code of Corporate Governance 52
Notice of Meeting 54
Review Report on Statement of Compliance with the Code of Corporate Governance 59
Auditors’ Report 60
Balance Sheet 62
Profit and Loss Account 64
Statement of Comprehensive Income 65
Cash Flow Statement 66
Statement of Changes in Equity 67
Notes to the Financial Statements 68
Pattern of Shareholding 112
Proxy Form
Contents

A lightweight chassis featuring a compact wheelbase and race-developed suspension.
A compact, powerful 4-cylinder engine delivering a real-world demonstration of advanced race-proven technology.
The GSX-R600 – designed to be The Top Performer in its class, a total package designed to Own The Racetrack.
The Top Performer In Its Class
Pak Suzuki Motor Company Limited2

Mission• Develop products of superior value by focusing on the
customer• Establish a refreshing and innovative company through
teamwork• Strive for individual excellence through continuous
improvement
VisionTo be recognized as a leading organization that values customers’ needs and provides motoring solutions with strong customer care.
Annual Report 2017 3

Pak Suzuki Motor Company Limited4

From its bold styling to its All-Grip 4WD, its Superior Fuel Efficiency to its Safety Features, the Vitara changes everything. Available in an exciting array of colors with a 10.1 inch Infotainment System, it literally tops it all with its Panoramic Roof.
The Game Changer
Annual Report 2017 5
Board of DirectorsKinji Saito ChairmanMasafumi Harano Chief Executive Hirofumi Nagao Senior Advisory Director Shigeo Takezawa Director Kazuyuki Yamashita Director Moin M. Fudda DirectorRukhsana Shah Director
Chief Financial OfficerMiki Nakahara
Company SecretaryAbdul Nasir
Audit CommitteeMoin M. Fudda Chairman Kinji Saito Member Shigeo Takezawa Member
Human Resource and Remuneration(HR & R) Committee Rukhsana Shah ChairmanKinji Saito MemberMasafumi Harano Member
AuditorsKPMG Taseer Hadi & Co.Chartered Accountants
RegistrarCentral Depository Company of Pakistan Ltd.CDC House, 99-B, S.M.C.H.S,Main Shahra-e-Faisal, Karachi.
Company Information
Pak Suzuki Motor Company Limited6

Legal AdvisorsM/s Shahid Anwar Bajwa & Co. ORR Dignam & Company BankersBank Alfalah Ltd. Bank Al Habib Ltd. Citibank N.A. Faysal Bank Ltd. Habib Bank Ltd.Habib Metropolitan Bank LimitedMCB Bank Ltd.National Bank of PakistanStandard Chartered Bank (Pakistan) Ltd. Summit Bank Ltd.The Bank of PunjabThe Bank of Tokyo-Mitsubishi UFJ, Ltd.
Registered OfficeDSU-13, Pakistan Steel IndustrialEstate, Bin Qasim, Karachi.Tel No. (021) 34723551 - 58Fax No. (021) 34723521 - 22Website: www.paksuzuki.com.pk
Area OfficesLahore Office:7-A, Aziz Avenue, Canal Bank Road,Gulberg V, Lahore.Tel No. (042) 35775456, (042) 35775457Fax No. (042) 35775467
Rawalpindi Office:3rd Floor, 112-B Mallahi Plaza, Murree Road, Rawalpindi Cantt.Tel No. (051) 5130230 - (051) 5130229Fax No. (051) 5130232
Multan Office:402, 4th Floor United Mall, Abdali Road Multan.Tel No. (061)-4586499Fax No. (061)-4516765
Annual Report 2017 7

Pak Suzuki Motor Company Limited8

DRIVE EXTRAORDINARY
There are those among us who believe that good enough isn’t enough. They have a strong desire to do things differently. The new Ciaz is made for those who are driven to excel. Inspired by the ever-evolving expectations of sedan buyers, the CIAZ is developed as an “Authentic Sedan” which combines a roomy comfortable cabin and great driving performance with excellent fuel efficiency. All of these come with a stylish design that will inspire a pride of ownership.
Drive ExtraordinaryDriven to Excel

Pak Suzuki Motor Company Limited (PSMCL) is a public limited company with its shares quoted on Pakistan Stock Exchange. The Company was formed in August 1983 in accordance with the terms of a joint venture agreement between Pakistan Automobile Corporation Limited (representing Government of Pakistan) and Suzuki Motor Corporation (SMC) Japan. The Company started commercial production in January 1984 with the primary objective of progressive manufacturing, assembling and marketing of Cars, Pickups, Vans and 4x4 vehicles in Pakistan. The Company’s long term plans inter-alia include tapping of export markets.
The foundation stone laying ceremony of the Company’s existing plant located at Bin Qasim was performed in early 1989 by the Prime Minister then in office. By early 1990, on completion of first phase of this plant, in-house assembly of all the Suzuki engines started. In 1992, the plant was completed and production of the Margalla Car commenced.
LocationDownstream Industrial Estate of Pakistan Steel, Karachi
Total Area259,200 m2 (64 acres)
FacilitiesPress Shop, Welding Shop, Paint Shop, Plastic Shop, Engine and Transmission Assembly Shop, Final Assembly & Hi-Tech Inspection Shop. The Company has also established a modern Waste Water Treatment Plant as its contribution to the preservation of environment.
Cost Rs. 20.494 billion
Production Capacity (double shift)
Car & LCV’s Plant150,000 units per annum
Motorcycles Plant44,000 units per annum
Company Profile
Pak Suzuki Motor Company Limited10

Under the Government’s privatization policy, the Company was privatized and placed under the Japanese management in September 1992. At the time of privatization, SMC increased its equity from 25% to 40%. Subsequently, SMC progressively increased its equity to 73.09% by purchasing remaining shares from PACO. The Suzuki Management immediately after privatization started expansion of the existing plant to increase its installed capacity to 50,000 per annum. The expansion was completed in July 1994.
However the capacity remained substantially under-utilized until 2002 because of economic recession. Thereafter realizing growth in demand, the Company increased capacity in phases. The first phase was completed in January 2005 when capacity was enhanced to 80,000 vehicles .The second phase was completed in January 2006 and capacity was raised to 120,000. The third phase was completed when on 6th February 2007, Prime Minister of Pakistan, Mr. Shaukat Aziz inaugurated 150,000 vehicles capacity expansion facilities.
On 25th April 2007, the Board of Directors of Pak Suzuki Motor Company Limited (PSMCL) and Suzuki Motorcycles Pakistan Limited (SMPL) approved Scheme of Arrangement (The Scheme) to amalgamate SMPL into PSMCL with effect from 1st January 2007. The scheme was approved by the shareholders of the respective Companies at the Extra - Ordinary General Meeting held on 30th June 2007. The scheme was sanctioned by the Honourable High Court of Sindh (the court) on 17th September 2007. The certified copy of the Order of the Court sanctioning the scheme was filed with the Registrar Companies Karachi on 1st October 2007, from which date the scheme became operative.
PSMCL and Suzuki Motor Corporation (SMC) Japan held 41% and 43% shares in SMPL respectively. Pak Suzuki issued and allotted 1,233,300 ordinary shares of Rs.10/- each to the qualifying shareholders of SMPL @ one ordinary share in Pak Suzuki for every twenty one shares held by SMPL shareholders as on the date of final book closure i.e. 29th October 2007. The trading in shares of SMPL on Karachi and Lahore Stock Exchanges ceased from the same date.
The Company setup a new plant for motorcycles at Bin Qasim. All the operations of motorcycles have been shifted to the new plant effective from July 2011.
The Company continues to be in the fore-front of automobile industry of Pakistan. Over a period of time, the Company has developed an effective and comprehensive network of sales, service and spare parts dealers who cater to the needs of customers and render effective after-sale service country wide.
Joint Venture Agreement was signed between Pak Suzuki Motor Company Limited and Tecno Pack Telecom (Private) Limited to set up Tecno Auto Glass Limited (“TAG”). TAG’s main area of operations will be manufacturing, development and designing of Auto Glass products to cater local as well as international markets.
Annual Report 2017 11

Code of ConductThe Code of Conduct shall be applied to all Directors, Officers and Employees of Suzuki Motor Corporation and its consolidated subsidiaries (hereinafter collectively referred to as “Suzuki Group”)
Every Suzuki Group company should fully disseminate this Code of Conduct to its directors, officers and employees and oblige them to observe it in its internal rules and/or employment agreement and in case of their breach of this Code of Conduct, it will be dealt with in accordance with the applicable disciplinary provisions.
FOR OUR CUSTOMERS (1) Realization of products and services of superior value Suzuki Group will provide customers with products and services exceeding their expectation as in line with the spirit “Develop products of superior value by focusing on the customer” which is listed as the first item in our “Mission Statement”.
• We will make every effort to provide products and services that will satisfy our customers, by standing in our customers’ place at all times.
(2) Activities on QualitySuzuki Group will develop and produce high quality products which customers can use in relief and will provide after-sales services considering customers’ safety and security with first priority.
If by any chance a quality related problem occurs, Suzuki Group will devote its sincere efforts to react on customer’s voice, grasp the problem at an early stage and take measures with thorough investigation into the causes so that the customer can continue using Suzuki products in relief.
• We will never neglect any quality related problem on our product that may affect our customers’ safety or security, noticed during development, production or after-sales service.
• We will never lead to a conclusion in our own favour when reacting to indications from our customers related to the quality on our products.
• We will treat aforesaid quality related problems and customers’ indications on quality with utmost sincerity, and will devote our best efforts not to spoil customers’ trust.
FOR A BETTER WORKING ENVIRONMENT(3) Respect of Human RightSuzuki Group will be aware of international norms pertaining to human rights and respect fundamental human rights with reference to laws in each country or region.
• We will cooperate with each other as a member of Suzuki Group to create a working environment with no discrimination by personal attributes or harassment.
(4) Occupational Safety - Traffic SafetySuzuki Group will review the workplace environment to create safe workplace.
Suzuki Group will thoroughly carry out education on safety to prevent occurrence of occupational injury.
• We will strictly obey rules related to safety so that we can maintain safe workplace and prevent occurrence of occupational injury.
• We will immediately report to our supervisors for improvement when we notice any problem related to safety at our workplace.
• We will be conscious that we take part in the automobile industry, observe traffic rules, keep in mind to drive vehicles safely as a social norm, and endeavour to prevent traffic accidents while on duty or in private.
(5) Promoting Kaizen Activities and Observing Basic Business RulesSuzuki Group encourages employees to come up with inventive ideas to improve the workplace. Suggestions from employees on Kaizen will be evaluated and effective measures will be adopted and widespread amongst Suzuki Group companies for a growth of the entire group.
Suzuki Group will create basic rules on our work for the employees to follow.
• We will always think seriously about our business, take the lead in action and make a proposal to the company when we notice any points of improvement.
• We will thoroughly enforce mutual understanding at our workplace and communicate over and over again until others comprehend sufficiently.
Pak Suzuki Motor Company Limited12

• We will always be conscious of overall optimization and make efforts to share information between departments and companies.
• We will observe the business rules provided from time to time in each workplace.
FOR SHAREHOLDERS AND ALL OTHER STAKEHOLDERS(6) ComplianceWhile Suzuki Group acknowledges the existence of difference in laws related to competition such as Antitrust Law and laws related to fair trading by each country or region, Suzuki Group will grasp the difference and carry out training on employees to observe laws and societal norms in their respective countries and regions.
• We will observe the content of the guidance and training provided by the company on laws and societal norms.
• We will immediately consult with our supervisors when we notice any noncompliance or suspected noncompliance by another employee. In case we think it is improper to consult with our supervisors, we will report to the Consultation & Reporting Desk in our company or those provided by Suzuki Motor Corporation.
(7) Environmental ActivitiesIn order to succeed the beautiful earth and affluent society to the next generations, we must all realize that actions of each and every one of us have a great effect on our earth’s future therefore Suzuki Group will make every effort to preserve global environment.
• We will endeavour to produce environmentally friendly products that will be required by our customers, by contributing to development and diffusion of environmentally friendly technology.
• We will reduce burden on the environment sourced from our workplace and devote our sincere efforts to maintain the environment of our workplace and local community.
(8) Refusing relations with antisocial forces• Suzuki Group will thoroughly refuse any
relationships with antisocial forces* and organizations which are threatening the order and safety of civil society.
• We will never accept any unreasonable demand from antisocial forces* and organizations on our own decision and will always report to or consult with our supervisors or related department.
* “Antisocial forces” means any group or individuals pursuing illicit financial gain by violence, power and fraudulence.
Questions on Code of Conduct?In case any query or question arose when following this Code of Conduct, please consult with your supervisor or other responsible person in your company. The person who was consulted must make every effort to correspond to the consulter. In case you could not solve the problem within your departments or within your company, please inform the related department or the Secretariat of Corporate Governance Committee at Suzuki Motor Corporation.
An eye-catching and dynamic sense of style has always set Swift
apart from other compact cars. Swift gives you more of everything
without compromising on style or performance. Swift is a young, fun and dynamic car for fun-loving people. With Swift you’ll be loving
the drive and your life more than you ever thought possible.
Annual Report 2017 13

The paid-up capital was doubled with issuance of 100% right shares which increased the capital to Rs. 250 million.
1993
2002New BALENO was introduced. CNG version of BALENO, ALTO and CULTUS launched. The milestone of 250,000th vehicle from the new plant crossed.
Pak Suzuki as a Public Limited Company incorporated. Industrial Collaboration Agreement executed with SMC - Japan.
1983Shifting of Head Office and production of all models to new plant completed.
1994
The Company started commercial operations.1984
The paid-up capital was increased again with the issuance of 100% right shares, raising the capital to Rs. 490 million.
1995
Mr. Osamu Suzuki, Chairman & CEO of Suzuki Motor Corporation was awarded “Sitara-e-Pakistan” by Government of Pakistan.
Taking initiative to control environmental pollution, the Company set-up waste water treatment plant at a cost of Rs. 40 million. The Joint Venture Agreement ended, PACO divested its entire shareholding to SMC, raising SMC’s equity to 72.8%.
1985 1996
The 100,000th vehicle rolled out from the Bin Qasim Plant. 1300 cc BALENO was introduced replacing MARGALLA.
1000 cc passenger car SWIFT SA-310, later on called KHYBER introduced through local manufacturing.
1988 1997
Foundation stone of the new plant at Bin Qasim was laid by the then Prime Minister of Pakistan, Mohtarma Benazir Bhutto.
Exports of RAVI pickups to Bangladesh commenced.1989 1999
Operation of the first phase of the new plant at Bin Qasim started with engine and transmission assembly.
1990 1000 cc passenger car SF-310 CULTUS replacing KHYBER was introduced. 1000 cc passenger car ALTO was introduced.
2000
New plant commissioned with the production of three box Sedan passenger car initially SF-410 later on SF-413, known as MARGALLA. The Company was privatized with SMC acquiring additional 15% shares from PACO thus enhancing its shareholding to 40% and taking over the management.
1992Reborn MEHRAN was introduced. CNG version of MEHRAN, BOLAN and RAVI were launched.
2001
Milestones
Joint Venture Agreement was signed between Suzuki Motor Corporation-Japan and Pakistan Automobile Corporation to set up Pak Suzuki Motor Co. Ltd. Locally assembled Suzuki SS-80 (FX) car launched.
1982
Pak Suzuki Motor Company Limited14

20101300 cc locally manufactured car Swift was introduced.
2011Inauguration of new motorcycle plant at Bin Qasim.
2012Automatic version of Suzuki Swift 1300cc was introduced. New Suzuki Motorcycle “Raider 110cc” was launched replacing “Shogun”. Complete range of Suzuki products was upgraded to Euro II technology.
2013Suzuki Gear Oil marketing started. Suzuki motorcycle, GD 110 launched. Suzuki heavy bikes introduced.
2014Suzuki WagonR introduced Suzuki Motorcycle GD 110S launched Suzuki Outboard Motors introduced.
20152400cc Suzuki KIZASHI car introduced. Heavy Bike Suzuki Inazuma Aegis Launched. Pak Suzuki awarded by Ozone Award from Govt. of Pakistan. Inauguration of Vendor Development Program II by Federal Minister. Inauguration of Expansion of Parts Manufacturing Facilities by Federal Minister. Inauguration of Resumption of CNG Fitted Vehicle (Mehran & Cultus) by Federal Minister.
2017Joint Venture Agreement was signed between Pak Suzuki Motor Company Limited and Tecno Pack Telecom (Private) Limited to set up Tecno Auto Glass Limited. Introduction of Suzuki Ciaz, Suzuki Mega Carry and Heavy Bike Suzuki GSX-R600Launching of New Suzuki Cultus and Suzuki GR150Inauguration of New Delivery Yard at Port Qasim, Karachi.
2016Introduction of Suzuki GS 150 SE. Inauguration of Suzuki Booking Office & Facilitation Centre. Achieving Highest Award from SMC-Japan on completion of 50,000 units to Government of Punjab under “Apna Rozgar Scheme”. Introduced Suzuki Cultus Limited Edition. Launched Suzuki Vitara.
2003The Company received ISO 9001 : 2000 certification from AIB-VINCOTTE International Limited Brussels, Belgium, 20th Anniversary Celebrations. Commencement of Component export to Hungary, Sub-leasing of land to Vendors Industry of Pak Suzuki adjacent to its assembly plant.
2004New Plastic Injection Molding Shop commenced production of Bumpers, Instrument Panels, Radiator Grills and Wheel Caps.
2005Inauguration of first phase of capacity expansion (80,000 vehicles) by the Federal Minister for Production, Industries and Special Initiatives. Achieved milestone of 100,000 online factory fitted CNG Vehicles. The Company received ISO 14001 : 2004 and OHSAS 18001 : 1999 certification from AIB-VINCOTTE International Limited Brussels, Belgium.
2006Second phase of capacity expansion (120,000 Vehicles) completed. Production of locally manufactured LIANA Car. Production of 100,000 vehicles crossed in a calendar year.
2007Suzuki Motorcycles Pakistan Ltd. merged with Pak Suzuki Motor Company.Plant Capacity Expanded upto 150,000 Vehicles per year.
2009The 1,000,000th vehicle rolled out from the Pak Suzuki Plant. Cargo Van was introduced.
Annual Report 2017 15

Increase/(Decrease)2017 2016 Amount %
------------ (Rupees in thousands) ------------
Production volume (Nos.) - Motorcar 132,725 111,979 20,746 18.5 - Motorcycle 19,603 18,374 1,229 6.7
Sales volume (Nos.) - Motorcar 132,548 110,000 22,548 20.5 - Motorcycle 19,901 17,946 1,955 10.9
Gross Sales 107,095,587 80,181,077 26,914,510 33.6
Selling Commission 5,283,976 3,665,037 1,618,939 44.2 as a % of gross sales 4.9 4.6 0.3
Net Sales 101,811,611 76,516,040 25,295,571 33.1
Gross profit 9,652,573 7,348,577 2,303,996 31.4 as a % of net sales 9.5 9.6 - (0.1)
Distribution and selling costs 2,804,256 2,004,285 799,971 39.9 as a % of net sales 2.8 2.6 - 0.2
Administrative expenses 1,599,815 1,539,590 60,225 3.9 as a % of net sales 1.6 2.0 - (0.4)
For the year ended December 31, 2017Highlights of the Accounts
Sales Revenue Breakup - 2017
Cost of Sales Profit before Taxation Operating expenses and others
4%
91% 5%
Pak Suzuki Motor Company Limited16

Increase/(Decrease)2017 2016 Amount %
------------ (Rupees in thousands) ------------
Finance Cost 68,088 95,775 (27,687) (28.9) as a % of net sales 0.1 0.1 - -
Other income 864,711 1,039,851 (175,140) (16.8) as a % of net sales 0.8 1.4 - (0.6)
Other expenses 413,997 333,542 80,455 24.1 as a % of net sales 0.4 0.4 - -
Share of loss of equity accounted investee 11,914 - (11,914) 100.0
as a % of net sales - - - -
Profit before taxation 5,619,214 4,415,236 1,203,978 27.3 as a % of net sales 5.5 5.8 - (0.3)
Profit after taxation 3,825,821 2,772,635 1,053,186 38.0 as a % of net sales 3.8 3.6 - 0.2
Shareholders' equity 29,549,716 26,216,907 3,332,809 12.7
Earnings per share (Rs.) 46.49 33.69 12.80 38.0
Break-up value per share (Rs.) 359.05 318.55 40.50 12.7
Number of shares issued (000) 82,300 82,300 - -
Exchange Rate 0.9433 0.9432 0.0365 3.9
Cost of Sales Profit before Taxation Operating expenses and others
Sales Revenue Breakup - 2016
4%
90% 6%
Annual Report 2017 17

For the year ended December 31, 2017Highlights of the Accounts Segment Wise
Car Division Motorcycle Division Total2017 2016 Increase /
(Decrease) % 2017 2016 Increase / (Decrease) % 2017 2016 Increase /
(Decrease) %------------ (Rupees in thousand) ----------- ------------- (Rupees in thousand) ------------ ------------ (Rupees in thousand) -----------
Production volume (Nos.) 132,725 111,979 20,746 18.5 19,603 18,374 1,229 6.7 - - - -
Sales volume (Nos.) 132,548 110,000 22,548 20.5 19,901 17,946 1,955 10.9 - - - -
Gross Sales 104,518,068 78,121,853 26,396,215 33.8 2,577,519 2,059,224 518,295 25.2 107,095,587 80,181,077 26,914,510 33.6
Selling Commission & Discount 5,260,559 3,653,885 1,606,674 44.0 23,417 11,152 12,265 110.0 5,283,976 3,665,037 1,618,939 44.2 as a % of gross sales 5.0 4.7 0.3 0.9 0.5 0.4 4.9 4.6 0.3
Net Sales 99,257,509 74,467,968 24,789,541 33.3 2,554,102 2,048,072 506,030 24.7 101,811,611 76,516,040 25,295,571 33.1
Gross profit 9,457,590 7,294,183 2,163,407 29.7 194,983 54,394 140,589 258.5 9,652,573 7,348,577 2,303,996 31.4 as a % of net sales 9.5 9.8 (0.3) 7.6 2.7 4.9 9.5 9.6 (0.1)
Distribution expenses 2,775,083 1,937,848 837,235 43.2 29,173 66,437 (37,264) (56.1) 2,804,256 2,004,285 799,971 39.9 as a % of net sales 2.8 2.6 0.2 1.1 3.2 (2.1) 2.8 2.6 0.2
Administration expenses 1,481,995 1,313,804 168,191 12.8 117,820 225,786 (107,966) (47.8) 1,599,815 1,539,590 60,225 3.9 as a % of net sales 1.5 1.8 (0.3) 4.6 11.0 (6.4) 1.6 2.0 (0.4)
Finance Cost 66,851 94,436 (27,585) (29.2) 1,237 1,339 (102) (7.6) 68,088 95,775 (27,687) (28.9) as a % of net sales 0.1 0.1 - 0.0 0.1 (0.1) 0.1 0.1 -
Other income 815,954 971,705 (155,751) (16.0) 48,757 68,146 (19,389) (28.5) 864,711 1,039,851 (175,140) (16.8) as a % of net sales 0.8 1.3 (0.5) 1.9 3.3 (1.4) 0.8 1.4 (0.6)
WPPF & WWF 413,997 333,542 80,455 24.1 - - - - 413,997 333,542 80,455 24.1 as a % of net sales 0.4 0.4 - - - - - 0.4 0.4 -
Share of loss of equity accounted investee (11,914) - (11,914) (100) - - - - (11,914) - (11,914) (100) as a % of net sales - - - - - - -
Profit before taxation 5,523,704 4,586,258 937,446 20.4 95,510 (171,022) 266,532 155.8 5,619,214 4,415,236 1,203,978 27.5 as a % of net sales 5.6 6.2 (0.6) 3.7 (8.4) 12.1 5.5 5.8 (0.3)
Profit after taxation 3,730,311 2,943,657 786,654 26.7 95,510 (171,022) 266,532 155.8 3,825,821 2,772,635 1,053,186 38.0 as a % of net sales 3.8 4.0 (0.2) 3.7 (8.4) 12.1 3.8 3.6 0.2
Earnings per share (Rs.) 45.33 35.77 9.56 26.7 1.16 (2.08) 3.24 155.8 46.49 33.69 12.80 38.0
Number of shares issued (000) 82,300 82,300 - - 82,300 82,300 - - 82,300 82,300 - -
Pak Suzuki Motor Company Limited18

Car Division Motorcycle Division Total2017 2016 Increase /
(Decrease) % 2017 2016 Increase / (Decrease) % 2017 2016 Increase /
(Decrease) %------------ (Rupees in thousand) ----------- ------------- (Rupees in thousand) ------------ ------------ (Rupees in thousand) -----------
Production volume (Nos.) 132,725 111,979 20,746 18.5 19,603 18,374 1,229 6.7 - - - -
Sales volume (Nos.) 132,548 110,000 22,548 20.5 19,901 17,946 1,955 10.9 - - - -
Gross Sales 104,518,068 78,121,853 26,396,215 33.8 2,577,519 2,059,224 518,295 25.2 107,095,587 80,181,077 26,914,510 33.6
Selling Commission & Discount 5,260,559 3,653,885 1,606,674 44.0 23,417 11,152 12,265 110.0 5,283,976 3,665,037 1,618,939 44.2 as a % of gross sales 5.0 4.7 0.3 0.9 0.5 0.4 4.9 4.6 0.3
Net Sales 99,257,509 74,467,968 24,789,541 33.3 2,554,102 2,048,072 506,030 24.7 101,811,611 76,516,040 25,295,571 33.1
Gross profit 9,457,590 7,294,183 2,163,407 29.7 194,983 54,394 140,589 258.5 9,652,573 7,348,577 2,303,996 31.4 as a % of net sales 9.5 9.8 (0.3) 7.6 2.7 4.9 9.5 9.6 (0.1)
Distribution expenses 2,775,083 1,937,848 837,235 43.2 29,173 66,437 (37,264) (56.1) 2,804,256 2,004,285 799,971 39.9 as a % of net sales 2.8 2.6 0.2 1.1 3.2 (2.1) 2.8 2.6 0.2
Administration expenses 1,481,995 1,313,804 168,191 12.8 117,820 225,786 (107,966) (47.8) 1,599,815 1,539,590 60,225 3.9 as a % of net sales 1.5 1.8 (0.3) 4.6 11.0 (6.4) 1.6 2.0 (0.4)
Finance Cost 66,851 94,436 (27,585) (29.2) 1,237 1,339 (102) (7.6) 68,088 95,775 (27,687) (28.9) as a % of net sales 0.1 0.1 - 0.0 0.1 (0.1) 0.1 0.1 -
Other income 815,954 971,705 (155,751) (16.0) 48,757 68,146 (19,389) (28.5) 864,711 1,039,851 (175,140) (16.8) as a % of net sales 0.8 1.3 (0.5) 1.9 3.3 (1.4) 0.8 1.4 (0.6)
WPPF & WWF 413,997 333,542 80,455 24.1 - - - - 413,997 333,542 80,455 24.1 as a % of net sales 0.4 0.4 - - - - - 0.4 0.4 -
Share of loss of equity accounted investee (11,914) - (11,914) (100) - - - - (11,914) - (11,914) (100) as a % of net sales - - - - - - -
Profit before taxation 5,523,704 4,586,258 937,446 20.4 95,510 (171,022) 266,532 155.8 5,619,214 4,415,236 1,203,978 27.5 as a % of net sales 5.6 6.2 (0.6) 3.7 (8.4) 12.1 5.5 5.8 (0.3)
Profit after taxation 3,730,311 2,943,657 786,654 26.7 95,510 (171,022) 266,532 155.8 3,825,821 2,772,635 1,053,186 38.0 as a % of net sales 3.8 4.0 (0.2) 3.7 (8.4) 12.1 3.8 3.6 0.2
Earnings per share (Rs.) 45.33 35.77 9.56 26.7 1.16 (2.08) 3.24 155.8 46.49 33.69 12.80 38.0
Number of shares issued (000) 82,300 82,300 - - 82,300 82,300 - - 82,300 82,300 - -
Annual Report 2017 19

Pak Suzuki Motor Company Limited20

CULTUS
The All-New Suzuki Cultus – Progressive Technology that fits the modern world. Be it a race to the office, a highway frenzy or the daily rush-hour. It is equipped with Auto Gear Shift that makes your drive absolutely effortless.
IT’S BRIGHTERIT’S BETTERIT’S BOLDER
NEW BEGINNING DIFFERENT ATTITUDE
Annual Report 2017 21

2017 2016 2015 2014 2013 2012----------- Rupees in thousands -----------
OPERATING RESULTS
Production volume (Nos.) Motorcar 132,725 111,979 134,391 80,384 77,142 96,370 Motorcycle 19,603 18,374 19,610 23,871 22,977 21,312 Sales volume (Nos.) Motorcar 132,548 110,000 133,952 78,005 77,050 96,100 Motorcycle 19,901 17,946 20,617 23,453 23,117 20,298
Sales revenue 101,811,611 76,516,040 84,548,757 53,664,947 51,061,333 58,531,137 Gross profit 9,652,573 7,348,577 11,487,448 4,183,699 3,242,513 2,344,871 Profit before taxation 5,619,214 4,415,236 8,685,171 2,623,394 2,353,439 1,498,891 Profit/(loss) after taxation 3,825,821 2,772,635 5,842,671 1,921,894 1,849,357 977,153 Dividends (cash/bonus shares) 1,530,777 452,649 1,234,498 411,499 329,199 205,750 Profit retained 2,295,044 2,319,986 4,608,173 1,510,395 1,520,158 771,403
CAPITAL EMPLOYED
Share capital 822,999 822,999 822,999 822,999 822,999 822,999 Reserves 24,898,931 22,619,294 18,009,762 16,488,378 14,969,549 14,015,364 Unappropriated profit 3,827,786 2,774,614 5,846,477 1,925,305 1,852,610 979,003 Shareholders' equity 29,549,716 26,216,907 24,679,238 19,236,682 17,645,158 15,817,366 Current liabilities 21,360,751 11,635,058 12,772,749 9,117,477 6,166,119 5,547,980
50,910,467 37,851,965 37,451,987 28,354,159 23,811,277 21,365,346
Represented By:
Fixed assets 8,800,002 6,672,057 4,510,789 4,790,506 4,892,675 3,738,867 Other Non - Current assets 1,104,378 661,665 425,792 456,080 546,237 544,083 Net current assets 41,006,087 30,518,243 32,515,406 23,107,573 18,372,365 17,082,396
50,910,467 37,851,965 37,451,987 28,354,159 23,811,277 21,365,346
6 Years at a Glance
Pak Suzuki Motor Company Limited22

2017 2016 2015 2014 2013 2012
PROFITABILITY RATIOS
Gross profit as a % of net sales 9.5 9.6 13.6 7.8 6.4 4.0 Profit before taxation as a % of net sales 5.5 5.8 10.3 4.9 4.6 2.6
Profit after taxation as a % of net sales 3.8 3.6 6.9 3.6 3.6 1.7
Earning per Share (Rs.) 46.5 33.7 71.0 23.4 22.5 11.9
LIQUIDITY & LEVERAGE RATIOS
Current ratio 1.92 2.62 2.55 2.53 2.98 3.08 Quick ratio 0.79 1.21 1.51 0.88 1.23 1.16 Liabilities as a % of total assets 42 31 34 32 26 26 Equity as a % of total assets 58 69 66 68 74 74
EFFICIENCY RATIOS
Inventory turn over ratio 3.8 4.2 5.6 3.3 4.5 5.3 No. of days stock held 95 86 65 110 82 69 No. of days sales in trade debts 0.8 5.7 6.7 9.2 7.0 3.9 Total assets turn over ratio 2.0 2.0 2.3 1.9 2.1 2.7 Net worth turn over ratio 3.4 2.9 3.4 2.8 2.9 3.7
EQUITY RATIOS
Break up value per share (Rs.) 359.05 318.55 299.87 233.74 214.40 192.19 Cash Dividend as a % of capital 186 55 150 50 40 25 Dividend payout ratio (%) 40 16 21 21 18 21 Plough-back ratio (%) 60 84 79 79 82 79
OTHER DATA
Permanent employees strength (Nos.) 1,345 1,269 1,257 1,272 1,273 1,193
Number of shares 82,299,851 82,299,851 82,299,851 82,299,851 82,299,851 82,299,851
Annual Report 2017 23

2017 % 2016 % 2015 % 2014 % 2013 % 2012 %
---------------------------------------------------------- Rupees in millions ----------------------------------------------------------
Balance Sheet
Fixed assets 8,985 33.2 6,745 46.8 4,594 (8.0) 4,996 (1.6) 5,075 25.3 4,051 (10.1)
Long-term investments 208 - 0 - - - 0 (100.0) 2 (60.0) 5 25.0
Long-term loans 2 (99.1) 231 2,210.0 10 - 10 66.7 6 500.0 1 (50.0)Long-term deposits, prepayments and other receivables 382 1,217.2 29 16.0 25 8.7 23 (37.8) 37 (41.3) 63 215.0
Long-term installment sales receivables 145 51.0 96 (15.8) 114 (29.6) 162 (4.7) 170 4.3 163 (12.4)
Deferred taxation 237 1.3 234 20.0 195 248.2 56 (62.2) 148 - - -
Stores, spares and loose tools 115 3.6 111 12.1 99 20.7 82 24.2 66 (20.5) 83 29.7
Stock-in-trade 23,946 47.0 16,289 24.5 13,084 (12.6) 14,977 39.6 10,726 1.6 10,562 (18.3)
Trade debts 211 (82.5) 1,205 (22.9) 1,562 15.5 1,352 37.5 983 56.8 627 94.1 Current portion of long-term installment sales receivables 321 10.3 291 (16.4) 348 (10.3) 388 17.2 331 5.4 314 3.3
Loans and advances 37 (81.6) 201 1.5 198 (61.6) 515 25.0 412 111.3 195 (10.1)Trade deposits and short term prepayments 966 1,154.5 77 8.5 71 34.0 53 (15.9) 63 61.5 39 (53.0)
Accrued profit on bank deposits 29 (76.0) 121 (37.3) 193 1,106.3 16 23.1 13 116.7 6 -
Other receivables 93 (27.9) 129 48.3 87 (35.1) 134 17.5 114 (39.0) 187 (6.0)
Sales tax and excise duty adjustable 1,144 (30.7) 1,651 493.9 278 (72.3) 1,002 24.8 803 (17.2) 970 (5.2)
Taxation - net 4,900 158.7 1,894 19.1 1,590 (42.1) 2,747 (5.2) 2,897 8.2 2,677 13.3
Cash and bank balances 9,189 7.5 8,548 (43.0) 15,006 715.1 1,841 (6.3) 1,964 38.6 1,417 24.4 Non-current assets classified as held for sale 0 - 0 - 0 - 0 - 0 (100.0) 5 -
Total assets 50,910.0 34.5 37,852.0 1.1 37,452 32.1 28,354 19.1 23,811 11.4 21,365 (8.5)
Share capital 823 - 823 - 823 - 823 - 823 - 823 -
Reserves 28,727 13.1 25,394 6.4 23,856 29.6 18,414 9.5 16,822 12.2 14,994 3.2
Total Equity 29,550 12.7 26,217 6.2 24,679 28.3 19,237 9.0 17,645 11.6 15,817 3.0
Trade and other payables 11,392 80.8 6,300 (2.2) 6,442 30.3 4,945 33.8 3,696 37.1 2,695 (16.1)
Advances 5,332 228.1 1,625 (61.5) 4,226 95.7 2,159 243.2 629 (45.0) 1,144 (62.7)
Accrued mark-up - - - - - (100.0) 9 - - - - -
Short-term borrowing - - - - - - - - - - - (100.0)
Security deposits 4,601 25.3 3,673 77.6 2,068 7.9 1,917 12.6 1,703 8.4 1,571 3.5 Provision for custom duties and sales tax 36 - 36 - 36 (58.1) 86 (37.7) 138 - 138 -
Total equity and liabilities 50,910.0 34.5 37,852.0 1.1 37,452 32.1 28,354 19.1 23,811 11.4 21,365 (8.5)
Horizontal Analysis of Balance Sheet
Pak Suzuki Motor Company Limited24

2017 % 2016 % 2015 % 2014 % 2013 % 2012 %
---------------------------------------------------------- Rupees in millions ----------------------------------------------------------
Profit and Loss Account
Sales 101,812 33.1 76,516 (9.5) 84,549 57.5 53,665 5.1 51,061 (12.8) 58,531 11.0
Cost of sales (92,159) 33.2 (69,167) (5.3) (73,061) 47.7 (49,481) 3.5 (47,819) (14.9) (56,186) 10.5
Gross profit 9,653 31.4 7,349 (36.0) 11,487 174.5 4,184 29.0 3,243 38.3 2,345 25.5
Distribution cost (2,804) 39.9 (2,004) 3.0 (1,946) 160.9 (746) 33.2 (560) 56.4 (358) 35.1
Administrative expenses (1,600) 3.9 (1,540) 25.1 (1,231) 11.7 (1,102) 14.9 (959) 11.6 (859) 16.7
Other operating expenses (414) 24.0 (334) (48.9) (653) 233.2 (196) 12.0 (175) 57.7 (111) 3.7
Other income 865 (16.8) 1,040 (1.7) 1,058 107.5 510 (40.9) 863 74.7 494 (20.3)
Operating profit 5,699 26.3 4,511 (48.2) 8,716 228.9 2,650 9.9 2,411 59.7 1,510 9.2
Share of loss of equity accounted investee (12) 100 - - - - - - - - - -
Finance cost (68) (29.2) (96) 209.7 (31) 14.8 (27) (53.4) (58) 427.3 (11) (38.9)
Profit before taxation 5,619 27.3 4,415 (49.2) 8,685 231.1 2,623 11.5 2,353 57.0 1,499 9.8
Taxation (1,793) 9.1 (1,643) (42.2) (2,843) 305.0 (702) 39.3 (504) (3.4) (522) (8.6)
Profit after taxation 3,826 38.0 2,773 (52.5) 5,843 204.0 1,922 3.9 1,849 89.3 977 23.0
Horizontal Analysis of Profit and Loss Account
GR 150Move to the next level
ENGINEEREDFOR SPEED ANDPERFORMANCE
Annual Report 2017 25

Vertical Analysis of Balance Sheet
2017 % 2016 % 2015 % 2014 % 2013 % 2012 %---------------------------------------------------- Rupees in millions -------------------------------------------------------
Fixed assets 8,985 17.6 6,745 17.8 4,594 12.3 4,996 17.6 5,075 21.3 4,051 19.0
Long-term investments 208 0.4 - 0.0 - 0.0 0 0.0 2 0.0 5 0.0
Long-term loans 2 0.0 231 0.6 10 0.0 10 0.0 6 0.0 1 0.0
Long-term deposits, prepayments and other receivables 382 0.8 29 0.1 25 0.1 23 0.1 37 0.2 63 0.3
Long-term installment sales receivables 145 0.3 96 0.3 114 0.3 162 0.6 170 0.7 163 0.8
Deferred taxation 237 0.5 234 0.6 195 0.5 56 0.2 148 0.6 - 0.0
Stores, spares and loose tools 115 0.2 111 0.3 99 0.3 82 0.3 66 0.3 83 0.4
Stock-in-trade 23,946 47.0 16,289 43.0 13,084 34.9 14,976 52.8 10,726 45.0 10,562 49.4
Trade debts 211 0.4 1,205 3.2 1,562 4.2 1,352 4.8 983 4.1 627 2.9
Current portion of long-term installment sales receivables 321 0.6 291 0.8 348 0.9 388 1.4 331 1.4 314 1.5
Loans, advances and others 37 0.1 201 0.5 198 0.5 515 1.8 412 1.7 195 0.9
Trade deposits and short term prepayments 966 1.9 77 0.2 71 0.2 53 0.2 63 0.3 39 0.2
Accrued profit on bank deposits 29 0.1 121 0.3 193 0.5 16 0.1 13 0.1 6 -
Other receivables 93 0.2 129 0.3 87 0.2 134 0.5 114 0.5 187 0.9
Short-term investment - 0.0 - 0.0 - 0.0 - 0.0 - 0.0 - -
Sales tax and excise duty adjustable 1,144 2.2 1,651 4.4 278 0.7 1,002 3.5 803 3.4 970 4.5
Taxation - net 4,900 9.6 1,894 5.0 1,590 4.2 2,747 9.7 2,897 12.2 2,677 12.5
Cash and bank balances 9,189 18.1 8,548 22.6 15,006 40.1 1,841 6.5 1,964 8.2 1,417 6.6
Non-current assets classified as held for sale - - - 0.0 - 0.0 - 0.0 5 -
Total assets 50,910.0 100.0 37,852.0 100.0 37,452.0 100.0 28,354.0 100.0 23,811.0 100.0 21,365.0 100.0
EQUITY AND LIABILITIES
Share capital 823 1.6 823 2.2 823 2.2 823 2.9 823 3.5 823 3.9
Reserves 28,726 56.4 25,394 67.1 23,856 63.7 18,414 64.9 16,822 70.6 14,994 70.2
Total Equity 29,549 58.0 26,217 69.3 24,679 65.9 19,237 67.8 17,645 74.1 15,817 74.0
Deferred taxation - - - - - - - - - - - -
Trade and other payables 11,392 22.4 6,300 16.6 6,443 17.2 4,946 17.4 3,696 15.5 2,695 12.6
Advances 5,332 10.5 1,625 4.3 4,226 11.3 2,159 7.6 629 2.6 1,144 5.4
Accrued mark-up - - - - - - 9 - - - - -
Short-term borrowing - export refinancing - - - - - - - - - - - -
Security deposits 4,601 9.0 3,673 9.7 2,068 5.5 1,917 6.8 1,703 7.2 1,571 7.4
Provision for custom duties and sales tax 36 0.1 36 0.1 36 0.1 86 0.3 138 0.6 138 0.6
Total equity and liabilities 50,910.0 100.0 37,852.0 100.0 37,452.0 100.0 28,354.0 100.0 23,811.0 100.0 21,365.0 100.0
Pak Suzuki Motor Company Limited26

2017 % 2016 % 2015 % 2014 % 2013 % 2012 %
---------------------------------------------------------- Rupees in millions ----------------------------------------------------------
Profit And Loss Account
Sales 101,812 100 76,516 100 84,549 100 53,665 100 51,061 100 58,531 100
Cost of sales (92,159) (90.52) (69,167) (90.40) (73,061) (86.41) (49,481) (92.20) (47,819) (93.65) (56,186) (95.99)
Gross profit/ (loss) 9,653 9.48 7,349 9.60 11,487 13.59 4,184 7.80 3,243 6.35 2,345 4.01
Distribution cost (2,804) (2.75) (2,004) (2.62) (1,946) (2.30) (746) (1.39) (560) (1.10) (358) (0.61)
Administrative expenses (1,600) (1.57) (1,540) (2.01) (1,231) (1.46) (1,102) (2.05) (959) (1.88) (859) (1.47)
Other operating expenses (414) (0.41) (334) (0.44) (653) (0.77) (196) (0.37) (175) (0.34) (111) (0.19)
Other income 865 0.85 1,040 1.36 1,058 1.25 510 0.95 863 1.69 494 0.84
Operating profit/ (loss) 5,699 5.60 4,511 5.90 8,716 10.31 2,650 4.94 2,411 4.72 1,510 2.58
Share of loss of equity accounted investee (12) (0.01) - - - - - - - - - -
Finance cost (68) (0.07) (96) (0.13) (31) (0.04) (27) (0.05) (58) (0.11) (11) (0.02)
Profit /(loss) before taxation 5,619 5.52 4,415 5.77 8,685 10.27 2,623 4.89 2,353 4.61 1,499 2.56
Taxation (1,793) (1.76) (1,643) (2.15) (2,843) (3.36) (702) (1.31) (504) (0.99) (522) (0.89)
Profit /(loss) after taxation 3,826 3.76 2,773 3.62 5,843 6.91 1,922 3.58 1,849 3.62 977 1.67
Vertical Analysis of Profit and Loss Account
Strong yet light, compact outboard motors designed with Suzuki’s exclusive engineering expertise are the right choice for your marine related needs. Suzuki outboard motors offer durable and reliable solutions for security and defense, trade and logistics and gives boating enthusiasts the best technology fitted in high-performance machines.
Suzuki Outboard Motors
Annual Report 2017 27

2017 2016 Rs. in thousand % Rs. in thousand %
Wealth GeneratedTotal gross revenue and other income 126,550,040 94,920,849 Bought in materials and services 98,885,171 73,794,353
27,664,869 100 21,126,496 100
Wealth distribution to stakeholdersTo EmployeesSalaries, wages ,other cost including retirement benefits and WPPF 2,365,398 8.55 2,134,203 10.10
To GovernmentIncome tax, sales tax, excise duty, development surcharge,WWF 20,022,130 72.37 15,203,788 71.97
To SocietyDonation toward earthquake victims, IDPs and health 3,932 0.01 4,057 0.02
To ShareholdersDividend and bonus 452,649 1.64 1,234,498 5.84
To Providers of financeFinance charges for borrowed funds 1,597 0.01 3,194 0.02
To CompanyDepreciation, amortisation and retained profit/ (loss) 4,819,163 17.42 2,546,756 12.05
27,664,869 100.00 21,126,496 100.00
Statement of Value Addition and its Distribution
Pak Suzuki Motor Company Limited28

Wealth distribution to stakeholders-2017 Wealth distribution to stakeholders-2016
Society
Providers of Finance
Shareholders
Company Government
Employees
8.55%
72.37%
0.01% 0.01%
1.64%
17.42%
10.10%
5.84%
71.97%
0.02% 0.02%
12.05%
Mehran EfiNew Passion, New Dynamics,New EnergyMehran EFi is the best choice particularly for people who drive every day since it does not only give better mileage but also keeps the environment green. Its new exterior includes the bold and dynamic headlights with distinguished grille and turn signals. Maintenance is easy and economical.
Annual Report 2017 29

Launching Ceremony of Suzuki GR-150 and GSX 600
Launching Ceremony of Suzuki Mega Carry and Cultus AGS
Products Launching &
ConferencesLaunching Ceremony of Suzuki Cultus
Dealer’s Convention 2017
Pak Suzuki Motor Company Limited30

Inauguration of Dealerships
Suzuki Gwadar Motors Suzuki Gwadar Motors
Suzuki Gwadar Motors Suzuki Gwadar Motors
Suzuki Gwadar Motors Suzuki Gwadar Motors
Suzuki Gwadar Motors Suzuki Gwadar Motors
Suzuki South Punjab
Suzuki Layyah Motors
Suzuki Swabi Motors
Suzuki Highway Motors
Suzuki Moro Motors
Suzuki Talagang Motors
Suzuki Kohat Motors
Suzuki Chunian Motors
Annual Report 2017 31

Visits &
Events
On his outstanding contribution for promoting trade between Pakistan and Japan, Ministry of Foreign Affairs, Japan, awarded “Commendation Award” to Mr. Hirofumi Nagao, Senior Advisory Director of Pak Suzuki.
Tecno Auto Glass Plant Foundation Stone Laying Ceremoney held on October 6, 2017
Pakistan Auto Parts Show 2017 Mr. Muhammad Arshad Khan Laghari, Minister of State for Industries and Production & Member of PM Implementation Cell visited Pak Suzuki on November 1, 2017
Mr. Khizar Hayat Gondal, Federal Secretary for Industries and Productions visited Pak Suzuki
Pak Suzuki Motor Company Limited32
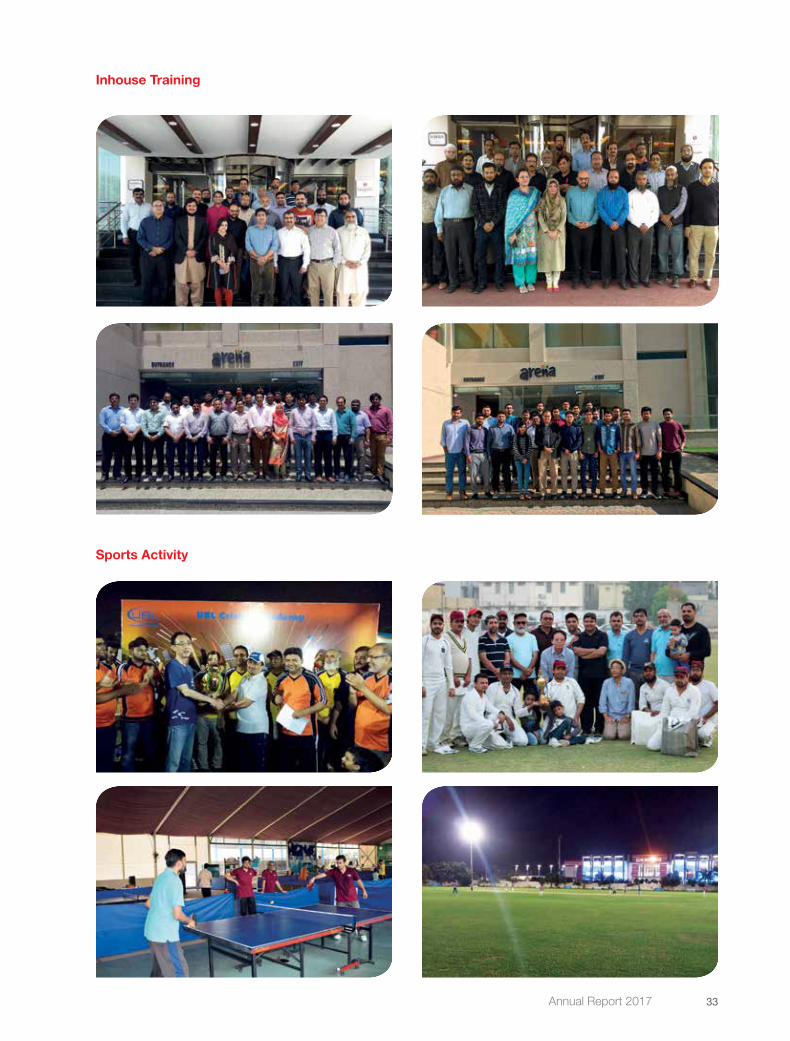
Inhouse Training
Sports Activity
Annual Report 2017 33

It is my privilege to present review on the performance of the Company for the year ended December 31, 2017.
IndustryPakistan auto sales clocked in highest ever sales in calendar year 2017. In year 2017, sales volume of auto industry was recorded at 239,724 units compared to 203,492 units of last year, registering an increase of 18%. Growth in demand was driven by introduction of new models by local Original Equipment Manufacturers (OEMs). Major factors contributing for increase in sales volume of automobiles were improved economic fundamentals and law and order. Stable prices of vehicles and availability of auto financing at lower rates due to low discount rate also contributed in improved sales volumes. The organized market (PAMA member companies) for motorcycles and three wheelers increased by 20.5% from 1,470,604 units to 1,771,618 units.
The Government has announced ‘Automotive Development Policy (ADP) in March 2016 applicable over a medium-term horizon of 2016-2021. ADP envisages development plan for automobile industry to facilitate higher volumes, attract investment and ensure enhanced competition. Objective of policy is to create balance between industrial growth and tariffs to ensure sustainability for all stakeholders. Tariff structure for new entrants and non-operational units is significantly lower than tariff structure for existing OEMs. ADP offered concessional rate of customs duty @ 10% on non- localised parts and @ 25% on localised parts for a period of five years to new entrants and three years for non-operational units as compared to 30% and 45% respectively for existing OEMs. Further, new entrants are also allowed duty-free import of plant and machinery for setting up the manufacturing facility. Incentives offered in ADP encourages new entrants in auto industry and so far green field status (new entrant) has been awarded to six (6) entities and brown field status (revival of non-operational unit) to one (1) entity. Existing OEMs in Pakistan were looking for expansions and expecting similar incentives as offered to potential new entrants. We understand that lack of incentive to existing OEMs will affect the desired objectives of ADP. Besides promoting investment in auto sector from prospective new entrants, Government should also ensure conducive environment for existing OEMs. We strongly demand for similar incentives and operating environment to existing OEMs as being offered to prospective new entrants.
In Federal Budget 2017, the Government announced reduction in corporate tax rate from 31% to 30%. However relief would be offset with continued application of super tax @ 3% extended on taxable income of tax year 2017. It may be noted that Super tax was levied as one time levy in Budget
Chairman’s Review
0
20,000
40,000
60,000
80,000
100,000
120,000
51,0
61
53,6
65
84,5
49
76,5
16 10
1,81
2
Rs. i
n M
illion
Sales Revenue
2013 2014 2015 2016 2017
0
30000
60000
90000
120000
150000
Sales Volume Motorcars
77,0
50
78,0
05
133,
952
110,
000
132,
548
No. o
f Uni
ts
2013 2014 2015 2016 2017
Pak Suzuki Motor Company Limited34
2015 for the rehabilitation of displaced persons. However, it was extended in Federal Budget 2016 & 2017 respectively. We have strong reservations on such ad hoc tax measures, badly affecting the operational framework for organized sector. Further, Government announced 7.5% tax on undistributed profits if the company does not distribute profit as dividend equal to 40% of its after-tax profit. An exemption from this tax by distributing profits as dividend equal to 50% of its paid up capital has been withdrawn. It is additional tax on undistributed profits. Although amendment in Tax law may contribute in additional tax revenue to Government but on other hand, it will affect the beleaguered forex reserves of the Country due to foreign remittance of dividends. At the same time it will also discourage foreign investors to retain profits in Pakistan. Expansion of business operations by utilizing internal resources ensures the competitive edge and continuity of business. Pak Suzuki is notable example that achieved expansion in plant capacity and development of new models through own resources. We strongly appeal to Government of Pakistan to reconsider above adverse tax measures, being counter-productive for business growth and adversely affects the profitability of the Company.
Withholding Tax, under section 231B(3) of Income Tax Ordinance 2001, on locally manufactured vehicles is applicable at the time of invoicing of locally manufactured vehicles. Automobile manufacturers are unnecessary burdened with collection of tax u/s 231(B)(3) with extensive administrative and reporting liabilities. All motor registration authorities are already collecting withholding income tax u/s 231B(1) and u/s 234 from vehicle owners. It is therefore recommended that the withholding tax u/s 231(B)(3) may be collected by motor registration authorities for locally manufactured vehicles as well.
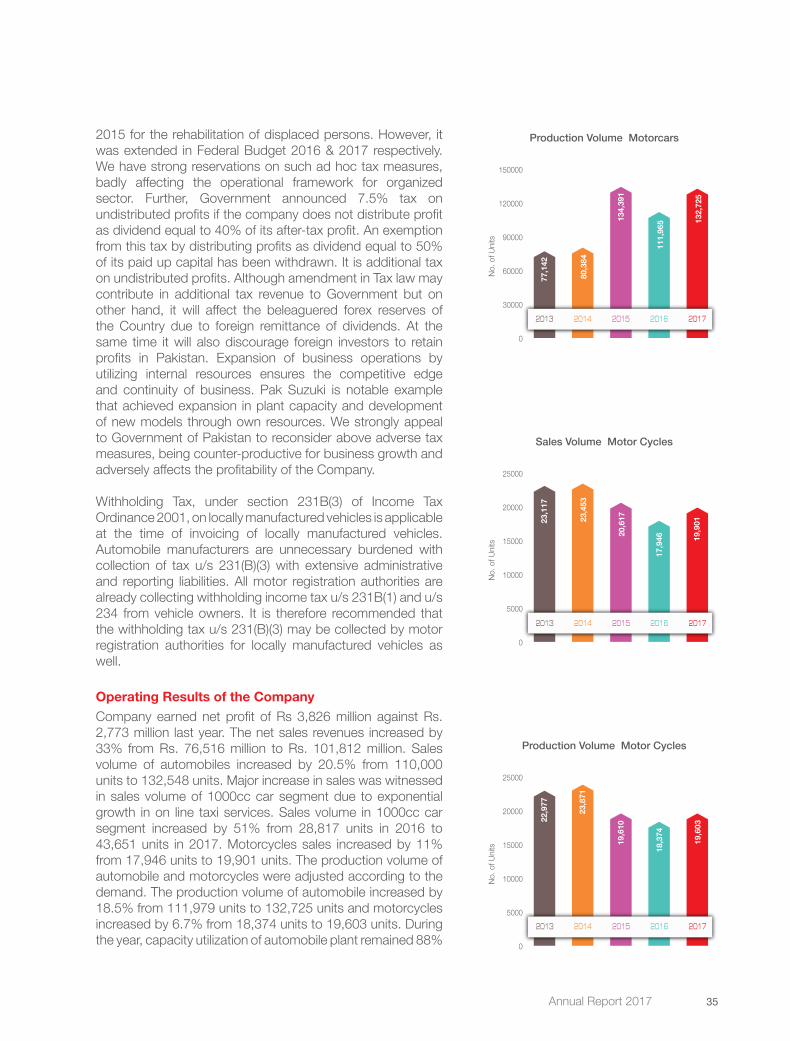
Operating Results of the CompanyCompany earned net profit of Rs 3,826 million against Rs. 2,773 million last year. The net sales revenues increased by 33% from Rs. 76,516 million to Rs. 101,812 million. Sales volume of automobiles increased by 20.5% from 110,000 units to 132,548 units. Major increase in sales was witnessed in sales volume of 1000cc car segment due to exponential growth in on line taxi services. Sales volume in 1000cc car segment increased by 51% from 28,817 units in 2016 to 43,651 units in 2017. Motorcycles sales increased by 11% from 17,946 units to 19,901 units. The production volume of automobile and motorcycles were adjusted according to the demand. The production volume of automobile increased by 18.5% from 111,979 units to 132,725 units and motorcycles increased by 6.7% from 18,374 units to 19,603 units. During the year, capacity utilization of automobile plant remained 88%
0
5000
10000
15000
20000
25000
No. o
f Uni
ts
Sales Volume Motor Cycles
23,1
17
23,4
53
20,6
17
17,9
46
19,9
01
2013 2014 2015 2016 2017
Production Volume Motorcars
0
30000
60000
90000
120000
150000
77,1
42
80,3
84
134,
391
111,
965
132,
725
No. o
f Uni
ts
2013 2014 2015 2016 2017
0
5000
10000
15000
20000
25000
No. o
f Uni
ts
Production Volume Motor Cycles
22,9
77
23,8
71
19,6
10
18,3
74
19,6
03
2013 2014 2015 2016 2017
Annual Report 2017 35

as compared to 75% capacity utilization in last year. Because of lower demand of motorcycles, 55% production capacity of motorcycle plant remained un-utilized. Gross profit increased in absolute terms by Rs. 2,304 million from Rs. 7,349 million to Rs. 9,652 million. Gross profit margins remained consistent at 9.5% as compared to 9.6% of last year. Distribution expenses increased from Rs. 2,004 million to Rs. 2,804 million and as a percentage of sales from 2.6% to 2.8%. Major reasons for increase in distribution expenses were higher ‘Advertising and Sales promotion’ expenses due to launching of new models and increased sales volume resulted in higher transportation charges. Administration expenses increased from Rs. 1,540 million to Rs. 1,600 million and as percentage of sales decreased from 2% to 1.6%. In absolute terms Administration expenses increased by Rs. 60 million that is an increase of 4% from last year. Increase was attributable to higher salaries & wages expense and outsource job contractor charges beside normal impact of inflation which were partly adjusted with the reversal of provision for doubtful debts. Other operating income slightly decreased from Rs. 1,040 million to Rs. 865 million. As per State Bank’s BPRD Circular No. 2 of 2017 dated February 24, 2017, banks have been directed to obtain 100 percent cash margin on import of CBUs, CKDs and automotive components. Application of 100% margin on imports has adversely affected the liquidity position of the Company, consequently decreasing the income on bank deposits. Finance cost decreased from Rs. 96 million to Rs. 68 million. The decrease was due to lower exchange loss as compared to last year. Other operating expenses represent contributions to workers’ profits participation fund and workers’ welfare fund. It increased from Rs. 334 million to Rs. 414 million. The increase was due to higher contributions consequential to increase in profits as compared to last year.
Profit before tax increased in absolute terms by Rs. 1,216 million from Rs. 4,415 million to Rs. 5,619 million and as a percentage of sales declined from 5.8% to 5.5%. Expense for income tax increased from Rs. 1,643 million to Rs. 1,793 million. However, as a percentage of net profit before tax, tax expense decreased from 37.2% to 32%, primarily due to reduction in tax rate by 1%, increased tax rebates due to higher capitalization in plant and machinery in current year and lower super tax as compared to last year. The Company distributed the profits less than 40% for accounting year 2016 and as such tax @ 7.5% on profit before tax was applicable in accordance with amended law of Income Tax. However, Company challenged the tax law in Sindh High Court and awarded interim stay order from the Sindh High Court against the said provision of the law. However, as a matter of prudence, the Company has provided tax provision of Rs. 331 million at the rate of 7.5% on the profit before tax of accounting year 2016.
0
10000
20000
30000
40000
50000
60000
70000Rs
. in
Thou
sand
Export Sales
24,
255
51,
530
64,
783
55,
722 64
,435
2013 2014 2015 2016 2017
0
1500
3000
4500
6000
7500
9000
0
1500
3000
4500
6000
7500
9000
PBT / PAT
Rs. i
n M
illion
2,3
53
2,6
23
8,6
85
4,4
15
5,6
19
2013 2014 2015 2016 2017
1,849 1,922
5,843
2,773
3,826
0
3000
6000
9000
12000
15000
18000
21000
0
3000
6000
9000
12000
15000
18000
21000
Fixed Assets Vs. CAPEX
2013 2014 2015 2016 2017
Rs. i
n M
illion
20,
494
13,
150
15,
187
15,
509
16,
395
1943881 732
3,123 3,519
Pak Suzuki Motor Company Limited36

Marketing & ExportsMarket SharePak Suzuki remains the market leader in locally manufactured cars and light commercial vehicles by retaining 55% market share of the total domestic market. Strengths of Pak Suzuki are quality products, diversified product range and well-organized dealers’ network, spread all over Pakistan ensuring availability of spare parts at economical prices and reliable after-sales service.
New Model IntroductionThe Company is endeavoring to improve sales, profitability and diversity in its operations by upgrading the existing products and launching new products. Pak Suzuki launched its new 1400cc sedan ‘Suzuki Ciaz’ on February 8, 2017. Ciaz was well accepted by customers due to its drive, sporty design, refined interior, spacious cabin and advanced safety features.
Suzuki Wagon R is preforming exceptionally well in 1000cc hatchback segment. With the launch of new Suzuki Cultus, Company has further strengthened its position in this segment. The Company launched new Suzuki Cultus on April 22, 2017. The new Suzuki Cultus introduced with power-packed features like ABS brakes, airbags, electronic power steering, electric windows and electrically adjustable side view mirrors. Its modern 3-cylinder 1000cc k-series engine ensures great fuel efficiency and is designed to provide an extraordinary driving pleasure. AGS variant of Cultus was also introduced on December 04, 2017. It is equipped with Auto Gear Shift (AGS); having dual gear shifting system i.e. Automatic and Manual with pedal shifting; makes the drive absolutely effortless.
Suzuki Mega Carry (CBU) was introduced on December 04, 2017. It has a great weight capacity with 3 sides open deck. It is ideal choice for modern day requirements of light commercial and fleet businesses and meets the diverse needs of its customers.
The new models were well accepted by customers. We expect that launching of new models with advance features will attract the customers and the demand for new models will further increase.
Dealership NetworkPak Suzuki intends to provide quality services with convenient access to customers. The Company has strong dealership network spread all over the country. The Company has been continuously enhancing and strengthening the dealership network. As of December 31, 2017, Pak Suzuki dealership network expanded to 111 outlets in 54 cities all across
0
6000
12000
18000
24000
30000
36000
Duties & Taxes
2013 2014 2015 2016 2017
Rs. i
n M
illion
15,3
80
17,4
42
26,4
22
24,4
48
35,1
62
0
9000
18000
27000
36000
45000
Foreign Exchange Savings
2013 2014 2015 2016 2017
27
,275
25,0
67
39,6
88
36,4
57 43,
182
Rs. i
n M
illion
0
100
200
300
400
500
600
700
0
100
200
300
400
500
600
700
Share Price Vs. Breakup Value
2013 2014 2015 2016 2017
Rs.
154
371
495
613
498
214 234
300 319359
Annual Report 2017 37
Pakistan where customers are offered wide range of products and support services. The dealerships are classified as Mega, Mini and Micro types depending on the magnitude of business in the area.
Introduction of Company Operated Booking Offices The Company initiated the practice of receiving booking of vehicles on partial payment. Further to facilitate the customers, Pak Suzuki opened booking offices at Karachi, Lahore, Islamabad, Rawalpindi, Multan, Faisalabad, Sialkot and Peshawar. Suzuki Booking Offices facilitate customers by giving them the opportunity of booking vehicles with the initial advance part payment. This move has been widely appreciated by customers.
ExportDuring the year 33 units amounting Rs. 46 million were exported against 97 units, worth Rs. 54 million exported in last year. The Company achieved yet another milestone for being first in the history of automobile industry of Pakistan to commence locally manufactured Knock Down (KD) parts’ export operations in January, 2017 to its sister concern Vietnam Suzuki Corporation (VISUCO) for mass production of Suzuki mini-truck model. During the year, KD parts worth Rs. 13 million were exported to Vietnam.
Motorcycle MarketMotorcycle market in Pakistan is dominated by motorcycle with engine capacity of 70cc. Pak Suzuki markets motorcycles with engine capacities of 110cc and above. The Company expects that motorcycle demand in Pakistan will gradually shift towards higher engine capacity like other countries in the region and market for Suzuki motorcycles will improve. Company is trying to expand its business in this segment. During the year Company introduced Suzuki GR150 motorcycle on December 04, 2017. Its aero-dynamic and sleek design accentuates the ride while the powerful suspension and tough frame provide a thrilling ride.
AFTERSALES (PARTS & SERVICE)
Aftersales operations ensures efficient services to customers through smooth workshop operations and timely availability of parts at dealerships. As a result, the dealers’ operations showing increasing trend. Total number of automobile Job cards (services provided to customers for schedule maintenance, running repairs, mechanical repairs, body and dent jobs) reached up to 1.12 million numbers showing
growth of 16 % as compared to last year. The motorcycle aftersales market also shown positive trend in business operations, total 224,000 Job cards were served in 2017 which shows growth of 15% compared to last year.
The Automobile Parts sales for the year recorded Rs 2,322 million, showing overall growth of 8% as compared to last year. Average monthly sales for SGO reached up to 139,000 liters, which shows growth of 22% as compared to last year. The motorcycle parts sale also reached to Rs. 184 million showing growth of 12% compared to last year.
Our customers have shown the satisfaction on the services rendered to them through dealers’ network which enhanced the customers satisfaction level to 88% through 98,045 follow-ups carried out on regular basis by our 24/7 Customer Relations Centre.
NEW INITIATIVES
Network Expansion• To increase customer coverage the numbers of
workshops reached up to 111 to provide quality service to our valued customers in 54 cities Nationwide.
• 1S Parts outlets concept introduced to facilitate our customers, by providing Suzuki Genuine Parts in uncovered areas by starting SGP sales from 6 parts outlets.
Customer Satisfaction & Retention• To facilitate customers, First Free Inspection
(FFI), Second Free Inspection (SFI) coupons discontinued, so that customer can avail FFI, SFI services without coupons from all over Suzuki network.
• Apart from the regular services to the customers, we never let them feel alone even after office hours and boost their confidence level to drive tension free through providing Roadside Assistance services by our well-trained technicians and equipped mobile vans round the clock through dealership network and has rendered 2,261 services during the year.
• Significant activities were conducted to enhance customer’s satisfaction & retention activities such as increasing numbers of loyal customers, retail focus activity, campaigns, customer meet, customer feedback, and product surveys.
• Suzuki Integrated FTIR Tracking System is globally used for quality improvement of CBU vehicles or
Pak Suzuki Motor Company Limited38

locally produced vehicles. Pak Suzuki also started this system to interconnect with other countries Quality Division for improvement.
• Our Spare Parts Department ensured timely serving of parts to the customers by achieving 97% service ratio (order received and delivered) and achieved “A” rank according to SMC global standard for serving customers.
• To optimize customer’s convenience the range of accessories items and packages increased.
Extension of Warranty Limitations (Automobile & Motorcycle)• Warranty Terms & Conditions Extended up to
03 Years & 60,000 Kms for newly introduced Automobiles models (passenger vehicles) in Year 2017.
• Special 03 Years Engine Warranty up to 20,000 kms given for newly introduced GR-150 motorcycle.
Dealer Staff Skill Development & Motivation• Introduction of Suzuki Service Qualification
System for Technicians to provide quality services to customers on Global Standards.
• The total 439 regular trainings and 500 on job training sessions were conducted for dealers’ staff, total 7642 participants attended these sessions.
• To keep motivation and competition sprit in dealer staff, seven “Skill Contests” for dealers’ Service Managers, Parts Managers, Customer Relation Managers, Customer Relation Officers, Service Advisors, Technicians & Painters.
• The company also contributed in dealers’ staff motivational activities such as, employee get together, recreation activities and incentive cash awards and foreign trips.
LOCALIZATION
Pak Suzuki is proud to be the pioneer in the development of auto parts industry. The Company has been striving for localization of components through vendors’ network and in-house manufacturing of components. The Company also contributes in the socio-economic development of the country by creating job opportunities and technology transfer to vending industry. The Company continues to pursue localization in order to reduce the cost of products and keep the prices competitive besides saving of foreign exchange. It is essential for the local auto parts
industry to upgrade their production facilities with latest technology. Pak Suzuki has been coordinating Technical Collaborations for its vendors to align them with latest technologies. Recently, Pak Suzuki arranged several ‘Technical Assistance Agreements’ for local vendors with reputable international parts manufacturer. Further, Company took initiative and made a strategy to enter into Joint Venture agreement with vendors to provide confidence to Technical Assistance provider. A Joint Venture agreement with Tecno Pack Telecom (Private) Limited for manufacturing automobile glass is the first step in this direction. The technology for setting up the project has been acquired from Asahi India Solutions Ltd (AIS), who is the leading auto glass producers in India. Shareholders had approved the equity investment up to Rs 344.4 million in Extraordinary General Meeting of the Company held on February 16, 2017 and by December 31, 2017, Company had contributed Rs 220 million. TAG is planned to commence commercial production by mid of 2019. This Joint Venture is a first green field project between Pak Suzuki & its vendor. Beside technology transfer and localization of glass for auto industry, the project will contribute significant cost saving to Company and earn reasonable returns on the investment.
FACILITY ENHANCEMENTS
• The company developed an infrastructure at DSU-13A to keep 3000 plus finished products to facilitate the customer for an early delivery of vehicle. The facility was inaugurated on November 10, 2017.
• The Company provides healthy and comfortable working environment to its employees. Therefore, environmental improvement activities have been carried out throughout the Plant by providing Chiller units with Fan Coil Units and plant roof insulations to reduce the hot weather impact at shop floor.
• In order to enhance company business, and deliver Spare Parts within 2 days, new state of art column less 5400 square meter Parts Warehouse has been constructed.
HUMAN RESOURCE
At Pak Suzuki, employees are not only part of the Suzuki Family but are also considered the back bone of the Company’s efforts in achieving and maintaining highest standards of productivity, work ethics and conducive environment.
Annual Report 2017 39

We at Pak Suzuki are committed to provide an environment which facilitates the employees in performing to their maximum potential while maintaining required amount of work life balance. At the same time, it is also ensured that with the passage of time the employees get substantial amount of opportunities to develop themselves in terms of skills through specially designed programs for training and development. All measures are taken for the betterment and wellbeing of the employees and special activities are carried out to keep up the motivation level.
We take care and ensure provision of all facilities to the employees. Installation of vending machines and ATM machines are such steps that the Company continues to take by understanding the needs of its each and every member.
Training and DevelopmentPak Suzuki Motor Company strives to provide its employees with inspiring training and education experiences that broaden and enhance skills and uncover new concepts and ideas. Talent development takes many forms at Pak Suzuki Motor Company, including training sessions for key functional areas.
Talent AcquisitionThe Company has undertaken several campus recruitments drives at leading graduate educational institutions for Management Trainee and Trainee Engineers. Our aim is to reach out to the best talent available and be easily accessible to them. For this purpose, an HR portal has been developed and can be accessed at www.paksuzuki.com.pk where the candidates can register themselves online, upload their CVs and have a fair chance of selection.
Health and SafetyThe health and work place protection are the most vital areas to be considered for each member of the Suzuki Family regardless of being part of management, officer or worker cadre. We strive to ensure the health and safety of our Suzuki family members in the following ways:
• Compliance with all applicable Government and internal health, safety and environmental requirements;
• Design facilities and conduct operations in a way that avoids risk to human health, safety and the environment;
• Examine and communicate the known hazards of operations with relevant health safety and environmental protection information to potentially affected persons.
24-hour availability of dispensary facility fully equipped along with able team of doctors is always ready to provide medical care to the employees. Furthermore, considering our duty to protect and ensure maintenance of health of all Pak Suzuki family members, a yearly medical screening is conducted for all employees to make sure that they are fully aware of their health conditions and to protect them from any contagious diseases.
Sports Events Every year, the Company arranges sport tournaments for recreation & entertainment of employees and to provide an environment where all employees can enjoy without any stress and job pressure. During the year, we arranged inter-departmental Cricket tournaments & Indoor games. These events provide an excellent opportunity for the staff and the management to interact with each other and go a long way in instilling the spirit of competition among them in a healthy environment so that they can realize their true potential in work as well as life in general. The winners & runner up teams are presented with Shields, along with player of the final awards.
Cultural and Religious EventsPak Suzuki ever conscious of the cultural and religious priorities of its employees encourages them by arranging events where employees can give expression to their preferences in this regard also. This year Milad was arranged in the month of January 2017 with full participation of all employees which was attended with utmost religious fervor and enthusiasm giving them an opportunity to interact with each other beyond the scope of routine work and related stress. Popular Naat Khawans and renowned scholars of the country were invited to participate in this event. Sweets were also distributed in the end among the attendants.
Labor and Management RelationsAt Pak Suzuki, strong and cordial relations between labor and management are key for a conducive environment essential for moving towards and achieving desired goals. The Management through its able representation takes all measures to convey a strong message to the workers that they are assured of a healthy conducive and fair work environment.
Pak Suzuki Motor Company Limited40

ECONOMIC CONTRIBUTION
The Company has a distinctive position in the automobile industry as a leading contributor to the public exchequer. The duties and taxes paid and the foreign exchange saved by the Company in its last six years of operations are as follows:
Year(Jan-Dec)
Duties &taxes
(Rupees in million)
ForeignexchangeSavings *
(Rupees in million)
2012 17,302 31,0542013 15,380 27,2752014 17,442 25,0672015 26,422 39,6882016 24,448 36,4572017 35,162 43,182
Duties and taxes paid by Company during the year represent 0.82% of total tax revenues estimated in the Federal Budget for the fiscal year 2017-18. *Converted into Pak Rupees at year end exchange rate.
FUTURE OUTLOOK & CONCLUSION
Macroeconomic indicators of the country are positive yet challenging for auto industry. GDP growth rate has been targeted at 6% for financial year 2017-18. In 2017, performance of manufacturing sector was encouraging, inflation was in control, improved law and order situation and energy availability contributed in improved economic growth. However, apprehensions of Pak Rupee devaluation, rising raw material prices, expected hike in interest rate, political instability, threat of new entrants and sharp increase in imported
used vehicles are major challenges for auto industry in future. Although, significant variation in auto financing rates is not expected but Pak Rupee devaluation and rising raw material prices will affect the cost of production. Due to high element of imported components in total cost of products, forex rates play an important role in pricing of products. Pak Rupee to US Dollar parity remained stable in 2017. The stable
Pak Rupee against Japanese Yen and US Dollar is crucial for stable prices of vehicles.
The import of used vehicles in big number is hindering the growth of industry. Despite the restriction on age limit of imported used vehicles for 3 years, 77,972 units of used vehicles were imported during the year as compared to 47,766 units of last year. Government has imposed a condition to show proof that the remittance for payment of duties and taxes originates from the bank account of Pakistani national sending the vehicle from abroad. However, the notification was withdrawn in February 2018, within four months from its issuance. We understand that the proposed procedural changes were directed to regularize the import of used cars but withdrawn on the lobbying of used cars importers.
Improved macroeconomic indicators, law and order situation, stable Pak Rupee and low interest rate provided the momentum to auto industry. Stability in selling prices of vehicles and introduction of new models in market also contributed in steady demand for automobiles. We expect that launching of new models will attract the customers and they will shift their preferences to new models. Development activities related to CPEC expected to contribute in industrial growth and improved infrastructure in country. Your Company has geared up to meet the challenges in future with wide quality product range at competitive prices through an efficient network of authorized dealers. Consistent Government policies with long term vision are vital for the growth of auto industry.
In conclusion, I on behalf of the Board and shareholders would like to express my appreciation to the management, executives, workers, dealers, vendors and Suzuki experts for their efforts and contribution to the affairs of the Company. My sincere gratitude also goes out to all the government departments for their continued support and encouragement.
KINJI SAITOChairman
Karachi. March 19, 2018.
Annual Report 2017 41

Exchange Rates Movement
Yen - Rs. Parity
0.000.150.300.450.600.750.901.051.201.351.50
Dec-
17
Nov-
17
Oct
-17
Sep-
17
Aug-
17
Jul-1
7
Jun-
17
May
-17
Apr-1
7
Mar
-17
Feb-
17
Jan-
17
Dec-
16
Nov-
16
Oct
-16
Sep-
16
Aug-
16
Jul-1
6
Jun-
16
May
-16
Apr-1
6
Mar
-16
Feb-
16
Jan-
160.
879
0.92
2
0.93
3
0.97
5
0.94
2
1.01
9
1.00
9
1.01
8
1.03
2
0.99
7
0.92
9
0.89
8
0.92
5
0.92
9
0.93
5
0.94
2
0.94
4
0.93
7
0.95
4
0.95
4
0.93
7
0.93
3
0.94
7
0.98
0
Yen
to R
s.
USD - Rs. Parity
56
66
76
86
96
106
116
Dec-
17
Nov-
17
Oct
-17
Sep-
17
Aug-
17
Jul-1
7
Jun-
17
May
-17
Apr-1
7
Mar
-17
Feb-
17
Jan-
17
Dec-
16
Nov-
16
Oct
-16
Sep-
16
Aug-
16
Jul-1
6
Jun-
16
May
-16
Apr-1
6
Mar
-16
Feb-
16
Jan-
16
104.
90
104.
60
104.
65
104.
70
104.
90
104.
80
105.
50
105.
40
105.
45
105.
55
105.
60 110.
50
104.
90
104.
40
104.
80
104.
60
104.
90
104.
70
104.
60
104.
85
104.
75
104.
50
104.
60
104.
80
USD
to R
s.
EURO - Rs. Parity
75
85
95
105
115
125
135
145
155De
c-17
Nov-
17
Oct
-17
Sep-
17
Aug-
17
Jul-1
7
Jun-
17
May
-17
Apr-1
7
Mar
-17
Feb-
17
Jan-
17
Dec-
16
Nov-
16
Oct
-16
Sep-
16
Aug-
16
Jul-1
6
Jun-
16
May
-16
Apr-1
6
Mar
-16
Feb-
16
Jan-
16
112.
26
110.
75
111.
94
113.
78
117.
23
119.
91
123.
79
125.
21
124.
27
122.
59
125.
93
131.
79
114.
82
114.
05
118.
58
119.
09
116.
89
116.
31
115.
97
116.
96
117.
49
114.
63
111.
21
110.
32
EURO
to R
s.
Pak Suzuki Motor Company Limited42

Presenting the New WagonR, the last word in practicality. The very first time for a car to have the K-series engine in Pakistan. K-series brings with it unprecedented fuel efficiency and a drive that is smooth, noiseless and powerful. With a car as fuel efficient as the new WagonR, there will be no reason to stop driving.
Annual Report 2017 43

The Directors of the Company are pleased to submit their report together with audited financial statements and Auditors’ Report thereon, for the year ended December 31, 2017..
Accounts
(Rs in 000)Profit before taxation 5,619,214Taxation (1,793,393)Profit after taxation 3,825,821Retained earnings of prior years 1,965Net Profit available for appropriation 3,827,786
Less: AppropriationsTransfer to General Reserve 2,295,000 Proposed Cash Dividend 18.60@ 186% 1,530,777
3,825,777 Retained earning carried forward 2,009 Earnings per shareThe earnings per share for the year were Rs. 46.49.
Holding companySuzuki Motor Corporation, incorporated in Japan, is the holding company of Pak Suzuki Motor Company Limited with 73% shares.
Chairman’s ReviewThe Chairman’s review on page 34 to 41 deals with the year’s activities and the directors of the Company endorse contents of the same.
Corporate governanceThe management of the Company is committed to good corporate governance and complying with the best practices. As required under Code of Corporate Governance, Directors are pleased to state as follows:-
• The financial statements, prepared by the management of the Company, present fairly its state of affairs, the result of its operations, cash flows and changes in equity.
• Proper books of accounts have been maintained by the Company.
• Appropriate accounting policies have been consistently applied in preparation of financial statements and accounting estimates are based on reasonable and prudent judgment.
• International Financial Reporting Standards, as applicable in Pakistan, have been followed in preparation of financial statements.
Directors’ Report
Pak Suzuki Motor Company Limited44

• The system of internal controls is sound in design and has been effectively implemented and monitored.
• There are no doubts upon the Company’s ability to continue as a going concern.
• Appropriate whistleblower protection mechanism is in place.
• Company places priority to safety and health of its employees. Provide proper medical cover and carry out periodical medical screening of employees.
• There has been no material departure from the best practices of corporate governance, as detailed in the listing regulations.
Key operating and financial dataThe key operation and financial data of the Company for six years are summarized on page No. 22.
Government taxesOutstanding taxes and levies have been explained in note 21 to the annexed audited financial statements.
Investments of employees’ retirement fundsThe following were the values of investments held by employees’ retirement benefits fund at the year-end:
Dec 17 Dec 16Provident Fund 757.220 million 732.012 millionGratuity Fund 452.257 million 421.172 million
Board of Directors meetingsDuring the year six (6) meetings of the Board of Directors were held. Attendance of each Director was as follows:
No of meetings attendedMr. Kinji Saito 5Mr. Masafumi Harano / Mr. Tetsuya Fujioka 6Mr. Hirofumi Nagao 5Mr. Toshihiro Suzuki 6Mr. Minoru Amano / Mr. Shigeo Takezawa 5Mr. Kazuyuki Yamashita 6Mr. Shahid Ghaffar / Mr. Moin M. Fudda 5
Leave of absence was granted to directors who could not attend Board meetings.
Audit Committee meetingsDuring the year four (4) meetings of the Audit Committee were held. Attendance of each Director is as follows:
No of meetings attendedMr. Shahid Ghaffar / Mr. Moin M. Fudda 3 Mr. Kinji Saito 4Mr. Minoru Amano / Mr. Shigeo Takezawa 4
Annual Report 2017 45

Human Resource & Remuneration Committee meetingsDuring the year one (1) meetings of the Human Resource & Remuneration Committee were held. Attendance of each Director is as follows:
No of meetings attendedMr. Kinji Saito 1 Mr. Masafumi Harano 1Mr. Mr. Shigeo Takezawa 1
Directors’ training programAll the directors on the Board are fully conversant with their duties and responsibilities as directors of corporate bodies. In accordance with the criteria specified in clause (xi) of the Code, three directors of the Company have certification under Directors Training Program and two directors of the Company have the exemption from the requirement of Directors’ Training Program.
Pattern of shareholdingsThe pattern of shareholdings as of December 31, 2017 is given on pages 112 to 115.
Trading in shares of the company by directors and executivesDirectors, executives and their spouses and minor children have not carried out trading in shares of Company except 500 shares of the Company were purchased by a director, Mr. Moin Fudda. Details of transaction was duly communicated to Stock Exchange on receiving the information from director.
Appointment of AuditorsThe present Auditors M/s. KPMG Taseer Hadi & Co., Chartered Accountants, retire and offer themselves for re-appointment. The Audit Committee has recommended for their re-appointment for the year ending December 31, 2018. The Directors endorse recommendation of Audit Committee.
Changes in Board, Audit Committee and Human Resource & Remuneration CommitteeOn May 19, 2017, Mr. Moin M. Fudda was appointed on the Board and member and Chairman of Audit Committee in place of Mr. Shahid Ghaffar who had resigned as member and Chairman Audit Committee.
Following changes took place in Board, Audit Committee and Human Resource and Remuneration (HR&R) Committee on July 10, 2017:1. Mr. Hirofumi Nagao resigned as Chief Executive Officer of the Company and member of HR&R committee,
however, he continues to be a Director on the Board;2. Mr. Tetsuya Fujioka resigned as member of Board;3. Mr. Masafumi Harano was appointed as members of the Board in place of Mr. Tetsuya Fujioka and Chief
Executive Officer and member of HR&R committee in place of Mr. Hirofumi Nagao; &4. Mr. Shigeo Takezawa was appointed as members of the Board, Audit Committee & HR&R committee in
place of Mr. Minoru Amano who had resigned.
Mr. Yosuke Yamada resigned as CFO w.e.f. August 29, 2017. In his place Mr. Miki Nakahara was appointed as CFO.
Pak Suzuki Motor Company Limited46

As at December 31, 2017 the Board comprised of the following directors who retired on completion of their term on 6th February 2018:-1. Mr. Kinji Saito 2. Mr. Masafumi Harano 3. Mr. Hirofumi Nagao4. Mr. Toshihiro Suzuki 5. Mr. Shigeo Takezawa6. Mr. Kazuyuki Yamashita7. Mr. Moin M. Fudda
Subsequent to the year end, the elections of Board were held on February 2, 2018 and following persons were elected as directors of the Company for the period of three (3) years with effect from February 7, 2018:1. Mr. Kinji Saito Non-Executive Director2. Mr. Masafumi Harano Executive Director3. Mr. Hirofumi Nagao Executive Director4. Mr. Shigeo Takezawa Non-Executive Director5. Mr. Kazuyuki Yamashita Non-Executive Director6. Mr. Moin M. Fudda Independent Director7. Mrs. Rukhsana Shah Independent Director
Mr. Kinji Saito and Mr. Masafumi Harano have been re-elected as Chairman of the board and Chief Executive respectively. Consequently, HR&R and Audit Committees have been reorganized and Board nominated the following directors as members of HR&R & Audit Committees:
Audit Committee: Human Resource and Remuneration Committee1. Mr. Moin M. Fudda; 1. Mrs. Rukhsana Shah;2. Mr. Kinji Saito; & 2. Mr. Kinji Saito; &3. Mr. Shigeo Takezawa 3. Mr. Masafumi Harano.
Further, Mr. Moin M. Fudda has been nominated as Chairman of Audit Committee and Mrs. Rukhsana Shah as Chairman of Human Resource and Remuneration Committee.
It may be noted that in the election of directors in February 2018, requirements of Code of Corporate Governance 2017 have been duly complied with, i.e., 2 independent directors including a female has been elected on the Board.
Corporate Social Responsibility (CSR)Pak Suzuki, acting as a responsible corporate organization; is committed to well-being of the society through its contribution in the field of education, health, promoting environmental care in particular and to improve quality of life of underprivileged people as a whole.
Annual Report 2017 47

Education & Technical Support ProgramVTI TrainingsThe Company has been supporting Vocational Training Institutes in different regions and cities of Pakistan by upgrading their workshops and training facilities with parts, tools and equipment both for 4 wheeler and 2 wheeler facilities. Pak Suzuki conducted training program for VTI’s Motorcycle trade students & teachers in different regions and cities in 2017. The purpose was to enhance the confidence level of VTI’s students regarding Suzuki and give the technical knowledge about Suzuki brand. Total 995 participants were given trainings and 25 trainings sessions were conducted from January to December 2017.
Scholarship for NED studentsNED University of Engineering and Technology is one of the most reputable institution of Pakistan, serving the nation since 1922. The company is committed to support higher education in Pakistan in order to contribute in the economic and socio development of the nation. Continuing the Education Support Program under CSR, total 26 scholarships were awarded among students of NED University of Engineering & Technology on 30th August, 2017, 11 awardees of Batch-2014 have become engineer in 2017, under Pak Suzuki NED Scholarship program.
Lower Secondary Scholarship ProgramThe Company started Lower Secondary Scholarship Program in 2017 to extend the support to local community. The Idea is to motivate and encourage the needy and talented students to keep continue their education, which empower them to achieve their dreams and lead to become a successful person and productive citizen for country. First Scholarship awarding ceremony held on 21st December, 2017, Company announced 50 scholarships for Grade 6 students, selected from six Government Schools.
Two Suzuki Ravi Pick-ups donation to Karachi Vocational Training Centre (KVTC)The Company donated two Suzuki Ravi pick-ups to Karachi Vocational Training Centre (KVTC) on 25th October, 2017, so that Centre would cater the need of transportation of Intellectually Disabled students. Karachi Vocational Training Centre (KVTC) is actively playing a vital role in rehabilitation of Intellectually Disabled persons and persons with Learning Difficulties due to Mental Retardation, of age 5 and above through functional academics, vocational and technical trainings as well as therapeutic treatment. It is the first rehabilitation centre of its kind for the intellectually disabled persons in Pakistan.
Pak Suzuki Motor Company Limited48

Used Machines donation to Pak Swiss Training Centre (PSTC)The Company donated 14 Used Machines (Lathe, Drill, Milling, Boring, Spot Welding & CO2 Welding Machines) to Pak Swiss Training Centre (PSTC) on 6th December, 2017. These machines, after overhauling by PSTC will be used for the training and providing hand on experience to the students.
PSTC came into existence in 1965 in collaboration with SWISSCONTACT Government of Switzerland and PCSIR Government of Pakistan, since then PSTC has been actively playing a vital role in producing skilled manpower by providing education, technical skills and hand on experience to the students. PSTC offers Degree programs, Diploma Associate Engineering and Short Professional Courses in different fields of Technologies.
Tools & Equipment Boards donation to Technical Education & Vocational Training Authority (TEVTA)The Company donated Motorcycle trade Tools and Equipment Boards to Government Technical Education & Vocational Training Authority (TEVTA), Central Jail Bahawalpur Punjab for developing technical skills, enhancing capabilities and to promote vocational training among youngsters present in Jail, ceremony held on 27th December, 2017 in Bahawalpur. TEVTA is a leading partner in the development of the Punjab by empowering youth through technical education and vocational trainings by running more than 100 institutions to enhance technical knowledge and skills through standardized, dynamic and integrated education and training services, at free of cost.
Environment
PlantationPlantation Maintenance activity was completed on 19th April, 2017. Spike fencing, sand and fertilizer filling was done for around 1,000 cono carpus trees and some coconut trees, especially trees planted in close proximity of Pak Suzuki plant.
In addition to Plantation Maintenance activity, another Plantation activity was completed in September, 2017 in Government Boys & Girls Higher Secondary School Haji Natho for enhancing the beautification of school and make the environment cleaner and healthier. The Plantation project consist of planting 150 trees, inside and outside school; also grass lawns have been made at several locations.
Health, Safety & Environment (HSE) Awareness Session:Health, Safety & Environment (HSE) Awareness Session conducted on 21st July, 2017 for company employee’s children / brothers and sisters; in which importance of safety & security, environmental issues and tips to stay healthy were highlighted. Total 22 participants attended the awareness session.
Annual Report 2017 49

Community Health
Blood Donation Camp:Blood Donation Camp was organized in the company on 27th March, 2017 in collaboration with Indus Hospital. The Indus Hospital Blood Center is the first centralized regional blood center of Pakistan with a vision to provide safest possible blood and bi-product by meeting international standards, to all segments of the society without discrimination. Total 178 donors donated their blood voluntarily. Out of 178 donors, 75 donors were from our nearby vendors and showrooms.
Suzuki Bolan van donation to Indus HospitalThe company donated a Suzuki Bolan Van on 11th August, 2017 to Indus Hospital. Since 2007, Indus Hospital has been playing a vital role in providing free of cost health care services, medical treatments, surgical procedures and having 150 beds specialized consultancy care, etc.
Quality, Environment, Health & Safety Management SystemsConsistent quality of products is prime objective of the Company. We are committed to continually promote a “Quality, Health & Safety and Environment (QHSE) Culture”. The Company, at regular intervals reviews its QHSE framework and if needed takes concrete steps to improve the system performance.
Quality Management System (QMS)Quality Management System (ISO 9001:2008) is in place in Company and is audited at regular intervals for compliance. The system is a major tool to improve productivity and quality of our products so as to avoid warranty cost & rework. QMS ensured to provide quality products at competitive price to the satisfaction and requirement of our customers.
Environmental Management System (EMS):As our commitment to Corporate Citizenship we endeavor to improve Environment. (ISO 14001:2004) is in place and is a key factor in operations of the Company. Company continuously monitor the waste generated from its activities and wherever required, installed Environmental Control Equipment and facilities like waste water treatment plant. Company provides clean drinking water (tested by approved and certified laboratories) to all of its employees. The Company is complying with applicable regulatory requirement and ensures its effectiveness against National Environment Quality Standard by conducting testing of effluents, emissions, etc through renowned testing laboratories. Hazardous Waste is properly disposed of as per EPA requirement.
Occupational Health and Safety Management System (OHSAS):The Company is committed to provide a system that helps in eliminating unsafe & unhealthy work conditions. Hazard identifications and risk assessment are being performed, reviewed and all necessary preventive measures are taken to minimize the accidents. Emergency preparedness and response procedures and plans are established to deal with accidents and emergencies. Exercises are periodically carried out in order to check
Pak Suzuki Motor Company Limited50

the effectiveness of these plans. Responsibilities and authorities in emergency situation are clearly identified in the procedures.
To improve safety measures on continual basis in each area, the Company identifies and analyzes potential risks (danger/hazards) related to work and equipment, and decides measures to be taken by implementing Hiyari Hatto (near miss and narrow escape) activity, an effective Japanese Technique.
BY ORDER OF THE BOARD
MASAFUMI HARANO Chief Executive KarachiMarch 19, 2018
KINJI SAITOChairman
Annual Report 2017 51

This statement is being presented to comply with the Code of Corporate Governance (CCG) contained in Clause 5.19.24 of Pakistan Stock Exchange Regulations for the purpose of establishing a framework of good governance, whereby a listed company is managed in compliance with the best practices of corporate governance.
The Company has applied the principles contained in the CCG in the following manner:
1. The Company encourages representation of independent non-executive directors and directors representing minority interests on its board of directors (the Board). As at December 31, 2017 the Board comprised of the following:
Category NamesIndependent Directors Mr. Moin M FuddaExecutive Directors Mr. Masafumi Harano
Mr. Hirofumi NagaoNon-Executive Directors Mr. Kinji Saito
Mr. Toshihiro SuzukiMr. Shigeo TakezawaMr. Kazuyuki Yamashita
The independent directors meet the criteria of independence under clause 5.19.1(b) of the CCG.
2. The directors have confirmed that none of them is serving as a director on more than seven listed companies, including Pak Suzuki (excluding the listed subsidiaries of listed holding companies where applicable).
3. All the resident directors of the Company are registered as taxpayers and none of them has defaulted in payment of any loan to a banking company, a DFI or an NBFI or, being a member of a stock exchange, has been declared as a defaulter by that stock exchange.
4. During the year three casual vacancies occurred in the Board due to the resignations which were filled by the continuing directors within 90 day.
5. The Company has prepared a “Code of Conduct”
and has appropriately disseminated it along with its supporting policies and procedures.
6. The Board has developed a vision/mission statement, overall corporate strategy and significant policies of the Company. A complete record of particulars of significant policies along with the dates on which they were approved or amended has been maintained. A mechanism is in place for annual evaluation of the Board’s own performance
7. All the powers of the Board have been duly exercised and decisions on material transactions, including appointment and determination of remuneration and terms and conditions of employment of the CEO and other executive directors have been taken by the Board.
8. The meetings of the Board were presided over by the Chairman, and in his absence, by a director elected by the board for this purpose and the board met at least once in every quarter. Written notices of the board meetings, along with agenda and working papers, were circulated at least seven days before the meetings. The minutes of the meetings were appropriately recorded and circulated.
9. All the directors on the Board are fully conversant with their duties and responsibilities as directors of corporate bodies. In accordance with the criteria specified in clause (xi) of the Code, three directors of the Company have certification under Directors Training Program, two directors of the Company have the exemption from the requirement of Directors’ Training Program.
10. The board has approved appointments of CFO, Company Secretary and Head of Internal Audit, including their remunerations and terms and conditions of the employment as recommended by Human Resource and Remuneration Committee.
11. The Company has complied with all the corporate and financial reporting requirements of the Code. The Company has continued to present the
Statement of Compliance with the Code of Corporate Governance For the year ended 31 December 2017
Pak Suzuki Motor Company Limited52

details of all related party transactions before the Audit Committee and upon their recommendation to the Board for review and approval. The definition of related party used is in accordance with repealed Companies Ordinance, 1984 and applicable financial reporting frame work as the regulations under Section 208 of the Companies Act, 2017 have not yet been announced.
12. The directors’ report for this year has been prepared in compliance with the requirements of the CCG and fully describes the salient matters required to be disclosed
13. The financial statements of the Company were duly endorsed by CEO and CFO before approval of the Board.
14. The directors, CEO and executives do not hold any interest in the shares of the Company other than that disclosed in the pattern of shareholding.
15. The Company has complied with all the corporate and financial reporting requirements of the CCG.
16. The Board has formed an Audit Committee. As at December 31, 2017 it comprises three (3) members. Chairman of the Committee is independent director and the other two (2) are non-executive directors.
17. The meetings of the Audit Committee were held at least once every quarter prior to approval of interim and final results of the company and as required by the CCG. The terms of reference of the Committee have been formed and advised to the committee for compliance.
18. The Board has formed Human Resource and Remuneration Committee. It comprises three (3) members including two non-executive directors, one of whom is also chairman of the Committee.
19. The Board has set-up an effective internal audit department which comprises of suitably qualified and experienced staff who are conversant with the policies and procedures of the Company and are involved in the internal audit function on a full time basis.
20. The statutory auditors of the Company have confirmed that they have been given a satisfactory rating under the quality control review program of the ICAP, that they or any of the partners of the firm, their spouses and minor children do not hold shares of the Company and that the firm and all its partners are in compliance with International Federation of Accountants (IFAC) guidelines on code of ethics as adopted by ICAP.
21. The statutory auditors or the persons associated with them have not been appointed to provide other services except in accordance with the listing regulations and the auditors have confirmed that they have observed IFAC guidelines in this regard.
22. The ‘closed period’, prior to the announcement of interim/final results, and business decisions, which could materially affect the market price of Company’s securities, was determined and intimated to directors, employees and stock exchange.
23. Material/price sensitive information is disseminated among all market participants at once through stock exchange.
24. The Company has complied with the requirements of Clause 5.19.23 relating to maintenance of register of persons having access to inside information by designated senior management officer in a timely manner and maintained proper record including basis for inclusion and exclusion of names of persons from the said list.
25. We confirm that all other material principles enshrined in the CCG have been complied with.
KINJI SAITO
CHAIRMAN
Dated: March 19, 2018
C O R P O R AT E
Governance
Annual Report 2017 53

Notice of Meeting
Notice is hereby given that the 35th Annual General Meeting of the shareholders of Pak Suzuki Motor Company Limited will be held at Ramada Plaza, Karachi on Wednesday, April 25, 2018 at 9:30 a.m. to transact the following business:
ORDINARY BUSINESS1- To confirm minutes of Annual General Meeting held on April 25, 2017.2- To confirm minutes of Extra Ordinary General Meeting held on February 02, 2018.3- To receive, consider and adopt the audited accounts of the Company for the year ended December 31,
2017, together with Directors’ and Auditors’ reports thereon.4- To approve payment of cash dividend @ 186% i.e. Rs. 18.60 per share of Rs. 10/- each.5- To appoint auditors for the year ending December 31, 2018 and fix their remuneration. Messrs KPMG
Taseer Hadi & Co., Chartered Accountants, retire and being eligible have offered themselves for re-ap-pointment.
6- To consider any other business with the permission of the Chair.
SPECIAL BUSINESS
7- To consider and if thought fit, pass a special resolution to amend the Articles of Association of the Company to authorize the Board of Directors for fixing the remuneration paid to the directors for attending the board meetings as well as allowance in lieu of extra services performed by the directors.
A Statement of Material Facts under Section 134(3) of The Companies Act 2017 covering the above mentioned special businesses is being sent to the shareholders along with a copy of this notice.
BY ORDER OF THE BOARD
ABDUL NASIRCOMPANY SECRETARY
Karachi: April 3, 2018
Notes:1- The share transfer books of the Company will remain closed from April 19, 2018 to April 25, 2018 (both
days inclusive) and no transfer will be accepted for registration during this period. Transfers received in order till close of business on April 18, 2018 will be accepted for transfer.
2- A member entitled to attend and vote at this meeting may appoint another member as his/her proxy to attend the meeting and vote for him/her. Proxies in order to be effective must be received by the Company not less than 48 hours before the meeting.
Pak Suzuki Motor Company Limited54

N O T I C E O F
Meeting
3- Account holders and sub-account holders holding book entry securities in respect of the shares of the Company in Central Depository Company of Pakistan Limited, who wish to attend the Annual General Meeting, are requested to bring their original Computerized National Identity Cards (CNIC) or Passports for identification purpose.
4- SECP vide its SRO 779(1)/2011 dated August 18, 2011 has made it mandatory for the companies to provide CNIC numbers of the shareholders on dividend warrants. Therefore members who have not yet submitted photocopies of their valid CNICs to the Company are again requested to immediately submit the same directly to Company’s share registrar Central Depository Company of Pakistan Ltd., CDC House, 99-B, Block ‘B’, S.M.C.H.S. Main Shahrah-e-Faisal, Karachi. Dividend Warrants of the shareholders who will not submit the copies of their CNICs will be withheld by the Company.
5- The Government of Pakistan, through Finance Act 2017, has made certain amendments in Section 150 of The Income Tax Ordinance 2001 whereby different rates are prescribed for deduction of withholding tax on amount of dividend paid to shareholders. These tax rates are as undera. For filers of income tax returns 15%b. For non-filers of income tax returns 20%
To enable the Company to make tax deduction on the amount of cash dividend @ 15% instead of @ 20%, all the shareholders whose names are not included in the Active Taxpayers’ List (ATL) available on the website of FBR despite of being filers are advised to make sure that their names are added in ATL before the start of book closure.Further, according to clarification received from Federal Board of Revenue (FBR), with-holding tax will be determined separately on ‘Filer/Non-Filer’ status of Principal shareholder as well as jointholder(s) based on their shareholding proportions, in case of joint accounts. In this regard all shareholders who hold shares jointly are requested to provide shareholding proportions of Principal shareholder and Joint-holder(s) in respect of shares held by them (only if not already provided) to our Shares Registrar, in writing as follows:
NameFolio/CDS Account Number
Total Shares
Principal Shareholder Joint Shareholder
Name & CNIC Number
ShareholdingProportion
(No. of Shares)
Name & CNIC Number
ShareholdingProportion
(No. of Shares)
The required information must reach our Shares Registrar within 10 days of this notice, otherwise it will be assumed that the shares are equally held by Principal shareholder and Joint Holder(s).
6- Under the provisions of Section 242 of the Companies Act, 2017, it is mandatory for a listed Company to pay cash dividend to its shareholders only through electronic mode directly into bank account designated by the entitled shareholders. In order to receive dividends directly into their bank account, shareholders are requested to fill in Electronic Credit Mandate Form available on Company’s website and send it duly signed along with a copy of CNIC to the Registrar of the Company, in case of physical shares. In case shares are held in CDC then Electronic Credit Mandate Form must be submitted directly to shareholder’s broker/participant/CDC account services.
7- Members can also avail video conference facility, in this regard, please fill the following and submit to reg-istered address of the Company 10 days before holding of the Annual General Meeting. If the Company
Annual Report 2017 55

receives consent from members holding in aggregate 10% or more shareholding residing at a geograph-ical location, to participate in the meeting through video conference at least 10 days prior to date of the meeting, the Company will arrange video conference facility in the city subject to availability of such facility in that city. “I/We, ____________________ of _____________, being a member of Pak Suzuki Motor Company Limited, holder of __________ ordinary share(s) as per Registered Folio No. ______ hereby opt for video conference facility at _____________.”
8. Statement of Material Facts under Section 134(3) of The Companies Act 2017.
Item No. 7 of the Notice
to directors for attending the board meetings as well as allowance for extra service The remuneration paid to the directors of the Company for attending board of directors’ meetings is stipulated in Article 9.10. Amendment in Articles of Association is proposed to authorize Board of Directors
The existing article 9.10 is reproduced as under:
“The remuneration of the Director for attending meetings of Board of Directors shall not exceed Rs. 20,000/- (Rupees twenty thousand only) per meeting. Remuneration for attending meetings of Board of Directors shall not be paid to the Chief Executive and other directors who work whole-time on remuneration for the
of Chief Executive, Chairman or who serve on any Committee or devote special attention to the business of the Company or who otherwise preforms extra services, which in the opinion of the Directors are outside
It is proposed that the following special resolution be passed to amend the Article of the Articles of Associationof the Company:
“Resolved that Article 9.10 be replaced with:“The remuneration of the Directors for attending Board meetings shall be fixed by the board of directors in theirmeeting. Any director who performs extra services may be paid such remuneration by way of allowance as shallbe determined by Directors and be subject to provisions of any law for the time being in force applicable to theCompany.
Remuneration for attending meetings of Board of Directors shall not be paid to the Chief Executive and otherdirectors who work whole-time on remuneration for the company. Any director appointed to any executive officeincluding for the purpose of this Article the office of Chief Executive, Chairman or who serve on any Committeeor devote special attention to the business of the Company which in the opinion of the Directors are outside thescope of the ordinary duties of the Directors, may be paid such remuneration by way of salary, fees, percentageof profits or otherwise as shall from time to time be determined by Directors and be subject to provisions of anylaw for the time being in force applicable to the Company.”
the scope of the ordinary duties of the Directors, may be paid such remuneration by way of salary, fees,
provisions of any law for the time being in force applicable to the Company.”
Pak Suzuki Motor Company Limited56

The Ideal PartnerSuzuki Mega Carry Xtra is the ideal choice for modern day requirements of light-commercial and fleet businesses, offering more loading space, outstanding performance, durability and reliability. The Mega Carry Xtra meets the diverse needs of its users.
XT
RA
MEGA CARRY
Annual Report 2017 57

Assets - 2017 Assets - 2016
Other Current Assets
Stock in Trade
Property Plant & Equipment
Other Non Current Assets
Cash & Bank Balances
2%
47% 17%
15%
19%
2%
43% 18%
15%
22%
Equity & Liabilities - 2017 Equity & Liabilities - 2016
Advances
Reserves
Security Deposits & Other Current
Paid-up Capital
Trade & Othe Payables
2%
56% 9%
10%
22%
2%
67% 10%
4%
17%
F I N A N C I A L
Statement
Pak Suzuki Motor Company Limited58

Review Report to the Memberson statement of compliance with the code of corporate governance
We have reviewed the enclosed Statement of Compliance with the best practices contained in the Code of Corporate Governance (“the Code”) prepared by the Board of Directors of Pak Suzuki Motor Company Limited (“the Company”) for the year ended 31 December 2017 to comply with the requirements of Listing Regulation No. 5.19.24 of the Rule Book of Pakistan Stock Exchange where the Company is listed.
The responsibility for compliance with the Code is that of the Board of Directors of the Company. Our responsibility is to review, to the extent where such compliance can be objectively verified, whether the Statement of Compliance reflects the status of the Company’s compliance with the provisions of the Code and report if it does not and to highlight any non-compliance with the requirements of the Code. A review is limited primarily to inquiries of the Company’s personnel and review of various documents prepared by the Company to comply with the Code.
As a part of our audit of the financial statements we are required to obtain an understanding of the accounting and internal control systems sufficient to plan the audit and develop an effective audit approach. We are not required to consider whether the Board of Directors’ statement on internal control covers all risks and controls or to form an opinion on the effectiveness of such internal controls, the Company’s corporate governance procedures and risks.
The Code requires the Company to place before the Audit Committee, and upon recommendation of the Audit Committee, place before the Board of Directors for their review and approval its related party transactions distinguishing between transactions carried out on terms equivalent to those that prevail in arm’s length transactions and transactions which are not executed at arm’s length price and recording proper justification for using such alternate pricing mechanism. We are only required and have ensured compliance of this requirement to the extent of the approval of the related party transactions by the Board of Directors upon recommendation of the Audit Committee. We have not carried out any procedures to determine whether the related party transactions were undertaken at arm’s length price or not.
Based on our review, nothing has come to our attention which causes us to believe that the Statement of Compliance does not appropriately reflect the Company’s compliance, in all material respects, with the best practices contained in the Code as applicable to the Company for the year ended 31 December 2017.
Date: 19 March 2018 KPMG Taseer Hadi & Co. Chartered AccountantsKarachi Moneeza Usman Butt
Annual Report 2017 59

We have audited the annexed balance sheet of Pak Suzuki Motor Company Limited (“the Company”) as at 31 December 2017 and the related profit and loss account, statement of comprehensive income, cash flow statement and statement of changes in equity together with the notes forming part thereof, for the year then ended and we state that we have obtained all the information and explanations which, to the best of our knowledge and belief, were necessary for the purposes of our audit.
It is the responsibility of the Company’s management to establish and maintain a system of internal control, and prepare and present the above said statements in conformity with the approved accounting standards as applicable in Pakistan and the requirements of the repealed Companies Ordinance, 1984. Our responsibility is to express an opinion on these statements based on our audit.
We conducted our audit in accordance with the auditing standards as applicable in Pakistan. These standards require that we plan and perform the audit to obtain reasonable assurance about whether the above said statements are free of any material misstatement. An audit includes examining, on a test basis, evidence supporting the amounts and disclosures in the above said statements. An audit also includes assessing the accounting policies and significant estimates made by management, as well as, evaluating the overall presentation of the above said statements. We believe that our audit provides a reasonable basis for our opinion and, after due verification, we report that:
a) in our opinion, proper books of account have been kept by the Company as required by the repealed Companies Ordinance, 1984;
b) in our opinion:
i) the balance sheet and profit and loss account together with the notes thereon have been drawn up in conformity with the repealed Companies Ordinance, 1984, and are in agreement with the books of account and are further in accordance with accounting policies consistently applied;
ii) the expenditure incurred during the year was for the purpose of the Company’s business; and
iii) the business conducted, investments made and the expenditure incurred during the year were in accordance with the objects of the Company;
c) in our opinion and to the best of our information and according to the explanations given to us, the balance sheet, profit and loss account, statement of comprehensive income, cash flow statement and statement of changes in equity together with the notes forming part thereof conform with approved accounting standards as applicable in Pakistan, and, give
Auditors’ Report to the Members
Pak Suzuki Motor Company Limited60

the information required by the repealed Companies Ordinance, 1984, in the manner so required and respectively give a true and fair view of the state of the Company’s affairs as at 31 December 2017 and of the profit, its cash flows and changes in equity for the year then ended; and
d) in our opinion Zakat deductible at source under the Zakat and Ushr Ordinance, 1980 (XVIII of 1980), was deducted by the Company and deposited in the Central Zakat Fund established under section 7 of that Ordinance.
The financial statements of the Company for the year ended 31 December 2016 were audited by another firm of Chartered Accountants who have expressed an unmodified opinion on those financial statements vide their audit report dated 21 March 2017.
Date: 19 March 2018 KPMG Taseer Hadi & Co. Chartered AccountantsKarachi Moneeza Usman Butt
Annual Report 2017 61

2017 2016
Note ------- (Rupees in ‘000’) -------
ASSETS
NON-CURRENT ASSETS
Property, plant and equipment 4 8,800,002 6,672,057
Intangible assets 5 185,333 72,619
Long-term investments 6 208,086 -
Long-term loans 7 2,361 1,160
Long-term deposits, prepayments and other receivables 8 327,319 258,103
Long-term installment sales receivables 9 144,779 96,033
Deferred taxation 10 236,500 233,750
9,904,380 7,333,722
CURRENT ASSETS
Stores, spares and loose tools 11 114,789 111,006
Stock-in-trade 12 23,946,058 16,288,608
Trade debts 13 211,358 1,205,269
Loans and advances 14 37,481 163,019
Trade deposits and short term prepayments 15 965,722 77,129
Current portion of long-term installment sales receivables 9 320,996 291,254
Accrued profit on bank deposits 28,699 120,761
Other receivables 16 147,775 167,306
Taxation - net 4,899,972 1,894,297
Sales tax and excise duty adjustable 1,143,685 1,651,301
Cash and bank balances 17 9,189,552 8,548,293
41,006,087 30,518,243
TOTAL ASSETS 50,910,467 37,851,965
Balance SheetAs at December 31, 2017
Pak Suzuki Motor Company Limited62

F I N A N C I A L
Accounts2017 2016
Note ------- (Rupees in ‘000’) -------
EQUITY AND LIABILITIES
SHARE CAPITAL AND RESERVES
Authorised share capital
150,000,000 (2016: 150,000,000) ordinary shares of Rs. 10/- each 1,500,000 1,500,000
Issued, subscribed and paid-up share capital 18 822,999 822,999
Reserves 28,726,717 25,393,908
29,549,716 26,216,907
CURRENT LIABILITIES
Trade and other payables 19 11,391,952 6,300,123
Advances from customers 5,331,948 1,625,472
Security deposits 20 4,600,552 3,673,164
Provision for custom duties and sales tax 21 36,299 36,299
21,360,751 11,635,058
CONTINGENCIES AND COMMITMENTS 22
TOTAL EQUITY AND LIABILITIES 50,910,467 37,851,965
The annexed notes from 1 to 42 form an integral part of these financial statements.
Chairman Chief Financial Officer Chief Executive Officer
Annual Report 2017 63

Profit and Loss AccountFor the year ended 31 December 2017
Note 2017 2016
------- (Rupees in ‘000’) -------
Sales 23 101,811,611 76,516,040
Cost of sales 24 (92,159,038) (69,167,463)
Gross profit 9,652,573 7,348,577
Distribution and selling costs 25 (2,804,256) (2,004,285)
Administrative expenses 26 (1,599,815) (1,539,590)
Other expenses 27 (413,997) (333,542)
Other income 28 864,711 1,039,851
Finance costs 29 (68,088) (95,775)
(4,021,445) (2,933,341)
5,631,128 4,415,236
Share of loss of equity accounted investee 6 (11,914) -
Profit before taxation 5,619,214 4,415,236
Taxation 30 (1,793,393) (1,642,601)
Profit after taxation 3,825,821 2,772,635
(Rupees)
Earnings per share - basic and diluted 31 46.49 33.69
The annexed notes from 1 to 42 form an integral part of these financial statements.
Chairman Chief Financial Officer Chief Executive Officer
Pak Suzuki Motor Company Limited64

F I N A N C I A L
Accounts
Statement of Comprehensive Income For the year ended 31 December 2017
Chairman Chief Financial Officer Chief Executive Officer
2017 2016
------- (Rupees in ‘000’) -------
Profit after taxation 3,825,821 2,772,635
Other comprehensive income
Items that may not be reclassified
subsequently to profit and loss account
Remeasurement loss on defined benefit plan - net of tax (40,363) (468)
Total comprehensive income for the year 3,785,458 2,772,167
The annexed notes from 1 to 42 form an integral part of these financial statements.
Annual Report 2017 65

Cash Flow StatementFor the year ended 31 December 2017
Note 2017 2016
------- (Rupees in ‘000’) -------
CASH FLOW FROM OPERATING ACTIVITIES
Cash generated from / (used in) operations 32 9,188,578 (751,912)Finance costs paid (68,088) (95,782)Taxes paid (4,801,818) (1,986,266)Long-term loans (1,201) (106)Long-term deposits, prepayments and other receivables (69,216) (224,780)Long-term installment sales receivables (48,746) 17,594 Net cash generated from / (used in) operating activities 4,199,509 (3,041,252)
CASH FLOW FROM INVESTING ACTIVITIES
Purchase of property, plant and equipment (3,519,215) (3,122,862)Purchase of intangible assets (195,904) (62,236)Proceeds from sales of property, plant and equipment 42,727 71,716 Investment in associates (220,000) - Profit received on bank accounts 787,242 926,642 Net cash used in investing activities (3,105,150) (2,186,740)
CASH FLOW FROM FINANCING ACTIVITIES
Dividends paid (453,100) (1,229,722)Net increase / (decrease) in cash and cash equivalents 641,259 (6,457,714)
Cash and cash equivalents at beginning of the year 8,548,293 15,006,007 Cash and cash equivalents at end of the year 17 9,189,552 8,548,293
The annexed notes from 1 to 42 form an integral part of these financial statements.
Chairman Chief Financial Officer Chief Executive Officer
Pak Suzuki Motor Company Limited66

F I N A N C I A L
Accounts
Statement of Changes in Equity For the year ended 31 December 2017
Reserves
Share Capital Capital reserves Revenue reserves
Issued, subscribed
and paid-up
Share premium
Reserve on merger
General Unappropriated profit
Re-measurement loss
on defined benefit plan
Total Reserve Total
----------------------------------------------------------- (Rupees in ‘000) -----------------------------------------------------------
Balance as at 01 January 2016 822,999 584,002 260,594 17,214,818 5,846,477 (49,652) 23,856,239 24,679,238
Transaction with owners in the capacity as owners directly recorded in equity
Final dividend on ordinary shares @ 150% for the year ended 31 December 2015 - - - - (1,234,498) - (1,234,498) (1,234,498)
Transfer to general reserve - - - 4,610,000 (4,610,000) - - -
Total comprehensive income for theyear ended 31 December 2016
Profit for the year - - - - 2,772,635 - 2,772,635 2,772,635
Other comprehensive income - - - - - (468) (468) (468)
- - - - 2,772,635 (468) 2,772,167 2,772,167
Balance as at 31 December 2016 822,999 584,002 260,594 21,824,818 2,774,614 (50,120) 25,393,908 26,216,907
Transaction with owners in the capacity as owners directly recorded in equity
Final dividend on ordinary shares @ 55% for the year ended 31 December 2016
- - - - (452,649) - (452,649) (452,649)
Transfer to general reserve - - - 2,320,000 (2,320,000) - - -
Total comprehensive income for theyear ended 31 December 2017
Profit for the year - - - - 3,825,821 - 3,825,821 3,825,821
Other comprehensive income - - - - - (40,363) (40,363) (40,363)
- - - - 3,825,821 (40,363) 3,785,458 3,785,458
Balance as at 31 December 2017 822,999 584,002 260,594 24,144,818 3,827,786 (90,483) 28,726,717 29,549,716
The annexed notes from 1 to 42 form an integral part of these financial statements.
Chairman Chief Financial Officer Chief Executive Officer
Annual Report 2017 67

Notes to the Financial Statements For the year ended 31 December 2017
1. CORPORATE INFORMATION, OPERATIONS AND LEGAL STATUS
Pak Suzuki Motor Company Limited Pak Suzuki Motor Company Limited (“the Company”) was incorporated in Pakistan as a public limited
company in August 1983 and started commercial production in January 1984. The Company was formed in accordance with the terms of a joint venture agreement concluded between Pakistan Automobile Corporation Limited (“PACO”) and Suzuki Motor Corporation, Japan (the Holding Company). The Company is engaged in the assembling, progressive manufacturing and marketing of Suzuki cars, pickups, vans, 4x4s and motorcycles and related spare parts. The Company is listed on Pakistan Stock Exchange. The registered office of the Company is situated at DSU – 13, Pakistan Steel Industrial Estate, Bin Qasim, Karachi.
Tecno Auto Glass Limited Tecno Auto Glass Limited (“TAG”) is a company incorporated in Pakistan as a public limited company
under the Companies Ordinance, 1984 on 16 March 2017. The registered office of the Company is situated at 255 A, Block 6, P.E.C.H.S, Shahrah-e-Faisal, Karachi. TAG’s main area of operations will be manufacturing, development and designing of Auto Glass products to cater local as well as international markets.
TAG is a subsidiary of Tecno Pack Telecom (Private) Limited, which owns 60% of the shares of TAG,
while remaining 40% of the shares were acquired by Pak Suzuki Motor Company Limited as more explained in note 6.1 to the financial statements.
2. SUMMARY OF SIGNIFICANT ACCOUNTING POLICIES
2.1 Statement of compliance These financial statements have been prepared in accordance with approved accounting standards
as applicable in Pakistan. Approved accounting standards comprise of such International Financial Reporting Standards (IFRSs) issued by the International Accounting Standards Board (IASB) as are notified under the repealed Companies Ordinance, 1984, provisions of and directives issued under the repealed Companies Ordinance, 1984. In case requirements differ, the provisions or directives of the repealed Companies Ordinance, 1984 shall prevail.
2.2 Basis of preparation These financial statements have been prepared under the historical cost convention except as
disclosed in the accounting policies as stated in note 3.
2.3 Functional and presentation currency These financial statements are presented in Pakistan Rupees which is Company’s functional currency.
All financial information presented in Pakistan Rupees has been rounded to the nearest thousand of rupees, unless stated otherwise.
Pak Suzuki Motor Company Limited68

F I N A N C I A L
Accounts
2.4 Significant accounting estimates and judgments
The preparation of financial statements in conformity with approved accounting standards, as applicable in Pakistan, requires management to make judgments, estimates and assumptions that affect the application of policies and the reported amounts of assets, liabilities, income and expenses. The estimates and associated assumptions are based on historical experience and various other factors that are believed to be reasonable under the circumstances, the results of which form the basis of making the judgments about the carrying values of assets and liabilities that are not readily apparent from other sources. Actual results may differ from these estimates.
The estimates and underlying assumptions are reviewed on an ongoing basis. Revisions to accounting estimates are recognized in the period in which the estimate is revised if the revision affects only that period, or in the period of the revision and future periods if the revision affects both current and future periods. Judgments made by the management in the application of approved accounting standards, as applicable in Pakistan, that have significant effect on the financial statements and estimates with significant risk of material adjustment in the next year are described in the following:
- Determining the useful lives and residual value of items of property, plant and equipment (note 3.1 and 4)
- Investement in associate (note 3.3 and 6) - Provision for slow moving and obsolete store and spares (note 3.4 & 11)
- Provision for slow moving and obsolete stock-in-trade (note 3.5 & 12)
- Provision for doubtful trade debts (note 3.7 and 13) - Provision for retirement benefits (note 3.11 and 19.4) - Provision for sales tax and custom duties (note 3.12 and 21)
- Provision for taxation (note 3.12, 10 and 30) - Provision for warranty obligations (note 3.15 and 19.2) - Contingencies and commitments (note 22) 2.5 Standards, amendments and interpretations which became effective during the year
During the year, amendments to certain standards became effective which were not relevant to the
Company’s accounting policies. 2.6 Standards, Interpretations and Amendments not yet effective
The following standards, amendments and interpretations of approved accounting standards will be
effective for accounting periods beginning on or after 01 January 2018:
Annual Report 2017 69

Notes to the Financial Statements For the year ended 31 December 2017
- Classification and Measurement of Share-based Payment Transactions - amendments to IFRS 2 clarify the accounting for certain types of arrangements and are effective for annual periods beginning on or after 1 January 2018. The amendments cover three accounting areas (a) measurement of cash-settled share-based payments; (b) classification of share-based payments settled net of tax withholdings; and (c) accounting for a modification of a share-based payment from cash-settled to equity-settled. The new requirements could affect the classification and/or measurement of these arrangements and potentially the timing and amount of expense recognized for new and outstanding awards. The amendments are not likely to have an impact on Company’s financial statements.
- Transfers of Investment Property (Amendments to IAS 40 ‘Investment Property’ - effective for annual periods beginning on or after 1 January 2018) clarifies that an entity shall transfer a property to, or from, investment property when, and only when there is a change in use. A change in use occurs when the property meets, or ceases to meet, the definition of investment property and there is evidence of the change in use. In isolation, a change in management’s intentions for the use of a property does not provide evidence of a change in use. The amendments are not likely to have an impact on Company’s financial statements.
- Annual improvements to IFRSs 2014-2016 Cycle [Amendments to IAS 28 ‘Investments in Associates
and Joint Ventures’] (effective for annual periods beginning on or after 1 January 2018) clarifies that a venture capital organization and other similar entities may elect to measure investments in associates and joint ventures at fair value through profit or loss, for each associate or joint venture separately at the time of initial recognition of investment. Furthermore, similar election is available to non-investment entity that has an interest in an associate or joint venture that is an investment entity, when applying the equity method, to retain the fair value measurement applied by that investment entity associate or joint venture to the investment entity associate’s or joint venture’s interests in subsidiaries. This election is made separately for each investment entity associate or joint venture. The amendments are not likely to have an impact on Company’s financial statements.
- IFRIC 22 ‘Foreign Currency Transactions and Advance Consideration’ (effective for annual periods beginning on or after 1 January 2018) clarifies which date should be used for translation when a foreign currency transaction involves payment or receipt in advance of the item it relates to. The related item is translated using the exchange rate on the date the advance foreign currency is received or paid and the prepayment or deferred income is recognized. The date of the transaction for the purpose of determining the exchange rate to use on initial recognition of the related asset, expense or income (or part of it) would remain the date on which receipt of payment from advance consideration was recognized. If there are multiple payments or receipts in advance, the entity shall determine a date of the transaction for each payment or receipt of advance consideration. The application of interpretation is not likely to have an impact on Company’s financial statements.
- IFRIC 23 ‘Uncertainty over Income Tax Treatments’ (effective for annual periods beginning on or after 1 January 2019) clarifies the accounting for income tax when there is uncertainty over income tax treatments under IAS 12. The interpretation requires the uncertainty over tax treatment be reflected in the measurement of current and deferred tax. The application of interpretation is not likely to have an impact on Company’s financial statements.
- IFRS 15 ‘Revenue from contracts with customers’ (effective for annual periods beginning on or after
1 July 2018). IFRS 15 establishes a comprehensive framework for determining whether, how much
Pak Suzuki Motor Company Limited70

F I N A N C I A L
Accounts
and when revenue is recognized. It replaces existing revenue recognition guidance, including IAS 18 ‘Revenue’, IAS 11 ‘Construction Contracts’ and IFRIC 13 ‘Customer Loyalty Programmes’. The Company is currently in the process of analyzing the potential impact of changes required in revenue recognition policies on adoption of the standard.
- IFRS 9 ‘Financial Instruments’ and amendment – Prepayment Features with Negative Compensation
(effective for annual periods beginning on or after 1 July 2018 and 1 January 2019 respectively). IFRS 9 replaces the existing guidance in IAS 39 Financial Instruments: Recognition and Measurement. IFRS 9 includes revised guidance on the classification and measurement of financial instruments, a new expected credit loss model for calculating impairment on financial assets, and new general hedge accounting requirements. It also carries forward the guidance on recognition and derecognition of financial instruments from IAS 39. The Company is currently in the process of analyzing the potential impact of changes required in classification and measurement of financial instruments and the impact of expected loss model on adoption of the standard.
- Amendment to IAS 28 ‘Investments in Associates and Joint Ventures’ - Long Term Interests in
Associates and Joint Ventures (effective for annual period beginning on or after 1 January 2019). The amendment will affect companies that finance such entities with preference shares or with loans for which repayment is not expected in the foreseeable future (referred to as long-term interests or ‘LTI’). The amendment and accompanying example state that LTI are in the scope of both IFRS 9 and IAS 28 and explain the annual sequence in which both standards are to be applied. The amendments are not likely to have an impact on Company’s financial statements.
Annual Improvements to IFRS Standards 2015–2017 Cycle - the improvements address amendments to following approved accounting standards:
- IFRS 3 Business Combinations and IFRS 11 Joint Arrangement - the amendment aims to clarify
the accounting treatment when a company increases its interest in a joint operation that meets the definition of a business. A company remeasures its previously held interest in a joint operation when it obtains control of the business. A company does not remeasure its previously held interest in a joint operation when it obtains joint control of the business.
- IAS 23 Borrowing Costs - the amendment clarifies that a company treats as part of general borrowings any borrowing originally made to develop an asset when the asset is ready for its intended use or sale.
The above amendments are effective from annual period beginning on or after 1 January 2019 and are not likely to have an impact on Company’s financial statements.
In addition, the Companies Act, 2017 was enacted on 30 May 2017 and SECP vide its circular 23 of 2017 has clarified that the companies whose financial year closes on or before 31 December 2017 shall prepare their financial statements in accordance with the provisions of the repealed Companies Ordinance, 1984. The Companies Act, 2017 applicable for financial year beginning on 1 January 2018 requires certain additional disclosures which will be incorporated in financial statements for the period ending on or after 1 January 2018.
Annual Report 2017 71

Notes to the Financial Statements For the year ended 31 December 2017
3. SIGNIFICANT ACCOUNTING POLICIES 3.1 Property, plant and equipment Operating fixed assets are stated at cost less accumulated depreciation and impairment (if any) except
for freehold land which is stated at cost. Items of fixed assets costing Rs. 10,000/- or less are not recognised and charged to profit and loss in the year of purchase.
Capital work-in-progress is stated at cost less impairment (if any) and represents expenditures incurred and advances made in respect of specific assets during the construction / erection period. These are transferred to specific assets as and when assets are available for use.
Depreciation on plant and machinery, welding guns, waste water treatment plant, permanent and special tools, dies, jigs and fixtures and electric installations is charged using the straight line method, whereas depreciation on other assets is charged applying the reducing balance method. The cost of the leasehold land and leasehold improvements is written off over its lease term. Depreciation on additions is charged for the full month in which an asset is put to use and on deletions up to the month immediately preceding the deletion.
Maintenance and normal repairs are charged to income as and when incurred. Gain or loss on sale or
retirement of fixed assets is included in income currently.
The assets’ residual values, useful lives and depreciation methods are reviewed and adjusted if appropriate, at each financial year end.
The carrying value of the property, plant and equipment and intangible assets is reviewed at each
balance sheet date to determine whether there is any indication of impairment. If such indication exists, the recoverable amount of the relevant asset is estimated. An impairment loss is recognized in profit and loss account whenever the carrying amount of an asset exceeds its recoverable amount. An impairment loss is reversed if the reversal can be objectively related to an event occurring after the impairment loss was recognized.
3.2 Intangible assets These represent costs which are capitalised when it is probable that future economic benefits attributable
to them will flow to the Company. These are stated at cost less accumulated amortisation and any identified impairment loss.
Amortisation is charged to income on the straight line method. Amortisation on additions is charged
from the month in which an asset comes into operation while no amortisation is charged for the month in which the asset is written off.
The assets’ residual values, useful lives and amortisation methods are reviewed and adjusted if
appropriate, at each financial year end.
Pak Suzuki Motor Company Limited72

F I N A N C I A L
Accounts
3.3 Investment in associate Associates are those entities in which the Company has significant influence, but not control or joint-
control, over the financial and operating policies. Interests in associate is accounted for using the equity method.
These are initially recognised at cost, which include transaction cost, if any. The financial statements
include the Company’s share of profit or loss and movements in other comprehensive income of the equity accounted associate, after adjustments, if any, from the date that significant influence commences until the date it ceases. Share of post acquisition profit and loss of associates is recognised in the profit or loss and other comprehensive income is recognised in the other comprehensive income. Distributions received from associates reduce the carrying amount of investment. When the Company’s share of losses exceeds its interest in an equity accounted investee, the carrying amount of that investment (including any long-term interests that, in substance, form part of the Company’s net investment in the associate) is reduced to nil and the recognition of further losses is discontinued.
The carrying amount of investments in associates is reviewed at each reporting date to determine whether there is any indication of impairment. If any such indication exists, the recoverable amount of the investments is estimated which is higher of its value in use and its fair value less costs to sell. An impairment loss is recognised if the carrying amount exceeds its recoverable amount and is charged to profit or loss. An impairment loss is reversed if there has been a change in estimates used to determine the recoverable amount but limited to the extent of carrying amount that would have been determined if no impairment loss had been recognised. A reversal of impairment loss is recognised in the profit or loss.
3.4 Stores, spares and loose tools Stores, spares and loose tools are valued at lower of net realizable value and cost, calculated on a
weighted average basis. Provision is made annually in the financial statements for slow moving and obsolete items.
3.5 Stock-in-trade Stock- in-trade is valued at the lower of cost and net realizable value. Cost is calculated on a weighted
average or specific consignment basis, depending upon their categories. Stocks-in-transit are stated at invoice value plus other charges accrued thereon to the balance sheet date. Vehicles on wheels are taken as work-in-process until they are approved by the quality control department. After such approval the vehicles are classified as finished goods. The engines assembled are included in raw material. The cost of engines assembled, work-in-process and finished goods consists of landed cost of imported materials, average local material cost, factory overhead and direct labour. Provision is made annually in the financial statements for slow moving and obsolete items.
Net realisable value is determined by considering the prevailing selling prices of products in the ordinary course of business less estimated cost of completion and cost necessary to be incurred in order to make the sale. The net realisable values are determined on the basis of each line of product.
Annual Report 2017 73

Notes to the Financial Statements For the year ended 31 December 2017
3.6 Non-current assets classified as held for sale Non-current assets are classified as held for sale if their carrying amount is to be recovered principally
through a sale transaction rather than through continuing use. These assets are available for sale in their present condition subject only to terms that are usual and customary for sales of such assets and their sale is highly probable.
The Company measures its non-current assets classified as held for sale at the lower of carrying amount
and fair value less costs to sell. Costs to sell signify the incremental costs directly attributable to the disposal of an asset, excluding finance costs and income tax expense.
3.7 Trade debts and installment sales receivable Trade debts are recognised initially at fair value (original value of invoice amount less any part payment)
and subsequently measured at amortised cost or cost, as the case may be, less provision for doubtful debts. Installment sales receivables are recognised at original invoice amount and are subsequently reduced by the principal portion of installments received. When the recovery of the amount is considered uncertain by the management, a provision is made for the same. Known bad debts are written-off when they are identified. A general provision at the rate 3.5% of the balance of installment sales receivables is maintained to cater for any bad debts.
3.8 Trade and other payables Liabilities for trade and other amounts payable are carried at cost which is the fair value of the
consideration to be paid in the future for goods and services received, whether or not invoiced to the Company and subsequently measured at amortised cost using the effective interest rate method.
3.9 Financial instruments 3.9.1 Financial assets Classification The management determines the appropriate classification of its financial assets in accordance with the
requirements of IAS 39 “Financial Instruments: Recognition and Measurement” at the time of purchase of financial assets and re-evaluates this classification on a regular basis. The financial assets of the Company are categorised as follows:
a) At fair value through profit or loss
Financial assets that are acquired principally for the purpose of generating profit from short-term fluctuations in prices are classified as ‘financial assets at fair value through profit or loss’ category.
b) Loans and receivables These are non-derivatives financial assets with fixed or determinable payments that are not quoted
in an active market. The Company’s loans and receivables comprise of trade debts, loans and advances, deposits, bank balances and other receivables in the balance sheet.
Pak Suzuki Motor Company Limited74

F I N A N C I A L
Accounts
c) Held to maturity These are financial assets with fixed or determinable payments and fixed maturity with the Company
having positive intent and ability to hold to maturity.
d) Available for sale Financial assets intended to be held for an indefinite period of time, which may be sold in response
to needs for liquidity or changes in equity prices, are classified as ‘available for sale’. Available for sale financial instruments are those non-derivative financial assets that are designated as available for sale or are not classified as (a) loans and receivables, (b) held to maturity, or (c) financial assets at fair value through profit or loss.
Initial recognition and measurement All financial assets are recognised at the time the Company becomes a party to the contractual provisions
of the instrument. Financial assets are initially recognised at fair value plus transaction costs except for financial assets carried at fair value through profit or loss. In case of financial assets carried at fair value through profit or loss, relevant transaction costs are taken directly to the profit and loss account.
Subsequent measurement. Subsequent to initial recognition, financial assets are valued as follows:
a) Financial asset at fair value through profit or loss and ‘available for sale’
Financial assets at fair value through profit or loss are carried on the balance sheet at fair value. Net
gains and losses arising on changes in fair values of these financial assets are taken to the profit and loss account in the period in which these arise.
‘Available for sale’ financial assets are carried on the balance sheet at fair value. Net gains and
losses arising on changes in fair values of these financial assets are taken to other comprehensive income.
Fair value is determined by reference to quoted market price. Investments for which a quoted
market price is not available or the fair value cannot be reasonably calculated, are measured at cost, subject to review for impairment at each balance sheet date.
b) ‘Loans and receivables’ and ‘held to maturity’ ‘Loans and receivables’ and ‘held to maturity’ financial assets are carried at amortised cost.
3.9.2 Financial liabilities All financial liabilities are recognised at the time when the Company becomes a party to the contractual
provisions of the instrument. These are initially recorded at fair value and subsequently measured at amortised cost.
Annual Report 2017 75

Notes to the Financial Statements For the year ended 31 December 2017
3.9.3 Offsetting of financial assets and liabilities Financial assets and financial liabilities are offset and the net amount is reported in the financial
statements, when there is a legally enforceable right to set off the recognised amounts and there is an intention to settle on a net basis, or realise the assets and settle the liabilities simultaneously.
3.9.4 Derecognition of financial assets and liabilities Financial assets are derecognised at the time when the Company loses control of the contractual
rights that comprise the financial assets. Financial liabilities are derecognised at the time when they are extinguished i.e. when the obligation specified in the contract is discharged, cancelled, or expires. Any gain or loss on derecognition of financial assets and financial liabilities is taken to the profit and loss account.
3.9.5 Impairment The Company assesses at each balance sheet date whether there is objective evidence that a financial
asset is impaired. Impairment loss on all financial assets is recognised in the profit and loss account. In arriving at the provision in respect of any diminution in long-term financial assets, consideration is given only if there is a permanent impairment in the value of the financial assets.
3.10 Provisions Provisions are recognised in the balance sheet where the Company has a present legal or constructive
obligation as a result of past event, it is probable that an outflow of resources embodying economic benefits will be required to settle the obligation and a reliable estimate of the amount of the obligation can be made. Provisions are reviewed at each balance sheet date and adjusted to reflect current best estimate.
3.11 Employees benefit schemes 3.11.1 Gratuity scheme The Company operates an unfunded Gratuity Scheme (the Plan) for eligible employees of the Company.
The Company’s obligation under the scheme is determined through actuarial valuation carried out at each year end under the Projected Unit Credit Method. Remeasurements which comprise actuarial gains and losses are recognised immediately in other comprehensive income. The Company determines the net interest expense on the net defined benefit liability for the period by applying the discount rate used to measure the defined benefit obligation at the beginning of the annual period to the then defined benefit liability, taking into account any changes in the net defined benefit liability during the period as a result of contribution and benefit payments. Interest cost and current service cost are recognised in profit and loss account. The latest actuarial valuation was conducted at the balance sheet date by a qualified professional firm of actuaries.
Pak Suzuki Motor Company Limited76

F I N A N C I A L
Accounts
3.11.2 Provident fund The Company operates an approved defined contributory provident fund scheme for all permanent
employees. Equal monthly contributions are made by the Company and the employees to the fund at the rate of 10 percent of basic salary.
3.11.3 Compensated absences The Company accounts for employees’ compensated absences on the basis of unavailed earned
leave balance of each employee as at the end of the year and the last drawn salary.
3.12 Taxation 3.12.1 Current Provision for current taxation is based on taxable income at the current rates of taxation after taking
into account tax credits and rebates available, if any. The charge for the current tax also includes adjustments where necessary, relating to prior years which arise from assessments framed / finalised during the year.
3.12.2 Deferred Deferred tax is recognised using the balance sheet liability method, on temporary differences at
the balance sheet date between the tax bases of assets and liabilities and their carrying amounts for financial reporting purposes. Deferred tax assets are recognised for all deductible temporary differences to the extent that the temporary differences will reverse in the future and taxable income will be available against which the deductible temporary differences can be utilised. Deferred tax liabilities are recognised for all taxable temporary differences.
The carrying amount of deferred tax assets is reviewed at each balance sheet date and reduced to the extent that it is no longer probable that sufficient taxable profit will be available to allow all or part for the deferred tax asset to be utilised.
Deferred tax assets and liabilities are measured at the tax rates that are expected to apply to the
period when the asset is realised or the liability is settled, based on tax rates (and tax laws) that have been enacted or subsequently enacted at the balance sheet date.
3.12.3 Sales tax Revenues, expenses and assets are recognised net of the amount of sales tax except, where the sales
tax incurred on a purchase of assets or services is not recoverable from the taxation authority, in which case the sales tax is recognised as part of the cost of acquisition of assets or as part of the expense item as applicable.
Annual Report 2017 77

Notes to the Financial Statements For the year ended 31 December 2017
3.13 Foreign currency translation Transactions in foreign currencies are translated into reporting currency at the rates of exchange
prevailing on the date of transactions. Monetary assets and liabilities denominated in foreign currencies are translated into reporting currency equivalents using year end spot foreign exchange rates. Non-monetary assets and liabilities are translated using exchange rate that existed when the values were determined. Exchange differences on foreign currency translations are taken to profit and loss account currently.
3.14 Revenue recognition Revenue is recognised when goods are sold and services are rendered. Goods are treated as sold
when they are delivered and invoiced. Warranty and insurance claims are recognised when the claims in respect thereof are lodged with the respective parties.
Profit on bank accounts is accounted for on accrual basis using effective interest rate method.
Mark-up on installment sales receivables is recognised on the basis of effective interest rate.
Dividend income is recognised when the Company’s right to receive such dividend is established.
Commission income is recognised as and when such service is provided.
Miscellaneous income is recognised on receipt basis.
3.15 Warranty obligations The Company accounts for its warranty obligations on accrual basis.
3.16 Cash and cash equivalents These are carried at cost and include cash / cheques in hand and balance with banks.
3.17 Dividend and appropriation to reserves Dividend declared and appropriations to reserves made subsequent to balance sheet are considered
non-adjusting events and are recognised in the financial statements in the period in which they are approved.
3.18 Borrowing Costs Borrowing costs that are directly attributable to the acquisition, construction or production of an asset
that necessarily takes a substantial period of time to get ready for its intended use or sale are capitalised as part of the cost of the respective assets. All other borrowing costs are expensed out in the period they occur. Borrowing costs consist of interest and other cost that an entity incurs in connection with the borrowing of funds.
Pak Suzuki Motor Company Limited78

F I N A N C I A L
Accounts
3.19 Segment reporting Operating segments are reported in a manner consistent with the internal reporting structure. Management
monitors the operating results of the business separately for the purpose of making decisions regarding resource allocation and performance assessment. All operating segments’ operating results are reviewed regularly by the Company’s Chief Executive Officer and Board of Directors to make decisions about resources to be allocated to the segment and to assess its performance, and for which discrete financial information is available. The business of the Company has two reportable operating segments i.e., Automobiles segment and Motorcycles segment.
Segment results that are reported for review and performance evaluation include items directly attributable to a segment as well as those that can be allocated on a reasonable basis. Unallocated items comprise mainly corporate assets and liabilities, certain other operating income and expenses, certain finance costs, tax assets and liabilities and income tax expense.
Segment capital expenditure is the total cost incurred during the year to acquire tangible fixed assets and intangible assets other than goodwill.
4. PROPERTY, PLANT AND EQUIPMENT Note 2017 2016------- (Rupees in ‘000’) -------
Operating fixed assets 4.1 7,068,071 4,175,966 Capital work-in-progress 4.4 1,731,931 2,496,091
8,800,002 6,672,057
Annual Report 2017 79

Notes to the Financial Statements For the year ended 31 December 2017
4.1 OPERATING FIXED ASSETS
The following is a statement of operating fixed assets:
Cost as at Additions Deletions / Cost as at Accumulated Charge for Depreciation Accumulated Book value Years /01 January written off 31 December depreciation the Year on deletion / depreciation as at 31 Rate %
2017 2017 as at 01 written off as at 31 DecemberJanuary December 2017
2017 2017----------------------------------------------------------------------------- (Rupees in ‘000) -----------------------------------------------------------------------------
Leasehold land 934,620 - - 934,620 121,304 15,854 - 137,158 797,462 60-75 Years
Freehold land 371,514 - - 371,514 - - - - 371,514
Leasehold improvements 27,938 - (27,938) - 27,938 - (27,938) - - 5-9 Years
Buildings on leasehold land- Factory 1,542,378 508,559 - 2,050,937 1,016,119 87,212 - 1,103,331 947,606 10-20
- Office 3,253 - - 3,253 2,391 172 - 2,563 690 20
Test Tracks other buildings 63,463 - - 63,463 29,771 6,738 - 36,509 26,954 20
Plant and machinery 7,224,221 707,810 (75,948) 7,856,083 6,206,612 339,495 (74,047) 6,472,060 1,384,023 8 Years
Welding guns 354,219 47,248 - 401,467 327,213 31,339 - 358,552 42,915 4 Years
Waste water treatment plant 120,222 - - 120,222 120,222 - - 120,222 - 8 Years
Permanent and special tools 435,043 145,688 (5,252) 575,479 401,155 39,497 (5,233) 435,419 140,060 4 Years
Dies 2,802,114 522,334 (2,694) 3,321,754 2,479,749 223,262 (2,694) 2,700,317 621,437 5 Years
Jigs and fixtures 779,259 557,364 - 1,336,623 619,936 155,660 - 775,596 561,027 5 Years
Vendor Tooling (Note 4.1.1) 626,561 1,474,016 (320) 2,100,257 151,957 333,733 (203) 485,487 1,614,770 5 Years
Electrical installations 263,970 50,322 - 314,292 206,879 20,151 - 227,030 87,262 8 Years
Furniture and fittings 20,501 4,081 - 24,582 13,175 2,143 - 15,318 9,264 20
Vehicles 545,182 194,466 (69,361) 670,287 302,744 67,508 (43,197) 327,055 343,232 20
Air conditioners and refrigerators 43,029 13,876 (1,786) 55,119 14,498 7,767 (1,589) 20,676 34,443 20
Office equipment 86,529 10,814 (643) 96,700 53,296 7,752 (580) 60,468 36,232 20
Computers 151,132 46,797 (268) 197,661 124,223 24,518 (260) 148,481 49,180 20
16,395,148 4,283,375 (184,210) 20,494,313 12,219,182 1,362,801 (155,741) 13,426,242 7,068,071
Pak Suzuki Motor Company Limited80

F I N A N C I A L
Accounts
Cost as at Additions Deletions / Cost Accumulated Charge for Depreciation Accumulated Book value Years /01 January written off as at depreciation the Year on deletion / depreciation as at 31 Rate %
2016 31 December as at 01 written off as at 31 December2016 January December 2016
2016 2016----------------------------------------------------------------------------- (Rupees in ‘000) -----------------------------------------------------------------------------
Leasehold land 806,263 128,357 - 934,620 106,287 15,017 - 121,304 813,316 60-75 Years
Freehold land 371,514 - 371,514 - - - - 371,514
Leasehold improvements 27,938 - - 27,938 27,938 - - 27,938 - 5-9 Years
Buildings on leasehold land- Factory 1,439,493 102,147 738 1,542,378 962,589 51,928 1,602 1,016,119 526,259 10-20
- Office 5,402 - (2,149) 3,253 4,299 215 (2,123) 2,391 862 20
Test Tracks other buildings 62,052 - 1,411 63,463 20,827 8,423 521 29,771 33,692 20
Plant and machinery 7,176,669 113,004 (65,452) 7,224,221 5,955,836 316,228 (65,452) 6,206,612 1,017,609 8 Years
Welding guns 356,114 - (1,895) 354,219 304,484 24,624 (1,895) 327,213 27,006 4 Years
Waste water treatment plant 120,222 - - 120,222 120,222 - - 120,222 - 8 Years
Permanent and special tools 430,708 7,876 (3,541) 435,043 384,910 19,763 (3,518) 401,155 33,888 4 Years
Dies 2,791,459 10,655 - 2,802,114 2,311,519 168,230 - 2,479,749 322,365 5 Years
Jigs and fixtures 774,330 6,264 (1,335) 779,259 551,782 69,450 (1,296) 619,936 159,323 5 Years
Vendor Tooling (Note 4.1.1) - 626,561 - 626,561 - 151,957 - 151,957 474,604 5 Years
Electrical installations 263,787 183 - 263,970 191,259 15,620 - 206,879 57,091 8 Years
Furniture and fittings 17,370 3,312 (181) 20,501 11,826 1,519 (170) 13,175 7,326 20
Vehicles 590,344 45,805 (90,967) 545,182 312,473 57,371 (67,100) 302,744 242,438 20
Air conditioners and refrigerators 25,080 21,419 (3,470) 43,029 12,436 4,995 (2,933) 14,498 28,531 20
Office equipment 83,014 12,339 (8,824) 86,529 53,391 7,479 (7,574) 53,296 33,233 20
Computers 167,720 7,374 (23,962) 151,132 125,137 22,895 (23,809) 124,223 26,909 50
15,509,479 1,085,296 (199,627) 16,395,148 11,457,215 935,714 (173,747) 12,219,182 4,175,966
4.1.1 Vendor tooling having book value of Rs. 1,614.77 million (2016: 474.604 million) are in the possession of seventy eight (78) vendors dispersed all over Pakistan.
Annual Report 2017 81

Notes to the Financial Statements For the year ended 31 December 2017
4.2 Depreciation charge for the year has been allocated as under: Note 2017 2016 (Rupees in ‘000)
Cost of goods manufactured 24.1 1,239,912 838,988 Administrative expenses 26 122,889 96,726
1,362,801 935,714
4.3 Disposal of operating fixed assets Accumulated Written down Sales Gain / Mode of Particulars Cost depreciation value proceeds (loss) disposal of buyers
--------------------------------- (Rupees in ‘000)---------------------------------
Aggregate value of items where book value having book value exceeding Rs. 50,000
VehiclesSuzuki Vehicles Cars & 30,989 20,858 10,131 18,947 8,816 Company Company
Motorcycles (31 Vehicles) Policy Employees
Suzuki Vehicles Cars & 33,285 19,902 13,383 19,657 6,274 Negotia-tions
Various Motorcycles (28 Vehicles) parties
Suzuki Vehicles Cars & 3,087 1,144 1,943 2,913 970 Insurance EFUMotorcycles (3 Vehicles) claim
Plant and MachineryParts & Tools for Cylinder
machining centre 5,879 5,083 796 - (796) Scrapped -
Cylinder Machining Centre engine shop
8,157 7,053 1,104 - (1,104) Scrapped -
DiesTuner Assy (MC) 320 203 117 - (117) Scrapped -
Aggregate value of items where WDV is less than Rs. 50,000
5,026 4,194 832 1,210 378 Company policies /
negotiations /tender
Company employees
/various parties
97,467 97,304 163 - (163) Scrapped -
2017 184,210 155,741 28,469 42,727 14,258
2016 199,627 173,747 25,880 71,716 45,836
Pak Suzuki Motor Company Limited82

F I N A N C I A L
Accounts
4.4 Capital work-in-progress 2017 2016 (Rupees in ‘000)
Plant and machinery 1,171,576 1,889,499 Civil works 516,583 606,592 Advance for capital expenditure 43,772 -
1,731,931 2,496,091
4.4.1 Movement in capital work-in-progress
Opening balance 2,496,091 458,525 Additions during the year 3,396,350 2,427,357 Transfer to operating fixed assets (4,160,510) (389,791)Closing balance 1,731,931 2,496,091
5. INTANGIBLE ASSETS
Years Cost as at 01 January
2017
Additions Cost as at 31 December
2017
Accumulated amortisation
at 01 January 2017
Charge for the year
Accumulated amortisation
as at 31 December
2017
Book value as at 31
December 2017
------------------------------------------------ (Rupees in ‘000) ------------------------------------------------
License fees and drawings 3 191,920 191,020 382,940 181,257 58,417 239,674 143,266 Softwares 3 83,383 4,884 88,267 21,427 24,773 46,200 42,067 2017 275,303 195,904 471,207 202,684 83,190 285,874 185,333
Years Cost as at 01 January
2016
Additions Cost as at 31 December
2016
Accumulated amortisation
at 01 January 2016
Charge for the year
Accumulated amortisation
as at 31 December
2016
Book value as at 31
December 2016
------------------------------------------------ (Rupees in ‘000) ------------------------------------------------
License fees and drawings 3 191,920 - 191,920 117,284 63,973 181,257 10,663 Softwares 3 21,147 62,236 83,383 12,495 8,932 21,427 61,956 2016 213,067 62,236 275,303 129,779 72,905 202,684 72,619
5.1 Amortisation charge has been allocated as under: Note 2017 2016------- (Rupees in ‘000’) -------
Cost of goods manufactured 24.1 58,417 63,973 Administrative expenses 26 24,773 8,932
83,190 72,905
Annual Report 2017 83
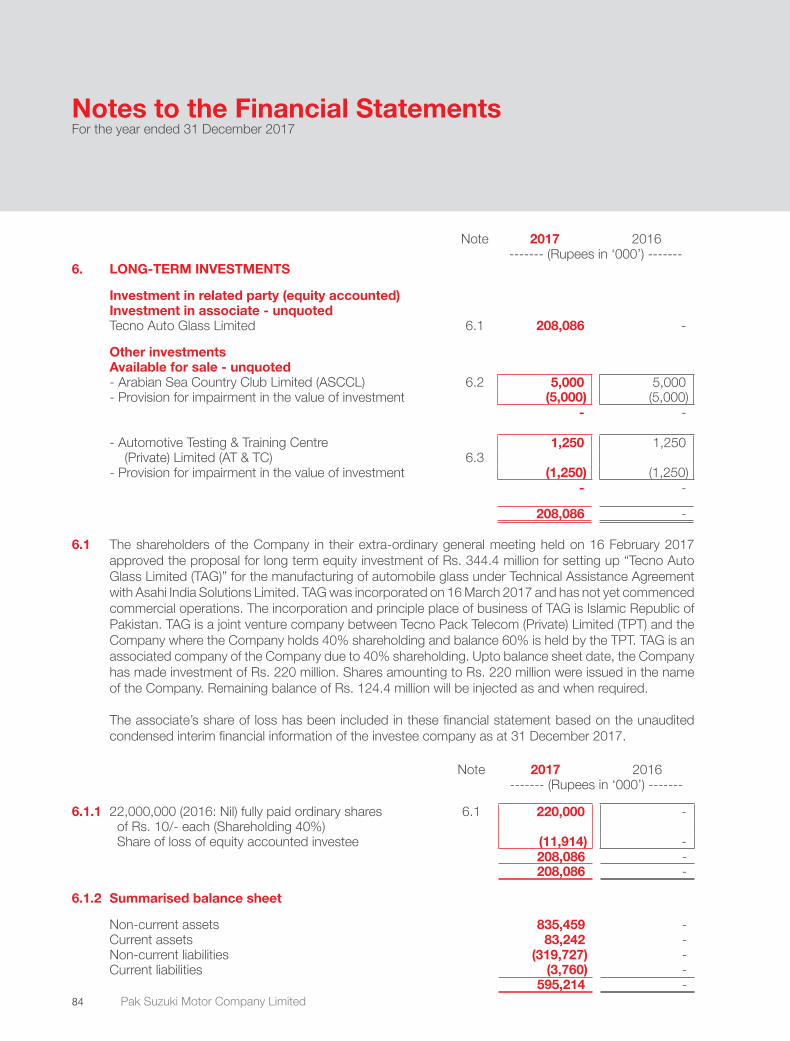
Notes to the Financial Statements For the year ended 31 December 2017
Note 2017 2016------- (Rupees in ‘000’) -------
6. LONG-TERM INVESTMENTS
Investment in related party (equity accounted)Investment in associate - unquotedTecno Auto Glass Limited 6.1 208,086 -
Other investmentsAvailable for sale - unquoted- Arabian Sea Country Club Limited (ASCCL) 6.2 5,000 5,000 - Provision for impairment in the value of investment (5,000) (5,000)
- -
- Automotive Testing & Training Centre 1,250 1,250 (Private) Limited (AT & TC) 6.3
- Provision for impairment in the value of investment (1,250) (1,250) - -
208,086 -
6.1 The shareholders of the Company in their extra-ordinary general meeting held on 16 February 2017 approved the proposal for long term equity investment of Rs. 344.4 million for setting up “Tecno Auto Glass Limited (TAG)” for the manufacturing of automobile glass under Technical Assistance Agreement with Asahi India Solutions Limited. TAG was incorporated on 16 March 2017 and has not yet commenced commercial operations. The incorporation and principle place of business of TAG is Islamic Republic of Pakistan. TAG is a joint venture company between Tecno Pack Telecom (Private) Limited (TPT) and the Company where the Company holds 40% shareholding and balance 60% is held by the TPT. TAG is an associated company of the Company due to 40% shareholding. Upto balance sheet date, the Company has made investment of Rs. 220 million. Shares amounting to Rs. 220 million were issued in the name of the Company. Remaining balance of Rs. 124.4 million will be injected as and when required.
The associate’s share of loss has been included in these financial statement based on the unaudited condensed interim financial information of the investee company as at 31 December 2017.
Note 2017 2016------- (Rupees in ‘000’) -------
6.1.1 22,000,000 (2016: Nil) fully paid ordinary shares 6.1 220,000 - of Rs. 10/- each (Shareholding 40%)Share of loss of equity accounted investee (11,914) -
208,086 - 208,086 -
6.1.2 Summarised balance sheet
Non-current assets 835,459 - Current assets 83,242 - Non-current liabilities (319,727) - Current liabilities (3,760) -
595,214 - Pak Suzuki Motor Company Limited84

F I N A N C I A L
Accounts
6.1.3 Summarised statement of profit or loss and comprehensive income
2017 2016------- (Rupees in ‘000’) -------
Revenue - -
Loss for the period 29,785 -
Other comprehensive income - -
Total comprehensive income (29,785) -
6.2 Investment in ASCCL (unquoted) represents 0.5 million (2016: 0.5 million) fully paid ordinary shares of Rs. 10 each, representing 6.45% (2016: 6.45%) of ASCCL’s paid up share capital as at 31 December 2017.
6.3 Investment in AT & TC (unquoted) represents 0.125 million (2016: 0.125 million) fully paid ordinary shares of Rs. 10 each, representing 6.94% (2016: 6.94%) of AT & TC’s paid up share capital as at 31 December 2017.
Note 2017 20167. LONG-TERM LOANS - secured, considered good ------- (Rupees in ‘000’) -------
Loans to employees 7.1 4,327 2,636 Less: Receivable within one year 14 (1,966) (1,476)
2,361 1,160
7.1 This represents interest free personal loans to employees. These are repayable in maximum thirty six equal monthly installments.
8. LONG-TERM DEPOSITS, PREPAYMENTS AND Note 2017 2016OTHER RECEIVABLES ------- (Rupees in ‘000’) -------
Deposits and prepayments 30,681 28,747
Other receivables from employees 8.1 351,372 267,667 less: Receivable within one year (54,734) (38,311)
296,638 229,356 327,319 258,103
8.1 This represent receivables against vehicles given to employee under the Vehicle Ownership Employee Scheme. These receivables are secured against the personnel guarantees and provident fund balances of the respective employees. These are receivables in maximum eighty-four equal monthly installments.
Annual Report 2017 85

Notes to the Financial Statements For the year ended 31 December 2017
Note 2017 20169. LONG TERM INSTALLMENT SALES ------- (Rupees in ‘000’) -------
RECEIVABLES - secured, considered good
Installment sales receivables 9.1 509,639 441,630 Less: Unearned finance income (28,961) (42,740)
480,678 398,890 Less: Provision for doubtful receivables 9.2 (14,903) (11,603)
465,775 387,287 Less: Current maturity (320,996) (291,254)
144,779 96,033
9.1 This represent balances receivable under various installment sale agreements in equal monthly installments. It includes installment sales to customers (motorcycles) and registered vendors of the Company. In case of installment sales to customers, the Company retains the title and registers the documents of the motorcycles in its name as a security. For installment sales to vendors, vehicles are lien marked and registered in joint names of vendor and the Company. Such documents are retained in Company’s custody and transferred in the name of customer / vendor after the entire dues are cleared. Mark-up on installment sales receivables ranges from 12% to 28% (2016: 12% to 28%) per annum, excluding up to 18 months installment sales which are subject to 0% markup. However, overdue rentals are subject to additional surcharge. The gross amount and the present value of the installment sales receivables are as follows:
Gross amount of installment
sales receivables
Present value of installment sales
receivables2017 2016 2017 2016
--------------------- (Rupees in 000) ---------------------
Less than one year 343,024 323,759 320,996 291,254 One to five years 166,615 117,871 159,682 107,636
509,639 441,630 480,678 398,890 Less: Provision for doubtful receivables (14,903) (11,603) (14,903) (11,603)
494,736 430,027 465,775 387,287
9.1.1 Includes an overdue portion of installment sales receivables of Rs. 4.335 million (2016: Rs. 9.265 million).
9.2 Provision for doubtful installment sales receivables Note 2017 2016------- (Rupees in ‘000’) -------
Balance at beginning of the year 11,603 21,765 Provision / (reversal) during the year 26 3,300 (466)Written-off during the year - (9,696)Balance at end of the year 14,903 11,603
Pak Suzuki Motor Company Limited86

F I N A N C I A L
Accounts
10. DEFERRED TAXATION Note 2017 2016------- (Rupees in ‘000’) -------
Deductible temporary differences arising from:Provisions 338,000 105,500 Local development costs 17,500 38,500 Accelerated tax depreciation - 89,750
355,500 233,750 Taxable temporary differences arising from:Accelerated tax depreciation (119,000) -
236,500 233,750
11. STORES, SPARES AND LOOSE TOOLS
Stores 72,531 66,607 Spares 80,708 69,558 Loose tools 17,498 19,564
170,737 155,729 Less: Provision for slow moving and obsolete items- at beginning of the year 44,723 42,235 - provision for the year 24.1 11,225 2,488
55,948 44,723 114,789 111,006
12. STOCK-IN-TRADE
Raw material and components [including items in transitRs. 5,732.93 million (2016: Rs. 2,974.72 million)] 11,785,859 8,147,650
Less: Provision for slow moving and obsolete items- at beginning of the year 35,639 35,326 - (reversal) / provision for the year (4,195) 313
31,444 35,639
11,754,415 8,112,011
Work-in-process 70,600 83,499 Finished goods 8,499,570 6,479,613
Trading stocks [Including items in transit Rs. 742.71 million (2016: Rs. 28.63 million)] 3,687,259 1,635,225
Less: Provision for slow moving and obsolete items- at beginning of the year 21,740 50,040 - provision / (reversal) for the year 44,046 (28,300)
65,786 21,740 3,621,473 1,613,485
23,946,058 16,288,608
Annual Report 2017 87

Notes to the Financial Statements For the year ended 31 December 2017
12.1 Of the aggregate amount, stock in trade worth Rs. 7,867.55 million (2016: Rs. 5,381.95 million) were in the custody of dealers and vendors dispersed all over Pakistan.
12.2 Raw material and components, work-in-process and trading stocks have been written down by Rs. Nil,
Rs. Nil and Rs. 106.38 million (2016: Rs. 1.55 million, Rs. 0.03 million and Rs. 2.62 million) respectively to arrive at net realizable value.
13. TRADE DEBTS Note 2017 2016------- (Rupees in ‘000’) -------
Considered good - secured 162,594 1,124,867 Considered good - unsecured 48,764 80,402 Considered doubtful 60,512 88,440
271,870 1,293,709
Less: Provision for doubtful debts 13.1 (60,512) (88,440)
211,358 1,205,269
13.1 Provision for doubtful trade debts
Balance at the beginning of the year 88,440 9,371 (Reversal) / provision for the year 26 (27,928) 79,069 Balance at the end of the year 60,512 88,440
13.2 Ageing of trade debts2017
Gross Impairment Total ------------ (Rupees in ‘000) ------------
Not past due 10,139 - 10,139 Past due 91-180 days 4,137 - 4,137 Past due 181-360 days 812 (12,329) (11,517)Past due over 360 days 256,782 (48,183) 208,599
271,870 (60,512) 211,358
2016Gross Impairment Total
------------ (Rupees in ‘000) ------------
Not past due 356,525 - 356,525 Past due 91-180 days 652,301 - 652,301 Past due 181-360 days 143,904 - 143,904 Past due over 360 days 140,979 (88,440) 52,539
1,293,709 (88,440) 1,205,269
Pak Suzuki Motor Company Limited88

F I N A N C I A L
Accounts
14. LOANS AND ADVANCES Note 2017 2016------- (Rupees in ‘000’) -------
Loans - secured, considered goodCurrent portion of loans to employees 7 1,966 1,476
Advances - unsecured, considered good- Suppliers / vendors 14.1 32,168 161,034 - Employees 3,347 509
35,515 161,543 37,481 163,019
14.1 This includes advances to vendors of Rs. Nil (2016: Rs. 12.846 million, which carry mark-up ranging from 12% - 12.58% per annum).
15 TRADE DEPOSITS AND PREPAYMENTS Note 2017 2016------- (Rupees in ‘000’) -------
Trade deposits 12,437 2,575
Prepayments:- Collector of customs 637,593 34,373 - Rent 33,461 28,489 - Insurance 2,371 2,200 - Others 26,599 9,492
700,024 74,554 Margin against letter of credit 253,261 -
965,722 77,129
16 OTHER RECEIVABLES - considered good
Due from related parties 16.1 42,403 84,705 Due from vendors for material / components returned 9,420 11,573 Duty draw back 1,604 3,019 Expenses recoverable from dealers 21,107 5,401 Current portion of long term other receivables 8 54,734 38,311 Others 18,507 24,297
147,775 167,306
16.1 This includes receivable from SMC - Japan amounting to Rs. 41.709 million (2016: Rs. 84.011 million) and from Suzuki Indomobil Company amounting to Rs. 0.694 million (2016: 0.694 million).
Annual Report 2017 89

Notes to the Financial Statements For the year ended 31 December 2017
Note 2017 201617 CASH AND BANK BALANCES ------- (Rupees in ‘000’) -------
Cash in hand 9,332 8,217 Cheques in hand 17.1 1,254,462 915,784
Cash at bank:- In deposit accounts 17.2 7,713,688 6,995,812 - In a special deposit account 17.3 102,955 96,955 - In current accounts 109,115 531,525
7,925,758 7,624,292 9,189,552 8,548,293
17.1 Represents cheques that were received on the last day and were deposited on the next working day.
17.2 These carry profits rates ranging from 5.80% to 6.75% (2016: 6% to 7.2%) per annum.
17.3 A special account is maintained in respect of security deposits (note 20) in accordance with the re-quirements of Section 217 of the Companies Act, 2017.
18 ISSUED, SUBSCRIBED AND PAID UP SHARE CAPITAL
Fully paid ordinary shares of Rs. 10/- each
2017 2016 2017 2016(Number of shares) ------- (Rupees in ‘000’) -------
45,517,401 45,517,401 Issued for cash 455,174 455,174 2,800,000 2,800,000 Issued for consideration other than cash 28,000 28,000
33,982,450 33,982,450 Issued as fully paid bonus shares 339,825 339,825 82,299,851 82,299,851 822,999 822,999
18.1 The Holding Company held 60,154,091 (2016: 60,154,091 ) ordinary shares of Rs. 10/- each, constituting 73.09% (2016: 73.09%) holding in the Company.
Pak Suzuki Motor Company Limited90

F I N A N C I A L
Accounts
19 TRADE AND OTHER PAYABLES Note 2017 2016------- (Rupees in ‘000’) -------
Creditors 1,991,718 1,353,778 Bills payable 19.1 3,755,163 1,142,642 Accrued liabilities 2,075,261 1,446,937 Royalties and technical fee payable to the Holding Company 908,110 593,254 Mark-up on waiting for delivery of vehicles 3,679 3,679 Provision for unexpired free service and warranty period 19.2 87,197 67,862 Dealers’ commission payable 1,082,129 618,732 Provision for Infrastructure Development Cess 790,783 487,481 Workers’ profit participation fund 19.3 1,660 17,443 Workers’ Welfare Fund 114,631 96,100 Retention money 6,818 3,628 Unclaimed dividend 14,137 14,588 Deposits from employees against purchase of vehicles 48,452 51,603 Payable to gratuity fund 19.4 94,920 61,902 Un-earned income - extended warranty 81,784 101,636 Others 335,510 238,858
11,391,952 6,300,123
19.1 Include Rs. 1,861.425 million (2016: Rs. 776.995 million) due to the Holding Company and Rs. 1,848.936 million (2016: Rs. 310.065 million) due to other related parties.
19.2 Provision for unexpired free service and warranty period
Note 2017 2016------- (Rupees in ‘000’) -------
Balance at the beginning of the year 67,862 84,753 Provision / (reversal) for the year 25 19,335 (16,891)Balance at the end of the year 87,197 67,862
19.3 Workers’ Profit Participation Fund
Balance at beginning of the year 17,443 16,876 Interest on funds utilised in the Company’s business 29 1,597 2,601
19,040 19,477 Allocation for the year 27 301,660 237,442
320,700 256,919 Less: Paid during the year 319,040 239,476 Balance at end of the year 1,660 17,443
19.4 Payable to gratuity fund 94,920 61,902
19.4.1 The latest actuarial valuation was carried out as at 31 December 2017 using the Projected Unit Credit Method.
Annual Report 2017 91

Notes to the Financial Statements For the year ended 31 December 2017
2017 201619.4.2 Amount recognised in the balance sheet ------- (Rupees in ‘000’) -------
Present value of defined benefit obligation 536,351 483,074 Fair value of plan assets (452,257) (421,172)Benefits due but not paid (payables) 10,826 -
94,920 61,902 19.4.3 Amounts recognized in total comprehensive income
The following amounts have been charged in respect of these benefits to profit and loss account and
other comprehensive income:
2017 2016------- (Rupees in ‘000’) -------
Component of defined benefit costs recognised in profit and loss account
Current service cost 39,736 35,131 Interest cost on defined benefit obligation 36,228 36,566 Return on plan assets (33,694) (33,060)
42,270 38,637 Component of defined benefit costs (re-measurement)
recognised in other comprehensive incomeRe-measurements: Actuarial (gain) / loss on obligation - (Gain) / loss due to change in financial assumptions (13,842) (496) - (Gain) / loss due to change in demographic assumptions - - - (Gain) / loss due to change in experience adjustments 51,596 21,740
37,754 21,244
Return on plan assets excluding interest income 2,609 (20,776) 40,363 468
Total defined benefit cost recognised in profit and loss account and other comprehensive income 40,363 468
Expected contribution in the following year 50,793 47,702
Weighted average duration of the defined benefit obligation (years) 9 9
19.4.4 Movement in net liability recognised in the balance sheet
Opening balance 61,902 55,117 Expense recognised during the year 42,270 38,637 Re-measurement loss recognized in other Comprehensive income 40,363 468 Contribution made by the Company during the year (49,615) (32,320)Closing balance 94,920 61,902
Pak Suzuki Motor Company Limited92

F I N A N C I A L
Accounts
2017 2016------- (Rupees in ‘000’) -------
19.4.5 Movement in present value of defined benefit obligation
Opening balance 483,074 422,453 Current service cost 39,736 35,131 Interest cost on defined benefit obligation 36,228 36,566 Benefits due but not paid (payables) (10,826) - Benefit paid (49,615) (32,320)Remeasurement loss on defined benefit obligation 37,754 21,244 Closing balance 536,351 483,074
19.4.6 Movement in fair value of plan assets
Opening balance 421,172 367,336 Contributions (49,615) 32,320 Return on plan assets 33,694 33,060 Benefit paid 49,615 (32,320) Remeasurement (loss) / gain on plan assets (2,609) 20,776 Closing balance 452,257 421,172
------- (Percentage) -------19.4.7 Principle actuarial assumption used are as follows
Discount rate used for profit and loss charge 8.00 9.00 Discount rate used for year-end obligation 8.25 8.00 Expected rate of eligible salaries increase in future years 8.25 8.00
19.4.8 Actual return on plan assets ------- (Rupees in ‘000’) -------
Expected return on plan assets 33,694 33,060 Remeasurement (loss) / gain on plan assets (2,609) 20,776
31,085 53,836
19.4.9 Analysis of present value of defined benefit obligation
Type of Members: - Management 442,311 393,548 - Non - management 94,040 89,526
536,351 483,074
19.4.10 Major categories / composition of plan assets are as follows
Government securities 340,287 287,446 Mutual funds 76,615 107,157 Term deposit receipts 34,373 26,328 Bank balances 982 241
452,257 421,172
Annual Report 2017 93

Notes to the Financial Statements For the year ended 31 December 2017
19.4.11 Sensitivity analysis
Reasonably possible changes at the reporting date to one of the relevant actuarial assumptions, holding other assumptions constant, would have affected the defined benefit obligation by the amounts shown below.
Note 2017 2016------- (Rupees in ‘000’) -------
Discount rate + 1% 489,601 442,226 Discount rate - 1% 591,044 530,892 Long term salary increase + 1% 591,232 530,948 Long term salary decrease - 1% 488,561 441,407
20 SECURITY DEPOSITS
Deposits against display of vehicles 20.1 4,430,397 3,540,609 Dealership deposits 17.3 102,955 96,955 Others 67,200 35,600
4,600,552 3,673,164
20.1 Represents the amount deposited by the dealers as security against the vehicles delivered to them for display.
21 PROVISION FOR CUSTOM DUTIES AND SALES TAX
Revenue Receipts Auditors – Government of Pakistan conducted an audit in the year 2001 and alleged that the Company short paid Rs. 120 million on account of custom duties and sales tax against royalty during the period from July 1997 to February 1999. According to clause 2(d) of Section 25 of the Customs Act, 1969, payment in the nature of royalty without which goods cannot be legitimately imported and sold or used in Pakistan are to be included in value for import purpose. The Company paid Rs. 33.677 million after reconciliation with the Collector - Customs in prior years. Despite reconciliation, Deputy Collector – Customs adjudicated to pay balance amount of Rs. 86.323 million. The Company filed an appeal before the Customs Appellate Tribunal which was disallowed in the year 2015. Consequently, the Company filed Reference Application in the Sindh High Court which is pending for adjudication. Further, in 2015, the Customs Authorities adjusted Rs. 50.02 million against the above demand.
22 CONTINGENCIES AND COMMITMENTS
22.1 Capital expenditure contracted for but not incurred amounted to Rs. 4,408.498 million (2016: Rs. 1,344.793 million).
22.2 The facilities for opening letters of credit as at 31 December 2017 amounted to Rs. 12,608 million (2016: 12,496 million) of which the amount remaining unutilised at December end was Rs. 9,835.882 million (2016: 11,316.704 million).
Pak Suzuki Motor Company Limited94

F I N A N C I A L
Accounts
22.3 Guarantees issued by three commercial banks on behalf of the Company amounted to Rs. 965.048 million (2016: Rs. 562.503 million).
22.4 The Company has issued a corporate guarantee on behalf of Tecno Auto Glass Limited, associated company, amounting to Rs. 600 million to Meezan Bank Limited in relation to borrowing facilities granted to the associated company.
23 SALES Note 2017 2016------- (Rupees in ‘000’) -------
Manufactured goods 23.1 96,072,235 74,048,034 Trading stocks 23.2 5,739,376 2,468,006
101,811,611 76,516,040
23.1 Manufactured goods
- Vehicles 118,485,949 90,716,888 - Spare parts 498,824 410,087
23.3 118,984,773 91,126,975
Less: Sales tax 17,309,530 13,225,981 Discounts 426,491 197,470 Sales commission to dealers 5,176,517 3,655,490
22,912,538 17,078,941 96,072,235 74,048,034
23.2 Trading stocks
- Vehicles 4,377,976 611,987 - Spare parts 2,322,580 2,142,036
6,700,556 2,754,023
Less: Sales tax 806,870 239,106 Discounts 46,851 37,364 Sales commission to dealers 107,459 9,547
961,180 286,017 5,739,376 2,468,006
23.3 These include export sales of Rs. 64.435 million (2016: Rs. 55.722 million).
Annual Report 2017 95

Notes to the Financial Statements For the year ended 31 December 2017
Note 2017 201624 COST OF SALES ------- (Rupees in ‘000’) -------
Manufactured goodsFinished goods at beginning of the year 6,479,613 4,742,602 Cost of goods manufactured 24.1 89,284,726 68,939,831 Export expenses 23,468 3,911
95,787,807 73,686,344 Less: Finished goods at end of the year 8,499,570 6,479,613
87,288,237 67,206,731 Trading stocks
Stocks at beginning of the year 1,613,485 511,165 Purchases during the year 6,878,789 3,063,052
8,492,274 3,574,217 Less: Stocks at end of the year 3,621,473 1,613,485
4,870,801 1,960,732
92,159,038 69,167,463
Pak Suzuki Motor Company Limited96

F I N A N C I A L
Accounts
24.1 Cost of goods manufactured Note 2017 2016------- (Rupees in ‘000’) -------
Raw materials and components at beginning of the year 8,112,011 7,663,315 Purchases during the year 24.1.1 86,441,330 64,257,884
94,553,341 71,921,199 Less: Raw materials and components at end of the year 11,754,415 8,112,011
Raw materials and components consumed 82,798,926 63,809,188
Stores and spares consumed 67,347 48,559 Provision for slow moving and obsolete
stores, spares and loose tools 11 11,225 2,488 Utilities 401,955 311,438 Vehicle running expenses 23,023 21,184 Salaries, wages and other benefits 24.1.2 1,291,041 1,177,230 Outsourced job contractor charges 958,360 765,352 Rent, rates and taxes 19,660 19,403 Travelling 65,002 62,547 Training 17,915 6,295 Insurance 9,650 7,989 Repairs and maintenance 461,045 373,429 Royalty 1,231,754 850,791 Technical fee 222,621 224,985 Travelling expenses of supervisors 2,792 2,771 Provision / (reversal) of provincial sales tax on
royalty and technical fees 160,094 (146,324)Depreciation 4.2 1,239,912 838,988 Amortisation 5.1 58,417 63,973 Conveyance and transportation 298,750 258,815 Communication 2,966 3,440 Hired security guards services 14,921 14,630 Local development costs 39,143 161,589 Printing and stationery 587 5,818 Others 10,967 6,755
6,609,147 5,082,145 89,408,073 68,891,333
Add: Work-in-process at beginning of the year 83,499 167,365 89,491,572 69,058,698
Less: Work-in-process at end of the year 70,600 83,499 89,420,972 68,975,199
Less: Cost of own used vehicles 136,246 35,368 89,284,726 68,939,831
24.1.1 Purchases are stated net of proceeds from the sale of packing materials Rs. 184.219 million (2016: Rs. 182.265 million).
24.1.2 Include Rs. 21.231 million (2016: Rs. 19.361 million) and Rs. 26.320 million (2016: Rs. 24.422 million)
in respect of provident fund and gratuity fund respectively.
Annual Report 2017 97

Notes to the Financial Statements For the year ended 31 December 2017
25 DISTRIBUTION AND SELLING COSTS Note 2017 2016------- (Rupees in ‘000’) -------
Transportation and handling charges 1,386,950 1,145,162 Advertising and sales promotion 1,049,997 568,268 Free service 223,901 219,023 Warranty claims 75,765 53,475 Provision / (reversal) for unexpired free service and warranty period 19.2 19,335 (16,891)Royalty on trading spare parts 45,809 39,615 Provision / (reversal) of provincial sales tax on royalty and technical fees 2,499 (4,367)
2,804,256 2,004,285
26 ADMINISTRATIVE EXPENSES
Salaries, wages and other benefits 26.1 772,697 719,531 Outsourced job contractor charges 176,957 147,627 Travelling 92,504 96,856 Training 9,722 3,414 Hired security guards services 38,021 35,364 Rent, rates and taxes 83,548 82,128 Utilities 23,481 21,348 Vehicle running expense 56,181 46,173 Insurance 12,782 13,288 Repairs and maintenance 43,258 36,206 Depreciation 4.2 122,889 96,726 Amortization 5.1 24,773 8,932 Auditors’ remuneration 26.2 3,683 3,056 Legal and professional charges 15,287 25,847 Conveyance and transportation 54,515 42,743 Entertainment 2,134 567 Celebration of special events 14,538 15,070 Printing and stationery 31,274 25,158 Communication 16,090 14,251 Directors’ fees 190 67 Provision / (reversal) for doubtful: - installment sales receivables 9.2 3,300 (466) - trade debts 13.1 (27,928) 79,069 - other receivables 3,255 - Trade debts written-off 897 1,724 Computer software licence fee and ERP maintenance charges 10,306 11,261 CSR contribution 3,932 4,057 Public relation activities 174 6,345 Others 11,355 3,248
1,599,815 1,539,590
26.1 Includes Rs. 13.350 million (2016: Rs. 11.581 million) and Rs 15.950 million (2016: Rs.14.215 million) in respect of defined contributory provident fund and gratuity fund respectively.
Pak Suzuki Motor Company Limited98

F I N A N C I A L
Accounts
26.2 Auditors’ remuneration Note 2017 2016------- (Rupees in ‘000’) -------
Audit fee 1,500 1,500 Half-yearly review 450 450 Fee for corporate governance certificate 110 110 Fee for special certifications 1,428 878 Out of pocket expenses 195 118
3,683 3,056
27 OTHER EXPENSES
Workers’ Profit Participation Fund 19.3 301,660 237,442 Workers’ Welfare Fund 112,337 96,100
413,997 333,542
28 OTHER INCOME
Income from financial assetsProfit on bank accounts 695,180 853,974 Commission income 28.1 500 - Finance income on installment sales 42,242 61,274
737,922 915,248 Income from non-financial assetsGain on disposal of fixed assets 4.3 14,258 45,836 Extended warranty income 50,833 20,662 Scrap sales 11,717 15,987 Miscellaneous income 49,981 42,118
126,789 124,603 864,711 1,039,851
28.1 This represent commission income on corporate guarantee provided to Meezan Bank Limited on behalf of Tecno Auto Glass Limited, associated company, amounting to Rs. 600 million in relation to borrowing facilities granted to the associated company.
Note 2017 201629. FINANCE COSTS ------- (Rupees in ‘000’) -------
Mark-up on short term borrowings - 593 Markup on Workers’ Profit Participation Fund 19.3 1,597 2,601 Exchange loss - net 38,634 76,356 Bank charges 27,857 16,225
68,088 95,775
Annual Report 2017 99

Notes to the Financial Statements For the year ended 31 December 2017
Note 2017 2016------- (Rupees in ‘000’) -------
30. TAXATION
Current- for the year 1,465,000 1,688,000 - prior year 30.3 331,143 (6,149)Deferred (2,750) (39,250)
1,793,393 1,642,601
30.1 Income tax assessment of the Company has been deemed to be finalised upto and including tax year 2017 on the basis of tax return filed under section 120 of Income Tax Ordinance 2001. However, the return may be selected for detailed audit within five years from the date of filing of return and the Income Tax Commissioner may amend the assessment if any objection is raised in audit.
30.2 Reconciliation between tax expense and accounting profit 2017 2016------- (Rupees in ‘000’) -------
Accounting profit for the year before taxation 5,619,214 4,415,236
Corporate tax rate 30% 31%
Tax on accounting profit at applicable rate 1,685,764 1,368,723 Tax effect of:- Prior year 331,143 (6,149)- tax credits, rebates etc. (350,478) (79,830)- income assessed under Final Tax Regime 43,917 31,334 - effect of super tax 145,000 277,000 - others (61,953) 51,523
1,793,393 1,642,601
30.3 The Finance Act, 2017 has introduced tax on every public company at the rate of 7.5% of its profit before tax from the accounting year 2016. However, this tax shall not apply incase of a public company which distribute atleast 40% of its after tax profit within six month of the end of the tax year through cash or bonus shares. The Company has obtained an interim stay order from the Honorable Sindh High Court against the said provision of the law. However, as a matter of prudence, the Company has provided tax provision at the rate of 7.5% on the profit before tax of accounting year 2016 (tax year 2017).
Pak Suzuki Motor Company Limited100

F I N A N C I A L
Accounts
2017 2016------- (Rupees in ‘000’) -------
31. EARNINGS PER SHARE - basic and diluted
31.1 Basic
Profit for the year 3,825,821 2,772,635
(Number of shares in ‘000)Weighted average number of ordinary shares in
issue during the year 82,300 82,300
(Rupees)
Basic earnings per share 46.49 33.69
31.2 A diluted earnings per share has not been presented as the Company did not have any convertible instruments in issue as at balance sheet date which would have any effect on the earnings per share if the option to convert is exercised.
Note 2017 2016------- (Rupees in ‘000’) -------
32. CASH GENERATED FROM OPERATIONS
Profit before taxation 5,619,214 4,415,236 Adjustments for non cash charges and other items:Depreciation 1,362,801 935,714 Amortisation 83,190 72,905 Gain on disposal of fixed assets (14,258) (45,836)Share of loss of equity accounted investee 11,914 - Profit on bank accounts (695,180) (853,974)Finance costs 68,088 95,775
816,555 204,584 Working capital changes 32.1 2,752,809 (5,371,732)
9,188,578 (751,912)
Annual Report 2017 101

Notes to the Financial Statements For the year ended 31 December 2017
32.1 Working capital changes 2017 2016------- (Rupees in ‘000’) -------
(Increase) / decrease in current assets:Stores, spares and loose tools (3,783) (12,205)Stock in trade (7,657,450) (3,204,161)Current portion of long-term installment sales receivables (29,742) 56,722 Trade debts 993,911 356,554 Loans and advances 125,538 31,913 Trade deposits and short-term prepayments (888,593) (6,267)Other receivables 19,531 (77,860)Sales tax and excise duty adjustable 507,616 (1,373,500)
(6,932,972) (4,228,804)Increase / (decrease) in current liabilitiesTrade and other payables 5,051,917 (146,862)Security deposits 927,388 1,604,803 Advance from customers 3,706,476 (2,600,869)
9,685,781 (1,142,928) 2,752,809 (5,371,732)
33 TRANSACTIONS WITH RELATED PARTIES Related parties of the Company include the Holding Company and related group companies, local
associated companies, staff retirement funds, directors and key management personnel. Transactions with related parties are entered into at commercial terms, as per the terms of employment and actuarial advice, as the case may be.
Amount due from and to related parties and remuneration of directors and executives are disclosed in
the relevant notes to the financial statements. Details of transactions with related parties, other than those which have been specifically disclosed elsewhere in these financial statements are as follows:
Holding Other relatedcompany parties Total
For the year ended 31 December 2017 ------------ (Rupees in ‘000) ------------
Purchases of components 26,428,989 20,470,455 46,899,444 Purchases of operating fixed assets 388,089 187,485 575,574 Purchases of intangible assets 191,020 - 191,020 Export sales 36,996 20,739 57,735 Royalties and technical fee 1,579,870 - 1,579,870 Travelling expenses of supervisors 6,606 - 6,606 Staff retirement benefits - 76,852 76,852 Sales promotional expenses and development expenses 22,578 - 22,578
Pak Suzuki Motor Company Limited102

F I N A N C I A L
Accounts
Holding Other relatedcompany parties Total
For the year ended 31 December 2016 ------------ (Rupees in ‘000) ------------
Purchases of components 25,131,250 5,572,219 30,703,469 Purchases of operating fixed assets 461,079 36,423 497,502 Export sales 19,168 1,302 20,470 Royalties and technical fee 1,115,391 - 1,115,391 Travelling expenses of supervisors 2,771 - 2,771 Staff retirement benefits - 69,579 69,579 Sales promotional expenses and development expenses 32,824 4,623 37,447
34 PLANT CAPACITY AND ACTUAL PRODUCTION 2017 2016------ (Number of vehicles) ------
Plant capacity - Motorcar (double shifts basis) 150,000 150,000 Plant capacity - Motorcycle (double shifts basis) 44,000 44,000
Actual production - Motorcar 132,725 111,979 Actual production - Motorcycle 19,603 18,374
34.1 Under utilization of capacity was due to lower demand of certain products.
35 REMUNERATION OF EXECUTIVES, DIRECTORS AND CHIEF EXECUTIVE The aggregate amounts charged in these financial statements in respect of remuneration including all benefits to chief executive, directors and executives of the Company are as follows:
2017 2016Chief Directors Executives Chief Directors Executives
Executive Executive------------------------------------- (Rupees in ‘000) -------------------------------------
Directors fees - 196 - - 67 - Managerial remuneration 14,597 14,340 350,688 13,273 9,032 270,341 Bonus 6,182 4,373 189,865 5,280 3,735 172,048 Retirement benefits - - 22,142 - - 16,070
20,779 18,909 562,695 18,553 12,834 458,459
Number of persons 2 4 157 1 2 110
35.1 The directors, chief executive and certain executives of the Company are provided with free use of Company maintained cars. Medical facility is also provided as per the Company’s policy.
Annual Report 2017 103

Notes to the Financial Statements For the year ended 31 December 2017
36 FINANCIAL RISK MANAGEMENT OBJECTIVES AND POLICIES The Company’s activities expose it to a variety of financial risk such as market risk, credit risk and liquidity
risk. The Company’s overall risk management focuses on the unpredictability of financial markets and seeks to minimize potential adverse effects on the Company’s financial performance. The Company’s Board of Directors oversees the management of these risk which are summarized below:
36.1 Market risk Market risk is the risk that the fair value of future cash flows of a financial instrument will fluctuate
because of changes in market prices. Market risk comprises of interest rate risk, currency risk and equity price risk.
(i) Interest rate risk
Interest rate risk is the risk that the fair value or future cash flows of a financial instrument will fluctuate because of changes in market interest rates. As of the balance sheet date, the Company had following interest bearing financial instruments:
2017 2016 (Rupees in ‘000)
Fixed rate financial instrumentsInstallment sales receivables 465,775 387,287 Advances to vendors - 12,846 Bank balances in deposit accounts 7,816,643 7,092,767
8,282,418 7,492,900
Fair value sensitivity analysis for fixed rate instruments
The Company does not account for any fixed rate financial assets and liabilities at fair value through profit and loss. Therefore a change in interest rates at the reporting date would not affect profit and loss account.
(ii) Currency risk
Currency risk is the risk that the fair value or future cash flows of a financial instrument will fluctuate due to changes in foreign exchange rates. It arises where receivables and payables exist due to transactions in foreign currency. The Company manages its exposure against foreign currency risk by entering into foreign exchange options whenever considered necessary. Open exposures are vigorously monitored. The Company is exposed to such risk in respect of the following:
Pak Suzuki Motor Company Limited104

F I N A N C I A L
Accounts
2017 2016 (Rupees in ‘000)
JPY - Japanese YenBills payable 1,903,314 888,384 Royalty and technical fees payable to the holding company 468,744 502,422 Due from related parties (8,256) (39,613)Net exposure 2,363,802 1,351,193
USD - US Dollar Bills payable 16,811 2,954 Export sales receivables (834) - Net exposure 15,977 2,954
RMB - Chinese Ren-Min-BiRMB - bills payable 1,432 2,263
At December 31, 2017 if Pak Rupee had depreciated / appreciated by 1% against JPY, US Dollar and RMB with all other variables held constant, Company’s profit before tax would have been Rs. 16.67 mil-lion (2016: Rs. 14.495 million) higher / lower as a result of exchange loss/gain on translation of foreign currency denominated financial instruments.
Other price risk
Other price risk is the risk that the fair value or future cash flows of a financial instrument will fluctuate because of changes in market prices (other than those arising from interest rate risk or currency risk). The Company is not exposed to other price risk.
36.2 Credit risk
Credit risk is the risk which arises with the possibility that one party to a financial instrument will fail to discharge its obligation and cause the other party to incur a financial loss. The Company attempts to control credit risk by monitoring credit exposures, limiting transactions with specific counterparties and continually assessing the creditworthiness of counterparties.
Concentrations of credit risk arise when a number of counterparties are engaged in similar business activities or have similar economic features that would cause their ability to meet contractual obligations to be similarly affected by changes in economic, political or other conditions. Concentrations of credit risk indicate the relative sensitivity of the Company’s performance to developments affecting a particular industry.
The Company seeks to minimize the credit risk exposure through having exposures only to customers considered credit worthy, allowing advances to vendors / suppliers who have long standing with Com-pany and placing deposits with banks with good rating. The maximum exposure to credit risk at the reporting date is:
Annual Report 2017 105

Notes to the Financial Statements For the year ended 31 December 2017
Trade debts 211,358 1,205,269 Installment sales receivable 465,775 387,287 Loans, advances, deposits and other receivables 1,153,339 666,717 Accrued profit on bank deposits 28,699 120,761 Bank balances 7,925,758 7,624,292
9,784,929 10,004,326
Trade debts and installment sales receivables
For trade debts and installment sales receivables, internal risk assessment process determines the credit quality of the customers. Taking into account their past experience, consideration of financial position, past track records and recoveries, the Company believes that appropriate impairment has been made and no impairment allowance is necessary in respect of unprovided amounts as there are reasonable grounds to believe that the amounts will be recovered in due course of time. When the recovery of theamount is considered uncertain by the management, a provision is made for the same. Known bad debts are written-off when they are identified. A general provision at the rate 3.5% of the balance of installment sales receivables is maintained to cater for any bad debts.
Bank balances
Bank balances are held with reputable banks with high quality credit ratings. At year end, the Company has bank balances with banks having credit ratings ranging from A1+ to A1.
36.3 Liquidity risk Liquidity risk is the risk that the company will not be able to meet its financial obligations as they fall due. The Company applies the prudent risk management policies by maintaining sufficient cash and bank balances and by keeping committed credit lines. The table below summarises the maturity profile of the Company’s financial liabilities at the following reporting dates:
Less than 3 month
Over 3 month Total
31 December 2017Trade and other payables 9,814,041 1,577,911 11,391,952 Advances from customers 2,864,778 2,467,170 5,331,948 Deposits against display of vehicles 50,651 4,379,746 4,430,397 Security deposits - 220,806 220,806
12,729,470 8,645,633 21,375,103
31 December 2016Trade and other payables 5,172,786 1,127,337 6,300,123 Advances from customers 1,625,472 - 1,625,472 Deposits against display of vehicles - 3,540,609 3,540,609 Security deposits - 132,555 132,555
6,798,258 4,800,501 11,598,759
Pak Suzuki Motor Company Limited106

F I N A N C I A L
Accounts
36.4 Capital risk management The primary objective of the Company’s capital management is to maintain healthy capital ratios, strong
credit rating and optimal capital structures in order to ensure ample availability of finance for its existing and potential investment projects, to maximize shareholder value and reduce the cost of capital.
The Company manages its capital structure and makes adjustment to it, in light of changes in economic
conditions. In order to maintain or adjust the capital structure, the Company may adjust the amount of dividends paid to shareholders, return capital to shareholders or issue new shares. The company is currently financing its operations through equity.
36.5 Fair value of financial instruments When measuring the fair value of an asset or a liability, the Company uses market observable data as far
as possible. Fair values are categorized into different levels in a fair value hierarchy based on the inputs used in the valuation techniques as follows:
Level 1: quoted prices (unadjusted) in active markets for identical assets or liabilities. Level 2: inputs other than quoted prices included in Level 1 that are observable for the asset or liability,
either directly (i.e. as prices) or indirectly (i.e. derived from prices). Level 3: inputs for the asset or liability that are not based on observable market data (unobservable
inputs). The following table shows the carrying amounts and fair values of financial assets and financial liabilities,
including their levels in the fair value hierarchy.
2017Carrying amount Fair Value
Loan Fair value- Other Level 1 Level 2 Level 3 and liabilities financial
receivables liabilities ----------------------------------------------- (Rupees) -----------------------------------------------
Financial assets notmeasured at fair value
Trade debts 211,358 - - - - - Installment sales receivable 465,775 - - - - - Loans, advances, deposits and
other receivables 1,153,339 - - - - - Accrued profit on bank deposits 28,699 - - - - - Bank balances 7,925,758 - - - - -
Financial liabilities notmeasured at fair value
Trade and other payables - - 11,391,952 - - - Security deposits - - 4,651,203 - - -
Annual Report 2017 107

Notes to the Financial Statements For the year ended 31 December 2017
2016Carrying amount Fair Value
Loan Fair value- Other Level 1 Level 2 Level 3 and liabilities financial
receivables liabilities ----------------------------------------------- (Rupees) -----------------------------------------------
Financial assets notmeasured at fair value
Trade debts 1,205,269 - - - - - Installment sales receivable 387,287 - - - - - Loans, advances, deposits andother receivables 666,717 - - - - - Accrued profit on bank deposits 120,761 - - - - - Bank balances 7,624,292 - - - - -
Financial liabilities notmeasured at fair value
Trade and other payables - - 6,300,123 - - - Security deposits - - 3,673,164 - - -
The estimated fair value of all financial assets and liabilities is considered not significantly different from carrying values as the items are either short-term in nature or periodically repriced.
37 SEGMENT ANALYSIS The activities of the Company have been grouped into two segments of related products i.e. automo-
bile and motorcycles as follows: - The Automobile segment includes sales of own manufactured vehicles and spare parts and trading
vehicles and spare parts.
- The Motorcycles segment includes sales of own manufactured vehicles and spare parts and trading vehicles and spare parts.
Pak Suzuki Motor Company Limited108

F I N A N C I A L
Accounts
37.1 Segment revenue and results
Following is an analysis of the Company’s revenue and results by reportable segment:
2017 2016Automobile Motorcycle Total Automobile Motorcycle Total ------------------------------------------ (Rupees in ‘000’) ------------------------------------------
Net sales 99,257,509 2,554,102 101,811,611 74,467,968 2,048,072 76,516,040
Gross profit 9,457,590 194,983 9,652,573 7,294,183 54,394 7,348,577 Distribution expenses (2,775,083) (29,173) (2,804,256) (1,937,848) (66,437) (2,004,285)Administration expenses (1,481,995) (117,820) (1,599,815) (1,313,804) (225,786) (1,539,590)
Operating profit 5,200,512 47,990 5,248,502 4,042,531 (237,829) 3,804,702 Other income 815,954 48,757 864,711 971,705 68,146 1,039,851 Finance cost (66,851) (1,237) (68,088) (94,436) (1,339) (95,775)
Segment results 5,949,615 95,510 6,045,125 4,919,800 (171,022) 4,748,778
Unallocated corporate expenses
Other operating expenses (413,997) (333,542)Share of loss of equity accounted investee (11,914) - Taxation (1,793,393) (1,642,601)
(2,219,304) (1,976,143)Profit after tax 3,825,821 2,772,635
Revenue from sale of Automobiles represent 98% (2016: 97.50%) of the gross sales of the Company.
99.99% (2016: 99.93%) of the gross sales of the Company are made to customers located in Pakistan.
All non-current assets of the Company at 31 December 2017 are located in Pakistan.
The Company’s customer base is diverse with no single customer accounting for more than 10% of sales.
Annual Report 2017 109

Notes to the Financial Statements For the year ended 31 December 2017
37.2 Segment assets and liabilities
2017 2016Automobile Motorcycle Total Automobile Motorcycle Total
------------------------------------------ (Rupees in ‘000’) ------------------------------------------
Segment assets 33,369,277 16,686,921 35,056,198 23,330,467 1,944,101 25,274,568 Unallocated corporate assets - - 15,854,269 - - 12,577,397
33,369,277 1,686,921 50,910,467 23,330,467 1,944,101 37,851,965
LiabilitiesSegment liabilities 21,209,327 151,424 21,360,751 11,593,386 41,672 11,635,058 Unallocated corporate liabilities - - - - - -
21,209,327 151,424 21,360,751 11,593,386 41,672 11,635,058
37.3 Other segment information
Capital expenditure 3,428,516 90,699 3,519,215 3,022,847 100,015 3,122,862 Depreciation 1,244,152 118,649 1,362,801 798,100 137,614 935,714
38 UNUTILIZED CREDIT FACILITIES
As of the balance sheet date, the Company has unutilized facilities for short term running finance available from various banks amounted to Rs. 4,800 million (2016: Rs. 4,800 million).
39 PROVIDENT FUND 2017 2016 (Unaudited) (Audited) ------- (Rupees in ‘000) -------
39.1 General disclosures
Size of the fund 764,427 740,172 Cost of investments 631,386 517,706 Fair value of investments 757,220 732,012 Percentage of investments 99.06% 98.90%
39.2 Categories of investments as a 2017 2016 2017 2016percentage of total assets of ----- (Rupees in 000) ----- ----- Percentage (%) -----provident fund:
Bank balances 11,710 10,171 2% 1%National savings 248,357 411,733 33% 56%Govt securities 103,560 73,270 14% 10%Certificates of deposit 10,044 10,046 1% 1%Term finance certificates 290,778 42,151 38% 6%Listed securities 92,771 184,641 12% 25%Total 757,220 732,012 100% 100%
Pak Suzuki Motor Company Limited110

F I N A N C I A L
Accounts
39.3 Investments of provident fund have been made in accordance with the provisions of the section 227 of the repealed Companies Ordinance, 1984 and the rules formulated for this purpose.
40 DATE OF AUTHORISATION FOR ISSUE
These financial statements have been authorised for issue by the Board of Directors of the Company in its meeting held on March 19, 2018.
41 NON-ADJUSTING EVENT AFTER THE BALANCE SHEET DATE
41.1 The Board of Directors in its meeting held on March 19, 2018 has recommended a final cash dividend on ordinary shares at the rate of 186% (2016: 55%). The Board of Directors have further approved the transfer of Rs. 2,295 million (2016: 2,320 million) from unappropriated profit to general reserves. The approval of the members for the said appropriations will be obtained at the Annual General Meeting of the Company to be held on April 25, 2018.
41.2 Under section 5A of Income Tax Ordinance, 2001 (as amended by the Finance Act 2017), a tax shall be imposed at the rate of 7.5% of the accounting profit before tax on the every public company, other than schedule bank or modaraba, that drives profit for a tax year but does not distribute atleast 40% of its after tax profits within six months of the end of the tax year through cash or bonus shares.
The Board of Directors in their meeting held on March 19, 2018 have recommended sufficient cash dividend for the year ended 31 December 2017 for the consideration and approval of the shareholders of the Company in the forthcoming general meeting which complies with the above stated requirements. Accordingly, no provision for tax on undistributed profit has been recognised in these financial statements for the year ended 31 December 2017.
42 GENERAL 42.1 Number of persons employed as at year end were 1,345 (2016: 1,269) and the average number of
persons employed during the year were 1,307 (2016: 1,303).
42.2 Figures in these financial statements have been rounded off to the nearest thousand of Rupees, unless otherwise stated.
42.3 Corresponding figures have been rearranged and reclassified for better presentation, wherever
considered necessary, the effect of which is not material.
Chairman Chief Financial Officer Chief Executive Officer
Annual Report 2017 111

Pattern of Shareholding As at 31 December 2017
No. of Shareholders Shareholdings’Slab Total Shares Held
4037 1 to 100 72,448 864 101 to 500 245,884 326 501 to 1000 241,149 315 1001 to 5000 681,725 68 5001 to 10000 507,836 27 10001 to 15000 338,095 22 15001 to 20000 398,010 8 20001 to 25000 185,359 6 25001 to 30000 167,348 3 30001 to 35000 98,875 8 35001 to 40000 302,287 6 40001 to 45000 256,419 2 45001 to 50000 97,850 3 50001 to 55000 160,250 2 55001 to 60000 112,800 4 60001 to 65000 255,836 2 65001 to 70000 137,530 5 70001 to 75000 366,950 3 75001 to 80000 232,250 4 80001 to 85000 332,880 3 85001 to 90000 261,450 2 90001 to 95000 184,750 3 95001 to 100000 296,400 1 100001 to 105000 100,100 1 105001 to 110000 106,700 3 110001 to 115000 336,596 1 115001 to 120000 117,500 2 120001 to 125000 241,700 1 140001 to 145000 142,338 3 155001 to 160000 473,050 2 165001 to 170000 334,100 1 175001 to 180000 176,300 1 180001 to 185000 183,662 1 190001 to 195000 192,400 2 195001 to 200000 395,400
Pak Suzuki Motor Company Limited112

F I N A N C I A L
Accounts
No. of Shareholders Shareholdings’Slab Total Shares Held
1 200001 to 205000 203,950 1 215001 to 220000 218,650 1 225001 to 230000 228,364 1 230001 to 235000 234,250 1 245001 to 250000 250,000 1 255001 to 260000 255,900 1 335001 to 340000 340,000 1 345001 to 350000 350,000 1 355001 to 360000 358,700 1 380001 to 385000 383,200 2 450001 to 455000 903,825 1 455001 to 460000 457,100 1 500001 to 505000 504,595 1 525001 to 530000 525,750 1 545001 to 550000 545,862 1 565001 to 570000 568,523 1 595001 to 600000 600,000 1 795001 to 800000 795,500 1 835001 to 840000 835,900 1 900001 to 905000 902,860 1 945001 to 950000 947,500 1 1120001 to 1125000 1,122,140 1 1160001 to 1165000 1,160,574 1 1620001 to 1625000 1,621,250 1 59250001 to 59255000 59,251,231
5768 82,299,851
Annual Report 2017 113

Pattern of Shareholding As at 31 December 2017
Categories of Shareholders Shareholders Shares Held Percentage
Directors and their spouse(s) and minor childrenMR. HIROFUMI NAGAO 1 119 0.00 MOIN M FUDDA 1 500 0.00
Associated Companies, undertakings and related parties M/S SUZUKI MOTOR CORPORATION, JAPAN 2 60,154,091 73.09
Executives - - -
Public Sector Companies and Corporations 10 1,339,196 1.63
Banks, development finance institutions, non-banking finance, companies insurance companies, takaful, modarabas and pension funds 37 1,241,425 1.51
Mutual FundsCDC - TRUSTEE ALFALAH GHP ISLAMIC STOCK FUND 1 228,364 0.28 CDC - TRUSTEE ALFALAH GHP STOCK FUND 1 85,850 0.10 CDC - TRUSTEE ALFALAH GHP ALPHA FUND 1 56,700 0.07 CDC - TRUSTEE NIT-EQUITY MARKET OPPORTUNITY FUND 1 568,523 0.69 CDC - TRUSTEE ABL STOCK FUND 1 71,700 0.09 CDC-TRUSTEE HBL ISLAMIC STOCK FUND 1 29,000 0.04 CDC-TRUSTEE FIRST HABIB ISLAMIC STOCK FUND 1 1,000 0.00 MCBFSL - TRUSTEE ABL ISLAMIC STOCK FUND 1 74,700 0.09 CDC-TRUSTEE AL-AMEEN ISLAMIC RET. SAV. FUND-EQUITY SUB FUND 1 7,000 0.01 CDC - TRUSTEE UBL RETIREMENT SAVINGS FUND - EQUITY SUB FUND 1 200 0.00 CDC - TRUSTEE NATIONAL INVESTMENT (UNIT) TRUST 1 1,122,140 1.36 CDC - TRUSTEE PICIC ISLAMIC STOCK FUND 1 27,500 0.03 CDC - TRUSTEE NIT ISLAMIC EQUITY FUND 1 176,300 0.21 CDC-TRUSTEE NITIPF EQUITY SUB-FUND 1 4,000 0.00 CDC - TRUSTEE AL AMEEN ISLAMIC DEDICATED EQUITY FUND 1 51,700 0.06 CDC - TRUSTEE HBL ISLAMIC ASSET ALLOCATION FUND 1 18,400 0.02 MCBFSL TRUSTEE ABL ISLAMIC DEDICATED STOCK FUND 1 85,600 0.10 MC FSL - TRUSTEE JS GROWTH FUND 1 43,450 0.05 CDC - TRUSTEE LAKSON EQUITY FUND 1 16,700 0.02 CDC - TRUSTEE NAFA ISLAMIC STOCK FUND 1 84,000 0.10 CDC - TRUSTEE MEEZAN ASSET ALLOCATION FUND 1 15,000 0.02 CDC - TRUSTEE LAKSON TACTICAL FUND 1 3,520 0.00 CDC - TRUSTEE LAKSON ISLAMIC TACTICAL FUND 1 802 0.00 CDC - TRUSTEE ALFALAH GHP ISLAMIC DEDICATED EQUITY FUND 1 64,586 0.08 CDC - TRUSTEE JS LARGE CAP. FUND 1 14,500 0.02 CDC - TRUSTEE ALHAMRA ISLAMIC STOCK FUND 1 44,950 0.05 CDC - TRUSTEE MEEZAN BALANCED FUND 1 60 0.00 CDC - TRUSTEE FIRST DAWOOD MUTUAL FUND 1 1,500 0.00 CDC - TRUSTEE JS ISLAMIC FUND 1 54,750 0.07
Pak Suzuki Motor Company Limited114

F I N A N C I A L
Accounts
Categories of Shareholders Shareholders Shares Held Percentage
CDC - TRUSTEE ALFALAH GHP VALUE FUND 1 74,950 0.09 CDC - TRUSTEE UNIT TRUST OF PAKISTAN 1 22,000 0.03 CDC - TRUSTEE AKD INDEX TRACKER FUND 1 4,720 0.01 CDC - TRUSTEE AL MEEZAN MUTUAL FUND 1 117,500 0.14 CDC - TRUSTEE MEEZAN ISLAMIC FUND 1 110,700 0.13 CDC - TRUSTEE UBL STOCK ADVANTAGE FUND 1 19,400 0.02 CDC - TRUSTEE AL-AMEEN SHARIAH STOCK FUND 1 17,050 0.02 CDC - TRUSTEE NAFA STOCK FUND 1 21,550 0.03 CDC - TRUSTEE FIRST CAPITAL MUTUAL FUND 1 3,800 0.00 CDC TRUSTEE - MEEZAN DEDICATED EQUITY FUND 1 27,100 0.03
General Publica. Local 5523 4,355,939 5.29 b. Foreign 7 23,501 0.03
Foreign Companies 47 9,848,947 11.97 Others 101 1,964,868 2.39
Totals 5768 82,299,851 100.00
Share holders holding 5% or more Shares Held Percentage
M/S SUZUKI MOTOR CORPORATION, JAPAN 60,154,091 73.09
Annual Report 2017 115

Azad KashmirKotli 1Mirpur 1Muzaffarabad 1 BaluchistanGwadar 1Quetta 2 Khyber Pakhtun KhwaAbbottabad 1Dera Ismail Khan 1Haripur 1Mansehra 1Mardan 1Nowshera 1Peshawar 4Swat 1Talagang 1Kohat 1Swabi 1
PunjabMandi Bahauddin 1Bahawalnagar 1Bahawalpur 1Chakwal 1Dera Ghazi Khan 1Faisalabad 3Gujranwala 1Gujrat 1
Islamabad 5Jhang 1Kasur 1Khanewal 1Lahore 16Layyah 1Mianwali 1Multan 3Okara 1Pakpattan 1Rahim Yar Khan 2Rawalpindi 3Sadiqabad 1Sahiwal 1Sargodha 1Sialkot 3Taxila 1Vehari 1Chunian 1 SindhHyderabad 4Karachi 16Larkana 1Makli 1Mirpur Khas 1Nawabshah 1Sukkur 1Moro 1
101
Dealer Network
Pak Suzuki Motor Company Limited116

my/our behalf at the 35th Annual General Meeting of the Company to be held on 25th day of April 2018 at 9:30 am at Ramada Plaza Hotel Karachi and at any adjourment thereof.
2018
Form of Proxy


