210 schipi ciardo 2007
TRANSCRIPT

This article was published in an Elsevier journal. The attached copyis furnished to the author for non-commercial research and
education use, including for instruction at the author’s institution,sharing with colleagues and providing to institution administration.
Other uses, including reproduction and distribution, or selling orlicensing copies, or posting to personal, institutional or third party
websites are prohibited.
In most cases authors are permitted to post their version of thearticle (e.g. in Word or Tex form) to their personal website orinstitutional repository. Authors requiring further information
regarding Elsevier’s archiving and manuscript policies areencouraged to visit:
http://www.elsevier.com/copyright

Author's personal copy
Identification of moulds in the diagnostic laboratory—an algorithmimplementing molecular and phenotypic methods
Diana E. Ciardo⁎, Gertrud Schär, Martin Altwegg1, Erik C. Böttger, Philipp P. BosshardInstitut für Medizinische Mikrobiologie, Universität Zürich, 8006 Zürich, Switzerland
Received 29 November 2006; accepted 26 April 2007
Abstract
Sequence analysis provides a valuable alternative to phenotypic identification of moulds, especially for isolates lacking characteristicmorphology. In this comparative prospective study, isolates that could not be identified by standard phenotypic criteria within 5 days (n =244) were subjected to sequence analysis and further in-depth phenotypic investigations. Comparison of sequence-based with extendedphenotypic identification revealed that sequence analysis was more precise in 52.0% of the isolates; in 38.6% of the isolates, both methodsgave concordant results. The construction of a database consisting of high-quality sequences allowed improvement of sequence-basedidentification. Based on these results, we propose a diagnostic algorithm for the effective use of both phenotypic and genetic procedures foridentification of moulds in the diagnostic laboratory.© 2007 Elsevier Inc. All rights reserved.
Keywords: Moulds; ITS; Identification; Sequencing; PCR; Fungi; Algorithm; Diagnostics
1. Introduction
Morbidity and mortality due to filamentous fungalinfections are steadily increasing (McNeil et al., 2001),mostly affecting defined risk groups, for example, immuno-compromised or severely ill patients, premature infants, andthe elderly (Kauffman, 2001; Kaufman, 2004; Maertenset al., 2001; Patterson et al., 2000). The spectrum of possiblefungal pathogens is quite broad, including species previouslynot recognized as pathogenic such as Exophiala jeanselmei,Fusarium solani, and Pyrenochaeta romeroi (Husain et al.,2003; Silveira and Nucci, 2001; Walsh et al., 2004). Thecorrect identification of pathogenic fungi can be essentialbecause inherent antifungal resistance of some species (e.g.,Aspergillus terreus, Perea and Patterson, 2002; Scedospor-ium prolificans, Pfaller and Diekema, 2004) hampersempirical therapy for mould infections. Conventionalidentification of moulds is mainly performed by phenotypiccriteria, including micro- and macromorphology, andrequires considerable expertise. This procedure may takeseveral days and is dependent on sufficient growth and
sporulation as well as on individual interpretation (de Hooget al., 2000). Even then, related species may be confused andrare species may remain unidentified.
Non–culture-based methods for identification of mouldshave emerged in recent years. Among these are differentformats of molecular analyses based on polymerase chainreaction (PCR), including restriction fragment length poly-morphism analysis, hybridization assays, or sequencedetermination (Yeo and Wong, 2002). Sequence analysis inprinciple allows a universal approach for identification offungi. Toward this end, different target sequences have beenproposed, for example, the gene for the alkaline proteinase,the mitochondrial DNA, and the rRNA gene cluster (Chenet al., 2002). For our studies, we have chosen the internaltranscribed spacer (ITS) region of the rRNA operon, which islocated between the 18S and 28S rRNA genes and includesthe 2 intervening regions, ITS1 and ITS2, and the highlyconserved 5.8S rRNA gene (White et al., 1990). The reasonsfor the choice of this target were as follows: i) the rRNAoperon occurs in multiple copies in the fungal genome(Rooney and Ward, 2005; Wood et al., 2002), ii) identifica-tion procedures based on the ITS region have been described(Iwen et al., 2002), iii) sequence variability in the ITS regionis higher than in the adjacent rRNA encoding regions,allowing a better separation of closely related species
Diagnostic Microbiology and Infectious Disease 59 (2007) 49–60www.elsevier.com/locate/diagmicrobio
⁎ Corresponding author. Tel.: +41-44-634-00-27; fax: +41-44-634-49-06.E-mail address: [email protected] (D.E. Ciardo).1 Present address: Bio-Analytica AG, 6000 Luzern 6, Switzerland.
0732-8893/$ – see front matter © 2007 Elsevier Inc. All rights reserved.doi:10.1016/j.diagmicrobio.2007.04.020

Author's personal copy
(Hinrikson et al., 2005), and iv) a considerable number of ITSsequences is available in public databases. However, thesedatabases, for example, GenBank (National Center forBiotechnology Information [NCBI]), are compromised bothby the presence of misassigned sequence entries and by a lackof sequence entries for some clinically relevant fungi. Toimprove the quality of molecular identification, we estab-lished an ITS database containing only sequences fulfillingwell defined quality criteria. This database, named IMMdatabase, includes most moulds encountered in the medicaldiagnostic laboratory as well as closely related genera.
During a 1-year prospective study, we comparedsequence-based identification using the IMM and publicdatabases with conventional identification of moulds. Giventhe significant costs associated with genetic analyses, wehave designed a study where molecular methods arerestricted to isolates that are difficult to identify byconventional means, that is, by inclusion of moulds thatcould not be identified by phenotypic characteristics within5 days following first visual observation of growth. Theseisolates were subjected to sequence analysis as well as tofurther phenotypic investigations. Conventional and mole-cular results were compared and discrepancies resolved byreevaluation of the data.
2. Materials and methods
2.1. Conventional identification
Clinical specimens were cultured on universal media(e.g., Sabouraud dextrose agar with gentamicin andchloramphenicol, brain–heart infusion agar with and with-out gentamicin and chloramphenicol) and on selectivemedia (e.g., Mycosel agar) by incubation at 25 or 30 °C for3 weeks. Moulds grown on primary media were sub-cultured for identification as follows: i) Aspergillus spp. onmalt yeast agar at 25, 35, and 42 °C; ii) Mucorales onpotato carrot agar at 25, 37, 40, 45, 50, and 56 °C; iii) allother moulds on Sabouraud dextrose agar with gentamicinand chloramphenicol at 25 and 35 °C, Mycosel and potatocarrot agar, both at 25 °C. Phenotypic identification wasbased on macromorphological criteria, for example, growthon different media and at different temperatures, color, andgrowth rate of the colony, and on micromorphologicalcriteria, for example, conidiogenesis, shape of conidia andspores, and mycelial structures (de Hoog et al., 2000). Forinvestigating conidiogenesis in detail, undisturbed slidecultures were used (de Hoog et al., 2000).
2.2. DNA extraction
Moulds were cultivated on Sabouraud dextrose agar withgentamicin and chloramphenicol at room temperature.Approximately 2 to 4 cm2 of the mycelium of fungal culturewas added to 200 μL InstaGene™matrix (Bio-Rad, ReinachBL, Switzerland) and incubated for at least 3 h at 56 °C.After 10 min at 95 °C and centrifugation at 16000 × g for
3 min, the supernatant was used for amplification. In case ofPCR failure, a newly collected fungal mycelium wasdigested at 37 °C for 2 h with 30 U of Lyticase (Sigma-Aldrich Chemie GmbH, Schnelldorf, Germany) in 200 μL ofdigestion buffer (50 mmol/L Tris–HCl, 1 mmol/L ethylene-diaminetetraacetic acid, pH 8.0). Alkaline lysis was thenperformed by addition of 10 μL of 1 mol/L NaOH and 10 μLof 10% sodium dodecyl sulfate and incubation for 10 min at95 °C. After neutralization with 10 μL of 1 mol/L HCl, DNAwas purified with the QIAamp DNA blood mini kit (Qiagen,Basel, Switzerland) according to the instructions of themanufacturer. The DNA was finally eluted in 100 μL H2O.
2.3. Amplification and sequencing
PCR was performed in a PerkinElmer GeneAmp®PCR System 9600 (Applied Biosystems, Rotkreuz, Switzer-land) in a volume of 20 μL containing 3 mmol/L MgCl2,0.5 μmol/L of each primer ITS1 and ITS4 (White et al.,1990), 2 μL of LightCycler FastStart DNA Master SYBRGreen I (LightCyler™ reagents; Roche, Rotkreuz, Switzer-land), and 2 μL of either supernatant (InstaGene extraction)or eluted DNA (QIAamp DNA blood mini kit purification).Cycling parameters included an initial heating for 10 min at37 °C, denaturation for 5 min at 95 °C, 40 cycles of 1 min at94 °C, 1min at 48 °C, and 1min at 72 °C, and final elongationof 10 min at 72 °C. The amplification products were purifiedwith the QIAquick PCR purification kit (Qiagen). Theamplified ITS region was sequenced using the BigDye kit(Applied Biosystems) and an automated DNA sequencer ABIPrism 3100-Avant Genetic Analyzer (Applied Biosystems).For construction of the database, sequences obtained bydetermination of both strands were used, generated withforward primer ITS1 and with backward primer ITS4 and, ifnecessary, with forward primer ITS3 and backward primerITS2, both located in the 5.8S rRNA gene (White et al.,1990). For the prospective study, sequences from clinicalisolates were created with forward primer ITS1.
2.4. Construction of the IMM database
The database was designed to include most of themedically relevant moulds as well as taxa occurringfrequently in the mycology laboratory and commoncontaminants (dermatophytes were not included.) Thisresulted in a list of 135 species representing 78 genera. Atleast one isolate of each of these species was sequenced,resulting in 171 full-length ITS sequences (the size of theITS sequence varies from 358 (Candida lipolytica) to 910(Cunninghamella echinulata) nucleotides; sequences notrepresented in public databases were submitted to GenBank(EF540751: Apiospora sp. strain PS-IMM229; EF540752:Bipolaris hawaiiensis strain PS-IMM135; EF540753:Chaetomium atrobrunneum strain PS-Unb006; EF540754:Coniothyrium fuckelii strain PS-IMM153; EF540755: Geo-myces pannorum strain PS-IMM170; EF540756: Phialo-phora europaea strain PS-IMM228; EF540757: Rhizomucor
50 D.E. Ciardo et al. / Diagnostic Microbiology and Infectious Disease 59 (2007) 49–60

Author's personal copy
pusillus strain PS-IMM204; EF540758: Trichurus sp. strainPS-IMM222). The strains originated from quality controls(NEQAS, Sheffield, UK), the University of Alberta Micro-fungus Collection and Herbarium (UAMH, Canada) strain
collection, the Centraalbureau voor Schimmelcultures (CBS,the Netherlands) strain collection, and our in-house straincollection with well characterized clinical isolates. To definethe levels of intra- and interspecies homology, the sequences
Fig. 1. Sequence homology tree of Schizophyllum commune sequences. The tree was calculated using SeqWeb version 2.1.0. The arrows indicate sequenceentries with 100% homology to other sequence entries (not included in the tree).
Fig. 2. Diagnostic algorithm for the identification of moulds.
51D.E. Ciardo et al. / Diagnostic Microbiology and Infectious Disease 59 (2007) 49–60

Author's personal copy
were compared with sequence entries of the same genusavailable in public databases using the SeqWeb2.1.0program (web interface to a core set of sequence analysisprograms in the GCG® Wisconsin Package™; Accelrys,Cambridge, UK; as an example, see Fig. 1). For inclusion inthe IMM database a sequence (in-house sequence, sequenceentry from public databases) had to cover more than 90% ofthe ITS region and had to be confirmed by at least oneadditional independent sequence entry of the same species(sequence homology N95%). The threshold of 95% sequencehomology was chosen after extensive analysis of fungalintraspecies variabilities to include most of the geneticintraspecies variability. The assignment of sequences wasvalidated by phylogenetic analyses and further sequencecomparisons. Closely related genera, that is, genera contain-ing species with sequence homologies of more than 95% toone of the species in the genus under investigation, were alsoincluded in the analyses. The resulting mould ITS databasehas been set up and operated on the SmartGene FungiIDNS™ (Integrated Database Network System) platform;the database is commercially available from SmartGene(SmartGene, Zug, Switzerland, www.idns-smartgene.com).
2.5. Prospective study
Isolates were collected over a study period of 1 year(January to December 2004) following a defined algorithm.In the first 6 months, all isolates i) that either grew at 35 °C oron Mycosel agar or for which direct microscopic examina-tion of the clinical specimen was positive, and ii) thatcould not be identified conventionally to species level within5 days following first visual observation of growth wereincluded in the study. This algorithm was slightly modifiedafter 6 months to redefine the criteria for clinical relevanceand to exclude typical contaminants growing at 35 °C(Fig. 2). According to the modified algorithm, isolates forwhich no species assignment could be achieved byphenotypic criteria were included in the study if i) themoulds isolated from usually sterile specimens grew at35 °C, ii) direct microscopy of non-sterile samples waspositive, iii) isolates from non-sterile specimens grew at35 °C and the patient showed clinical evidence of infection,as judged by the physician, or iv) direct microscopy ofdermatological samples was positive and the moulds isolatedgrew at 35 °C. Isolates were not subjected to sequenceanalysis if phenotypic investigations suggested one of thefollowing normally non-pathogenic genera: Apiospora sp.,Arthrinium sp., Botrytis sp., Epicoccum sp., Penicillium sp.(except for Penicillium marneffei), Phoma sp., Pithomycessp., Ulocladium sp., Ustilago sp., and Trichurus sp.
Isolates included in the study were sequenced andsubjected to further phenotypic investigations. Thesequences obtained (covering N90% of the ITS region)were compared with the IMM ITS database using theIDNS™ custom platform (SmartGene) and with GenBank(NCBI). Undetermined nucleotides in the referencesequences were counted as mismatches. The sequence was
assigned to a species if the homology to the first referencesequence was ≥98% over the whole length of the sequenceand if the next species showed at least 0.8% less sequencehomology. The threshold of 98% sequence homologywas chosen to ensure correct species assignment, sincemore than 80% of the species included in our databaseshow an intraspecies sequence homology N98%. Assign-ment to the genus level was defined as 95% to 98%homology to the best matching sequence over the wholelength of the sequence or ≥98% homology with sequenceentries of more than one species of the same genus withthese sequences showing b0.8% sequence divergence. Noidentification was defined as b95% homology to the bestmatching reference sequence over the whole sequencelength or as sequence homology of N95% to different generawith these sequences showing b3.0% sequence divergence.The results of phenotypic and molecular identificationwere compared and discrepant results resolved by reevalua-tion of the data set following repeat of sequencing andphenotypic profiling.
To control for the adequacy of the applied algorithm, thatis, to evaluate the accuracy of the phenotypic identificationprocedure used therein, 70 isolates (representing 37 speciesof 22 genera) well identified phenotypically at the specieslevel within 5 days following first visual observation ofgrowth were subjected to ITS sequencing.
3. Results
3.1. Generation of the database
The IMM database was constructed by extensive analysisof sequences retrieved from public databases and ofsequences generated in-house. The IMM database includes1574 sequences representing 516 species from 103 genera(Supplemental Table). Based on sequence analysis using theGrowTree program (SeqWeb 2.1.0), almost 300 publiclyavailable sequences of taxa included in the IMM databasehad to be excluded due to possible misassignment. Forexample, the Schizophyllum commune database entryAF062633 showed only 89.5% to 91.3% homology toother S. commune sequences; all other S. communesequences shared 97.8% to 100% sequence homology(Fig. 1). Therefore, the S. commune database entryAF062633 appears to belong to a species other thanS. commune. Approximately 500 species were not includedas only a single ITS sequence was available in GenBank(NCBI), and the sequences thus were unconfirmed.
3.2. Control isolates
To evaluate the quality of phenotypic identification, 70isolates identified within 5 days after first visual observationof growth were subjected to sequencing (Table 1).Phenotypic identification was confirmed by sequenceanalysis for 72.9% of the isolates (51/70). For 8 (11.4%) of70 isolates, sequence determination resulted in a less
52 D.E. Ciardo et al. / Diagnostic Microbiology and Infectious Disease 59 (2007) 49–60

Author's personal copy
Table 1Comparison of morphological identification and identification by sequence analysis for 70 control isolates identified by phenotypic means within 5 days
A. Identical identification
Phenotypic identification n a Sequence analysis
Absidia corymbifera 1 A. corymbiferaAspergillus clavatus 1 A. clavatusAspergillus flavus 3 A. flavus b
Aspergillus fumigatus 4 A. fumigatusAspergillus glaucus 4 A. glaucus b
Aspergillus nidulans 2 A. nidulansAspergillus ochraceus 3 A. ochraceusAspergillus restrictus 1 A. restrictusAspergillus sydowii 1 A. sydowiiAspergillus terreus 3 A. terreusAspergillus ustus 1 A. ustusAspergillus versicolor 1 A. versicolor b
Aureobasidium pullulans 3 A. pullulansBjerkandera adusta 1 B. adusta b
Chaetomium globosum 2 C. globosumGeotrichum candidum 3 G. candidumMucor hiemalis 1 M. hiemalis b
Paecilomyces lilacinus 2 P. lilacinus b
Paecilomyces variotii 1 P. variotiiParacoccidioides brasiliensis 1 P. brasiliensisPenicillium digitatum 1 P. digitatumRhizomucor pusillus 3 R. pusillusRhizopus stolonifer 1 R. stoloniferScedosporium apiospermum 2 S. apiospermumScedosporium prolificans 2 S. prolificansScytalidium dimidiatum 1 S. dimidiatumSporothrix schenckii 1 S. schenckiiUlocladium chartarum 1 U. chartarum b
B. Phenotypic identification more accurate
Phenotypicidentification
n a Sequence analysis Comment
Alternaria alternata 1 Alternaria sp. ITS sequencing does not distinguish between most Alternaria spp.Aspergillus niger 2 No identification (A. niger,
Gliocladium cibotii)ITS sequencing does not distinguish between A. niger and G. cibotii
Rhizopus oryzae 4 Rhizopus sp. (R. oryzae,R. chlamydosporus)
ITS sequencing does not distinguish between R. chlamydosporus and R. oryzae
Ulocladium botrytis 1 No identification (Alternaria sp.,Pleospora sp., Ulocladium sp.)
ITS sequencing does not distinguish between some species of Alternaria,Pleospora, and Ulocladium
C. Discrepant results
Phenotypicidentification
n a Sequence analysis Definite identification
Aspergillus ochraceus 1 A. alliaceus c A. alliaceus: species misassigned by phenotypic criteriaAspergillus versicolor 1 Penicillium geastrivorus c P. geastrivorus: genus misassigned by phenotypic criteriaAspergillus versicolor 1 A. unguisc A. unguis: species misassigned by phenotypic criteriaChrysosporiumkeratinophilum
1 Aphanoascus fulvescens b A. fulvescens: species misassigned by phenotypic criteria
Exophialadermatitidis
1 Exophiala sp. (not E. dermatitidis) Exophiala sp.: species misassigned by phenotypic criteria
Fusarium oxysporum 1 Fusarium sp. (Fusariumproliferatum, Fusarium fujikuroi)
Fusarium sp.: species misassigned by phenotypic criteria
Ochroconis humicola 1 Ochroconis sp. b (not O. humicola) Ochroconis sp.: species misassigned by phenotypic criteriaNo amplificationS. brevicaulis 4
a Number or isolates.b Isolate identified by IMM database only.c Isolate identified by GenBank only.
53D.E. Ciardo et al. / Diagnostic Microbiology and Infectious Disease 59 (2007) 49–60

Author's personal copy
accurate identification: in 5 cases, assignment to the genuslevel only was achieved; in 3 cases, no identification waspossible due to high sequence homology to sequence entriesfrom at least 2 genera. 10% (7/70) of the isolates gavediscrepant results. Reevaluation of the data confirmed theresults of sequence analysis, revealing in 6 cases phenotypicmisassignments to closely related species, for example, As-pergillus versicolor and Aspergillus unguis may be distin-guished only by echinulate or smooth conidia, if thecharacteristic morphology is developed properly. For 4(5.7%) of 70 isolates, all of which were phenotypicallyidentified as Scopulariopsis brevicaulis, the ITS region couldnot be amplified.
3.3. Prospective study
During the study period of 1 year, 1320 moulds wereisolated from patient samples. Of these, 244 isolatesmatched the defined criteria and were thus included in thestudy. The raw data obtained with the different methods areshown in Table 2.
For 7.8% (19/244) of the isolates, the ITS region couldnot be amplified; by phenotypic means, 6 of these 19 isolatescould not be identified, the remaining 13 isolates wereassigned to the following taxa: Aspergillus fumigatus,Aspergillus ustus, Aspergillus sp., Coccidioides immitis,Microascus sp., Onychocola canadensis (2 isolates),Ophiostoma sp., Paecilomyces lilacinus, Paecilomyces sp.,Penicillium sp., Scopulariopsis sp., and Trichurus sp.
By combining both methods, 216 of 244 isolatesincluded in the study could be assigned to 93 speciesrepresenting 61 genera; 28 isolates could not be identifiedwith any method (for details, see Tables 3 and 4).
3.4. Comparison of IMM database and GenBank
Part of the IMM database includes sequences retrievedfrom GenBank. However, a comparison of the resultsobtained with the IMM database and with GenBankrevealed significant differences (Tables 3–5). Three ofthe 225 isolates showed discrepant results, which wereresolved by comparison with phenotypic identification(Table 4). In 1 of these 3 cases (isolate 4), the isolatebelonged to a taxon not included in the IMM database(Beauveria bassiana) resulting in misidentification as Ver-ticillium sp. (96.9% sequence homology). In the other 2
discrepant cases (isolates 9 and 15), sequence analysis withGenBank resulted in a misassignment. Isolate 15 wasidentified as Phialophora europaea with the IMM database(100% homology). As a sequence entry of this species isnot included in GenBank, it was assigned to Phialophoralignicola (98.2% sequence homology). Isolate 9 wasidentified as Coniothyrium fuckelii with the IMM databaseas well as by phenotypic criteria. With a BLAST searchagainst GenBank, the best matching sequence was Myr-othecium sp. with 97.5% sequence homology.
Following resolution of the discrepant cases, 25.3% (57/225) of the isolates were identified more reliably by the IMMdatabase than by GenBank (Table 5), mainly for 2 reasons.First, some ITS sequences are missing in GenBank, forexample, sequences of Chaetomium atrobrunneum andPhialophora europaea. Second, a BLAST search againstGenBank in some cases showed high homology to sequenceentries of more than one genus, whereas a BLAST searchagainst the IMM database allowed unambiguous speciesassignment. For example, an isolate identified as Bjerkan-dera adusta showed 100% homology to all B. adustasequences and to 9 Thanatephorus cucumeris sequences inGenBank. These 9 T. cucumeris sequences have b80%homology to the other 379 T. cucumeris sequences inGenBank and thus are likely misassignments.
For 39.6% (89/225) of the isolates, identifications wereidentical between the IMM and public databases, and 18.2%(41/225) could not be identified using either of the 2databases. For 16.9% (38/225) of the isolates, a moreaccurate identification was achieved with GenBank. Most ofthese 38 isolates belonged to species not included in theIMM database since they represent medically not relevantspecies, they are rarely encountered in the clinical laboratory,or only a single ITS sequence was available (Tables 3 and 5).
3.5. Comparison of phenotypic identification andsequence analysis
For 225 of the 244 isolates included in the study, the ITSregion could be amplified thus allowing a comparison ofphenotypic identification with sequence analysis.
When comparing identification by phenotypic criteriawith sequence analysis using the IMM database, 13 of the225 isolates showed discrepant results (Table 4). Two of these13 isolates were misassigned by sequence analysis due to
Table 2Phenotypic versus molecular identification for 244 isolates (raw data before comparison and resolution of discrepancies)
Identification system No. (%) of isolates identified at taxonomic level:
Species Genus No identification Total
Phenotypic criteria 51 (20.9) 97 (39.8) 96 (39.3) 244 (100.0)Sequence analysis with IMM database 109 (44.7) 44 (18.0) 72 (29.5) a 225 (92.2) b
Sequence analysis with GenBank (NCBI) 87 (35.7) 52 (21.3) 86 (35.2) c 225 (92.2) b
a 5 of 72 isolates could not be identified because sequences of more than one genus showed sequence homologies N95%.b For 19 isolates (7.8%), the ITS sequence could not be amplified.c 46 of 86 isolates could not be identified because sequences of more than one genus showed sequence homologies N95%.
54 D.E. Ciardo et al. / Diagnostic Microbiology and Infectious Disease 59 (2007) 49–60

Author's personal copy
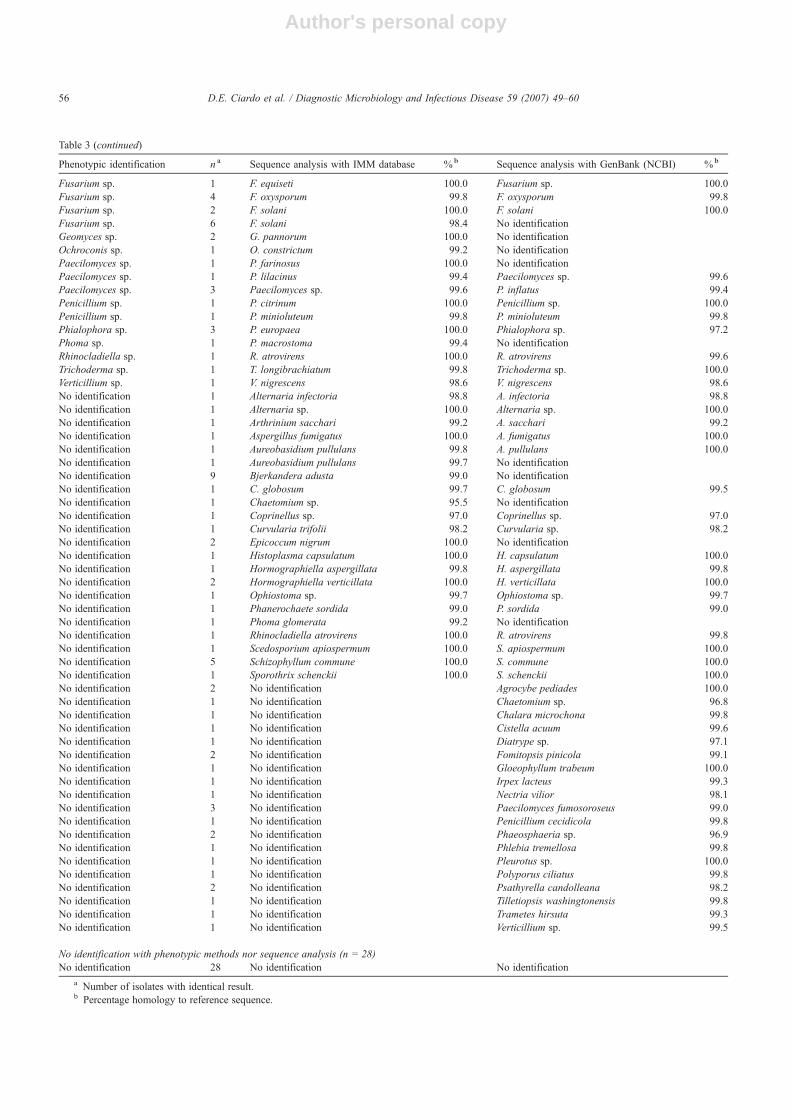
Table 3Comparison of morphological identification and identification by sequence analysis for moulds not identified to the species level by phenotypic criteria within5 days (n = 210); discrepant cases are shown separately in Table 4
Phenotypic identification n a Sequence analysis with IMM database %b Sequence analysis with GenBank (NCBI) %b
Identical identification at the species level by phenotypic methods and by sequence analysis (n = 31)Aspergillus fumigatus 4 A. fumigatus 100.0 A. fumigatus 100.0Aspergillus glaucus 1 A. glaucus 100.0 No identificationAspergillus nidulans 4 A. nidulans 100.0 A. nidulans 100.0Aspergillus ustus 2 A. ustus 100.0 A. ustus 100.0Aspergillus versicolor 1 A. versicolor 100.0 Aspergillus sp. 100.0Bjerkandera adusta 3 B. adusta 100.0 No identificationChaetomium funicola 1 C. funicola 100.0 C. funicola 100.0Chaetomium globosum 4 C. globosum 99.8 C. globosum 100.0Cladophialophora boppii 1 C. boppii 100.0 C. boppii 100.0Coniothyrium fuckelii 1 C. fuckelii 100.0 C. fuckelii 100.0Fusarium oxysporum 3 F. oxysporum 99.8 F. oxysporum 99.8Hormographiella verticillata 1 H. verticillata 100.0 H. verticillata 100.0Paecilomyces lilacinus 1 P. lilacinus 99.7 No identificationPseudallescheria boydii 1 P. boydii 100.0 P. boydii 100.0Scedosporium prolificans 1 S. prolificans 100.0 S. prolificans 99.1Schizophyllum commune 1 S. commune 99.8 S. commune 99.8Ulocladium chartarum 1 U. chartarum 99.6 No identification
Identical identification at the genus level by phenotypic methods and by sequence analysis (n = 28)Acremonium sp. 3 Acremonium sp. 100.0 Acremonium sp. 100.0Alternaria sp. 3 Alternaria sp. 100.0 Alternaria sp. 100.0Alternaria sp. 1 Alternaria sp. 100.0 No identificationChaetomium sp. 1 Chaetomium sp. 97.6 No identificationChrysosporium sp. 1 Chrysosporium sp. 99.7 Chrysosporium sp. 97.0Cladosporium sp. 3 Cladosporium sp. 97.2 No identificationFusarium sp. 4 Fusarium sp. 100.0 Fusarium sp. 100.0Penicillium sp. 7 Penicillium sp. 100.0 Penicillium sp. 100.0Phaeoacremonium sp. 1 No identification Phaeoacremonium sp. 100.0Phoma sp. 1 No identification Phoma sp. 98.6Scopulariopsis sp. 1 No identification Scopulariopsis sp. 95.1Trichurus sp. 2 Trichurus sp. 99.4 No identification
Phenotypic criteria more accurate than sequence analysis (n = 19)Acremomiun strictum 1 No identification No identificationAcremonium sp. 3 No identification No identificationAlternaria alternata 3 Alternaria sp. 100.0 Alternaria sp. 100.0Arthrinium sp. 1 No identification No identificationBeauveria bassiana 2 No identification Beauveria sp. 99.6Chaetomium sp. 1 No identification No identificationFusarium oxysporum 1 Fusarium sp. 99.8 Fusarium sp. 99.8Fusarium sp. 1 No identification No identificationLecythophora mutabilis 1 Lecythophora sp. 97.5 No identificationPenicillium sp. 1 No identification No identificationPhialemonium sp. 1 No identification No identificationPhoma sp. 1 No identification No identificationTrichurus sp. 2 No identification No identification
Sequence analysis more accurate than phenotypic criteria (n = 104)Alternaria sp. 2 A. infectoria 98.5 A. infectoria 98.5Aspergillus sp. 1 A. glaucus 100.0 No identificationAspergillus sp. 1 A. ustus 100.0 A. ustus 100.0Aspergillus sp. 1 No identification A. penicillioides 99.3Chaetomium sp. 1 C. atrobrunneum 98.2 Chaetomium sp. 95.4Chaetomium sp. 1 C. globosum 99.4 C. globosum 99.3Chrysosporium sp. 1 Aphanoascus fulvescens 99.8 Chrysosporium sp. 99.8Chrysosporium sp. 1 No identification C. tuberculatum 98.8Cladosporium sp. 1 C. elatum 100.0 C. elatum 100.0Coniothyrium sp. 1 C. fuckelii 100.0 C. fuckelii 100.0Coniothyrium sp. 1 C. fuckelii 99.8 No identificationCurvularia sp. 1 C. trifolii 98.1 C. trifolii 98.1
(continued on next page)
55D.E. Ciardo et al. / Diagnostic Microbiology and Infectious Disease 59 (2007) 49–60
Author's personal copy
Table 3 (continued)
Phenotypic identification n a Sequence analysis with IMM database %b Sequence analysis with GenBank (NCBI) %b
Fusarium sp. 1 F. equiseti 100.0 Fusarium sp. 100.0Fusarium sp. 4 F. oxysporum 99.8 F. oxysporum 99.8Fusarium sp. 2 F. solani 100.0 F. solani 100.0Fusarium sp. 6 F. solani 98.4 No identificationGeomyces sp. 2 G. pannorum 100.0 No identificationOchroconis sp. 1 O. constrictum 99.2 No identificationPaecilomyces sp. 1 P. farinosus 100.0 No identificationPaecilomyces sp. 1 P. lilacinus 99.4 Paecilomyces sp. 99.6Paecilomyces sp. 3 Paecilomyces sp. 99.6 P. inflatus 99.4Penicillium sp. 1 P. citrinum 100.0 Penicillium sp. 100.0Penicillium sp. 1 P. minioluteum 99.8 P. minioluteum 99.8Phialophora sp. 3 P. europaea 100.0 Phialophora sp. 97.2Phoma sp. 1 P. macrostoma 99.4 No identificationRhinocladiella sp. 1 R. atrovirens 100.0 R. atrovirens 99.6Trichoderma sp. 1 T. longibrachiatum 99.8 Trichoderma sp. 100.0Verticillium sp. 1 V. nigrescens 98.6 V. nigrescens 98.6No identification 1 Alternaria infectoria 98.8 A. infectoria 98.8No identification 1 Alternaria sp. 100.0 Alternaria sp. 100.0No identification 1 Arthrinium sacchari 99.2 A. sacchari 99.2No identification 1 Aspergillus fumigatus 100.0 A. fumigatus 100.0No identification 1 Aureobasidium pullulans 99.8 A. pullulans 100.0No identification 1 Aureobasidium pullulans 99.7 No identificationNo identification 9 Bjerkandera adusta 99.0 No identificationNo identification 1 C. globosum 99.7 C. globosum 99.5No identification 1 Chaetomium sp. 95.5 No identificationNo identification 1 Coprinellus sp. 97.0 Coprinellus sp. 97.0No identification 1 Curvularia trifolii 98.2 Curvularia sp. 98.2No identification 2 Epicoccum nigrum 100.0 No identificationNo identification 1 Histoplasma capsulatum 100.0 H. capsulatum 100.0No identification 1 Hormographiella aspergillata 99.8 H. aspergillata 99.8No identification 2 Hormographiella verticillata 100.0 H. verticillata 100.0No identification 1 Ophiostoma sp. 99.7 Ophiostoma sp. 99.7No identification 1 Phanerochaete sordida 99.0 P. sordida 99.0No identification 1 Phoma glomerata 99.2 No identificationNo identification 1 Rhinocladiella atrovirens 100.0 R. atrovirens 99.8No identification 1 Scedosporium apiospermum 100.0 S. apiospermum 100.0No identification 5 Schizophyllum commune 100.0 S. commune 100.0No identification 1 Sporothrix schenckii 100.0 S. schenckii 100.0No identification 2 No identification Agrocybe pediades 100.0No identification 1 No identification Chaetomium sp. 96.8No identification 1 No identification Chalara microchona 99.8No identification 1 No identification Cistella acuum 99.6No identification 1 No identification Diatrype sp. 97.1No identification 2 No identification Fomitopsis pinicola 99.1No identification 1 No identification Gloeophyllum trabeum 100.0No identification 1 No identification Irpex lacteus 99.3No identification 1 No identification Nectria vilior 98.1No identification 3 No identification Paecilomyces fumosoroseus 99.0No identification 1 No identification Penicillium cecidicola 99.8No identification 2 No identification Phaeosphaeria sp. 96.9No identification 1 No identification Phlebia tremellosa 99.8No identification 1 No identification Pleurotus sp. 100.0No identification 1 No identification Polyporus ciliatus 99.8No identification 2 No identification Psathyrella candolleana 98.2No identification 1 No identification Tilletiopsis washingtonensis 99.8No identification 1 No identification Trametes hirsuta 99.3No identification 1 No identification Verticillium sp. 99.5
No identification with phenotypic methods nor sequence analysis (n = 28)No identification 28 No identification No identification
a Number of isolates with identical result.b Percentage homology to reference sequence.
56 D.E. Ciardo et al. / Diagnostic Microbiology and Infectious Disease 59 (2007) 49–60

Author's personal copy
high sequence homology with other genera: for isolate 13, thesequence determined was misassigned to Phoma sp., whichhas a high homology (98.6%) to Leptosphaerulina sp., a non-pathogenic genus not included in the IMM database; forisolate 4, the sequence was assigned to Verticillium sp.instead of B. bassiana, a non-pathogenic species notincorporated in the IMM database. In 8 of the 13 discrepantisolates, phenotypic identification misassigned the isolate to ataxon which is morphologically similar to the speciesidentified by sequence analysis (isolates 1, 3, 5–8, 11, and12). In one case, the phenotypic misassignment was due topoor sporulation (isolate 14), whereas in another case (isolate2), it was due to atypical color of the mycelium. For isolate10, the discrepant result was due to a taxonomic problem. Onthe CBS homepage (www.cbs.knaw.nl/databases/index.htm),both Rhinocladiella atrovirens and Exophiala oligospermaare named as synonyms ofMelanchlenus oligospermus. Thisimplies that R. atrovirens and E. oligosperma are synonymsas well.
Comparison of phenotypic identification with sequenceanalysis using GenBank (NCBI) gave discrepant results in8 of the 225 isolates (Table 4). Isolate 9 was misassigned toMyrothecium sp. due to a missing reference sequence forConiothyrium fuckelii. The other 7 discrepant identificationsresulted from phenotypic misassignment due to phenotypic
similarities or atypical morphology (isolates 2, 5, 7, 8, 11, 12,and 14).
After resolution of the discrepant cases, the datacomparing phenotypic with molecular identification aresummarized in Table 6. By combining the databases, itbecomes evident that sequence analysis is significantlymore reliable than phenotypic identification: 52.0% (117/225) of the isolates could be assigned more accurately bysequence analysis. Phenotypic criteria were more specificin 9.4% (21/225). For 38.6% (87/225) of the isolates, both
Table 4Discrepant analysis (n = 15) ⁎
No. Phenotypicidentification
Sequence analysiswith the IMM database
Sequence analysiswith GenBank
Definite identification
1 Acremoniumpotronii a
Acremoniumkiliense, A. strictum
No identification A. kiliense, the sequence shows 75.3% homology to A. potronii
2 Acrophialophorafusispora a, b
Paecilomyces sp. P. inflatus P. inflatus, the color of the colony was not typical forPaecilomyces sp., but for A. fusispora
3 Alternaria sp. a Ulocladium sp. No identification Ulocladium sp., Alternaria and Ulocladium are closely related,showing high homologies in morphology and in ITS sequences
4 Beauveria bassiana a Verticillium sp. c Beauveria sp. B. bassiana, B. bassiana is not included in the IMM database5 Bjerkandera
sp. a, bGeotrichum candidum Geotrichum sp. G. candidum, the morphology of young cultures of Bjerkandera sp.
and G. candidum may be confused6 Chaetomium funicola a Chaetomium sp.,
not C. funicolaNo identification Chaetomium sp., the sequence of C. funicola shows 95.5% homology to
the sequence of this isolate; this is below the threshold for species assignment7,8 Chrysosporium
sp. a, b, ⁎Geomyces pannorum G. pannorum G. pannorum, Chrysosporium sp. and G. pannorum may be
phenotypically very similar9 Coniothyrium sp. C. fuckelii c Myrothecium sp. C. fuckelii, the misassignment of this isolate by GenBank is probably
due to a misassigned sequence entry for Myrothecium10 Exophiala sp. a Rhinocladiella atrovirens No identification E. oligosperma, R. atrovirens seems to be a synonym of E. oligosperma;
on the CBS homepage (http://www.cbs.knaw.nl/databases/index.htm),both species are named as synonyms of Melanchlenus oligospermus
11 Fusarium solani a, b F. oxysporum F. oxysporum F. oxysporum, F. oxysporum and F. solani are difficult to distinguish bymorphology; the sequence of this isolate shows 82.6% homology to F. solani
12 Mucor indicus a, b Mucor sp.,not M. indicus
Mucor sp.,not M. indicus
Mucor sp., the sequence of this isolate shows 82.6% homology to M. indicus;no further species assignment was possible
13 Leptosphaerulinasp. a
Phoma sp. No identification Leptosphaerulina sp., Leptosphaerulina sp. is not included inthe IMM database
14 Penicillium sp. a, b Aspergillus fumigatus A. fumigatus A. fumigatus, the isolate sporulated poorly with atypical conidia15 Phialophora sp. P. europaea c P. lignicola P. europaea, no sequence of P. europaea is available in public databases
a Discrepant result for IMM database versus phenotypic identification.b Discrepant result for GenBank versus phenotypic identification.c Discrepant result for IMM database versus GenBank.⁎ With the exception of G. pannorum (2 isolates) single isolates.
Table 5Comparison of identification by sequence analysis using the IMMdatabase versus GenBank (NCBI) after resolution of the discrepant cases(resolved data)
IMM database versus GenBank No. (%)
Identical species level identification 62 (27.6)Identical genus level identification 27 (12.0)Sequence analysis with IMM database more accurate 57 (25.3)Sequence analysis with GenBank (NCBI) more accurate 38 (16.9) a
No identification with either database 41 (18.2)Total 225 (100.0) b
a 34 of 38 were identified as species or genera not included in the IMMdatabase.
b Not included are 19 isolates, for which the ITS region could notbe amplified.
57D.E. Ciardo et al. / Diagnostic Microbiology and Infectious Disease 59 (2007) 49–60

Author's personal copy
methods gave concordant results: 13.8% (31/225) wereassigned to the identical species, 12.4% (28/225) tothe identical genus, and 12.4% (28/225) could not beidentified (Table 6).
4. Discussion
During the study period, almost one fifth (244/1320) ofpotentially clinically relevant mould isolates could not beidentified to the species level by phenotypic criteria withinreasonable time and were thus included in the study.Intraspecific variations in morphological characteristics likesize or color or representative structures may hinder pheno-typic identification (Mesa-Arango et al., 2002). Closelyrelated species often are distinguishable only by a singlephenotypic trait of limited discriminatory value, for example,Fusarium solani and F. oxysporum differ by the length oftheir monophialides (de Hoog et al., 2000). In addition, thegrowth rate affects identification as somemoulds may requireseveral weeks for sporulation, allowing for identificationonly a long time after collection of the sample (von Arx,1981). This applies especially to isolates from patients underantifungal treatment. In reference books such as the “Atlas ofClinical Fungi” (de Hoog et al., 2000), often only the mostrelevant representatives of a genus are included; species notyet recognized as medically relevant are scarcely referred to.Thus, species rarely encountered in the diagnostic laboratorymay be misassigned or remain unidentified due to missingexperience. In summary, unambiguous assignment of mouldisolates to a species based on morphological criteria isdifficult and requires considerable expertise.
Molecular methods are promising tools for the rapid andunambiguous identification of microorganisms in medicalmicrobiology laboratories (Bosshard et al., 2004; Bosshardet al., 2003; Chen et al., 2002; Ciardo et al., 2006). For themolecular identification of moulds, we have chosen the ITSregion included in the multicopy rRNA operon as target.Panfungal primers have been defined which allow amplifi-cation of the ITS region (White et al., 1990) and subsequentsequence analysis enabling the comparison of an isolate withan enormous number of sequence entries available in publicdatabases, that is, GenBank (NCBI). Unfortunately, public
databases contain misassigned sequences and, even moreimportant, lack some medically relevant species.
In this study, we have constructed an in-house databasecovering most of the medically relevant moulds as well asmoulds generally encountered in a medical mycologylaboratory. The database is based on sequences generatedin-house from well characterized isolates and on sequencesretrieved from public databases. It currently includes 1574sequence entries representing 516 species from 103 genera.To be included, sequences had to fulfill strict criteria, thatis, to show more than 95% homology to at least one otherindependent sequence entry of the same species (criterion ofindependent sequence confirmation). The cutoff of 95%sequence homology was chosen after extensive analyses ofintraspecies sequence homologies, which revealed thatapproximately 5% of the fungal species included in theIMM database show an intraspecies sequence homologyb95%. Sequences obtained in-house and sequencesretrieved from public databases were combined to deter-mine discrimination and sequence relatedness. This proce-dure allowed to exclude misassigned sequences (N300sequences from public databases were excluded) andensured the quality of the database. However, it alsorestricts its content to species with more than one sequenceentry. Since species assignments of single sequence entriesare difficult to verify in-silico, only the availability ofseveral sequence entries per species allows reliable speciesassignment of a sequence.
The prospective study included 244 clinical mouldisolates that could not be identified to the species level byphenotypic methods within meaningful time. The speciesisolated are representative for continental Europe, notincluding, for example, dimorphic fungi. Analysis of thefinalized identification results demonstrated the superiorityof molecular identification. Overall, 52% of the isolates wereidentified more accurately by sequence analysis compared tophenotypic methods (Table 6). Some potential caveatsshould be addressed when using sequence analysis foridentification. First, in rare instances ITS sequences of 2 ormore different species may exhibit high homology, that is,N98%, rendering an unambiguous assignment impossible.Second, for several fungi the ITS sequences have not yetbeen determined. This applies mainly for what are
Table 6Comparison of identification by phenotypic criteria with sequence analysis using the IMM database, GenBank (NCBI), and a combination of the 2 databasesafter resolution of discrepant cases (resolved data)
Phenotypic versus molecularidentification
Database (no., %)
IMM database GenBank Combined
Identical species level identification 31 (13.8) 24 (10.7) 31 (13.8)Identical genus level identification 28 (12.4) 30 (13.3) 28 (12.4)No identification with either method 53 (23.5) 42 (18.7) 28 (12.4)Sequence analysis more accurate 87 (38.7) 80 (35.5) 117 (52.0)Phenotypic criteria more accurate 26 (11.6) 49 (21.8) 21 (9.4)Total 225 (100.0) a 225 (100.0) a 225 (100.0) a
a Not included are 19 isolates, for which the ITS region could not be amplified.
58 D.E. Ciardo et al. / Diagnostic Microbiology and Infectious Disease 59 (2007) 49–60

Author's personal copy
considered environmental contaminants. In the presentstudy, 23.5% of isolates could be identified neither byphenotypic methods nor by sequence analysis with the IMMdatabase. Half of these isolates, however, could be identifiedby further sequence analysis with GenBank; the majority ofthese isolates were considered as medically not relevant(Table 3). However, as shown also in other studies (Hallet al., 2004), the available databases need to be enlarged toinclude more of clinically important species. Third, for someisolates, the ITS region could not be amplified. The varietyof species occurring in a mycological laboratory isconsiderable, rendering DNA extraction a challenge. In ourlaboratory, fungal DNA was primarily extracted withInstaGene matrix, a chelex-based solution, and in case ofamplification failure, the isolate was digested with Lyticase,a β-1,3-glucanase used to disintegrate the fungal cell wall.This second extraction was necessary in approximately onethird of the isolates but was not successful for 19 of 244isolates, probably due to insufficient amount of extractedDNA, which makes further improvements of DNA extrac-tion an important issue.
To summarize, phenotypic identification of moulds canbe difficult due to poor or missing sporulation, slowgrowth, or lack of experience. Based on our results, wepropose an algorithm for the effective use of availableidentification procedures. According to the analysis of thecontrol group, which revealed a major error of phenotypicidentification for only 1 of 70 isolates (Aspergillusversicolor versus Penicillium geastrivorus), we concludethat the phenotypic part of our identification algorithm issufficiently reliable to be implemented in the diagnosticlaboratory. If no phenotypic species identification can beachieved within 5 days following visual observation of firstgrowth, and the isolate is of possible clinical significance,the isolate is subjected to sequencing (Fig. 2). The resultingsequence spans most (N90%) of the ITS region and is firstcompared to the IMM database. If there is no match, that is,the isolate belongs to none of the species included in thedatabase, the sequence is compared to public databases. Inour hands, the use of a commercial database softwarepackage (SmartGene IDNS™) facilitated comparison ofsequences both with the IMM database as well as withsequence entries of public databases. The use of a high-quality database improves the quality of identification.Further work is required to improve nucleic acid extractionof moulds and to extend the database in order to makeidentification of moulds by ITS sequence analysis asreliable as 16S rRNA gene sequence determination foridentification of bacterial isolates (Bosshard et al., 2003;Christensen et al., 2005).
Acknowledgments
The authors thank the technicians in the mycology andmolecular diagnostic laboratories for their invaluablehelp, Stefan Emler for software support, and Burkhard
Springer and Boris Böddinghaus for critical comments onthe manuscript. This work was supported in part byresearch grant 54230401 of the University of Zürich,Switzerland, to P.B.
Appendix A. Supplementary material
Supplementary data associated with this articlecan be found in the online version, at doi:10.1016/j.diagmicrobio.2007.04.020.
References
Bosshard PP, Abels S, Zbinden R, Böttger EC, Altwegg M (2003)Ribosomal DNA sequencing for identification of aerobic Gram-positiverods in the clinical laboratory. J Clin Microbiol 41:4134–4140.
Bosshard PP, Abels S, Altwegg M, Böttger EC, Zbinden R (2004)Comparison of conventional and molecular methods for identificationof aerobic catalase-negative Gram-positive cocci in the clinicallaboratory. J Clin Microbiol 42:2065–2073.
Chen SC, Halliday CL, Meyer W (2002) A review of nucleic acid-baseddiagnostic tests for systemic mycoses with an emphasis on polymerasechain reaction-based assays. Med Mycol 40:333–357.
Christensen JJ, Andresen K, Justesen T, Kemp M (2005) Ribosomal DNAsequencing: experiences from use in the Danish National ReferenceLaboratory for Identification of Bacteria. APMIS 113:621–628.
Ciardo DE, Schär G, Böttger EC, Altwegg M, Bosshard PP (2006) Internaltranscribed spacer sequencing versus biochemical profiling for identi-fication of medically important yeasts. J Clin Microbiol 44:77–84.
de Hoog GS, Guarro J, Gené J, Figueras MJ (2000) Atlas of Clinical Fungi.2nd ed. Utrecht, the Netherlands and Reus, Spain: Centraalbureau voorSchimmelcultures and Universitat Rovira i Virgili.
Hall L, Wohlfiel S, Roberts GD (2004) Experience with the MicroSeq D2large-subunit ribosomal DNA sequencing kit for identification offilamentous fungi encountered in the clinical laboratory. J ClinMicrobiol 42:622–626.
Hinrikson HP, Hurst SF, Lott TJ, Warnock DW, Morrison CJ (2005)Assessment of ribosomal large-subunit D1–D2, internal transcribedspacer 1, and internal transcribed spacer 2 regions as targets formolecular identification of medically important Aspergillus species.J Clin Microbiol 43:2092–2103.
Husain S, Alexander BD, Munoz P, Avery RK, Houston S, Pruett T, JacobsR, Dominguez EA, Tollemar JG, Baumgarten K, Yu CM, Wagener MM,Linden P, Kusne S, Singh N (2003) Opportunistic mycelial fungalinfections in organ transplant recipients: emerging importance of non-Aspergillus mycelial fungi. Clin Infect Dis 37:221–229.
Iwen PC, Hinrichs SH, Rupp ME (2002) Utilization of the internaltranscribed spacer regions as molecular targets to detect and identifyhuman fungal pathogens. Med Mycol 40:87–109.
Kauffman CA (2001) Fungal infections in older adults. Clin Infect Dis33:550–555.
Kaufman D (2004) Fungal infection in the very low birthweight infant. CurrOpin Infect Dis 17:253–259.
Maertens J, Vrebos M, Boogaerts M (2001) Assessing risk factors forsystemic fungal infections. Eur J Cancer Care 10:56–62.
McNeil MM, Nash SL, Hajjeh RA, Phelan MA, Conn LA, Plikaytis BD,Warnock DW (2001) Trends in mortality due to invasive mycoticdiseases in the United States, 1980–1997. Clin Infect Dis 33:641–647.
Mesa-Arango AC, Del Rocio Reyes-Montes M, Perez-Mejia A, Navarro-Barranco H, Souza V, Zuniga G, Toriello C (2002) Phenotyping andgenotyping of Sporothrix schenckii isolates according to geographicorigin and clinical form of sporotrichosis. J Clin Microbiol40:3004–3011.
59D.E. Ciardo et al. / Diagnostic Microbiology and Infectious Disease 59 (2007) 49–60

Author's personal copy
Patterson JE, Peters J, Calhoon JH, Levine S, Anzueto A, Al-Abdely H,Sanchez R, Patterson TF, Rech M, Jorgensen JH, Rinaldi MG, Sako E,Johnson S, Speeg V, Halff GA, Trinkle JK (2000) Investigation andcontrol of aspergillosis and other filamentous fungal infections in solidorgan transplant recipients. Transpl Infect Dis 2:22–28.
Perea S, Patterson TF (2002) Antifungal resistance in pathogenic fungi. ClinInfect Dis 35:1073–1080.
Pfaller MA, Diekema DJ (2004) Rare and emerging opportunistic fungalpathogens: concern for resistance beyond Candida albicans and As-pergillus fumigatus. J Clin Microbiol 42:4419–4431.
Rooney AP, Ward TJ (2005) Evolution of a large ribosomal RNA multigenefamily in filamentous fungi: birth and death of a concerted evolutionparadigm. Proc Natl Acad Sci U S A 102:5084–5089.
Silveira F, Nucci M (2001) Emergence of black moulds in fungal disease:epidemiology and therapy. Curr Opin Infect Dis 14:679–684.
von Arx JA (1981) The Genera of Fungi Sporulating in Pure Culture.3rd ed. Vaduz, Switzerland: J. Cramer.
Walsh TJ, Groll A, Hiemenz J, Fleming R, Roilides E, Anaissie E (2004)Infections due to emerging and uncommon medically important fungalpathogens. Clin Microbiol Infect 10(Suppl 1):48–66.
White TJ, Bruns T, Lee S, Taylor J (1990) Amplification and directsequencing of fungal ribosomal RNA genes for phylogenetics. In: M.A.Innis, D.H. Gelfand, J.J. Sninsky, T.J. White, editors. PCR Protocols: aGuide to Methods and Applications. San Diego, CA: Academic Press,Inc., 1990. p. 315–322.
Wood V, Gwilliam R, Rajandream MA, Lyne M, Lyne R, Stewart A,Sgouros J, Peat N, Hayles J, Baker S, Basham D, Bowman S, Brooks K,Brown D, Brown S, Chillingworth T, Churcher C, Collins M, Connor R,Cronin A, Davis P, Feltwell T, Fraser A, Gentles S, Goble A, Hamlin N,Harris D, Hidalgo J, Hodgson G, Holroyd S, Hornsby T, Howarth S,Huckle EJ, Hunt S, Jagels K, James K, Jones L, Jones M, Leather S,McDonald S, McLean J, Mooney P, Moule S, Mungall K, Murphy L,Niblett D, Odell C, Oliver K, O'Neil S, Pearson D, Quail MA,Rabbinowitsch E, Rutherford K, Rutter S, Saunders D, Seeger K, SharpS, Skelton J, Simmonds M, Squares R, Squares S, Stevens K, Taylor K,Taylor RG, Tivey A, Walsh S, Warren T, Whitehead S, Woodward J,Volckaert G, Aert R, Robben J, Grymonprez B, Weltjens I, Vanstreels E,Rieger M, Schafer M, Muller-Auer S, Gabel C, Fuchs M, Dusterhoft A,Fritzc C, Holzer E, Moestl D, Hilbert H, Borzym K, Langer I, Beck A,Lehrach H, Reinhardt R, Pohl TM, Eger P, Zimmermann W, Wedler H,Wambutt R, Purnelle B, Goffeau A, Cadieu E, Dreano S, Gloux S,Lelaure V, Mottier S, Galibert F, Aves SJ, Xiang Z, Hunt C, Moore K,Hurst SM, Lucas M, Rochet M, Gaillardin C, Tallada VA, Garzon A,Thode G, Daga RR, Cruzado L, Jimenez J, SanchezM, del Rey F, BenitoJ, Dominguez A, Revuelta JL, Moreno S, Armstrong J, Forsburg SL,Cerutti L, Lowe T, McCombie WR, Paulsen I, Potashkin J, ShpakovskiGV, Ussery D, Barrell BG, Nurse P (2002) The genome sequence ofSchizosaccharomyces pombe. Nature 415:871–880.
Yeo SF, Wong B (2002) Current status of nonculture methods for diagnosisof invasive fungal infections. Clin Microbiol Rev 15:465–484.
60 D.E. Ciardo et al. / Diagnostic Microbiology and Infectious Disease 59 (2007) 49–60