2.1.1: government policy - la'o hamutuk home page recruitment and selection process will become...
TRANSCRIPT

República Democrática de Timor-Leste
Book 1 “Be a Good Citizen. Be a New Hero to our Nation”
Budget
Overview
201720172017 State BudgetState BudgetState Budget


Page 1 of 96
2017 State Budget Book 1
Contents
Part 1 : Speech of the Prime Ministers .............................................................................. 2
2.1: Executive Summary ............................................................................................ 3
2.2: A Review of Current Reforms in the Public Sector ................................................ 6
2.3: Economic Overview .......................................................................................... 10
2.4: Monitoring Socioeconomic Indicators ............................................................... 17
2.5: Expenditure and Development Partners’ Commitments .................................... 23
2.6: Revenue ........................................................................................................... 33
2.7: Financing .......................................................................................................... 46
Part 3 : 2017 General State Budget Law .......................................................................... 56
Part 4 : Supporting Documents ....................................................................................... 94

Page 2 of 96
Part 1: Speech of the Prime Minister

Page 3 of 96
Part 2: Description and Analysis of the 2017 State
Budget
2.1: Executive Summary
2.1.1: Government Policy
The Government of Timor-Leste’s policies as guided by Strategic Development Plan are laid
out in the Annual State Budget, with the long-term objective to become an upper middle
income country by 2030. Achieving this goal, the Government is investing in infrastructure
and key economic sectors including tourism, health, education and agriculture. Budget Book
1 for 2017 summarizes the plans on pursuing these policies for the coming fiscal year.
Table 2.1.1.1: Combined Sources Budget 2015-2021, $ million
2015
Actual 2016
BB1 Rec 2017
Budget 2018 2019 2020 2021
Combined Sources Budget 1,562.9 2,157.5 1,543.4 2,379.3 2,549.4 2,182.1 1,952.4
Government Expenditures by Fund
1,340.2 1,952.9 1,386.8 2,271.0 2,480.1 2,142.2 1,952.4
CFTL (excl. loans) 1,068.8 1,811.9 1,257.8 1,930.4 1,986.3 1,788.1 1,694.4
HCDF 32.0 34.0 27.2 29.9 32.9 36.2 39.8
Infrastructure Fund (Special Fund, excl. loans)
215.6 - - - - - -
Loans 23.8 107.0 101.8 310.7 460.8 317.8 218.2
Development Partner Commitments
222.7 204.6 156.6 108.3 69.3 39.9 -
Sources: National Directorate of Budget and Development Partnership Management Unit, Ministry of Finance, 2016
2.1.2: Economic Growth
Becoming an upper middle income country by 2030 requires strong, high-quality non-oil
economic growth. Public investment seen from 2007 to 2014 through the frontloading fiscal
policy has driven growth in the non-oil economy, averaging at 8.6% per year. This was aimed
at providing necessary foundations for long-term sustainable private sector led development.
The real non-oil GDP growth significantly increased in 2014 to 5.9%, up from 2.8% in 2013
following the completion of the electricity project. In particular, household consumption
increased by 9.8% suggesting that living standards are continuing to increase in Timor-Leste.
The 17.3% growth in private sector investment shows that, in line with the Strategic
Development Plan (SDP) and the frontloading policy, strong progress is being made in
developing the private sector.

Page 4 of 96
2.1.3: Expenditure
Total expenditure in the 2017 budget is $1,386.8 million (excluding donor funded activities).
This is lower than the amount in the 2016 rectification Budget (see Table 2.1.3.1). The VI
Constitutional Government is committed to ensuring a prudent level of spending by
maintaining the overall size of the budget and reviewing existing programs to ensure
maximum returns on every dollar spent. Government expenditures have therefore been
reviewed to prioritize programs and sectors with high returns and which are directly in line
with the SDP objectives.
The Government is continuing to implement its frontloading policy to attract private
investment. With the successful implementation of the electricity project, focus is now
shifting towards investment in roads, ports, airports and bridges. As a result, expenditures,
particularly on key sectors and priority infrastructure projects, will remain high until 2025.
However by 2025, some SDP priority projects will begin to near completion and expenditure
and excess withdrawals are expected to fall. Over the long-term expenditure will fall further
whilst domestic revenue will continue to increase, allowing excess withdrawals to fall.
Table 2.1.3.1: Fiscal Table with Memorandum Items, $ million
2013 Act.
2014 Act.
2015 Act.
2016 BB1 Rec
2017 Budget
2018 2019 2020 2021
Total Expenditure by Appropriation Category (incl. loans)
1,081.4 1,337.4 1,340.2 1,952.9 1,386.8 2,271.0 2,480.1 2,142.2 1,952.4
Total Expenditure by Appropriation Category (excl. loans)
1,075.1 1,321.6 1,316.4 1,845.9 1,285.0 1,960.3 2,019.2 1,824.3 1,734.2
Recurrent 730.9 912.7 1,033.7 1,106.9 1,025.9 1,068.6 1,113.1 1,159.6 1,208.2
Salary and Wages 141.8 162.5 173.3 181.9 208.8 217.2 225.9 234.9 244.3
Goods and Services (including HCDF)
392.0 458.7 427.5 449.0 395.8 413.3 431.6 450.8 471.0
Public Transfers 197.0 291.5 432.9 476.0 421.3 438.1 455.6 473.9 492.8
Capital 350.5 424.6 306.5 846.0 360.9 1,202.4 1,366.9 982.6 744.2
Minor Capital 40.0 53.3 33.8 18.8 11.9 12.3 12.8 13.4 13.9
Capital and Development (including all Infrastructure& loans)
310.5 371.4 272.8 827.2 349.0 1,190.1 1,354.1 969.2 730.3
Domestic Revenue 151.1 170.2 170.0 171.4 206.2 219.3 233.3 247.9 263.3
Non-Oil Fiscal Balance (930.3) (1,167.1) (1,170.2) (1,781.5) (1,180.6) (2,051.7) (2,246.8) (1,894.2) (1,689.1)
Financing 930.3 1,167.1 1,170.2 1,781.5 1,180.6 2,051.7 2,246.8 1,894.2 1,689.1
Estimated Sustainable Income (ESI)
787.0 632.3 638.5 544.8 481.6 475.1 447.9 419.6 393.3
Excess Withdrawals from the PF
(57.0) 99.7 640.0 1,129.7 597.1 1,265.9 1,338.1 1,156.8 1,077.5
Use of Cash Balance 194.0 419.4 (132.2) - - - - - -

Page 5 of 96
Borrowing/Loans 6.3 15.8 23.8 107.0 101.8 310.7 460.8 317.8 218.2
Sources: National Directorate of Budget, National Directorate of Economic Policy, Petroleum Fund Administration Unit and Major Projects Secretariat, Ministry of Finance, 2016
2.1.4: Domestic Revenue
Domestic revenues are performing strongly in 2016, and are forecast to exceed their targets,
due in part to some large one-off payments of arrears, but also due to improving performance
by the revenue collection agencies. For 2017, domestic revenues are forecast to increase by
4.3%. This is triggered by an improvement in Government services to the public as well as by
improvements in collection. Positive trends in domestic revenues are expected to continue in
the medium term due to a combination of improvements in administration and strong
economic performance (see Table 2.6.1.1).
2.1.5: Financing
The non-oil deficit is equal to domestic revenue minus expenditure (see Table 2.7.1.1.). The
Government is using the Estimated Sustainable Income (ESI), excess withdrawals from the
Petroleum Fund (PF), and loans to finance the non-oil deficit in 2017. The non-oil deficit
provides an approximate estimate of the amount of additional demand and money
Government spending is contributing to the economy.
The ESI for 2017 is calculated at $481.6 million and represents the amount that can be
withdrawn from the PF, each year. The total amount budgeted to be withdrawn from the PF
in 2017 is $1,078.8 million, with excess withdrawals of $597.1 million. The Government
considers that excess withdrawals are necessary in the medium term to finance priority
capital expenditures.
Loans are becoming an increasingly important tool for financing in the Government of Timor-
Leste. The current loans contracted by the Government of Timor-Leste are used to finance
key infrastructure projects and have relatively low rates of interest and significant grace
periods. Total loan financing for 2017 is $101.8 million.

Page 6 of 96
2.2: A Review of Current Reforms in the Public Sector
2.2.1: Ongoing Reforms in the Public Sector
There are four ongoing reforms that the VI Constitutional Government has instituted,
including the Legislative Reforms, Public Administration Reforms, Economic Reforms and
Fiscal Reform.
2.2.1.1: The Legislative Reforms
The objective of the legislative harmonization and judiciary reform is to create a strong and
efficient judicial system and is being led by the Legislative Reform Committee. The reform
will follow a threefold strategy. First, the reforms will establish a new framework in line with
regional and international standards. For example, laws currently processing through
Parliament include land entitlement law, expropriation of public utility law, drug laws and
human trafficking law.
Second, the reforms will reinforce the relationship between the specific bodies and
institutions in the judicial system with the establishment of an Advocacy and Discipline
Council, akin to a Bar Association, now processing through Parliament. The reforms have
already enabled the establishment of the Police Scientific Criminal Investigation (SPCI), the
gradual increase in the quantity and quality of judges, prosecutors and public defenders and
new infrastructure buildings in municipalities for delegations of the Public Prosecutor Office
and Public Defenders Office. Currently the Ministry of Justice is working on the reform of the
Judicial Training Centre (JTC), a center for improving the human resource capacity in the
Justice sector.
Finally, it will carry out a procedural reform, ensuring timely access to the justice system and
easy exercise of the rights of citizens and legal entities. The Government has started
implementing two languages (Portuguese-Tetum) in law, including in the judiciary system, to
guarantee all citizens are able to access justice.
Overall, the reform will improve the legislative and judiciary sector’s ability to guarantee and
protect people’s rights and contribute to sustainable development through national stability.
2.2.1.2: The Public Administration Reform
The mandate of the VI Constitutional Government coincides with the beginning of the second
mandate of the Civil Service Commission (CSC) 2015-2020. The priorities established by the
Government for the reform of Public Administration are translated into the activities of the
CSC which are categorized into five important pillars, known as the “5Rs”:

Page 7 of 96
The first pillar is the Revision of Regulatory Framework, which continues in 2017 with the
revision of regulations governing Public Service in the area of recruitment, selection and
promotion of staff and a proposal of an adequate career regime for different arrangements
of contract service in the Public Service. The recruitment and selection process will become
more agile and efficient in evaluating the technical knowledge, skills and professional
experience of the candidates.
The second pillar is restructuring. The Public Service workforce will undertake a diagnostic
process to understand skill and capacity levels, to ensure a quality service to the population.
The results of this diagnosis will guide the restructuring process of the Public Service to be
implemented in 2017 with the goal of providing better services.
The third pillar is Revitalizing the Working Culture, through the approval and implementation
of measures to improve the motivation of public servants, dissemination of good practices
and promotion of work ethics in the workplace.
The fourth pillar is Reinvention of Human Resource Management. The CSC will promote
training and capacity building activities for managers and provide support to the process of
managers’ empowerment. The objective of these exercises is to create conditions for these
managers to carry out their functions effectively in the management and development of staff
in their respective institutions.
The fifth and final pillar is the Optimization of the Workforce, with the creation of working
conditions for each institution of the Public Service to adequately define the organizational
structure, from a mere financial perspective to a human resource management perspective.
2.2.1.3: The Economic Reform
The Office of the Minister of State, Coordinating Minister of Economic Affairs (MECAE) assists
the Prime Minister in taking specific responsibility for the work and activities of the ministries
and Secretary of State that provide support for economic development and private sector
development.
In 2015 MECAE submitted to the Government the adoption of the Guide for Economic Reform
and Growth for Timor-Leste 2015 - 2017 (GRFE) to ensure more effective and efficient
coordination of economic affairs. This guide was approved by the Council of Ministers on 24
November 2015 and consists of five priority economic pillars: (1) oil and gas, (2) agriculture,
(3) fisheries, (4) tourism, and (5) manufacturing industry, and seven reform areas: (1) land
and property regulation, (2) economic infrastructure development, (3) labor market
regulation and workforce development, (4) business environment reform, (5) fiscal reform,
(6) private investment reform, and (7) private sector development reform.

Page 8 of 96
Figure 2.2.1.3.1 Uma Lulik guide for Economic Reform
MECAE has been actively involved in coordinating line-ministries, secretary of state and
agencies under its mandate to ensure policies are in place, programs and proper reforms are
being implemented accordingly, implementation issues are addressed and resolved, ensure
annual plans and their additional budget for recurrent activities are well captured in the
Annual Action Plan 2017. MECAE has submitted and had approved by the Council of Ministers
the following legal frameworks: Private Investment Law, Law of Commercial Companies, Law
of Certificates of Origin, and Export Promotion Law. Further the Private Investment Law and
the Law of Commercial Companies require approval by the Parliament.
In agriculture, MECAE in conjunction with Ministry of Agriculture and Fisheries has developed
sectoral investment plans in the coffee sector and forestry sector. In tourism, MECAE is
working with the Ministry of Tourism to develop a Tourism Policy and an economic model to
estimate the impact of tourism expenditure in the economy. In the manufacturing sector,
MECAE is developing an Industrial Policy in conjunction with the Ministry of Commerce,
Industry and the Environment. MECAE is also working to reform the business environment by
improving the operation of SERVE, reforming government’s approach to investment
promotion and facilitation and drafting policies and laws on competition, bankruptcy and
insolvency and a commercial code.
2.2.1.4: The Fiscal Reform
The Fiscal Reform aims to ensure the fiscal sustainability of Timor-Leste in the medium and
long term by achieving a balance between State expenditures and revenues. It is the sum of
two separate but interrelated reform processes, each with its own set of goals: Tax Reform
and Public Expenditure Reform.

Page 9 of 96
The Tax Reform aims to increase revenue from non-petroleum resources to 15% of non-oil
GDP by 2020. In order to do this, the Tax Reform seeks to provide Timor-Leste with modern
taxation legislation that will enable the Government to collect the necessary revenues for
pursuing its Strategic Development Plan. The introduction of a Value-Added Tax (VAT) Law,
the revision of the Tax and Duties Act, and the modernization of the Customs Procedures
Code and the Tax Procedure Code are the main components of this area of reform.
Throughout the drafting stage of these laws, extensive public consultations were undertaken
to inform and receive valuable inputs from the public and private sector, civil society and
multilateral institutions (ADB, IMF, World Bank). A national public information campaign is in
place and will continue in the coming months and years to support businesses, government,
and the wider public during the implementation of these laws and reforms.
The other major area of the Tax Reform is the modernization of the Tax and Customs
Administration through the updating of existing IT systems, provision of advanced training to
Tax and Customs officers, and the streamlining of processes and procedures. A tax
administration mission undertook intensive diagnostic and provided wide ranging and
detailed recommendations aimed at a complete overhaul of the Tax Administration.
The Ministry of Finance through the Fiscal Reform Commission is also coordinating the work
on the modernization of the Customs Administration being carried out in the wider context
of Trade Facilitation. This includes intensive training to both customs officials and brokers,
the upgrade of the ASYCUDA++ IT System to ASYCUDA World, the update of the Harmonized
System (HS) codes and, in the coming months, the implementation of the new Customs
Procedures Code. The Government is strongly committed to the reform of Customs and has
passed a resolution on Trade Facilitation to support this commitment, as well as its intention
to link Timor-Leste with both the ASEAN and CPLP Single Windows.
The Public Expenditure Reform component of Fiscal Reform seeks to ensure that public
resources are used as efficiently and effectively as possible, resulting in an increase in the
quantity and quality of public services and fostering productivity and economic
diversification. The Public Expenditure Reform agenda includes measures geared towards
increasing financial controls on public expenditure, eliminating wasteful and superfluous
spending, improving the links between planning and budgeting to focus public expenditure
on the development objectives outlined in the SDP, introducing an effective system for jointly
monitoring and evaluating both the quantity and quality of Public Expenditure, and increasing
the progressivity of public expenditure. The Fiscal Reform is also working on developing
comprehensive legal and governance frameworks for fees and charges. This area of reform
sits at the crossroads of Tax and Expenditure Reform, as it aims to simultaneously rationalize
costs through more efficient service delivery in sectors such as electricity, water and
sanitation, as well as to advance towards cost recovery in these sectors. The Ministry of

Page 10 of 96
Finance through the Fiscal Reform Commission will intensify work in this reform area after
the draft Tax and Customs legislative package is approved by Parliament.
Together, the reforms in all these areas will go a long way towards achieving fiscal
sustainability. It is, however, an ambitious reform agenda that will require the sustained and
concerted efforts of the public sector, the private sector, civil society, development partners,
and the people of Timor-Leste.
2.3: Economic Overview
2.3.1: International Economy
2.3.1.1: Trends in International Growth
The IMF is expecting global growth in 2016 to be a moderate 3.1% following the gradual
recovery in oil and financial markets in the early part of 2016. While emerging markets and
developing economies are expected to recover and normalize out to 2017, growth in most
advanced economies remains slow. The outcome of the UK referendum in favor of leaving
the European Union has led to an increase in uncertainty and therefore a deterioration in the
global outlook for 2016-17. This is most likely to affect advanced economies, particularly
those within the EU.
The growth picture in the emerging markets and developing economies is diverse yet growth
is overall projected to increase from 4.0% in 2015 to 4.1% in 2016 and 4.6% in 2017. The
increase in the growth is driven by some improvement for a few large emerging markets—in
particular Brazil and Russia, yet pulled down by Sub-Saharan Africa, where many of the larger
economies are adjusting to lower commodity revenues. Despite China’s transition to a more
balanced growth path after a decade of strong credit and investment growth, Emerging and
Developing Asia remains one of the world’s high growth areas (see Table 2.3.1.1.1) and Timor‐
Leste is performing well within this group of economies. The increased demand for goods and
services associated with the strong growth outlook in Asian markets represent an important
export opportunity for Timor-Leste.

Page 11 of 96
Table 2.3.1.1.1 Real Economic Growth 2015–2017 (%)
Country Actual Projections
2014 2015 2016 2017
World 3.4% 3.1% 3.1% 3.4%
Advanced economies 1.9% 1.9% 1.8% 1.8%
Emerging and Developing Economies 4.6% 4.0% 4.1% 4.6%
Emerging and Developing Asia 6.8% 6.6% 6.4% 6.3%
China 7.3% 6.9% 6.6% 6.2%
Euro area 0.9% 1.7% 1.6% 1.4%
Timor-Leste (non-oil) 5.9% 3.5%* 5.4% 3.9% Sources: World Economic Outlook Update July 2016 (IMF), Ministry of Finance, 2016 *Growth forecast
2.3.1.2: Trends in International Prices
According to the IMF, global inflation is projected to remain stable at 2.8% in 2016. Inflation
in advanced economies is projected to increase slowly from 0.3% in 2015 to 0.7% in 2016 but
remaining below most central bank targets, mostly as a result of the decline in oil prices. In
contrast, commodity-exporting emerging market and developing economies are continuing
to adapt to the decline in commodity prices and inflation is expected to fall to 4.5% in 2016,
from 4.7% in 2015.
Table 2.3.1.2.1: Global and Regional Inflation Rates (%)
Country Actual Forecast
2014 2015 2016 2017
World 3.2% 2.8% 2.8% 3.0%
Advanced Economies 1.4% 0.3% 0.7% 1.5%
Emerging and Developing Economies 4.7% 4.7% 4.5% 4.2%
Emerging and Developing Asia 3.5% 2.7% 2.9% 3.2%
Timor Leste 0.7% 0.6% -1.6%* - Sources: World Economic Outlook Update April 2016 (IMF), General Directorate of Statistics (MoF, 2016) * To July 2016
Oil Prices
The international price of Brent oil has witnessed dramatic declines since June 2014 from
highs of $1151 per barrel as a result of increased global supply, while global demand has
decreased. More recently, however, the oil market has begun to recover from around late
January 2016 and prices have bounced back, up by 67% to an average of $46.53 per barrel in
July 2016. The declines in excess oil supply, due predominantly to a gradual slowdown in
1 Bloomberg data

Page 12 of 96
non-OPEC production and some supply disruptions (notably in Nigeria and Canada), have
helped push oil prices back up. This recovery is projected to continue out to 2017, with prices
estimated to reach $50 per barrel in 2017 (see Figure 2.3.1.2.2).
Agricultural Commodity Prices
A significant proportion of the food consumed in Timor-Leste is imported and thus changes
in international food prices can have a significant impact on both the rate of inflation and
standard of living. According to the International Monetary Fund’s (IMF) Food Price Index
international food prices fell by 29.0% between April 2014 and November 2015. Following
this, food prices began to recover, increasing by 14% in 2016. The IMF is forecasting that food
prices will continue to rise marginally throughout the rest of 2016 before stabilizing well
below the highs witnessed in 2014 (see Figure 2.3.1.2.2). This will benefit poorer households
in Timor-Leste.
Foreign Exchange Rates
The general appreciation of the US dollar against the currencies of Timor-Leste’s trading
partners, which began in early 2014, continued into the early part of 2016 but has now started
to subside. The US dollar appreciated by only 0.3% against a weighted basket of Timor-Leste’s
major trading partners’ currencies in the 12 months leading to July 2016. The appreciation in
the last few years has reduced the price of imports, placing downward pressure on domestic
inflation, benefiting Timorese consumers. However, this appreciation makes Timorese non-
oil exports more expensive in international markets constraining the development of the
country’s exports sector. Now that this appreciation is easing, the Timorese export market
will be well-placed in the international market.
Figure 2.3.1.2.2: Actual and Forecast Commodity Prices
Source: Primary Commodity Prices (IMF), Bloomberg
0
20
40
60
80
100
120
140
160
Mar
-10
Au
g-1
0
Jan
-11
Jun
-11
No
v-1
1
Ap
r-1
2
Sep
-12
Feb
-13
Jul-
13
De
c-1
3
May
-14
Oct
-14
Mar
-15
Au
g-1
5
Jan
-16
Jun
-16
No
v-1
6
Ap
r-1
7
Sep
-17
Feb
-18
Jul-
18
De
c-1
8
May
-19
Oct
-19
Brent oil price index Food price index

Page 13 of 96
2.3.2: Domestic Economy
2.3.2.1: Timor-Leste’s Recent Economic Performance
In 2014, total (oil and non-oil) real GDP in Timor-Leste decreased by 27.8% to $3,033 million
(in constant 2010 prices). The large decrease is attributed to the decline in the oil sector
(39.9%), which dominates the economy (see Table 2.3.2.1.1), as the volume of oil extracted
decreased significantly across the year (31%) from 65.4 million barrels to 44.9 million barrels.
The decrease in extraction volumes followed the low international prices of oil, as detailed in
the Section 2.3.1.2.
However, given the relatively small level of employment in the oil sector, total GDP is not the
best measure of economic performance for Timor-Leste. Instead, it is more useful to monitor
economic performance using non-oil GDP together with a wide variety of other indicators
relating to the non-oil economy. This approach provides a more accurate indication of the
real impact of changes in the economy on the people of Timor-Leste.
Table 2.3.2.1.1: Real GDP by Sector, Timor-Leste 2014
GDP, $ millions Percent of Whole
Whole Economy 3,033 100%
Petroleum Sector 1,859 61%
Non-petroleum Sector 1,174 39% Source: Statistics Directorate, Ministry of Finance 2016
2.3.2.2: Non-Oil Economy
Timor-Leste has experienced exceptionally high non-oil GDP growth in recent years, averaging
8.6% per year over 2007-2014. These strong growth rates have been driven by increases in
government expenditure associated with the government’s temporary frontloading strategy
to ensure that Timor-Leste has the necessary infrastructure to allow the private sector to
flourish in the long-run. The Government’s frontloading strategy uses loan financing and
excess withdrawals 2 from the Petroleum Fund to finance high quality investment in
infrastructure and human capital development. As outlined in Timor-Leste’s Strategic
Development Plan, the Government’s high return investments will provide the necessary
foundations for long-term sustainable private sector led development. These investments are
stimulating economic growth, leading to higher domestic revenues and more sustainable
government finances, which will allow excess withdrawals to return to levels consistent with
the ESI. The frontloading policy has already allowed the Government to significantly upgrade
2Withdrawals from the Petroleum Fund in excess of the ESI.

Page 14 of 96
road and electricity coverage throughout Timor-Leste, which has helped to improve both
living standards and the business environment.
Table 2.3.2.2.1 shows that trend non-oil GDP growth significantly increased in 2014 to 5.9%,
up from 2.8% in 2013. The high level of economic growth witnessed in 2014 is the result of a
combination of strong growth in private sector investment, household consumption and
increases in Government capital expenditure, associated with the frontloading policy. Aided
by the low inflationary environment, household consumption increased by 9.8% suggesting
that living standards are continuing to increase in Timor-Leste. The 17.3% growth in private
sector investment shows that, in line with the Strategic Development Plan (SDP) and the
frontloading policy, strong progress is being made in developing the private sector.
Table 2.3.2.2.1: Real GDP 2008 - 2014, $ millions
2008 2009 2010 2011 2012 2013 2014
Non-Oil Sector ($m) 756 854 941 1,019 1,078 1,109 1,174
Non-Oil Sector Growth 14% 13.0% 10.1% 8.2% 5.8% 2.8% 5.9%
Source: Statistics Directorate, Ministry of Finance 2016
Sectoral Performance
The performance across the major sectors of the Timorese economy has been mixed in 2014.
High growth levels were witnessed in the construction sector (16.1%) and the area of public
administration, highly correlated with the increase in government capital expenditure linked
to the frontloading strategy and an increase in public sector employment. Output in the
agriculture sector decreased by 2.6% in 2014. Finally, the wholesale and retail trade sector
increased by 3.0% in 2014.
Figure 2.3.2.2.2: 2014 Real Non-Oil GDP by Industry 2012–2014, $ million
Source: Statistics Directorate, Ministry of Finance 2016
$0 $50 $100 $150 $200 $250 $300
Agriculture
Public Administration
Retail and Wholesale
Construction
Manufacturing
2012 2013 2014

Page 15 of 96
Inflation
In 2014, year‐on‐year inflation in Timor‐Leste was low, averaging 0.7% across the year. This
low and stable inflationary environment followed a period of highly volatile prices between
2011 and 2013 and this new period of low and stable inflation is welcomed by both
households and businesses. In 2015, year-on-year inflation remained low, averaging 0.6%
across the year, before falling negative in 2016, averaging -1.6% up to August 2016. As
detailed in Section 2.3.1.2, a strong dollar and lower international oil and food prices are the
main reasons for Timor Leste’s low inflation rate. Lower prices in Timor-Leste is consistent
with the Government’s poverty reduction strategy, providing Timorese consumers and
business with greater purchasing power.
Figure 2.3.2.2.3: Change in Consumer Price Index Timor-Leste 2010-2016 (%)
Sources: National Directorate of Economic Policy and Statistics Directorate, Ministry of Finance 2016
2.3.2.3: Employment
According to the Business Activity Index (BAS), there were 62,200 people formally employed
in Timor-Leste businesses in 2014. This represented an 8% increase since 2013. The
construction sector is the main contributor to the increase in formal sector employment, with
formal construction jobs increasing by 23% between 2013 and 2014. The construction sector
is the largest employer, responsible for almost one quarter of all formal sector employment.
Within the public sector, the number of Public and Civil Servants reached 33,800 in 2014. This
represents an 18.9% increase since 2013 following the Government’s decision to give work
contracts to around 4,000 volunteer teachers. In 2015, the number of Public and Civil Servants
also increased once again, by 1.6%, to 34,300.
-5%
0%
5%
10%
15%
20%
Mar
-10
Jun
-10
Sep
-10
Dec
-10
Mar
-11
Jun
-11
Sep
-11
Dec
-11
Mar
-12
Jun
-12
Sep
-12
Dec
-12
Mar
-13
Jun
-13
Sep
-13
Dec
-13
Mar
-14
Jun
-14
Sep
-14
Dec
-14
Mar
-15
Jun
-15
Sep
-15
Dec
-15
Mar
-16
Jun
-16
Overall CPI Food and Non-Alcholic Beverages Core CPI

Page 16 of 96
2.3.3: Short to Medium-Term Prospects (2015-2019)
The Ministry of Finance is forecasting non-oil GDP growth in the 3.5% to 6.5%3 range in the
medium term (see Figure 2.3.3.1). After the strong growth witnessed in 2014, a slightly slower
rate of growth is expected in 2015 while government expenditure remains flat. Following
this, growth is expected to pick up once again as large Government financed projects enter
their high-spending phases, and the resulting infrastructure assets create a conducive
environment for strong growth in private sector investment.
Figure 2.3.3.1 Government Expenditure ($m, LHS) and real non-oil GDP growth (RHS)
Sources: Source: Timor-Leste National Accounts 2000-2014, General Directorate of Statistics (MoF, 2016) and
Economic Forecasts (National Directorate of Economic Policy, MoF, 2016)
Over the medium-term, several large-scale private sector investments will commence
resulting in a significant increase in private sector investment across the forecast period to
2019. 2016 is a strong year for private sector investment in Timor-Leste with the
commencement of the Heineken manufacturing facility in Hera, the cement packing terminal
in Liquica, and the expansion of existing commercial and retail properties throughout the
country. 2017 will see construction begin on the Tibar Bay Port, and over the longer term
other private sector investments will commence operations as illustrated in Figure 2.3.3.2.
Such investments are consistent with the Government’s frontloading strategy as investments
3 The real GDP growth forecasts are based on 2010 prices. In 2017, the National Accounts 2015 will be rebased to 2015 prices to ensure the data reflects a more current snapshot of the economy, improving the coverage of economic activities included in the GDP compilation framework. Rebasing is a normal statistical procedure undertaken by countries’ national statistical offices. This will, however, mean that the forecasts and the growth figures for future years will not be directly comparable.
12.9%
10.1%
8.2%
5.8%
2.8%
5.9%
3.5%
5.4%
3.9%
6.0%6.5%
0.0%
2.0%
4.0%
6.0%
8.0%
10.0%
12.0%
14.0%
0
200
400
600
800
1,000
1,200
1,400
1,600
2009 2010 2011 2012 2013 2014 2015 2016 2017 2018 2019

Page 17 of 96
in the road network, provision of electricity and education have played a key role in attracting
these investors and consequently, creating jobs domestically.
The medium-term outlook for Timorese consumers is also positive with consumption set to
grow steadily, boosted by a low inflationary environment. Looking forward across the
medium-term, this environment is likely to continue given the world commodity price outlook
and exchange rate projections (see Figure 2.3.1.2.2).
Figure 2.3.3.2 Investment as a % of non-oil GDP, 2008-2019
Sources: Timor-Leste National Accounts 2008-2014, General Directorate of Statistics (MoF) and Economic
Forecasts (National Directorate of Economic Policy, MoF)
2.4: Monitoring Socioeconomic Indicators
2.4.1: Reviewing the Millennium Development Goals
Goal 1: Eradicate Poverty and Hunger
The 2007 Timor Leste Standard of Living Survey (TLSLS-2) indicated that 50.4% of Timorese
people lived under the national poverty line of $25.14 per month. The new 2014 TLSLS-3
indicates that the national poverty line has risen to $46.37, but the proportion living below
the poverty line has fallen to 41.8% and hence that the poverty rate has declined by 8.1
percentage points over the past seven years.
Child malnutrition has fallen slightly over the past 7 years, from 48.6% in 2007 to 45% in 2015.
However, and despite some improvements, the prevalence of underweight children remains
above the MDG target of 31% and very high on a global level.
0%
10%
20%
30%
40%
50%
60%
70%
80%
90%
2008 2009 2010 2011 2012 2013 2014 2015 2016 2017 2018 2019
Private sector Investment (%) Public Sector Investment ($%) Total Investment (%)

Page 18 of 96
Goal 2: Achieve Universal Primary Education
Net enrolment rate in primary education has gone up substantially from 66% in 2007 to 82.7%
in 2015, whilst the literacy rate of youth in Timor-Leste has decreased slightly between 2007
and 2015 by 6%. Overall Timor-Leste did not meet the 100% targets even though education
has long assumed a central role in the Government’s efforts towards national development.
Goal 3: Promote Gender Equality and Empower Women
Timor-Leste has achieved all targets under Goal 3. The percentage of seats occupied by
women in Parliament is now 39% and exceeds the MDG target of 35%. The country has also
surpassed the targets set for ratios of girls to boys in primary, pre secondary and secondary
school, setting an example for gender equity in education, an achievement few other
developing countries can claim.
Goal 4: Reduce Child Mortality
According to the Demographic Health Survey (DHS) 2009-2010, Timor-Leste has already
achieved its target of reducing under-five infant mortality by two thirds. The infant mortality
rate decreased from 60% to 45% between 2007 and 2015. The number of children immunized
against measles in 2007 was 63%, shows 11% increase over the past 7 years.
Goal 5: Improve Maternal Health
Maternal mortality has fallen dramatically from 450 per 100,000 live births in 2007 to 215 per
100,000 live births4 in 2015 and therefore Timor-Leste has achieved the target of less than
252 per 100,000. Antenatal care of at least one visit also has been achieved due to a
significant increase by approximately 20 percentage points over the past 7 years from 67.9%
to 86%.
Also, Timor-Leste has made good progress in births attended by skilled health personnel,
contraceptive prevalence and antenatal proportion of births attended by skilled health
personnel. The proportion of births attended by skilled health personnel has increased
significantly over the past 7 years by approximately 12%.
Goal 6: Combat HIV/AIDS, Malaria and other Diseases
Timor-Leste has made remarkable progress in decreasing incidence and death rates
associated with malaria. The number of children under 5 sleeping under an insecticide treated
4 This figure is taken from the forthcoming 2015 Demographic and Health Survey.

Page 19 of 96
mosquito net has now risen to 89% from 45% between 2007 and 2015 and the rate of
incidence associated with malaria has gone down to 11.3% from 20.6% in 2014.
TB related cases have been made a good progress, however, Timor-Leste did not meet the
MDG target by 2015. Moreover, the proportion of population aged 15-24 who has
comprehensive knowledge of HIV/AIDS has increase slightly to 37% in 2015, from 12.9% in
2007.
Goal 7: Ensure Environmental Sustainability
The 2010 Census suggests that 50% of land is covered by forest in 2015. The recent expansion
of the national electricity grid may reduce demand for firewood and consequently
deforestation. There are also plans to plant sandalwood, mahogany and teak which will
directly contribute to reforestation.
The proportion of the population using an improved water drinking source has increased to
72% in 2015 which is just below the MDG target of 78%.
Following the achievements made by countries in the MDGs, through discussion processes
among country members of UN, a post-2015 agenda known as Sustainable Development
Goals (SDGs) has been established as a successor to the MDGs to respond to sustainable
development issues including poverty and hunger, health and education and climate change.
2.4.2: Sustainable Development Goals (SDGs)
Introduction
In 2012, the UN Secretary General established the High Level Panel of Eminent Persons,
consisting of 27 members, with Timor-Leste represented by the Chair of g7+. This panel
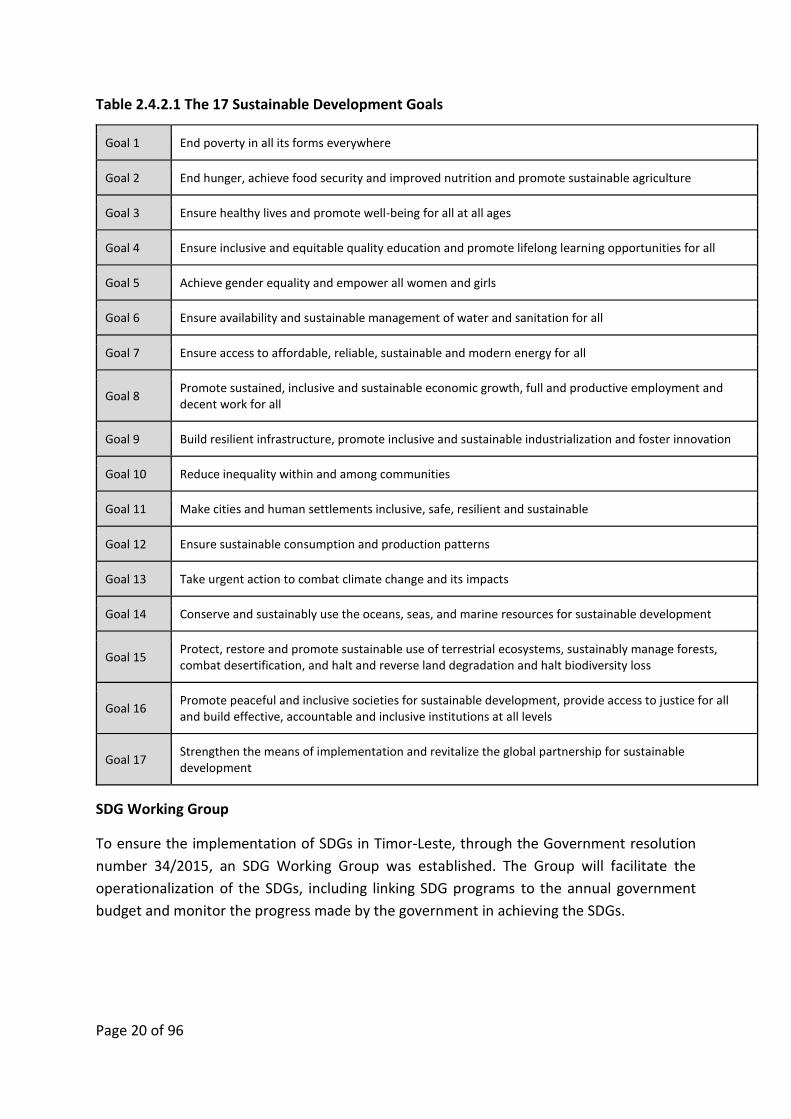
established the first draft of the SDGs. The table below shows the 17 goals of SDGs that have
been approved in the UN general assembly and call upon countries to implement.
Page 20 of 96
Table 2.4.2.1 The 17 Sustainable Development Goals
Goal 1 End poverty in all its forms everywhere
Goal 2 End hunger, achieve food security and improved nutrition and promote sustainable agriculture
Goal 3 Ensure healthy lives and promote well-being for all at all ages
Goal 4 Ensure inclusive and equitable quality education and promote lifelong learning opportunities for all
Goal 5 Achieve gender equality and empower all women and girls
Goal 6 Ensure availability and sustainable management of water and sanitation for all
Goal 7 Ensure access to affordable, reliable, sustainable and modern energy for all
Goal 8 Promote sustained, inclusive and sustainable economic growth, full and productive employment and decent work for all
Goal 9 Build resilient infrastructure, promote inclusive and sustainable industrialization and foster innovation
Goal 10 Reduce inequality within and among communities
Goal 11 Make cities and human settlements inclusive, safe, resilient and sustainable
Goal 12 Ensure sustainable consumption and production patterns
Goal 13 Take urgent action to combat climate change and its impacts
Goal 14 Conserve and sustainably use the oceans, seas, and marine resources for sustainable development
Goal 15 Protect, restore and promote sustainable use of terrestrial ecosystems, sustainably manage forests, combat desertification, and halt and reverse land degradation and halt biodiversity loss
Goal 16 Promote peaceful and inclusive societies for sustainable development, provide access to justice for all and build effective, accountable and inclusive institutions at all levels
Goal 17 Strengthen the means of implementation and revitalize the global partnership for sustainable development
SDG Working Group
To ensure the implementation of SDGs in Timor-Leste, through the Government resolution
number 34/2015, an SDG Working Group was established. The Group will facilitate the
operationalization of the SDGs, including linking SDG programs to the annual government
budget and monitor the progress made by the government in achieving the SDGs.

Page 21 of 96
Operationalization of SDGs
To ensure the implementation of the SDGs in Timor-Leste, the working group has established
a short term work plan that is summarized below.
Develop a centralized data collection and data sharing system that is accessible and
practical;
Establish a mechanism to verify data quality;
Put together outputs from line ministries to monitor national achievements;
Develop a monitoring framework of national indicators that is specific, measurable,
accurate, realistic and time bound;
Report annually on the government’s achievements; and issue a report every two years,
and
Develop a system to share the progress of implementation and achievement of SDGs with
the public, both nationally and internationally.
Alignment to the Strategic Development Plan (SDP)
The SDGs working group will work to align the Strategic Development Plan and the SDGs, as
summarized in the following diagram:
Figure 2.4.2.2 SDP and SDGs alignment
The red block shows the alignment of the SDP Phase 1 goals of developing human resources,
strategic industries and infrastructure with the SDG goals on eradicating hunger, developing
quality educations and infrastructure, ensuring a healthy population, gender equality and
clean water and sanitation for all.

Page 22 of 96
The yellow block shows the alignment of the SDP Phase 2 goals of further strengthening
human resources, infrastructure and forming markets with the SDG goals of economic growth
and employment, and sustainable consumption and production.
Finally, the third turquoise block shows the alignment of the SDP Phase 3 goal of ending
extreme poverty, strengthening the private sector and modernizing and diversifying the
economy with the SDG goal of ending poverty.
Government priority on SDGs in 2017
In 2017 the government will prioritize implementing goals on eradicating hunger, improve
nutrition and increase agriculture production (SDGs2), continuing investing in quality of
education (SDGs4) and improving infrastructure and industry (SDGs9).
2.4.3: Timor-Leste Survey of Living Standards 2014
The recent Timor-Leste Survey of Living Standards shows that inequality is low and stable in
Timor-Leste. Inequality is usually measured using the Gini coefficient which varies between
0 and 1, with higher values indicating greater inequality. The Gini coefficient for per capita
consumption is estimated at 0.29 for 2014 - only very slightly higher than the level of 0.28
estimated for 2007 and much lower than the average Gini coefficient in East Asia, estimated
at 0.375.
Timor-Leste Survey of Living Standards
The recently completed 2014-15 Timor-Leste Survey of Living Standards shows a significant reduction in poverty in the country over the past decade, with the proportion of Timorese living in poverty declining from 50.4% in 2007 to an estimated 41.8% in 2014, based on the national poverty line. This poverty estimate provides the most accurate measure of poverty in Timor-Leste given local conditions but is not directly comparable with poverty rates in other countries. Based on the internationally-comparable measure of extreme poverty, poverty in Timor-Leste has fallen from 47.2% in 2007 to 30.3% in 2014.
5 World Bank Data, averaging Cambodia, Philippines, Vietnam, Thailand, Laos, Mongolia, 2012
50.4%
41.8%
47.2%
30.3%
2007 2014 2007 2014
National poverty line International Poverty Line

Page 23 of 96
2.5: Expenditure
The 2017 combined sources of the State Budget total $1,543.4 million. This is composed of
$1,386.8 million in Government expenditures (including $101.8 million in loan-financed
projects) and $156.6 million from development partners.
Total Government expenditure is substantially lower for 2017 compared to the 2016
Rectification Budget. This is mainly due to the decision of the Government to increase capital
allocations in 2016 for projects that were advancing ahead of schedule, thus reducing the
planned expenditure for 2017. In addition, 2017 is an election year and the Government
understands that execution has historically been lower in election years.
2.5.1: Expenditures by Fund
Government expenditure is spread across the Consolidated Fund of Timor-Leste (CFTL), the
Human Capital Development Fund (HCDF) and loans. As of 2016, the Infrastructure Fund is an
autonomous agency under the CFTL. Compared to the 2016 Rectification Budget figures, all
Government expenditures have decrease: HCDF expenditure (-20.0%), loan expenditure (-
4.8%) and CFTL (-30.6%).
Table 2.5.1.1: Expenditure by Fund, ($m)
2015
Actual 2016
BB1 Rec 2017
Budget 2018 2019 2020 2021
Combined Sources Budget 1,562.9 2,157.5 1,543.4 2,379.3 2,549.4 2,182.1 1,952.4
Government Expenditures by Fund
1,340.2 1,952.9 1,386.8 2,271.0 2,480.1 2,142.2 1,952.4
CFTL (excl. loans) 1,068.8 1,811.9 1,257.8 1,930.4 1,986.3 1,788.1 1,694.4
HCDF 32.0 34.0 27.2 29.9 32.9 36.2 39.8
Infrastructure Fund (Special Fund, excl. loans)
215.6 - - - - - -
Loans 23.8 107.0 101.8 310.7 460.8 317.8 218.2
Development Partner Commitments
222.7 204.6 156.6 108.3 69.3 39.9 -
Sources: National Directorate of the Budget and Development Partners Management Unit, Ministry of Finance,
2016
2.5.2: CFET / CFTL Expenditures
The CFTL is the Government’s central account and includes all expenditures for line ministries
and autonomous agencies with the exception of the HCDF. Within it, recurrent and capital
expenditures are spread across five appropriation categories as laid out in table 2.5.2.1.

Page 24 of 96
Budgeted expenditures in the CFTL will decrease by 30.6% in 2017 compared to the 2016
Rectification Budget. This is largely due to the decrease in infrastructure spending, which was
accelerated in 2016. The VI Constitutional Government has also reviewed and will stabilize
the level of expenditures in order to control the growth of the public sector, minimize
wasteful expenditures and therefore boost returns on investment. A smaller and more
efficient public sector will provide an opportunity for greater private sector investment-led
growth. Recurrent expenditures have decreased by 6.9% in 2017 compared to the 2016
Rectification Budget, particularly on goods and services. Notably, transfers have decreased by
11.5%, predominantly due to a substantial reduction in transfers to the Oecusse Special Zone
for Social Market Economy (ZEESM).
Table 2.5.2.1: Breakdown of CFTL expenditure, ($m)
2015
Actual 2016 BB1
Rec 2017
Budget 2018 2019 2020 2021
Total CFTL Expenditure 1,068.8 1,811.9 1,257.8 1,930.4 1,986.3 1,788.1 1,694.4
Recurrent 1,001.7 1,072.9 998.7 1,038.7 1,080.2 1,123.4 1,168.4
Salary and Wages 173.3 181.9 208.8 217.2 225.9 234.9 244.3
Goods and Services 395.6 415.0 368.6 383.3 398.7 414.6 431.2
Public Transfers 432.9 476.0 421.3 438.1 455.6 473.9 492.8
Capital 67.1 739.0 259.1 891.7 906.1 664.7 526.0
Minor Capital 33.8 18.8 11.9 12.3 12.8 13.4 13.9
Capital and Development
33.3 720.2 247.2 879.4 893.3 651.4 512.1
Infrastructure Fund (Autonomous, excl. loans)
- 676.7 222.6 853.8 866.7 623.7 483.3
Source: National Directorate of the Budget, Ministry of Finance, 2016
2.5.2.1: Salaries and Wages
Salaries and wages expenditures are expected to grow by 14.8% in 2017 compared to the
2016 Rectification Budget. This is due to changes in the structures of some ministries and
state institutions following new Organic Laws and the implementation of a salary increase for
the General Regime in 2017.
2.5.2.2: Goods and Services
Investments in new capital assets have been significant in recent years. These assets require
additional resources for their operation and maintenance, so to ensure that they operate
efficiently. The Goods and Services budget will reach $368.6 million for 2017. There has been
some reprioritization in Goods and Services expenditures to ensure they focus on areas in the
SDP and hence contribute to the wider economy and society. Therefore, there are reductions
from cuts in items such as catering and travelling in an effort to boost expenditures with high
and positive returns. This section first describes measures under this appropriation category.

Page 25 of 96
Measures
The main measures for goods and services are:
$54.9 million to the Ministry of Public Works, Transport and Communication towards
fuel and maintenance of electricity generators in Hera and Betano. Providing
electricity throughout the whole country continues to be a cornerstone of the
Government’s economic development efforts. Ensuring effective maintenance of
generators and the regular, adequate supply of fuel is essential for ensuring a reliable
supply of electricity.
$17.6 million is allocated to the Municipalities for the School Feeding program in
public schools, subsidies to school and operational costs and services for
administrative authorities to help support the Municipalities.
$15 million to the Whole of Government to support the national elections. The
national elections reinforce the Government’s commitment towards promoting
democracy and inclusive growth.
$12.3 million to the Whole of Government for legal services. These are funds to enable
the state to defend itself in various legal cases.
$9.6 million to the Ministry of Public Works, Transport and Communication for a clean
water and sanitation programme in Dili and rural and urban areas.
$8.5 million to the Ministry of Education for printing, supply of school materials,
support for public schools and scholarship opportunities.
$5 million to the Whole of Government for the Counterpart Fund.
$4.9 million to SAMES for medication to help improve the quality of health services
provided in the country.
$3.3 million to the Whole of Government for the Fiscal Reform, Performance
Management Reform and Budget Performance Reform.
$2.8 million to the Ministry of Health to buy food for patients. These expenditures will
help improve the quality of health services provided in the country.
$2.5 million to the Whole of Government for the paying of quotas to international
institutions.
$2.3 million to the Administration of Ports of Timor-Leste for fuel for the Berlin
Nakroma to ensure the operation of the ferry and continued access to Oecusse and
Atauro for the population of Timor-Leste.

Page 26 of 96
$2.0 million to the Ministry of Commerce, Industry and Environment towards rice
imports and the support of local products. This will support the local rice market,
contribute to the School Feeding and Disaster Relief programs and ensure the basic
access to food for the population.
$1.8 million to the Ministry of Tourism, Art, and Culture to promote culture and
tourism in Timor-Leste and to support the Expo and other international events.
$1.6 million to the Whole of Government for external audit services.
$1.3 million to the Office of the Inspector General of State (IGE) for the maintenance
of heavy equipment.
2.5.2.3: Public Transfers
Public transfers comprise all of the money the Government spends on public grants and
consigned payments. They are the largest category in recurrent expenditures and are set to
reach $421.3 million in 2017, 11.5% lower than the 2016 Rectification Budget figure. This
section describes the main measures for this category.
Measures
The main measures for public transfers include:
$172.1 million to the Special Administrative Region of Oecusse Ambeno (ARAEOA) and
the Oecusse Ambeno and Atauro Special Zones for Social Market Economy (ZEESM).
$153.3 million to the Ministry of Social Solidarity towards social programs, including
the veterans’, old age and disability pension schemes, Bolsa de Mãe, victims of natural
disasters and for the medical treatment of veterans. These programs support
vulnerable and deserving groups and contribute to reducing poverty.
$16.0 million to the Ministry of Petroleum and Mineral Resources to support the
National Petroleum Authority and Minerals (ANPM), TIMOR GAP and the Institute of
Petroleum and Geology (IPG). This money is required to ensure Timor-Leste maximizes
the benefits from its natural resources.
$11 million to the Whole of Government for the provision of pensions for permanent
civil servants under the contributory regime.
$8.2 million to the Ministry of Health for treatments abroad, primary healthcare and
the subsidy for Cuban Doctors in Timor-Leste. These investments are important to
further improving the quality of health services for the population.
$7.7 million to the Municipalities to support urban cleaning activities, school feeding
programs and school grants, contributing to rural development and inclusive growth.

Page 27 of 96
$6.5 million to the Whole of Government to support the activities of the Church in
Timor-Leste, in line with the plans and policies of the Government.
$6.0 million to the National Electoral Commission. This expenditure will provide
subsidies to political parties, which will contribute to the democratic process in Timor-
Leste.
$5.0 million to the Whole of Government in order to capitalize the Central Bank of
Timor-Leste (BCTL. This capitalization will contribute to the development of the
financial sector in the country.
$4.8 million to the Secretary of State of Youth and Sports to support sport and artistic
activities. Promoting culture and sports is important both for morale as well as to
promote Timorese traditions.
$4.4 million to the Office of the Prime Minister towards supporting NGOs. The NGO
sector in Timor-Leste provides a valuable service to the country and its people.
$4.0 million to former Leaders and formers members of sovereign bodies for a lifetime
pension due to the dedication and service provided to the country.
$4.0 million to the Whole of Government to support the creation of a Credit
Guarantee Scheme for Small and Medium Enterprises to ensure Timorese businesses
have access to funding, helping the business environment to develop in Timor-Leste.
$3.3 million to the Secretariat of State for Vocational Training Policy and Employment
(SEPFOPE) for the rural employment program. This will contribute towards promoting
job creation and economic growth, particularly in rural areas.
$2.3 million to the Whole of Government for the g7+ secretariat. The work of this
secretariat ensures that the voice of fragile states is heard and acted upon by the
international community.
$1.7 million to the Secretary of State for Social Communication to provide subsidy for
Radio Television Timor-Leste (RTTL, E.P).
$1.5 million to the Whole of Government to cover loan repayments.
$1.5 million to the Whole of Government as contributions for international financial
support. This will support the international community and allow Timor-Leste to
further influence the global community.
$1.2 million to the Ministry of State Administration to support the urban solid waste
management program and the operational costs of the National Program for Village
Development (PNDS), helping aid rural development.
Page 28 of 96
$1.1 million to the Ministry of Education towards the funding of Portuguese teachers
in Timor-Leste in Reference Schools through (CAFE).
2.5.2.4: Minor Capital
Minor capital includes expenditures on vehicles, furniture and other movable assets. The
2017 budget for this category is significantly decreasing by 37.0% from the 2016 Rectification
Budget. This is a result of the expenditures reprioritization process. Expenditure under the
minor capital category is used towards the purchase of capital equipment such as vehicles
and machines that last for several years and do not need to be repurchased in the near future.
This section first describes the main measures for this category.
Measures
$3.0 million to the Parliament for the purchase of vehicles for new members of
Parliament in 2017.
$1.4 million to the National Laboratory for the purchase of new laboratory equipment
and machinery to allow further research.
$1.3 million to Guido Valadares National Hospital to purchase a CT scanner to improve
the healthcare facilities offered in Timor-Leste.
$1 million to the Ministry of Public Works, Transport and Communication for the
purchase of pre-paid electricity meters to ensure that electricity used is paid for across
the country.
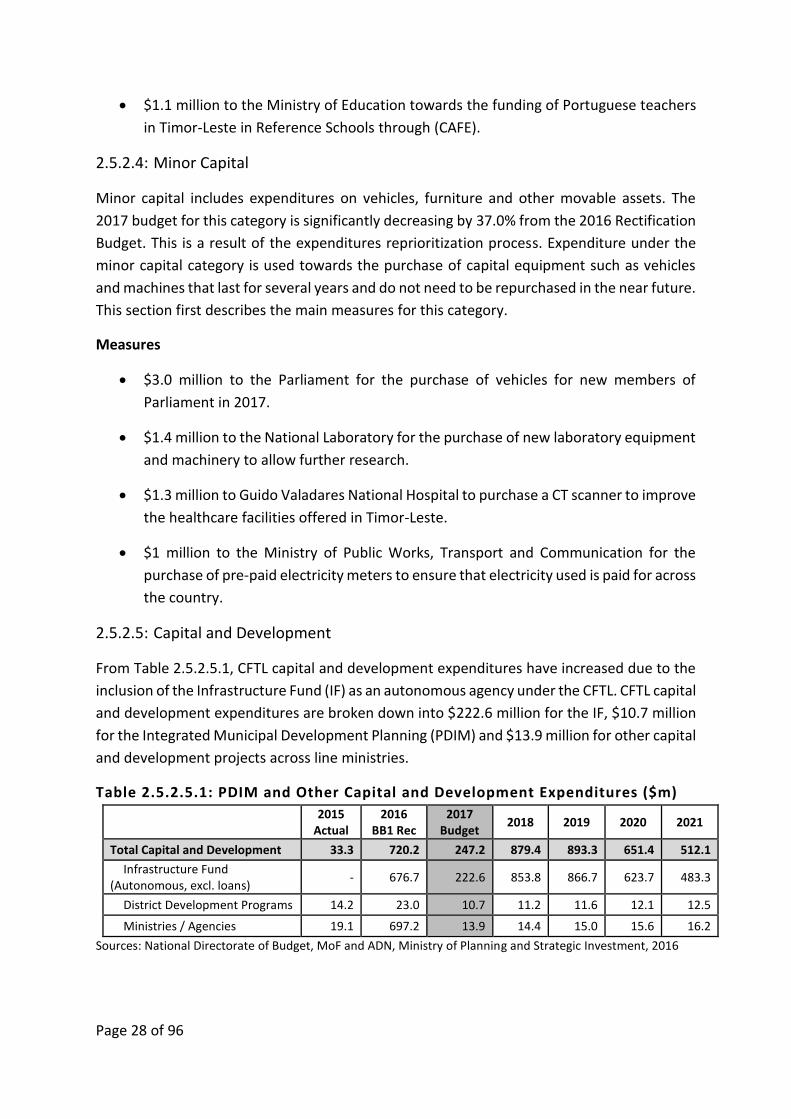
2.5.2.5: Capital and Development
From Table 2.5.2.5.1, CFTL capital and development expenditures have increased due to the
inclusion of the Infrastructure Fund (IF) as an autonomous agency under the CFTL. CFTL capital
and development expenditures are broken down into $222.6 million for the IF, $10.7 million
for the Integrated Municipal Development Planning (PDIM) and $13.9 million for other capital
and development projects across line ministries.
Table 2.5.2.5.1: PDIM and Other Capital and Development Expenditures ($m)
2015
Actual 2016
BB1 Rec 2017
Budget 2018 2019 2020 2021
Total Capital and Development 33.3 720.2 247.2 879.4 893.3 651.4 512.1
Infrastructure Fund (Autonomous, excl. loans)
- 676.7 222.6 853.8 866.7 623.7 483.3
District Development Programs 14.2 23.0 10.7 11.2 11.6 12.1 12.5
Ministries / Agencies 19.1 697.2 13.9 14.4 15.0 15.6 16.2
Sources: National Directorate of Budget, MoF and ADN, Ministry of Planning and Strategic Investment, 2016

Page 29 of 96
2.5.3: Infrastructure Fund
As set out in the SDP, developing core economic infrastructure such as electricity grids, roads,
bridges, water supply, ports, and irrigation systems is one of the key elements to support
sustainable economic growth and social transformation in Timor-Leste. For this purpose, the
Government established the IF in 2011, which financed key large infrastructure projects
(above $1 million). Since 2011, a total of $3.25 billion has been approved and allocated to the
IF to finance 22 programs, and includes Public Private Partnerships (PPPs) and external loans.
The Government has also introduced a new Maintenance and Rehabilitation program to
emphasize the need for undertaking proper maintenance of infrastructure.
The Government’s successful electrification project was the first step in laying out crucial
basic infrastructure for the benefit of households and private investors. This program has
resulted in supplying electricity to almost 75% of the territory. With the electricity program
nearly at the stage of completion, the Government is now prioritizing investment in national
roads, ports, airports and dams, some of which will be financed through concessional loans.
Major civil works on the roads and Tasi Mane programs have commenced, and more than
50% of the IF budget in 2017 is allocated to these two programs.
The total budget for the IF (excluding loans) in 2017 is set to reach $222.6 million and is
distributed into various programs. In line with the Government’s policy mentioned above, the
largest portions of the 2017 IF budget are allocated to the roads program (38.6%), the Tasi
Mane Development Program (22.1%), and maintenance and rehabilitation (4.3%).
Projections for outer years for the IF are summarized in Table 2.5.3.1. The pattern of
expenditures in the IF is consistent with the Government’s frontloading policy and current
contractual obligations. The expenditure will increase in 2018 and 2019 as core infrastructure
constructions from several strategic investment projects such as Tibar Bay Port, South Coast
Highway, Suai Supply Base, and the Tasi Mane Development Program jointly rise. In 2020 and
2021, infrastructure spending gradually falls due to a combination of some of the major
programs being completed and alternative infrastructure financing mechanisms being
arranged to reduce the fiscal burden of large-scale infrastructure in a given year. To date these
arrangements are Public-Private Partnerships (PPPs) and external loans.
Table 2.5.3.1: Infrastructure Fund Projections ($m)
Infrastructure Data, $ millions 2016
BB1 Rec 2017
Budget 2018 2019 2020 2021
Total Infrastructure (including loans) 783.7 324.4 1,164.5 1,327.5 941.5 701.6
Total Infrastructure (excluding loans) 676.7 222.6 853.8 866.7 623.7 483.3
Agriculture and Fisheries 2.5 3.2 14.3 45.5 32.8 16.3
Water and Sanitation 15.8 5.7 20.0 45.3 57.5 26.1
Urban and Rural Development 5.9 5.0 18.2 3.6 1.0 0.0

Page 30 of 96
Public Buildings 3.9 7.9 42.8 88.5 68.0 13.7
Financial Sector 26.8 5.0 9.5 6.9 1.5 0.0
Youth and Sport 5.3 3.1 12.8 7.2 3.1 1.0
Education 0.9 2.4 17.6 35.0 33.7 9.5
Electricity 41.0 13.4 101.6 48.8 21.5 5.8
Information Technology 1.8 1.0 21.0 37.5 9.5 0.0
Millennium Development Goals 8.7 1.0 3.0 17.0 32.5 7.5
Health 1.6 2.0 5.2 8.9 10.3 2.6
Security and Defense 3.6 3.8 14.3 22.6 15.9 1.5
Social Solidarity 0.0 0.0 0.0 0.0 0.0 0.0
Tasi Mane Project 183.9 49.3 224.2 242.9 165.9 317.9
Roads 208.0 84.9 254.8 156.0 66.9 14.8
Maintenance and Rehabilitation 4.9 9.6 13.4 9.0 7.0 7.0
Bridges 2.1 2.8 9.2 10.2 12.9 1.4
Airports 24.5 16.4 34.5 43.6 65.8 52.5
Ports 131.3 2.0 30.9 31.3 13.3 2.5
Tourism Sector 1.1 1.5 2.6 1.4 0.4 0.0
Preparation, Design and Supervision of New Projects
3.1 2.6 4.0 5.5 4.5 3.5
Loans Program 107.0 101.8 310.7 460.8 317.8 218.2
Source: Major Projects Secretariat, Ministry of Planning and Strategic Investment, 2016
2.5.4: Expenditure on Loan Financed Projects
Expenditure on loan-financed projects is presented in Table 2.5.4.1, which amounts to $101.8
million in 2017. This a 4.8% reduction compared to the 2016 Rectification Budget figure. A
detailed description of these projects is presented in Section 2.7.
Table 2.5.4.1: Expenditure on Loan Financed Projects ($m)
2016 Budget Rectification
2016 F’casted Actual
Final 2017 Budget
2018 2019 2020 2021
Loan Expenditure
107.0 50.3 101.8 310.7 460.8 317.8 218.2
Source: Loans Unit, Ministry of Finance, 2016
2.5.5: Human Capital Development Fund
The purpose of the HCDF is to finance expenditures on scholarships and capacity
development. For the 2017 budget, the HCDF is broken down into four major programs:
Vocational Training, Technical Trainings, Scholarships and Other Types of Training.
Table 2.5.5.1 summarizes the budget appropriations for HCDF by program. The total 2017
budget is $27.2 million, 20% lower than the 2016 Rectification Budget.

Page 31 of 96
Table 2.5.5.1 Human Capital Development Fund by Program, ($m)
2016 Budget Rectification
Final 2017 Budget
2018 2019 2020 2021
Total HCDF (by Program) 34.0 27.2 29.9 32.9 36.2 39.8
Vocational Training 7.8 7.4 8.2 9.0 9.9 10.9
Technical Training 5.1 2.5 2.8 3.0 3.3 3.7
Scholarships 17.2 15.0 16.5 18.1 19.9 21.9
Other Training 3.8 2.3 2.6 2.8 3.1 3.4
Source: Secretariat for the HCDF, 2016
2.5.6: Development Partners’ Commitments
Development Partners are set to contribute $156.5 million in 2017. The details of these
commitments are set out in Budget Book 5. It should be noted that these figures do not
include loans. In addition, these figures are produced based on data from the Aid
Transparency Portal, a system that tracks donor’s contributions at the activity level.
There has been a contraction in the amount of donor funding made available to Timor-Leste,
this, however is a natural part of the development process as the country becomes more self-
reliant and moves away from donor support.
Future disbursements are also indicating that support will decrease dramatically in the next
year and this trend will exponentially continue until 2020.
Figure 2.5.6.1: Development Partners’ Commitments (Grants) 2013-2020, ($m)
Source: Aid Transparency Portal, Ministry of Finance, 2016.
260.3 263.9
222.7204.6
156.6
108.3
69.3
39.9
0
50
100
150
200
250
300
2013 Act. 2014 Act. 2015 Act. 2016 Est. 2017 Est. 2018 Est. 2019 Est. 2020 Est.
$ m
illio
ns

Page 32 of 96
2.5.7: Classification of the 2017 budget by Sector
To examine 2017 budget allocations by sector we can use the standard United Nations
Statistics Division ‘Functions of Government’ classification6. For the recurrent budget General
Public Services has the largest allocation, this sector can be considered as the ‘machinery of
government’ , but also covers recurrent transfers to the new municipalities and the ZEESM.
Social Protection receives the second largest share, at 21%. This covers pension and social
welfare payments, including Bolsa de Mae, the old age and other pensions, and the school
feeding program. Economic Affairs includes fuel for EDTL power generation as the largest
item, and other areas such as road maintenance, agricultural spending and maintenance of
water and irrigation systems. Education is the fourth largest sector, and health fifth largest.
Figure 2.5.7.1 Recurrent expenditure by Sector for 2017
Source: Estimate based on proposed ministerial allocations, Ministry of Finance, 2016.
Looking at the sectoral division of the Infrastructure Fund, which covers 60% of capital
spending, (ZEESM capital spending covers 33%, and other capital spending 7%). Economic
Affairs covers 78% of IF spending, and road projects alone covering 54%. Roads are a stated
priority in the Strategic Development Plan, and now that the electricity project has been
6 http://unstats.un.org/unsd/cr/registry/regcst.asp?Cl=4
General Public Services27.9%
Defense1.4%
Public Order & Safety 10.2%
Economic Affairs16.5%
Environmental Protection
0.1%
Housing & Community Amenities
0.4%
Health5.4%
Recreation, Culture & Religion
1.4% Education16.1%
Social Protection20.7%

Page 33 of 96
largely completed, funding to the roads program is now the largest single component of the
budget. Most road expenditure is loan financed, and details of these projects are in Section
2.7.3. Other than roads, Suai airport and supply base are the largest projects in the Economic
Affairs sector, receiving a combined allocation of $29.4 million. Environmental Projection is
almost entirely the Dili Drainage project, which is allocated $32 million in 2017. The remaining
7.5% of the Infrastructure Fund allocation covers the remaining sectors, including the
construction of new public buildings, development of IT infrastructure, and other capital
investments. Further details are provided in Part 1 of Budget Book 6.
Figure 2.5.7.2 Infrastructure fund by Sector for 2017
Source: Estimate based on proposed project allocations, Ministry of Finance, 2016.
2.6: Revenue
2.6.1: Overview of Revenue Projections
Table 2.6.1.1 shows the forecasts for total revenues up to 2021, which are the sum of
petroleum revenues and domestic revenues. The gradual trend of petroleum revenues
declining is in general set to continue as production from existing fields draws to a close.
Domestic revenues have been performing strongly in 2016, and are likely to exceed the
original budget estimate of $171 million. However domestic revenues continue to make up a
small proportion of overall revenues and thus do not completely offset the decline from
General Public
Services1.8%
Defense0.9%
Public Order & Safety 1.8%
Economic Affairs -Roads54.3%
Economic Affairs -Other23.7%
Environmental Protection
14.5%
Housing & Community Amenities
0.3% Health0.6%
Recreation, Culture & Religion
1.4%
Education0.8%
Social Protection0.0%

Page 34 of 96
petroleum. This leads to a forecast of falling total revenues, which underlines the importance
of focusing on domestic revenue streams going forward.
It is important to note that the forecasts presented do not include additional revenues from
the Fiscal Reform detailed in Section 2.2, as these reforms are still to receive Parliamentary
approval.
Table 2.6.1.1 Total Revenue, 2015 – 2021, ($m)
2015
Actual 2016
Projection 2017
Projection 2018 2019 2020 2021
Total Revenues 1,127.5 1,261.3 1,312.6 1,126.0 1,106.6 958.7 1,062.6
Domestic Revenues 170.0 197.8 206.2 219.3 233.3 247.9 263.3
Petroleum Revenues
957.5 1,063.5 1,106.3 906.7 873.3 710.7 799.3
Source: National Directorate of Economic Policy and Petroleum Fund Administration Unit, Ministry of Finance, 2016. Domestic revenues include tax revenues collected by ZEESM.
2.6.2: Domestic Revenues
Domestic revenues in Timor-Leste are composed of tax revenues, fees and charges, interest,
revenues from autonomous agencies and tax revenue from the ZEESM. Table 2.6.2.1 breaks
down domestic revenues into these categories showing actual and forecasted amounts
between 2015 and 2021. Total domestic revenues are expected to increase by 4.3% in 2017
compared to the 2016 final estimated figures.
Table 2.6.2.1: Domestic Revenue 2015 – 2021, ($m)
2015
Actual 2016
Projection 2017
Projection 2018 2019 2020 2021
Total Domestic Revenue 170.0 197.8 206.2 219.3 233.3 247.9 263.3
Taxes 119.8 140.6 145.7 155.5 165.9 177.0 188.7
Fees and Charges 43.9 46.9 50.0 53.0 56.0 59.0 62.0
Interest 0.0 0.0 0.0 0.0 0.0 0.0 0.0
Autonomous Agencies 6.6 5.6 6.9 7.0 7.5 7.9 8.4
ZEESM (Taxes) 4.6 3.6 3.8 3.9 4.1 4.2
Source: National Directorate of Economic Policy, Ministry of Finance, 2016
2.6.2.1: Tax Revenues
Tax revenues comprise the largest source of domestic revenues in Timor-Leste, totaling 71%
of total domestic revenues in 2016. Tax projections are summarized in Table 2.6.2.1.1 and are
divided into Direct taxes, Indirect taxes and Other tax revenues.
Tax revenues are performing well, and are forecast to have grown by over 17% in 2016,
exceeding their targets. This reflects the introduction of various reforms over the previous
three years to streamline processes and procedures, in particular in Customs, which collects
Page 35 of 96
sales tax and excise revenue in addition to customs duties. Further, Customs has collected $4
million in arrears in 2016, and over $4 million was collected by the National Directorate of
Revenue from arrears and penalties of corporate tax. These are ‘one-off’ payments that will
not be repeated in 2017.
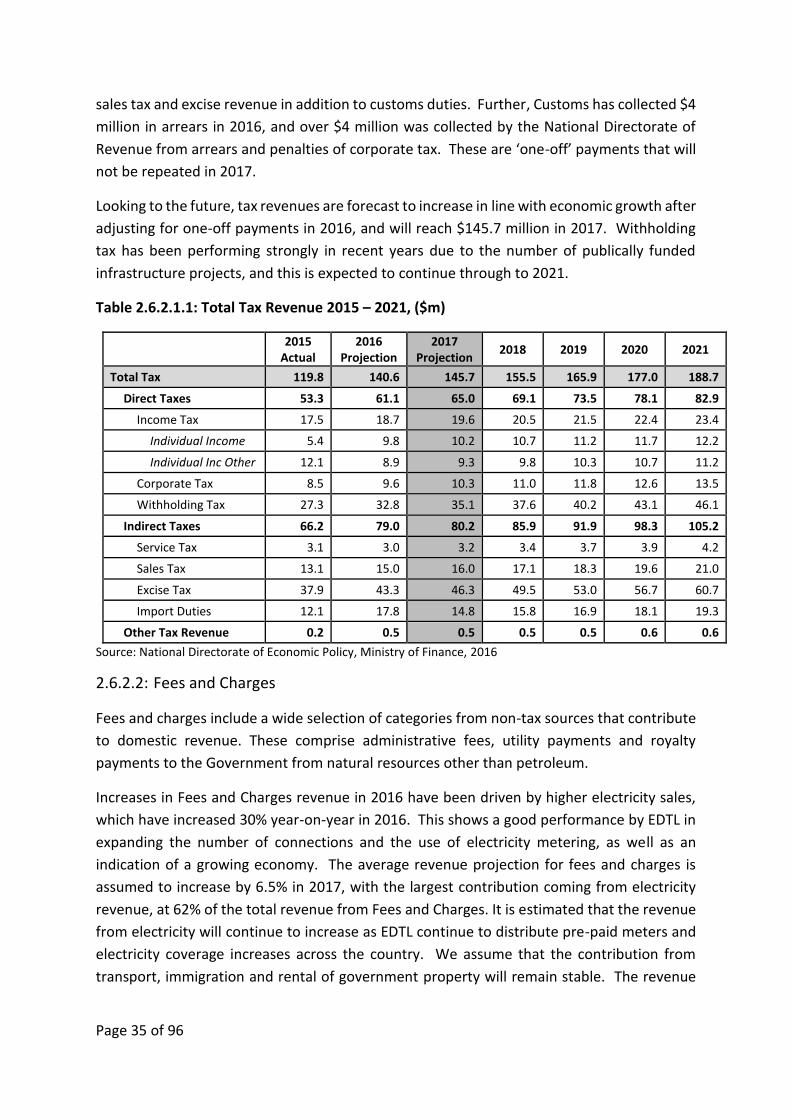
Looking to the future, tax revenues are forecast to increase in line with economic growth after
adjusting for one-off payments in 2016, and will reach $145.7 million in 2017. Withholding
tax has been performing strongly in recent years due to the number of publically funded
infrastructure projects, and this is expected to continue through to 2021.
Table 2.6.2.1.1: Total Tax Revenue 2015 – 2021, ($m)
2015
Actual 2016
Projection 2017
Projection 2018 2019 2020 2021
Total Tax 119.8 140.6 145.7 155.5 165.9 177.0 188.7
Direct Taxes 53.3 61.1 65.0 69.1 73.5 78.1 82.9
Income Tax 17.5 18.7 19.6 20.5 21.5 22.4 23.4
Individual Income 5.4 9.8 10.2 10.7 11.2 11.7 12.2
Individual Inc Other 12.1 8.9 9.3 9.8 10.3 10.7 11.2
Corporate Tax 8.5 9.6 10.3 11.0 11.8 12.6 13.5
Withholding Tax 27.3 32.8 35.1 37.6 40.2 43.1 46.1
Indirect Taxes 66.2 79.0 80.2 85.9 91.9 98.3 105.2
Service Tax 3.1 3.0 3.2 3.4 3.7 3.9 4.2
Sales Tax 13.1 15.0 16.0 17.1 18.3 19.6 21.0
Excise Tax 37.9 43.3 46.3 49.5 53.0 56.7 60.7
Import Duties 12.1 17.8 14.8 15.8 16.9 18.1 19.3
Other Tax Revenue 0.2 0.5 0.5 0.5 0.5 0.6 0.6
Source: National Directorate of Economic Policy, Ministry of Finance, 2016
2.6.2.2: Fees and Charges
Fees and charges include a wide selection of categories from non-tax sources that contribute
to domestic revenue. These comprise administrative fees, utility payments and royalty
payments to the Government from natural resources other than petroleum.
Increases in Fees and Charges revenue in 2016 have been driven by higher electricity sales,
which have increased 30% year-on-year in 2016. This shows a good performance by EDTL in
expanding the number of connections and the use of electricity metering, as well as an
indication of a growing economy. The average revenue projection for fees and charges is
assumed to increase by 6.5% in 2017, with the largest contribution coming from electricity
revenue, at 62% of the total revenue from Fees and Charges. It is estimated that the revenue
from electricity will continue to increase as EDTL continue to distribute pre-paid meters and
electricity coverage increases across the country. We assume that the contribution from
transport, immigration and rental of government property will remain stable. The revenue

Page 36 of 96
from bid documents is expected to increase significantly as more private sector companies
compete for government tenders.
Projections for outer years are also expected to continue a positive trend, following the
improvement and reinforcement of collection mechanisms in line ministries.
Table 2.6.2.2.1: Fees and Charges Projections 2015 – 2021, ($000’s)
2015
Actual 2016 BB1
Rec 2017
Projection 2018 2019 2020 2021
Total Fees and Charges 43,919.4 46,906.1 49,950.4 53,007.5 55,992.9 58,994.7 62,013.6
Postage Fees 35.8 39.9 44.4 48.7 53.0 57.4 61.7
Property Rentals 3,846.3 3,293.5 3,632.4 3,820.0 4,007.5 4,195.1 4,382.6
Water Fees 492.5 170.8 177.7 184.8 192.2 199.8 207.8
Vehicle Registration Fees 1,407.1 1,735.2 1,629.1 1,744.1 1,859.0 1,974.0 2,089.0
Vehicle Inspection Fees 535.6 663.2 689.7 717.3 746.0 775.9 806.9
Vehicle Inspection Imported 14.4 10.9 11.3 11.8 12.3 12.7 13.3
Drivers License Fees 354.5 356.9 371.2 386.0 401.4 417.5 434.2
Franchising Public Transport Fees
124.9 306.8 319.0 331.8 345.1 358.9 373.2
Transport Penalties 113.5 130.9 136.2 141.6 147.3 153.2 159.3
Other Transport Fees 54.8 38.1 39.7 41.2 42.9 44.6 46.4
ID and Passport 865.5 924.9 961.9 1,000.4 1,040.4 1,082.0 1,125.3
Visa Fees 3,879.5 3,637.1 3,782.6 3,933.9 4,091.2 4,254.9 4,425.1
Court Fees 258.5 179.3 186.5 194.0 201.7 209.8 218.2
Dividends, Profits, and Gains 4,492.7 729.9 759.1 789.5 821.0 853.9 888.0
Fines and Forfeits 109.7 130.2 135.4 140.8 146.5 152.3 158.4
Mining and Quarrying 362.4 350.0 364.0 378.6 393.7 409.5 425.8
Bid Document Receipts 84.1 2.7 162.8 189.1 215.3 241.6 267.9
Auctions 159.7 852.2 886.2 918.5 918.5 918.5 918.5
Embassy Fees 0.0 0.0 0.0 0.0 0.0 0.0 0.0
Productos Florestais 104.5 80.1 83.3 86.6 90.1 93.7 97.5
Rental Government Property 104.5 222.7 231.6 240.9 250.5 260.5 271.0
EAIP 0.0 0.0 0.0 0.0 0.0 0.0 0.0
Sanitation Service Fees 11.4 17.1 17.8 18.5 19.2 20.0 20.8
TL Internet Domain Revenue 22.6 86.9 90.3 93.9 97.7 101.6 105.7
Social Game Receipts 929.8 1,370.3 1,544.1 1,784.6 2,025.1 2,265.5 2,506.0
Rice Sales 1,382.7 1,333.5 1,386.9 1,442.4 1,500.0 1,560.1 1,622.5
Sales of Local Produce (Bamboo)
183.5 0.0 0.0 0.0 0.0 0.0 0.0
Sales of Local Produce (Bean, Corn, Rice)
10.8 147.4 153.3 159.4 165.8 172.4 179.3
Electricity Revenues 22,027.3 28,635.4 30,635.4 32,635.4 34,635.4 36,635.4 38,635.4
Other Fees 7.7 0.0 0.0 0.0 0.0 0.0 0.0
Other Non-Tax Revenues 587.2 1,460.1 1,518.5 1,573.8 1,573.8 1,573.8 1,573.8

Page 37 of 96
Revenues from institutions that are now autonomous agencies
1,356.1 - - - - - -
Source: National Directorate of Economic Policy, Ministry of Finance, 2016
2.6.2.3: Interest
Interest reflects interest payments received from cash held in Government funds. Given low
interest rates, and low cash balances held by government, this is a small source of revenue.
Interest is expected to reach $20,400 in 2017 compared to $19,600 in 2016.
2.6.2.4: Autonomous Agencies
The number of autonomous agencies has been increasing steadily in recent years, reflecting
government’s desire to grant greater financial independence to institutions so to improve
their efficiency. From a revenue perspective the port in Dili generates the majority of
revenues for this group, as detailed in Table 2.6.2.4.1.
Table 2.6.2.4.1: Autonomous Agencies 2015 – 2021, ($000’s)
2015
Actual 2016
Projection 2017
Projection 2018 2019 2020 2021
Total Autonomous Agencies 6,580.8 5,584.5 6,924.5 7,004.0 7,461.6 7,921.8 8,384.8
Timorese Resistance Archive and Museum 0.0 0.0 0.0 0.0 0.0 0.0 0.0
Conselho Imprenza 0.0 0.0 0.0 0.0 0.0 0.0 0.0
Institute for Business Support (IADE) 0.0 0.0 0.0 0.0 0.0 0.0 0.0
Specialized Investment Agency 0.0 2.6 4.4 4.6 4.8 5.0 5.2
Service for Registration and Verification of Entrepreneurs
0.0 241.0 250.6 260.7 271.1 281.9 293.2
Bamboo Center 0.0 46.2 48.0 49.9 51.9 54.0 56.2
Centro de Formação SENAI 0.0 0.0 0.0 0.0 0.0 0.0 0.0
Polícia Cientítfica de Investigação Criminal 0.0 0.0 0.0 0.0 0.0 0.0 0.0
National Agency for Academic Assessment and Accreditation - ANAAA
0.0 0.0 0.0 0.0 0.0 0.0 0.0
Guido Valadares National Hospital 0.0 168.5 175.2 182.2 189.5 197.1 205.0
SAMES 0.0 0.0 0.0 0.0 0.0 0.0 0.0
National Laboratory 8.2 3.5 3.7 3.8 4.0 4.1 4.3
Institute of Health Sciences 0.0 0.0 0.0 0.0 0.0 0.0 0.0
National Rehabilitation Centre 0.0 0.0 0.0 0.0 0.0 0.0 0.0
Equipment Management Institute 122.8 55.3 57.5 59.8 62.2 64.7 67.3
Administrations of Ports of Timor-Leste 4,146.1 4,436.0 4,959.8 5,351.3 5,742.8 6,134.3 6,525.8
National Communication Authority 0.0 0.0 0.0 0.0 0.0 0.0 0.0
National Defense Institute 0.0 0.0 0.0 0.0 0.0 0.0 0.0
National University of Timor Lorosae 0.0 631.3 656.6 682.8 710.1 738.6 768.1
ZEESM* 0.0 0.0 768.5 408.7 425.1 442.1 459.8
Infrastructure Fund 0.0 0.0 0.0 0.0 0.0 0.0 0.0

Page 38 of 96
Authority for Food Inspection and Economic Activity
0.0 0.0 0.0 0.0 0.0 0.0 0.0
Source: National Directorate of Economic Policy, Ministry of Finance, 2016 *ZEESM revenue includes fees and charges only, tax revenue is presented separately. The figure for 2017 also includes revenue from fees and charges for 2016 as this was not represented in the 2016 Budget Book figures.
2.6.3: Petroleum Revenues and the Petroleum Fund
The Petroleum Fund currently finances most of the state budget. This section addresses the
expected inflows into the Fund from petroleum revenues, the ESI calculation and provides an
overview of the investment management of the Petroleum Fund.
2.6.3.1: Inflows of Petroleum Revenues
The inflow of petroleum revenues is determined by prices, production and costs. Compared
with 2015 and 2016, the oil price in this budget is significantly lower over the forecasting
period. The total costs are slightly lower and there is also a slight change in production. The
revenues declined by more than half in 2015 to $978.9 million compared to the $1,817 million
received in 2014. The expected revenue in 2016 was revised down from $718.7 million to
$316.6 million (see Table 2.6.3.1.1).
Table 2.6.3.1.1: Petroleum Revenues from Bayu-Undan and Kitan 2014-2020 ($m)
2015
Actual 2016
Estimate 2017
Budget 2018 2019 2020 2021
Total Petroleum Fund Revenue 957.5 1,063.5 1,106.3 906.7 873.3 710.7 799.3
Petroleum Fund Investment Return -21.4 747.0 842.9 824.1 788.1 681.6 708.2
Total Petroleum Revenue 978.9 316.6 263.4 82.5 85.3 29.1 91.1
BU FTP/Royalties 233.4 43.2 30.2 19.1 19.1 0.0 0.0
BU Profit oil 303.7 275.9 137.5 26.6 0.0 0.0 0.0
BU Income Tax 205.2 49.2 23.7 0.0 0.0 0.0 0.0
BU Additional Profit Tax 156.5 122.1 71.1 0.0 38.2 0.0 0.0
BU Value Added Tax 22.6 5.1 5.8 8.9 5.2 5.7 91.1
BU Other Payments 33.6 -178.9 -4.9 27.9 22.8 23.3 0.0
Kitan 23.8 0.0 0.0 0.0 0.0 0.0 0.0
Source: Petroleum Fund Administration Unit, Ministry of Finance, 2016
Petroleum prices
Brent crude oil continues to be used in the petroleum wealth calculation as it represents a
better indicator of the price of Bayu-Undan liquid products (condensate and LPG).
The oil price has substantially dropped since mid-2014 due to global over-supply and weak
demand. The daily average oil price of Brent in 2015 was US$52.3 per barrel and in 2016 for
the period from 1 January to mid-September was $41.5 per barrel. The estimated average oil
price for 2016 as a whole is now $42.7 per barrel, compared with the $64.7 per barrel estimate
in the Budget 2016. Future oil prices are now assumed to be significantly lower than

Page 39 of 96
previously forecasted (see Figure 2.6.3.1.1). Oil prices have been more volatile since mid-2014
and future oil price projections also are associated with higher uncertainty.
Figure 2.6.3.1.1: Historical Changes and Future Projections for Brent Oil Price ($ per barrel)
Source: Petroleum Fund Administration Unit, Ministry of Finance, 2015
Petroleum Production
The production forecast of liquids (condensate and LPG) for Bayu-Undan is lower compared
with the Budget 2015 and 2016. The total petroleum production from Bayu-Undan (also
including LNG) is estimated to have peaked in 2011 at 59 million barrels of oil equivalents and
is now set to decline before ceasing in 2020.
Production in the Kitan field commenced in the 4th quarter of 2011. Operations were
suspended in December 2015 due to the drop in prices and Kitan is currently excluded in the
ESI calculation.
Costs
The forecasted total costs for the Bayu-Undan project are slightly lower in this Budget 2017
than in the Budget 2016. The change in the cost projections is primarily from the capital
expenditures related to Phase 3 and other operational issues.
2.6.3.2 Petroleum Wealth and ESI calculation
According to the Petroleum Fund Law, the Estimated Sustainable Income (ESI) is the
maximum amount that can be appropriated from the Petroleum Fund in a fiscal year and
leave sufficient resources in the Petroleum Fund for an amount of the equal real value to be
appropriated in all later years. The ESI is set to be 3 percent of the Petroleum Wealth. The ESI
is designed to help smooth government spending when petroleum revenues are temporarily
high and in the subsequent years to protect the real value of the Petroleum Fund. The
0
50
100
150
200
250
1987 1992 1997 2002 2007 2012 2017 2022 2027 2032
Brent Historical EIA Low Case 2016
EIA Base Case 2016 EIA High Case 2016
Price to ESI 2017 Price to ESI 2016
Price to ESI 2015 Price to ESI 2014
Price to ESI 2013
US$
per
bar
rel,
$201
5US
$ pe
r bar
rel,
$201
5

Page 40 of 96
Government can withdraw an amount from the Petroleum Fund in excess of the ESI where
National Parliament approves that it is in the long term interest of Timor-Leste.
Figure 2.6.3.2.1 depicts the actual withdrawals from 2005 to 2015 and approved for 2016
compared to the ESI.
Figure 2.6.3.2.1: Actual withdrawals vs. ESI from 2005 to 2016 est. (US$ million)
From 2006/2007 until the end of 2015, the Government has withdrawn a total of $7,309.4
million. This is about $2,083.8 million higher than the cumulative ESI for that period. For the
purpose of estimating ESI, it is assumed that the Government is expected to withdraw the full
amount approved by the Parliament for 2016 of $1,674.5 million, which would increase the
total cumulative withdrawal to nearly $9 billion or $3.2 billion above the cumulative ESI.
The Petroleum Wealth is estimated to be $16,054.6 million as of 1 January 2017, comprised
of the Fund’s balance of $15,606.6 million and the Net Present Value of future petroleum
revenue of $448.0 million. Accordingly, the ESI is estimated at $481.6 million for 2017. This is
about $52.8 million less than what was estimated in last year’s budget. The key assumptions
behind the calculations are listed in Table 2.6.3.2.1.
Table 2.6.3.2.1: Key assumptions behind the ESI
Asset recognition Forecast petroleum revenues are included only for projects with approved development plans. This includes Bayu-Undan.
Petroleum Reserves and Production Forecasts
Project operators provide production estimates. Low case production is used, consistent with a 90 percent probability that actual will exceed the forecast.
Oil price forecast ESI for Budget 2017 is prepared using the average of the Energy Information Agency (EIA) low case and reference case for Brent in its Annual Energy Outlook (AEO) for 2016.
-
260
40
396 512
811
1,055
1,495
730 732
1,279
$1,675
103
283
133
396 408 502
734 665
787
632 639545
0
200
400
600
800
1,000
1,200
1,400
1,600
1,800
2005/06 2006/07 2007 2008 2009 2010 2011 2012 2013 2014 2015 2016B
US$
mill
ion
Withdrawals ESI

Page 41 of 96
Prices for specific petroleum products
Bayu Undan produces condensate, Liquefied Petroleum Gas (LPG) and Liquefied
Natural Gas (LNG). Forecast assumptions for each product are derived from historic
differentials observed with Brent. Liquefied Natural Gas (LNG) prices are forecast
using the provisional price formula negotiated between the Darwin LNG (DLNG)
facility and Japanese LNG buyers. The price formula is renegotiated every three years.
Production costs Central estimates of future capital and operating costs as provided by project operators.
Discount rate Under Schedule 1 of the Petroleum Fund Law, the interest rate used to discount future petroleum revenue is the expected rate of return on the portfolio of financial assets held in the Fund. The Fund’s asset allocation is 60 percent bonds and 40 percent equities.
Table 2.6.3.2.2 shows that the estimated Petroleum Wealth and the ESI from 2015 and
onwards, assuming that withdrawals from the Fund are equal to the projected withdrawals
in Table 2.6.3.3.1.
Table 2.6.3.2.2: Petroleum Wealth and the Estimated Sustainable Income (ESI)
2015* 2016* 2017
Budget 2018 2019 2020 2021
Estimated Sustainable Income (PWx3%)
638.5 544.8 481.6 475.1 447.9 419.6 393.3
Total Petroleum Wealth (PW) 21,283.3 18,159.6 16,054.6 15,836.4 14,928.6 13,988.0 13,110.1
Opening PF Balance 15,606.6 15,634.1 14,799.8 13,887.2 13,021.5
Net Present Value of Future Revenues
448.0 202.3 128.8 100.8 88.6
Note: * ESI for 2015 & 2016 figures as estimated for in Budget 2015 and Budget 2016
Changes in the ESI from 2016 to 2017
Figure 2.6.3.2.1 shows the key incremental changes in the 2017 ESI since the Budget 2016.
The main factors driving the difference are the lower oil price, lower investment returns in
2015 and higher withdrawals following the 2016 rectification budget.
Actual data for 2015
The current ESI for 2017 incorporates the actual outcomes in 2015. Actual petroleum revenue
was $117 million higher (13.6 per cent) than estimated. However, the actual investment
return was much lower than the long-run expected return, which resulted in a lower than
estimated petroleum fund balance. In sum, this decreased the 2017 ESI by $12 million.
Actual 2016 withdrawals from the Petroleum Fund
The 2017 ESI as estimated in Budget 2016 is based on the assumption that the Government
would withdraw the ESI plus the approved excess from the Petroleum Fund in original 2016
budget. However, the Parliament approved a rectification budget for 2016 that involves

Page 42 of 96
higher withdrawals, $1,129.7 million in excess of the ESI. This has decreased the 2017 ESI by
$12 million.
Oil prices
The current ESI for 2017 assumes a benchmark oil price of $42.7 per barrel in 2016. This is
based on the actual outcomes from January to mid-September and forecasts of future prices
from November to December 2016. The oil benchmark forecast for next year is $42.2 per
barrel, which is lower than the forecast previously used of $68.8. The change in Brent
benchmark forecast results in a US$ 32 million decrease in the 2017 ESI.
Production
Production in 2017 is forecasted to be more or less the same as in Budget 2016. The first few
years are now expected to be higher, however this is offset by the production ceasing one
year earlier in 2020. These estimates resulted in ESI for 2017 increasing by $1 million.
Liquids price differentials (condensate and LPG)
The price for Bayu-Undan condensate products is forecasted based on the historical
relationship with the benchmark Brent price. This historical price differential is then applied
to the EIA’s forecasts for Brent prices to estimate the future price on the products sold in the
Timor Sea. The result of these new price differentials is similar with what was previously used
hence there is no impact on the ESI 2017.
Cost
Production costs from the two operators are forecasted to be slightly lower in Budget 2017
than in Budget 2016. This has increased the ESI 2017 by $12 million.
Rates of return and discount rate
The expected long-term nominal portfolio return remains unchanged from last year’s forecast
of 5.7 percent nominal per annum. This is applied in future years although for 2016 the
expected investment return (which is an average of actual returns to date and expected
returns) is lower. This decreases the ESI 2017 by $1 million.
Other Taxes
Other taxes include wage taxes, tax collections from subcontractors and exploration drilling.
These taxes are forecast for Budget 2017 based on an analysis of recent collections and taking
into account exploration work commitments. This has decreased the ESI 2017 by $2 million.

Page 43 of 96
Figure 2.6.3.2.1: Changes in the 2016 ESI (from Budget 2015 to Budget 2016)
Source: Petroleum Fund Administration Unit, Ministry of Finance, 2016
Sensitivity Analysis
The Government’s objective is to prepare an ESI that is prudent overall, as required by the
Petroleum Fund Law. The calculations are based on the best information available and advice
from experts, however, each input is inherently subject to significant uncertainty.
Figure 2.6.3.2.3 starts with the ESI 2017 of $481.6 million and shows by how much ESI would
change if a different assumption for each key variable were used. The current ESI is much less
affected by the change in petroleum revenue assumptions about oil prices and production,
compared to earlier years when future petroleum revenues represented a greater share of
Petroleum Wealth.
Note from Figure 2.6.3.2.3 that:
If the average of the low and base case production (which is labeled P70 Production7) was
used in ESI 2017, rather than the low case, the ESI would increase by $17 million to $499
million.
If the Base Case for LNG production was used, it would change the ESI by approximately
$21 million. If the Base Case production for both Liquids and LNG was used, the ESI would
increase by $32 million.
7 The average of the low (P90) case and the base (P50) case is not exactly the same as the P70 case, but they are roughly equivalent and the label P70 is used for convenience. Rather than using the low case in the ESI
-12
1
-32
012
-1
545 534
-12-2
482
0
100
200
300
400
500
600
2016 ESI
Old2017 ESI
2015ActualData
2016PF
Withdrawals
Production Oil Prices PriceDifferentials
Costs Rates of Return
OtherTaxes
ESI2017
Mill
ion
US$

Page 44 of 96
For each change in production costs by 15 percent, the ESI would change by $3 to $4
million.
The forecast of future petroleum prices is based on the average of the AEO Low and
Reference Cases for Brent. Using the Low Case instead would decrease the ESI by $10
million and using the Reference Case would increase the ESI by approximately $7 million.
For a $10 change in Brent prices relative to the average used, the ESI would change by
$13 million (down) to $17 million (up).
Figure 2.6.3.2.2: Sensitivity Analysis – Estimated Sustainable Income ($m)
Source: Petroleum Fund Administration Unit, Ministry of Finance, 2016
2.6.3.3 Managing the Petroleum Fund
The Petroleum Fund Model
The Petroleum Fund is set up to contribute to a wise management of Timor-Leste’s petroleum
resources for the benefit of both current and future generations. The Petroleum Fund
framework facilitates sound fiscal policy and well-informed budget decisions. Petroleum
revenues are transferred directly in their entirety to the Fund and invested abroad in
diversified financial assets. The Fund’s only outflow is the annual transfer made to the
government budget. The amount withdrawn is guided by the ESI, defined as 3 percent of the
petroleum wealth. Accordingly, the implied investment objective of the Fund is to earn a 3
percent real return per annum. This enables the Fund to preserve its purchasing power when
spending is constrained by the ESI.
calculations, we have considered using the average of the low and the base forecasts for petroleum production calculations to be consistent with the methodology for petroleum prices.
13
10
3
0
0
0
17
7
4
21
32
17
450 475 500 525
From: Benchmark -US$ 10
To: Benchmark + US$ 10
From: Low Case BenchmarkTo: Base Case Benchmark
From: Costs Up 15%To: Costs Down 15%
From: ESI2017
To: Base Case LNG
From: ESI2017
To: Base Case Liquids & LNG
From: ESI2017
To: P70 Production
Estimated Sustainable Income ($000,000)

Page 45 of 96
Governing the Petroleum Fund
The Petroleum Fund’s governance model is internationally recognized for its high degree of
transparency and disclosure. The Ministry of Finance is responsible for the overall
management of the Fund. It sets investment policy and strategy, investment guidelines and
exercises oversight. The Ministry of Finance is required to seek advice from the Investment
Advisory Board before making any decision on investment strategy or management of the
Fund. The operational management of the Fund is delegated to the Central Bank, which
invests according to guidelines established by the Ministry of Finance. The framework
encourages consensus and relevant stakeholders are accountable to one another for their
role in the decision-making process.
Petroleum Fund Investment Policy
The Petroleum Fund’s asset allocation of 40% equities and 60% bonds is designed to meet the
3% real return objective with a reasonable probability over the long run. While equities are
expected to provide higher returns than bonds over the long-run, there is a corresponding
increase in risk. Modelling of the Fund’s 40% equity allocation helps put this risk in context:
The Fund is expected to experience a loss in one out of every 5 years.
In the worst 5 years out of every 100, the loss will be 5.5 percent or higher. Based on
a fund balance of $16.6 billion, this represents a loss of US$913 million.
As such, it is important for stakeholders to understand that there will invariably be years
where the Petroleum Fund posts losses. This was the case in 2015, when a small investment
loss was recorded. The loss can potentially be much higher, as reported above. Investment
returns require taking risk and that is attained through the equity allocation. If stakeholders
prefer to reduce risk and the chance of losses, the equity allocation will need to reduce and
the Fund’s expected return will be lower.
As noted, financial markets are volatile so the Fund’s performance will vary around the 3%
real return target from year to year. Returns are uncertain even over longer periods. For
example, it is not guaranteed that the 40% equity and 60% bond allocation will meet the real
return objective of 3% per annum even over the long-term. The 40% equity allocation means
we can expect a real return of 3% p.a. or more about two thirds of the time over a 20 year
horizon. In other words, there is a one in three chance that actual returns will fall short of the
target. This is likely to be exacerbated by the current low return environment, with
government bonds yields at either very low levels or negative in developed markets.
The Petroleum Fund’s balance has been declining since 2015 and that is expected to continue.
The outflows from government withdrawals are exceeding the inflows from petroleum and
investment revenue, requiring assets to be sold.
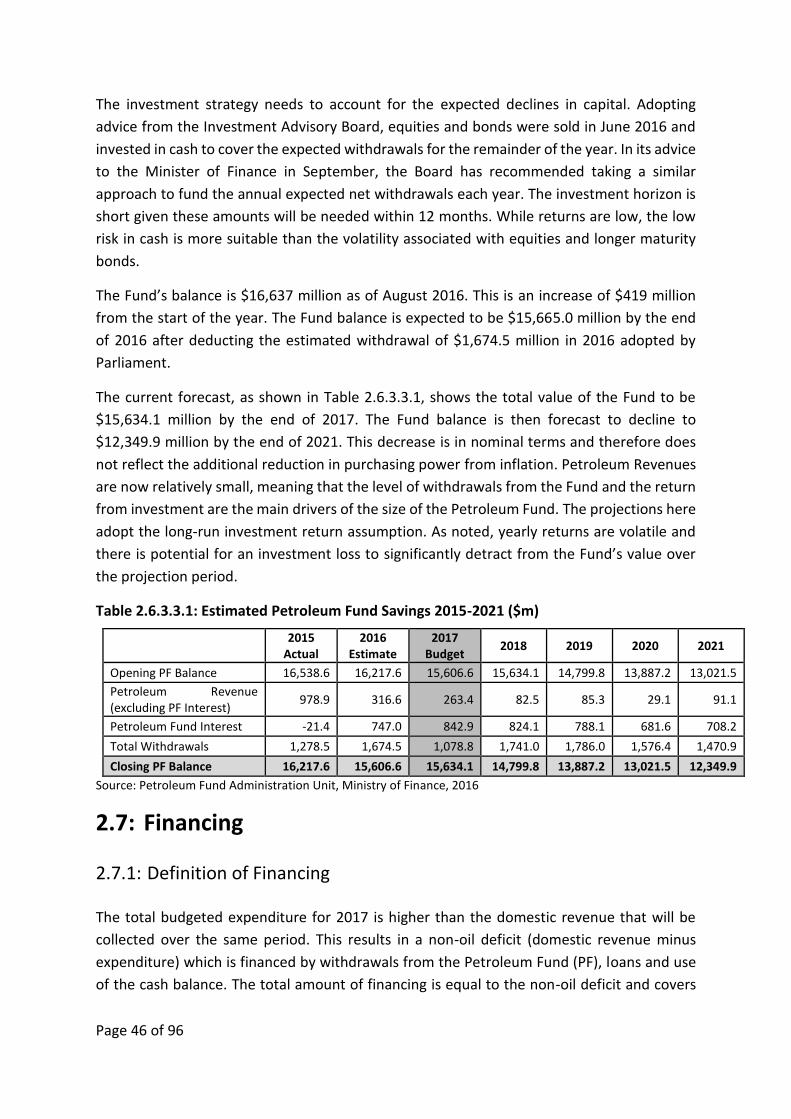
Page 46 of 96
The investment strategy needs to account for the expected declines in capital. Adopting
advice from the Investment Advisory Board, equities and bonds were sold in June 2016 and
invested in cash to cover the expected withdrawals for the remainder of the year. In its advice
to the Minister of Finance in September, the Board has recommended taking a similar
approach to fund the annual expected net withdrawals each year. The investment horizon is
short given these amounts will be needed within 12 months. While returns are low, the low
risk in cash is more suitable than the volatility associated with equities and longer maturity
bonds.
The Fund’s balance is $16,637 million as of August 2016. This is an increase of $419 million
from the start of the year. The Fund balance is expected to be $15,665.0 million by the end
of 2016 after deducting the estimated withdrawal of $1,674.5 million in 2016 adopted by
Parliament.
The current forecast, as shown in Table 2.6.3.3.1, shows the total value of the Fund to be
$15,634.1 million by the end of 2017. The Fund balance is then forecast to decline to
$12,349.9 million by the end of 2021. This decrease is in nominal terms and therefore does
not reflect the additional reduction in purchasing power from inflation. Petroleum Revenues
are now relatively small, meaning that the level of withdrawals from the Fund and the return
from investment are the main drivers of the size of the Petroleum Fund. The projections here
adopt the long-run investment return assumption. As noted, yearly returns are volatile and
there is potential for an investment loss to significantly detract from the Fund’s value over
the projection period.
Table 2.6.3.3.1: Estimated Petroleum Fund Savings 2015-2021 ($m)
2015
Actual 2016
Estimate 2017
Budget 2018 2019 2020 2021
Opening PF Balance 16,538.6 16,217.6 15,606.6 15,634.1 14,799.8 13,887.2 13,021.5
Petroleum Revenue (excluding PF Interest)
978.9 316.6 263.4 82.5 85.3 29.1 91.1
Petroleum Fund Interest -21.4 747.0 842.9 824.1 788.1 681.6 708.2
Total Withdrawals 1,278.5 1,674.5 1,078.8 1,741.0 1,786.0 1,576.4 1,470.9
Closing PF Balance 16,217.6 15,606.6 15,634.1 14,799.8 13,887.2 13,021.5 12,349.9
Source: Petroleum Fund Administration Unit, Ministry of Finance, 2016
2.7: Financing
2.7.1: Definition of Financing
The total budgeted expenditure for 2017 is higher than the domestic revenue that will be
collected over the same period. This results in a non-oil deficit (domestic revenue minus
expenditure) which is financed by withdrawals from the Petroleum Fund (PF), loans and use
of the cash balance. The total amount of financing is equal to the non-oil deficit and covers

Page 47 of 96
the gap between the budgeted expenditure and domestic revenue. Table 2.7.1.1 below shows
the amount drawn from each of the financing items.
Table 2.7.1.1: Financing 2017 to 2021, ($m)
2017 2018 2019 2020 2021
Total Financing 1,180.6 2,051.7 2,246.8 1,894.2 1,689.1
Estimated Sustainable Income (ESI) 481.6 475.1 447.9 419.6 393.3
Excess Withdrawals from PF 597.1 1,265.9 1,338.1 1,156.8 1,077.5
Use of Cash Balance 0.0 0.0 0.0 0.0 0.0
Borrowing /Loans 101.8 310.7 460.8 317.8 218.2
Sources: National Directorate of Budget, Petroleum Fund Administration Unit and Major Projects Secretariat,
Ministry of Finance, 2016
There are important economic reasons for distinguishing between domestic revenue and
financing items. Domestic revenue results from taxes borne by companies and individuals in
Timor-Leste. An increase in domestic revenue allows for an increase in Government spending
in Timor-Leste but is also likely to decrease spending by companies and individuals. The
impact on the total amount of money and demand in the economy is therefore broadly
neutral.
In contrast, financing expenditures by withdrawing money from the Petroleum Fund
increases the overall level of demand within the economy. This increase in demand, if not
matched by an increase in ability of the economy to supply goods through imports or
domestic production, can lead to higher inflation.
2.7.2: ESI and Excess Withdrawals
The ESI can be thought of as the amount that can be withdrawn from the PF each year,
forever, without the fund ever running out of money. The ESI is equal to 3% of the net
petroleum wealth and is $481.6 million in 2017. Further details on the ESI and petroleum
wealth can be found in Section 2.6.3 of the Budget Book.
In addition, the Government plans to withdraw $597.1 million in excess of the ESI. This excess
withdrawal is in line with the Government’s policy on frontloading, and a detailed justification
can be found in Annex 4.1. These excess withdrawals are being used to finance core
infrastructure, which is necessary for long-term growth.
2.7.3: Loans
As established in the Strategic Development Plan 2011-2030 and in the Public Debt Law,
concessional loans constitute a potential source of financing to be considered by the
government for the purpose of financing strategic infrastructure projects. The rationale for
drawing on concessional loans is three-fold. First, the all-in cost of concessional loans is less

Page 48 of 96
than the opportunity cost of withdrawing a similar amount from the Petroleum Fund. That is
to say, the recourse to loans allows for net savings in terms of public expenditure. Second,
loans make it possible to spread the financial cost of infrastructure projects over a period that
more closely matches the economic life of the assets in question, thereby increasing
intergenerational equity. And third, concessional loans from development partners are often
accompanied by significant technical assistance, helping the government to strengthen the
standards for the implementation of these projects.
Loan mobilization is undertaken in accordance with the Public Debt Law (Law no. 13/2011),
which establishes several key guiding criteria. In particular, it states that public debt
management must be guided by principles of rigor and efficiency which include: upholding
the middle- and long-run equilibrium of public finances; minimizing the direct and indirect
costs over the long run; ensuring the availability of financing in each budget cycle; avoiding
the excessive temporal concentration of debt servicing; avoiding excessive risk; and
promoting the balanced and efficient functioning of financial markets.
To ensure that these principles are upheld, the recourse to external concessional loans is
rigorously planned and implemented by the government within the parameters validated on
an annual basis by the National Parliament. Moreover, the sustainability of public debt is
assessed on a regular basis both internally by the Ministry of Finance and externally by the
International Monetary fund. On its latest Article IV consultation 2016, IMF supported greater
use of concessional financing for large infrastructure projects, which would reduce reliance
on withdrawals from the Petroleum Fund while contributing to fiscal sustainability. In 2017,
a maximum loan ceiling of $500 million over a maximum period of 40 years has been agreed.
To date, the Government has signed seven loan packages, totaling approximately $321
million, in support of infrastructure projects with high social and economic returns. However,
because the loan funds are disbursed directly as a function of project progress, and because
some of the projects are still in their early stages, actual public debt incurred as of July 2016
amounted to $59.7 million.
Six of the loan packages taken on by the government are for the rehabilitation and upgrade
of national roads, while one project is for the upgrade of the drainage infrastructure in Dili:
Road Network Upgrading Project (RNUP), Dili-Liquica and Tibar-Gleno road sections
(signed by GOTL and ADB in 2012).
National Road No.1 Upgrading Project, Dili-Manatuto-Baucau (signed by GOTL and JICA in
2012).
Road Climate Resilience Project, Dili-Ainaro (signed by GOTL and WB in 2013).
Road Network Upgrading Sector Project (RNUSP), Manatuto-Natarbora (signed by GOTL
and ADB in 2013).
Additional Financing for Road Network Upgrading Project (Tasitolu-Tibar Dual
Carriageway Road Project) (signed by GoTL and ADB in June 2015).

Page 49 of 96
Dili Drainage Infrastructure Project (signed by GoTL and China EXIM Bank in December
2015)
Additional Financing for Road Network Upgrading Sector Project (Baucau-Lautem,
Maubara-Karimbala and Atabae-Mota Ain) (signed by GoTL and ADB in March 2016)
The following paragraphs provide additional information on each of these loan-funded
projects.
a. Road Network Upgrading Project (Dili-Liquica and Tibar-Gleno road sections)
This loan package was signed with the Asian Development Bank (ADB) in 2012 to finance the
rehabilitation and upgrade of the Dili-Tibar-Liquiçá (28.7 km) and Tibar-Gleno (32 km) road
sections. These are two important components of the inter-urban network with some of the
highest traffic levels in the country. The loan package is comprised of two loans: a highly-
concessional Asian Development Fund (ADF) loan in the amount of SDR 5,905,000
(approximately $9.2 million) with a fixed interest rate of 1% per annum during the 8-year
grace period and 1.5% thereafter; and a slightly less concessional Ordinary Capital Resources
(OCR) loan for $30.9 million with a variable interest rate of LIBOR+0.4%. Physical progress in
the Dili-Tibar-Liquiçá component was nearly 89% by late June 2016, while the Tibar-Gleno
section was completed and inaugurated in June 2016.
Total interest and other charges paid on this loan package as of June 2016 was $376,946. The
repayment of the principal will commence on September 15, 2017.
b. National Road No.1 Upgrading Project, Dili-Manatuto-Baucau
The 116 km segment linking Dili-Manatuto-Baucau is a very important component of the road
network, which connects three of the country’s main cities. A loan in support of this project
was signed with the Japan International Cooperation Agency (JICA) in 2012 for an amount of
approximately 5.28 million Yen, which at the time amounted to approximately $68.7 million.
However, the subsequent devaluation of the Yen and an increase in the estimated costs of
the works during the design phase made it necessary to undertake the financial structuring
of this project. As a consequence, a decision was made to allocate the JICA loan entirely to
financing Package I, between Hera-Manatuto, while the government is currently exploring the
possibility of mobilizing an additional loan from ADB to finance the Manatuto-Baucau section.
The interest rate on the JICA loan is a highly-concessional 0.7% per annum for the amount
spent on civil works and 0.01% for the amount spent on consulting services. Procurement for
this project has suffered considerable delays because of the need for the Government to wait
for the non-objection letter from JICA in relation to the bidding documents, which was finally
received in April 2015. Construction is expected to commence in the third quarter of 2016.
As of June 2016, total interest and charges paid on this loan amounted to $286,058, for
disbursements to cover expenses related to the design of the road.

Page 50 of 96
c. Road Climate Resilience Project, Solerema-Ainaro
This loan package was signed with the World Bank in November 2013 and is comprised of two
loans: a highly-concessional IDA loan in the amount of $25 million with an interest rate of
1.25%, Plus basis adjustment and an IBRD loan in the amount of $15 million with a variable
interest rate of LIBOR+1%. This financing package supports the rehabilitation and upgrade of
several sections of the north-south road that connects the capital Dili with the southern
regions of Ainaro, Covalima and Manufahi. Completion of the works in the three lots that
make up this loan-funded project is expected for March 2017 (Solerema-Bandudatu),
November 2017 (Bandudatu-Aituto) and February 2018 (Aituto-Ainaro).
As of June 2016, interest and other charges paid on this loan package amounted to $241,368.
The repayment of the principal will begin in March 2019.
d. Road Network Upgrading Sector Project, Manatuto-Natarbora
The second loan package entered into with Asian Development Bank (in November 2013)
finances the rehabilitation and upgrade of another major north-south axis, between
Manatuto and Natarbora. It is comprised of a OCR component worth $40 million with variable
interest of LIBOR+0.5% per annum, and an ADF loan with a 2% fixed interest rate in the
amount of SDR 6.672 million (around $10 million). As of June 2016, physical progress was 18%
in the Manatuto-Laclubar section and 13% in the Laclubar-Natarbora section. Expected dates
of completion are July 2017 and March 2018, respectively.
Total interest and other charges paid as of June 2016 amounted to $211,356. The repayment
of the principal will commence in April 2019.
e. Additional Financing for Road Network Upgrading Project, Tasitolu-Tibar Dual
Carriageway Road
This financing package was signed with ADB on 24 June 2015 to complement the ongoing
Road Network Upgrading Project, so as to cover the construction of a four-lane road linking
Tasitolu to the entrance of the future Tibar Bay Port (a total of 5.2km). The total loan amount
is $11.8 million and the interest rate (variable) is LIBOR+0.6% per annum. The procurement
process for the contractor is currently being finalized.
Total charges paid as of June 2016 amounted to $9,915. The repayment of principal will begin
in September 2019.
f. Dili Drainage Infrastructure Project
The Dili Drainage Infrastructure Upgrading Project is intended to reduce frequent flooding
events and improve public health and safety conditions in Dili, ultimately contributing to the
economic growth of the city and Timor-Leste as a whole. The drainage components to be
constructed include retarding basins, canals, and road drainages. The loan agreement in
support of this project was signed with China EXIM Bank in December 2015. The loan amount

Page 51 of 96
is $50 million and the interest rate (fixed) is a concessional 2% per annum. The
implementation of the project will commence upon approval of the signed loan agreement
by the Audit Court.
g. Additional Financing for Road Network Upgrading Sector Project, Baucau-Lautem,
Maubara-Karimbala and Atabae-Motain
This loan package is an additional financing to the ongoing Road Network Upgrading Sector
Project and is meant to support the rehabilitation and upgrade of three additional sections of
the North Coast road corridor: Baucau-Lautem, Maubara-Karimbala and Atabae-Motain.
Total financing in the amount of $76.2 million will be provided by ADB as per the agreements
signed in March 2016: one for an OCR loan worth $53 million (LIBOR+0.6% interest) and the
other for an ADF loan in the amount of SDR 16.754m (around $23.2 million, with 2% fixed
interest). At present, this project is still in the procurement stage.
As to date, no payment has been made for interest or other charges. The repayment of the
principal will begin in April 2021. The total projected loan disbursements, over the period
2017-2021, can be seen below in Table 2.7.3.1.
Table 2.7.3.1: Projected Total Loan Financing 2017-2021, ($m)
Total 2017 2018 2019 2020 2021
Loans 1,409.4 101.8 310.7 460.8 317.8 218.2
Sources: National Directorate of Budget and Major Projects Secretariat, Ministry of Finance, 2016
Details about each of the loan agreements are summarized in Table 2.7.3.2.

Page 52 of 96
Table 2.7.3.2 Loan Agreement Summary
JICA Loan ADB - 2857 ADB - 2858 ADB - 3021 ADB - 3020 ADB-3341 ADB-3342 WB - 5303 WB-8290 ADB - 3181 CHINA EXIM BANK PBC NO. 2015 (3) TOTAL NO. (345)
Parties:
The Government of the Democratic
Republic of Timor-Leste and
Japan International Cooperation
Agency
The Government of the Democratic
Republic of Timor-Leste and
Asian Development
Bank
The Government of the Democratic
Republic of Timor-Leste and
Asian Development
Bank
The Government of the Democratic
Republic of Timor-Leste and Asian
Development Bank
The Government of the Democratic
Republic of Timor-Leste and Asian
Development Bank
The Government of the Democratic
Republic of Timor-Leste and Asian
Development Bank
The Government of the Democratic
Republic of Timor-Leste and Asian
Development Bank
Democratic Republic of Timor-Leste and
International Development Association
Democratic Republic of Timor-Leste and
International Bank for Reconstruction and
Development
The Government of the Democratic
Republic of Timor-Leste and Asian
Development Bank
The Government of the Democratic
Republic of Timor-Leste and China EXIM
Bank
Agreement Date:
19-Mar-12 02-May-12 02-May-12 18-Nov-13 18-Nov-13 04-Mar-16 04-Mar-16 18-Nov-13 18-Nov-13 24-Jun-15 18-Dec-15
Amount: Yen
5,278,000,000 (US$63,300,551)
USD 30,850,000 SDR 5,905,000 SDR 6,672,000 USD
40,000,000 USD
53,000,000 SDR
16,574,000 USD 25,000,000 USD 15,000,000
USD 11,780,000
USD 50,000,000
Grace Period 10 years 5 years 8 years 5 years 5 years 5 years 5 years 5 years 8 years 5 years 5 years
Repayment period:
20 Years (20 September 2022 – 20 March 2042)
20 Years (15 September 2017 – 15 March 2037)
23.5 Years (15 September 2020 – 15 March 2044)
20 Years (15 April 2019 -
15 October 2038)
20 Years (15 April 2019 -
15 October 2038)
20 Years (15 April 2021 -
15 October 2040)
20 Years (15 April 2021 -
15 October 2040)
20 Years (15 March 2019 - 15
September 2038) - Commencing 15 March 2019 to and including 15
Sept 2028 - 1.65% of principal amount
- Commencing 15 March 2029 to and including 15
Sep 2038 - 3.35% of principal amount
20 Years (15 March 2022 - 15
September 2041) - Commencing 15
March 2022 through 15 Sept 2040 - 2.56%
of principal amount -including 15 March 2041 to 2.72% of principal amount
20 Years (15 September
2019 - 15 March 2039)
15 Years (14 July 2022 - 14
January 2037)
Interest rates:
0.7% per annum payable Semi-annually on the
principal withdrawn for
Civil Works and 0.01% p.a. interest on consulting services
(Capitalized)
The sum of LIBOR + 0.60%
less credit of 0.20% on the loan
withdrawn payable on 15 March and 15
September each year
(Capitalized).
1% per annum during the grace period and 1.5%
per annum thereafter on the
withdrawn amount.(Grace
period prior to the first Principal
Payment Date.) Payable on 15 March and 15
September each year (Capitalized)
2% p.a (During and after grace
period) -Capitalized
LIBOR + (0.60% - 0.20%) + 0.10% p.a maturity premium
(during and After Grace
Period) - Capitalized
LIBOR + (0.60% - 0.10%) + 0.10% p.a maturity premium
(during and After Grace
Period) - Capitalized
2% p.a (During and after grace
period) -Capitalized
(1.25 p.a + Basis adjustment) - to be paid
directly under State Budget
Ref Rate + Fixed Spread (1%) -
Capitalized
LIBOR + (0.60% - 0.10%) + 0.10% p.a maturity
premium. - Capitalized
2% p.a (During and after grace period) -be paid from State Budget

Page 53 of 96
Commitment Charge
0.1% per annum payable semi-
annually on total unused amount budgeted for all
works and services
excluding commitment
charges. (Commitment
charges is also lent to the borrower) - Capitalized
0.15% per annum on full amount of
the loan (less amounts
withdrawn) from 60 days after the date of the loan
agreement payable on 15 March and 15
September each year- Capitalized
- -
0.15% per annum on full amount of the
loan (less amounts
withdrawn) from 60 days after the date
of the loan agreement - Capitalized
0.15% per annum on full amount of the
loan (less amounts
withdrawn) from 60 days after the date
of the loan agreement - Capitalized
-
1/2 of 1 % p.a (Unwithdrawn Financing Balance) - to be paid direcly under State
Budget
-
0.15% per annum on full amount of the
loan (less amounts
withdrawn) from 60 days after the date
of the loan agreement
payable on 15 March and 15
September each year - Capitalized
0.25 % p.a (Unwithdrawn
Financing Balance) - be paid from State
Budget
Service Charge
- - - - - - -
The greater of (3/4 of 1% p.a + basis adjustment)
or 3/4 % p.a - to be paid directy under State
Budget
- - -
Front End Fee - - - - - - - - USD 37,500 (0.25% of
loan amount) -
USD 125,000 (0.25% of loan amount)
Dates of repayment:
Semi-annually on 20 March and 20
September. Principal: Refer to Schedule 3 Loan
Agreement
15 March and 15 September each
year. Principal: Refer to Schedule 1 Loan
Agreement
15 March and 15 September each
year. Principal: Refer to Schedule 2 Loan
Agreement
Interest and other charges: payable on 15 April and 15
October each year.
Principal: Refer to Schedule 1
Loan Agreement
Interest and other charges: payable on 15 April and 15
October each year.
Principal: Refer to Schedule 2
Loan Agreement
Interest and other charges: payable on 15 April and 15
October each year.
Principal: Refer to Schedule 2
Loan Agreement
Interest and other charges: payable on 15 April and 15
October each year.
Principal: Refer to Schedule 1
Loan Agreement
Interest and other charges: payable on 15
March and 15 September each year.
Principal: Refer to Schedule 3 Loan
Agreement
Interest and other charges: payable on
15 March and 15 September each year.
Principal: Refer to Schedule 3 Loan
Agreement
Interest and other charges: payable on 15 March and 15
September each year.
Principal: Refer to Schedule 2
Loan Agreement
Interest and other charges: payable on 14 January and 14
July each year. Principal: subject to
the amount disbursed at end of grace period
Loan closing date
30-Jun-17 30-Jun-17 30-Jun-20 30-Jun-20 30-Jun-21 30-Jun-21 31-Dec-18 31-Dec-18 30-Jun-18 2021 (Estimated)
Project completion date:
Jun-17 30-Dec-16 30-Dec-16 31-Dec-19 31-Dec-19 31-Dec-20 31-Dec-20 - - 31-Dec-17 2018 (Estimated)

Page 54 of 96
2.7.4: Use of the Cash Balance
The use of the cash balance for the Consolidated Fund of Timor-Leste (CFTL) at the end of
2015 is forecast to be insignificantly small, and hence no cash balance will be included to
finance expenditures in the 2017 State Budget. Similarly, there is also no forecasted rollover
of cash balances for the IF and HCDF from 2017.
Table 2.7.4.1 Use of Cash Balance in 2017
Total 0.0
HCDF Rollover 0.0
Drawdown of Cash Balances from the Treasury Account 0.0
Source: General Directorate of Treasury, Secretariat for the Human Capital Development Fund, 2016
2.7.5: Public Private Partnerships
Public-Private Partnerships (PPP) are long-term relationships between the government and
a private partner for the provision of infrastructure or other public services. They make it
possible to tap into the know-how, experience and innovation of the private sector, to
improve the standards in the provision of public services, and to allocate risks in ways that
are more efficient (for example, by the private partner taking responsibility for the timely
completion of the infrastructure, subject to payment of compensation in the event of
delays).
Timor-Leste began exploring PPPs as a modality for project implementation around 5 years
ago, and started out by establishing a PPP Policy, PPP legislation and a dedicated PPP Unit
in the Ministry of Finance. All of these seek to ensure that only high-quality projects, which
have high social and economic returns and which are aligned with the government’s
strategic priorities, are considered for implementation through a PPP modality. For
example, the legislation on PPPs includes a requirement that all PPP projects undergo both
a pre-feasibility study and a full-fledged feasibility study prior to proceeding to the
procurement phase. Each candidate project is carefully considered from the technical,
economic, financial, legal, environmental and social perspectives, and compared to the
alternative of standard public sector provision, to ensure that there is value for money in
pursuing a PPP modality.
The government is aware of the negative experiences that some other countries have had
with public-private partnerships, and has drawn on those experiences to avoid making the
same mistakes and to maximize the benefits of PPP. For the most part, those negative

Page 55 of 96
experiences elsewhere have been due to poor project selection, an inadequate legal and
institutional framework, inadequate risk allocation, and the use of PPP to overcome budget
restrictions. In the case of Timor-Leste, the screening of the projects during the feasibility
stage is especially rigorous; a dedicated PPP unit and specific legislation were created prior
to the first project being implemented; the shifting of risks to the private partner (especially
demand risk in commercially viable projects like Tibar Bay Port) is a key consideration; and
PPP are not used to circumvent budget restrictions, but rather to mobilize private sector
know-how, experience and innovation.
There are currently four projects in the PPP pipeline: Tibar Bay Port, Dili Water Supply,
Electricity Sector, and Medical Diagnostic Service. Tibar Bay Port recently entered the
implementation stage following the signing of the concession agreement between the
government and Bolloré Consortium on 3 June 2016. The concessionaire will design, co-
finance, build, operate and transfer back a world-class container and cargo port, which will
make it possible to overcome the limitations of the existing Dili Port and significantly boost
Timor-Leste’s international connectivity. Construction of the port is expected to begin in
mid-2017, after the design documents and environmental studies have been completed,
and completion of the facility is scheduled for mid-2020.
Dili Water Supply PPP, Electricity Sector PPP and Medical Diagnostic Services PPP are all in
the feasibility stage, undergoing detailed analyses aimed at providing the government with
the information required to make a fully-informed decision on whether to pursue one of
various possible modalities of private sector involvement (concession, lease, management
contract, etc.). In addition to these, a few additional PPP projects have recently entered the
conceptual stage which precedes the formal PPP cycle: these include Tibar Bay Investment
Project (an industrial park at Tibar to take advantage of synergies with the future port) and
two projects in the tourism sector (the Dili waterfront redevelopment, and the
development of hot spring sites).
Page 56 of 96
Part 3: 2017 General State Budget Law
VI GOVERNO CONSTITUCIONAL
Lei n.º /2016
de.......de.........
Orçamento Geral do Estado para 2017
O Orçamento Geral do Estado para 2017, doravante designado por OGE, engloba todas as
receitas e despesas do Estado para o ano financeiro de 2017.
O Anexo I à presente lei estabelece o total estimado das receitas do Estado, de janeiro a
dezembro de 2017, provenientes de todas as fontes, petrolíferas e não petrolíferas (fiscais, não
fiscais e provenientes de empréstimos).
O total estimado de receitas é de 1.414,4 milhões de dólares.
O Anexo II à presente lei estabelece todas as dotações orçamentais, sistematizadas da seguinte
forma:
1. 208,850 milhões de dólares para Salários e Vencimentos;
2. 395,799 milhões de dólares para Bens e Serviços;
3. 421,270 milhões de dólares para Transferências Públicas;
4. 11,868 milhões de dólares para Capital Menor;
5. 349,039 milhões de dólares para Capital de Desenvolvimento.
O total das despesas dos serviços sem autonomia administrativa e financeira e dos órgãos
autónomos sem receitas próprias é de 983,197 milhões de dólares.
O total das despesas dos serviços e fundos autónomos em 2017 incluindo as despesas financiadas
por empréstimos é de 376,429 milhões de dólares. O total da estimativa das despesas para a
Autoridade da Região Administrativa Especial de Oe-Cusse Ambeno (ARAEOA) e Zona
Especial de Economia Social de Mercado de Oe-Cusse Ambeno e Ataúro (ZEESM) é de 172,110
milhões de dólares, a serem financiados através de dotação do OGE.
O total da dotação orçamental para o Fundo de Desenvolvimento do Capital Humano é de 27,2
milhões de dólares.

Page 57 of 96
O total estimado das despesas do OGE é de 1.386,826 milhões de dólares.
O total máximo aprovado para financiamento com recurso ao endividamento público, em 2017,
é de 101,826 milhões de dólares.
As receitas não petrolíferas estimadas, incluindo as dos serviços e fundos autónomos, são de
206,2 milhões de dólares.
O total das receitas cobradas pelos serviços e fundos autónomos é de 6,9 milhões de dólares.
Assim, o défice fiscal não petrolífero é de 1.180,584 milhões de dólares, o qual é financiado em
1.078,8 milhões de dólares, a partir do Fundo Petrolífero, dos quais 481,6 milhões de dólares
corresponde ao Rendimento Sustentável Estimado e 597,1 milhões de dólares acima do
Rendimento Sustentável Estimado, e em 101,826 milhões de dólares através do recurso ao
crédito público.
O Governo apresenta ao Parlamento Nacional, ao abrigo da alínea c) do n.º 1 do artigo 97.º e
do n.º 1 do artigo 145.º da Constituição da República, a seguinte proposta de lei:
CAPÍTULO I
Definições e aprovação
Artigo 1.º
Definições
Para os efeitos da presente lei, entende-se por:
a) "Categoria de Despesa" – O agrupamento das despesas sob as cinco categorias seguintes:
i) "Salários e Vencimentos", o montante global que um órgão pode gastar com
Salários e Vencimentos para os titulares e membros dos órgãos de soberania,
funcionários e agentes da Administração Pública e trabalhadores contratados pelos
órgãos e instituições do Estado;
ii) "Bens e Serviços", o montante global que um órgão pode gastar na aquisição de
Bens e Serviços;
iii) “Transferências Públicas”, o montante global que um órgão pode gastar em
subvenções públicas e pagamentos consignados;
iv) "Capital Menor", o montante global que um órgão pode gastar na aquisição de bens
de Capital Menor;
v) “Capital de Desenvolvimento”, o montante global que um órgão pode gastar em
projetos de Capital de Desenvolvimento;
b) "Despesas Compensadas pelas Receitas", as despesas suportadas pelas receitas próprias
cobradas pelos serviços e fundos autónomos, desde que o montante não exceda o valor
total das receitas que deram entrada nas contas relevantes do Tesouro;
c) "Dotação Orçamental", o montante máximo inscrito no OGE a favor de um órgão com
vista à realização de determinada despesa;
d) "Órgão/Órgãos", o termo genérico adotado no OGE para indicar o setor público
administrativo sujeito à disciplina orçamental, que inclui os serviços que não dispõem de

Page 58 of 96
autonomia administrativa e financeira e os órgãos autónomos sem receitas próprias e que,
segundo a classificação orgânica, se pode dividir em títulos, tais como Gabinete do
Presidente da República, Parlamento Nacional, Governo (Gabinete do Primeiro-Ministro,
Ministros de Estado, Presidência do Conselho de Ministros, Ministérios e Secretarias de
Estado), Tribunais, Procuradoria-Geral da República, bem como outras instituições que
constam do Anexo II;
e) “Órgãos Autónomos sem receitas próprias” os que tenham autonomia administrativa e
financeira e não cobrem receitas próprias para cobertura das suas despesas;
f) "Rubricas de Despesa", as rubricas de despesa desagregada dentro de cada Categoria de
Despesa, com base na estrutura de código de contas de despesa mantida pelo Tesouro;
g) “Serviços e Fundos Autónomos” os que satisfaçam, cumulativamente, os seguintes
requisitos:
i) Não tenham natureza e forma de empresa, fundação ou associação pública, mesmo
se submetidos ao regime de qualquer destas por outro diploma;
ii) Tenham autonomia administrativa e financeira;
iii) Disponham de receitas próprias para cobertura das suas despesas, nos termos da
lei.
Artigo 2.º
Aprovação
É aprovado o Orçamento Geral do Estado para o período compreendido entre 1 de janeiro e 31
de dezembro de 2017, nos seguintes termos:
a) O total das receitas por agrupamentos, incluindo as receitas próprias dos serviços e
fundos autónomos, as da Autoridade da Região Administrativa Especial de Oe-Cusse
Ambeno e da Zona Especial de Economia Social de Mercado de Oe-Cusse Ambeno e
Ataúro, e financiamento proveniente de empréstimos, constantes do Anexo I à presente
lei, dela fazendo parte integrante;
b) O total das despesas por agrupamentos, incluindo as verbas destinadas aos serviços e
fundos autónomos, para financiamento da diferença entre as suas receitas próprias e o
total das respetivas despesas constantes do Anexo II à presente lei, dela fazendo parte
integrante;
c) O total das receitas dos serviços e fundos autónomos, incluindo as da Autoridade da
Região Administrativa Especial de Oe-Cusse Ambeno e da Zona Especial de Economia
Social de Mercado de Oe-Cusse Ambeno e Ataúro, e das despesas a serem financiadas a
partir das suas receitas próprias e do Orçamento Geral do Estado, constantes do Anexo
III à presente lei, dela fazendo parte integrante;
d) O total das despesas correspondentes à dotação do Fundo de Desenvolvimento do
Capital Humano, constantes do Anexo IV à presente lei, dela fazendo parte integrante.
Page 59 of 96
CAPÍTULO II
Receitas
Artigo 3.º
Impostos e taxas
1. Durante o ano de 2017, o Governo está autorizado a cobrar os impostos e taxas constantes
da legislação em vigor.
2. Não obstante o disposto no número anterior, em 2017 é suspensa a sujeição de armas e
munições, para a PNTL e F-FDTL, a pagamento de imposto seletivo de consumo, nos termos
do artigo 11.o e anexo II da Lei n.o 8/2008, de 30 de junho, Lei Tributária.
3. É suspensa a sujeição a retenção na fonte de imposto sobre rendimento dos pagamentos a
entidades não residentes sem estabelecimento estável realizados pelo FDCH para o
pagamento de bolsas para prosseguimento de estudos e investigação científica em
estabelecimentos de ensino superior no estrangeiro ou em centros de investigação no
estrangeiro e para pagamentos relacionados com assistência médica no estrangeiro, quando
exista um acordo entre o beneficiário do rendimento e o Ministério da Saúde e a assistência
se enquadre ao abrigo do Decreto-Lei n.o 9/2010 de 21 de Julho, alterado pelo Decreto-lei
n.º 49/2011 de 30 de Novembro, referente à assistência médica no estrangeiro.
Artigo 4.º
Pagamento de impostos sobre importações
O Tesouro fica autorizado a estabelecer e implementar um mecanismo de contabilidade para
o registo e controlo das receitas e despesas, correspondente ao pagamento de impostos sobre
importações efetuadas pelos órgãos ou em seu nome.
CAPÍTULO III
Autorização para transferência do Fundo Petrolífero
Artigo 5.º
Limite autorizado para financiamento do OGE
Nos termos e para os efeitos do disposto no artigo 7.º da Lei n.º 9/2005, de 3 de agosto, Lei
do Fundo Petrolífero, na redação que lhe foi dada pela Lei n.º 12/2011, de 28 de setembro, o
montante das transferências do Fundo Petrolífero para 2017 não excede 1.078,8 milhões de
dólares, sendo a transferência de 481,6 milhões de dólares efetuada após o cumprimento do
disposto no artigo 8.o e a transferência de 597,1 milhões de dólares efetuada após o
cumprimento das alíneas a), b), c) e d) do artigo 9.o da Lei do Fundo Petrolífero.

Page 60 of 96
CAPÍTULO IV
Constituição de dívida pública
Artigo 6.º
Montante máximo de endividamento autorizado
1. Com o objetivo de fazer face às necessidades de financiamento relacionadas com a
construção de infraestruturas estratégicas para o desenvolvimento do País, fica o Governo
autorizado, nos termos do artigo 20.º da Lei n.º 13/2009, de 21 de outubro, sobre
Orçamento e Gestão Financeira, alterada pelas Leis n.o 9/2011, de 17 de agosto, e n.o
3/2013, de 11 de setembro, e do artigo 3.º da Lei n.º 13/2011, de 28 de setembro, sobre o
Regime da Dívida Pública, a recorrer ao endividamento externo concessional, adicional, até
ao montante máximo de 500 milhões de dólares, com um prazo máximo de 40 anos.
2. Sem prejuízo do disposto no número anterior, em 2017, o financiamento proveniente de
empréstimos, já contratados, não excede 101,826 milhões de dólares.
Artigo 7.º
Dotações para todo o Governo
São inscritas em Dotações para Todo o Governo as seguintes dotações, cuja gestão fica a cargo
do Ministério das Finanças:
a) Fundo de Contrapartidas;
b) Auditoria Externa;
c) Reserva de Contingência;
d) Quotas de Membro de Instituições Internacionais;
e) Pensões dos Ex-Titulares e Ex-Membros dos Órgãos de Soberania;
f) Serviços de Postos Integrados na Fronteira;
g) Provisão para g7+;
h) Provisão para Serviços Legais;
i) Provisão para a Autoridade da Região Administrativa Especial de Oe-cusse (ARAEOA) e Zona Especial de Economia Social de Mercado de Oe-cusse Ambeno e Ataúro (ZEESM);
j) Provisão para Garantia de Crédito;
k) Provisão para Eleições Nacionais 2017;
l) Apoio à Conferência Episcopal de Timor-Leste;
m) Programa de Melhoramento de Infraestruturas Rurais;
n) Contribuição do Estado para o Regime Contributivo da Segurança Social;
o) Apoio às Atividades da Comunidade dos Países de Língua Portuguesa;
p) Apoio Financeiro Internacional;

Page 61 of 96
q) Provisão para a Reforma Fiscal, Reforma da Gestão do Desempenho e Reforma do Desempenho Orçamental;
r) Capitalização do Banco Central de Timor-Leste;
s) Provisão para Parcerias Público-Privadas e Empréstimos;
t) Provisão para Oficina de Manutenção de Veículos do Governo;
u) Provisão para Governo Eletrónico ITC;
v) Provisão para Adesão à Associação de Nações do Sudeste Asiático – ASEAN;
w) Provisão para Pagamento de Empréstimos;
x) Provisão para a Campanha de Sensibilização Internacional.
CAPÍTULO V
Serviços e fundos autónomos e fundo especial
Artigo 8.º
Receitas
1. As previsões das receitas domésticas, incluindo as receitas a serem cobradas pelos serviços
e fundos autónomos e ARAEOA e ZEESM constam do Anexo I e III.
2. As receitas próprias dos serviços e fundos autónomos devem ser usadas unicamente para
os fins dos mesmos.
3. As receitas resultantes das transferências a partir do OGE para os serviços e fundos
autónomos e para o Fundo de Desenvolvimento do Capital Humano, constam do Anexo
III e IV.
CAPÍTULO VI
Execução orçamental
Artigo 9.º
Regras complementares de execução do Orçamento Geral do Estado
1. A execução orçamental pelos órgãos e pelos serviços e fundos autónomos deve
obrigatoriamente ser feita com recurso ao Sistema Informático de Gestão Financeira, com
exceção dos procedimentos relativos à segurança nacional, à Região Administrativa
Especial de Oe-Cusse Ambeno e à Zona Especial de Economia Social de Mercado de Oe-
Cusse Ambeno e Ataúro.
2. As verbas atribuídas aos órgãos e serviços sem autonomia administrativa e financeira que
não forem gastas até ao final do ano financeiro devem ser repostas na Conta do Tesouro.
3. A contratação pública por ajuste direto apenas é permitida a cada órgão até 10% do total
das respetivas dotações orçamentais para 2017, sem prejuízo da observância das normas
legais sobre a sua admissibilidade.
4. O disposto no número anterior não se aplica aos aprovisionamentos no âmbito das
Dotações para Todo o Governo, aos relativos a questões de segurança nacional,

Page 62 of 96
medicamentos, insumos médicos e equipamentos médico-hospitalares, aos do
Planeamento de Desenvolvimento Integrado Municipal e aos da Região Administrativa
Especial de Oe-Cusse Ambeno e Zona Especial de Economia Social de Mercado de Oe-
Cusse Ambeno e Ataúro.
5. As alterações orçamentais no âmbito das Dotações de Todo o Governo seguem o disposto
no artigo 38.o da Lei n.o 13/2009, de 21 de outubro, sobre Orçamento e Gestão Financeira
, alterada pelas Leis n.o 9/2011, de 17 de agosto e n.o 3/2013, de 11 de setembro, com
exceção da Reserva de Contingência.
6. O Parlamento Nacional realiza um debate trimestral, sobre a execução orçamental de cada
ministério, secretaria de Estado, órgão autónomo sem receitas próprias e serviço e fundo
autónomo, com a presença dos respetivos membros do Governo e dirigentes máximos.
7. Quando o saldo da conta do Tesouro for inferior a 200 milhões de dólares, o Governo
pode recorrer à transferência do Fundo Petrolífero acima do Rendimento Sustentável
Estimado, informando previamente o Parlamento Nacional.
8. Os pedidos de uso da reserva de contingência devem ser devidamente justificados nos
termos do n.o 3 do artigo 7.o e do artigo 37.o da Lei n.o 13/2009, de 21 de outubro, sobre
Orçamento e Gestão Financeira, alterada pelas Leis n.o 9/2011, de 17 de agosto e n.o
3/2013, de 11 de setembro, e devem conter a descrição detalhada das atividades a realizar.
9. No âmbito dos contratos celebrados cuja eficácia se encontre suspensa, o Governo fica
autorizado a suspender a respetiva garantia de execução até se encontrarem reunidas as
condições para a plena eficácia dos referidos contratos.
10. As regras de execução do Orçamento Geral do Estado são definidas no diploma do Governo
sobre a execução orçamental.
11. Em 2017, o Fundo das Infraestruturas fica autorizado a gastar o saldo devidamente
programado, após o final do ano financeiro.
Artigo 10.º
Compromissos plurianuais
1. No ano financeiro de 2017, fica o Governo autorizado a assinar contratos públicos que
constituem compromissos plurianuais.
2. Para efeitos da presente lei, consideram-se compromissos plurianuais os compromissos que
constituem obrigação de efetuar pagamentos em mais do que um ano financeiro ou em anos
financeiros distintos do ano em que o compromisso é assumido.
CAPÍTULO VII
Disposições finais
Artigo 11.º
Financiamento através de doadores independentes

Page 63 of 96
1. Cada Órgão só pode estabelecer acordos com doadores independentes para o fornecimento
de recursos adicionais ou complementares ao financiamento contido nas afetações
orçamentais na presente lei, mediante parecer prévio obrigatório do ministro responsável
pela área das Finanças quando os mesmos tenham impacto no Orçamento Geral do
Estado.
2. A gestão do financiamento previsto no número anterior deve ser feita de acordo com as
diretivas emitidas pelo Ministério das Finanças e com os requisitos dos doadores.
Artigo 12.º
Responsabilidade
1. A assinatura de contratos sem cabimento orçamental gera responsabilidade política,
financeira, civil e criminal, nos termos do artigo 46.º da Lei n.º 13/2009, de 21 de outubro,
sobre Orçamento e Gestão Financeira, alterada pelas Leis n.o 9/2011, de 17 de agosto, e n.o
3/2013, de 11 de setembro.
2. Para efeitos de efetivação da responsabilidade financeira prevista no número anterior,
considera-se que o titular do cargo político procede, com tal conduta, a um pagamento
indevido, sujeito a condenação em reposição da quantia correspondente, nos termos dos
artigos 44.º e seguintes da Lei n.º 9/2011, de 17 de agosto, que aprova a Orgânica da
Câmara de Contas do Tribunal Superior Administrativo, Fiscal e de Contas, na redação que
lhe foi dada pela Lei n.º 3/2013, de 11 de setembro.
3. Os responsáveis dos órgãos autónomos sem receitas próprias e serviços e fundos
autónomos respondem política, financeira, civil, e criminalmente pelos atos e omissões que
pratiquem no âmbito do exercício das suas funções de execução orçamental, incluindo
reporte e reconciliação, nos termos da Constituição e demais legislação aplicável, a qual
tipifica as infrações criminais e financeiras, bem como as respetivas sanções, conforme
sejam ou não cometidas com dolo.
Artigo 13.º
Entrada em vigor
A presente lei entra em vigor no dia 1 de janeiro de 2017.
Aprovada aos 5 de Outubro de 2016
O Primeiro-Ministro
_____________________
Dr. Rui Maria de Araújo

Page 64 of 96
A Ministra das Finanças
________________________
Santina JRF Viegas Cardoso

Page 65 of 96
ANEXO I Estimativa de receitas a serem cobradas e financiamento das despesas do
Orçamento Geral do Estado para 2017 (milhares de dólares norte-americanos) * Tabela I - Estimativa de receitas
1 Receitas Totais
1,414.4
1.1 Receitas Petrolíferas 1,106.3
1.1.1 Imposto sobre Lucros Petrolíferos 137.5
1.1.2 Impostos do Mar de Timor (incluindo Kitan) 30.2
1.1.3 Imposto sobre o Rendimento 23.7
1.1.4 Imposto sobre Lucros Adicionais 71.1
1.1.5 Outros Impostos e Taxas Petrolíferas 0.9
1.1.6 Juros do Fundo Petrolífero 842.9
1.2 Receitas Não Petrolíferas 199.3
1.2.1 Impostos Diretos 65.0
1.2.2 Impostos Indiretos 80.2
1.2.3 Outras Receitas e Taxas 0.5
1.2.4 Taxas e Encargos 50.0
1.2.5 Juros da Conta do Tesouro 0.0
1.2.6 Imposto da ZEESM 3.6
1.3 Doações -
1.4 Receitas Próprias dos Serviços e Fundos Autónomos 6.9
1.5 Empréstimos 101.8
*Valores arredondados
Tabela II – Financiamento das Despesas
Receitas não petrolíferas incluindo receitas próprias dos serviços e fundos autónomos
206.2
Transferências do Fundo Petrolífero 1,078.8
Empréstimos 101.8
Total 1,386.8
*Valores arredondados

Page 66 of 96
ANEXO II Dotações Orçamentais para 2017 (milhares de dólares norte-americanos)
Salários e Vencimentos
Bens e Serviços
Transferências Publicas
Capital Menor
Capital Desenvolvi
mento
Total das Despesas
Total de Despesas do OGE Incluindo Empréstimos 208,850 395,799 421,270 11,868 349,039 1,386,826
Total de Despesas do OGE Excluindo Empréstimos 208,850 395,799 421,270 11,868 247,213 1,285,000
Total das Despesas dos Serviços sem Autonomia Administrativa e Financeira, dos Serviços e Fundos Autónomos e dos Órgãos sem Receitas Próprias
208,850 368,599 421,270 11,868 349,039 1,359,626
Total das Despesas dos Serviços sem Autonomia Administrativa e Financeira e dos Órgãos Autónomos sem Receitas Próprias
190,926 339,300 421,270 7,088 24,613 983,197
Total Despesas dos Serviços sem Autonomia Administrativa e Financeira
160,717 296,760 406,623 3,109 24,507 891,715
Total Despesas dos Serviços e Fundos Autónomos (incluindo as despesas financiadas por empréstimos)
17,924 29,299 - 4,780 324,426 376,429
Total Despesas dos Órgãos com Autonomia Administrativa e Financeira sem Receitas Próprias
30,209 42,540 14,647 3,979 106 91,482
Total Fundo de Desenvolvemento do Capital Humano - 27,200 - - - 27,200
Fundos de Desemvolvimento do Capital Humano - Nova Dotação
- 27,200 - - - 27,200
Fundos de Desemvolvimento do Capital Humano - Saldo Transitado
- - - - - -
Presidência da República 1,073 5,000 - - - 6,074
Gabinete da Presidente da República - 250 - - - 250
Casa Civil 1,073 4,098 - - - 5,172
Casa Militar - 652 - - - 652
Parlamento Nacional 5,116 7,934 930 3,620 96 17,696
Parlamento Nacional 3,347 2,844 - 2,925 - 9,115
Gabinete do Presidente do Parlamento 74 825 - - - 898
Bancadas Parlamentares - - 930 - - 930
Gabinete do Secretário Geral do Parlamento - 132 - - - 132
Comissão A - 30 - - - 30
Comissão B - 30 - - - 30
Comissão C - 30 - - - 30

Page 67 of 96
Comissão D - 30 - - - 30
Comissão E - 30 - - - 30
Comissão F - 30 - - - 30
Comissão G - 30 - - - 30
Conselho de Fiscalização Sistema Nacional Inteligência de Timor-Leste - 100 - - - 100
Conselho Consultivo do Fundo Petrolífeiro - 445 - 116 - 561
Grupo Mulheres Parlamentar de Timor Leste - 112 - - - 112
Direção de Administração 1,696 2,794 - 230 96 4,815
Direção de Apoio Parlamentar - 235 - 83 - 318
Direção de Pesquisa e Informação Técnica - 115 - 142 - 257
Divisão de Tecnologia de Informação Comunicaçção - 94 - 125 - 219
Divisão de Relações Internacionais,Protocolo e Segurança - 29 - - - 29
Primeiro-Ministro 104 2,750 4,400 - - 7,254
Gabinete de Apoio ao Primeiro-Ministro 104 2,334 - - - 2,438
Gabinete de Apoio à Sociedade Civil - 224 4,400 - - 4,624
Apoio à Residência Oficial do Primeiro-Ministro - 66 - - - 66
Unidade do Governo Eletrónico (e-government) - 126 - - - 126
Ministro de Estado e da Presidência do Conselho dos Ministros Incluindo SECM, SEAP e SECS
1,145 4,145 3,562 - - 8,852
Ministro de Estado e da Presidência do Conselho dos Ministros Excluindo SECM, SEAP e SECS
639 2,833 - 3,472
Gabinete do Ministro de Estado e da Presidência do Conselho de Ministros
106 138 - - - 244
Direção Nacional de Administração e Finanças 99 290 - - - 389
Direção Nacional dos Servicos de Tradução 84 103 - - - 187
Unidade de Apoio Jurídico 76 288 - - - 364
Centro de Formação e Tecnica de Comunicação 13 56 - - - 69
Gabinete do Diretor-Geral 27 6 - - - 33
Gabinete do Porta-Voz do Governo - 251 - - - 251
Comissão para a Reforma Legislativa e do Setor Justiça - 749 - - - 749
Direção Nacional de Recursos Humanos 64 24 - - - 88
Direção Nacional de Aprovisionamento 75 2 - - - 77
Direção Nacional de Logistica e Patrimonion 83 918 - - - 1,001
Direção Nacional de Informação e Tecnologia 13 8 - - - 21
Secretaria de Estado do Conselhos de Ministros 177 699 - - - 876

Page 68 of 96
Gabinete do Secretário de Estado 76 218 - - - 293
Gráfica Nacional 102 482 - - - 583
Secretaria de Estado para os Assuntos Parlamentares 86 60 - - - 146
Gabinete da Secretária de Estado 86 60 - - - 146
Secretaria de Estado da Comunicação Social 243 553 3,562 - - 4,358
Gabinete do Secretário de Estado 64 303 - - - 367
Direção de Disseminação de Informação 117 152 - - - 269
Centro de Rádio Communitárias 62 98 240 - - 400
Apoio à RTTL, E.P. - - 3,322 - - 3,322
Ministro do Estado, Coordenador dos Assuntos Sociais 273 567 540 43 - 1,423
Gabinete do Ministro de Estado, Coordenador dos Assuntos Sociais 222 412 540 - - 1,174
Comissão Nacional dos Direitos das Crianças 52 155 - 43 - 249
Secretaria de Estado para o Apoio e Promoção Sócio-Económica da Mulher
321 1,053 146 - - 1,520
Gabinete da Secretária de Estado 68 224 - - - 292
Direção-Geral 46 76 - - - 122
Direção Nacional da Administração, Logística e Finanças 100 658 - - - 758
Direção Nacional de Abordagem Integrada do Genéro e da capacitação da Mulher
89 91 146 - - 326
Gabinete de Inspeção e Auditoria 18 5 - - - 23
Secretaria de Estado da Juventude e Desportos 569 1,200 4,750 - - 6,519
Gabinete do Secretário de Estado 71 200 1,102 - - 1,373
Direção-Geral 69 - - - - 69
Direção Nacional de Administração e Finanças 132 833 - - - 965
Direção Nacional da Juventude 51 20 895 - - 966
Direção Nacional do Desporto 69 14 2,290 - - 2,373
Direção Nacional de Estudos e Planeamento 38 67 194 - - 299
Direção Nacional de Comunicação e Novas Tecnologias 57 34 113 - - 204
Direção Nacional de Arte Juvenil 50 7 156 - - 213
Gabinete de Inspeção e Auditoria Interna 32 25 - - - 57
Ministro de Estado, Coordenador dos Assuntos Económicos 78 1,739 - 10 - 1,827
Gabinete do Ministro de Estado, Coordenador dos Assuntos Económicos
78 1,739 - 10 - 1,827
Secretaria de Estado para a Politica da Formação Profissional e Emprego
1,535 2,558 4,116 - 42 8,251

Page 69 of 96
Gabinete do Secretário de Estado 97 265 - - - 361
Inspeção Geral do Trabalho 309 198 - - - 507
Gabinete Direção Geral de Gestão e Planeamento 25 70 - - - 95
Direção Nacional de Administração e Finanças 100 651 - - - 751
Direção Nacional do Aprovisionamento 30 35 - - 42 107
Direção Nacional de Informação do Mercado de Trabalho 44 39 - - - 83
Gabinete de Inspeção e Auditoria 27 35 - - - 62
Direção Nacional da Política de Formação Profissional 84 71 500 - - 655
Direção Nacional da Política de Emprego 109 414 3,523 - - 4,046
Direção Nacional das Relações de Trabalho 82 88 3 - - 173
Secretaria de Apoio ao Conselho Nacional do Trabalho e ao Conselho de Arbitragem do Trabalho
41 35 - - - 76
Gabinete de Apoio Jurídico 14 56 - - - 70
Fundo de Emprego e Formação Profissional 10 29 60 - - 99
Adido do Trabalho na Coreia do Sul 204 85 - - - 289
Adido do Trabalho na Australia 108 107 - - - 215
Direção Nacional de Recursos Humanos 44 49 30 - - 122
Direção Nacional de Planeamento Monitorização e Avaliação 42 35 - - - 77
Direção Municipal de Baucau 13 24 - - - 37
Direção Municipal de Bobonaro 24 22 - - - 46
Direção Municipal de Manufahi 15 21 - - - 36
Direção Municipal de Covalima 15 20 - - - 35
Direção Municipal de Viqueque 11 17 - - - 28
Direção Municipal de Aileu 11 22 - - - 33
Direção Municipal de Ainaro 12 18 - - - 30
Direção Municipal de Ermera 13 19 - - - 32
Direção Municipal de Lautém 11 15 - - - 26
Direção Municipal de Liquiçá 10 16 - - - 26
Direção Municipal de Manatuto 11 18 - - - 29
Direção-Geral da Política de Formação Profissional e Emprego 20 88 - - - 108
Ministério Cordenador dos Assuntos da Administração do Estado e da Justiça
142 450 - - - 592
Gabinete do Ministro de Estado, Coordenador dos Assuntos da Administração do Estado e da Justiça
142 450 - - - 592
Secretario de Estado do Fortalecimento Institucional 154 723 - - - 877

Page 70 of 96
Gabinete do Secretário de Estado 154 723 - - - 877
Ministério da Educação 60,010 23,983 2,082 - - 86,074
Gabinete do Ministro 97 48 - - - 145
Gabinete do Vice-Ministro I 67 22 - - - 89
Gabinete do Vice-Ministro II 67 22 - - - 89
Instituto Nacional Ciências e Tecnologia 77 95 - - - 172
Gabinete do Inspetor-Geral 113 58 - - - 171
Gabinete Jurídico 47 25 - - - 72
Direção-Geral de Administração e Finanças 27 15 - - - 42
Direção-Geral do Ensino Superior, das Ciência e Tecnologia 89 15 - - - 104
Direção Nacional de Finanças, Adminstração e Logistica 335 7,117 1,082 - - 8,533
Direção Nacional dos Recursos Humanos 14,405 192 - - - 14,597
Direção Nacional de Aprovisionamento 54 74 - - - 129
Direção Nacional do Ensino Superior Universitário 69 106 350 - - 525
Direção Nacional do Ensino Superior Técnico 65 854 - - - 919
Gabinete de Coordenação do Apoio ao Estudante 621 381 - - - 1,002
Direção Nacioanl de Ação Social Escolar 76 386 11 - - 473
Serviço da Unidade do Currículo Nacional 135 3,134 - - - 3,269
Direção Nacional de Educação Pré-Escolar 1,330 60 - - - 1,391
Direção Nacional do Ensino Básico 34,992 2,620 78 - - 37,691
Direção Nacional do Ensino Secundário Geral 4,809 446 19 - - 5,274
Direção Nacional do Ensino Secundário Técnico-Vocacional 1,326 1,351 543 - - 3,220
Direção Nacional do Ensino Recorrente 176 520 - - - 696
Instituto Nacional de Formação de Docentes e Professionais da Educação (INFORDOPE)
534 3,950 - - - 4,485
Direção Geral Pré-Escolar e Ensino Básico 65 15 - - - 80
Direção Geral Ensino Secundário 65 19 - - - 84
Direção Nacional da Media Educativa e Bibliotecas 94 99 - - - 193
Serviços do Centro de Impressão 44 835 - - - 879
Direção-Geral da Politica, Planeamento e Parcerias 41 17 - - - 58
Direção Nacional de Infraestruturas Educativas 34 1,366 - - - 1,400
Direção Nacional de Política, Planeamento, Monitorização e Avaliação 94 114 - - - 208
Direção Nacional das Parcerias e Cooperação 63 24 - - - 87
Ministério da Agricultura e Pescas 3,348 9,938 470 643 1,794 16,192

Page 71 of 96
Gabinete do Ministro 62 64 - - - 126
Gabinete do Vice-Ministro 81 54 - - - 135
Direção Geral de Floresta, Café e Plantas Industriais 19 29 - - - 48
Direção Nacional da Conservação da Natureza 169 271 5 - - 445
Direção Geral de Agricultura 20 30 - - - 50
Direção Nacional de Veterinaria 88 355 - - - 443
Secretaria Geral 40 27 - - - 67
Direção Nacional de Recursos Humanos 74 398 - - - 472
Direção Nacional de Aprovisionamento 51 36 - - - 87
Direccão Nacional de Agro-Comercio 78 231 - - - 309
Direccão Nacional de Administração e Financas 198 721 - 60 - 979
Gabinete de Inspecão, Fiscalizacão e Auditoria 45 30 - - - 75
Direção Nacional de Pesquisa, Estatística e Informação Geográfica 301 528 - - - 829
Direção Nacional de Quarentena e Biosegurança 258 256 - - - 514
Direção Nacional de Formação Técnica Agrícola 481 434 - - - 914
Direção Nacional de Política, Planeamento, Monitorização e Assuntos Jurídicos
110 218 - - - 328
Direção Nacional de Agricultura, Horticultura e Extensão 271 2,414 365 561 - 3,611
Direção Nacional de Aquicultura 113 708 - - - 821
Direção Nacional de Segurança Alimentar e Cooperação 66 159 - 15 - 240
Direção Nacional de Florestas e Gestão de Bacias Hidrográficas 115 770 - 6 - 891
Direção Nacional de Irrigação e Gestão Utilização de Àgua 162 285 - - 1,794 2,241
Direção Nacional de Café e Plantas Industriais 102 817 - - - 919
Direção Nacional de Pecuaria 152 708 100 - - 960
Diretor-Geral de Pecuária e Veterinária 18 29 - - - 47
Diretor-Geral de Pescas 12 27 - - - 39
Direção Nacional da Inspeccao das Pescas 81 101 - - - 182
Direção Nacional das Pescas e Gestao de Recursos Pesqueiros 181 238 - - - 419
Ministério da Administração Estatal 4,064 6,299 1,200 214 - 11,777
Gabinete do Ministro - 210 - - - 210
Unidade de Aprovisionamento Descentralizado - 23 - - - 23
Unidade de Apoio Jurídico e Assessoria Técnica - 16 - - - 16
Unidade de Tecnologia da Informação e da Comunicação - 18 - 60 - 78
Gabinete do Coordenador das Relações com a Autoridade da RAEOA - 19 - - - 19

Page 72 of 96
Gabinete do Vice-Ministro - 621 - - - 621
Gabinete do Secretário de Estado da Administração Estatal - 70 - - - 70
Direção Geral da Decentralização Administrativa - 25 - - - 25
Direção Nacional de Finanças Municipais - 17 - - - 17
Direção Nacional para a Modernização Administrativa - 17 - - - 17
Inspeção-Geral da Administração Estatal - 30 - - - 30
Direção-Geral de Serviços Corporativos - 60 - - - 60
Secretariado Técnico do PNDS - 800 400 - - 1,200
Direção Nacional de Finanças e Património 4,064 3,418 - 154 - 7,636
Direção Nacional para o Desenvolvimento e Avaliação de Políticas Públicas
- 26 - - - 26
Direção Nacional de Recursos Humanos - 18 - - - 18
Direção Nacional de Protocolo e Comunicação Social - 22 - - - 22
Arquivo Nacional - 125 - - - 125
Secretariado Técnico da Administração Eleitoral - 200 - - - 200
Direção-Geral para a Organização Urbana - 52 - - - 52
Direção Nacional para a Higiene e Ordem Pública - 75 800 - - 875
Direção Nacional de Toponímia - 326 - - - 326
Direção Nacional para a Mobilidade Urbana - 27 - - - 27
Direção Nacional de Apoio a Administração de Sucos - 28 - - - 28
Direção Nacional da Administração Local - 29 - - - 29
Secretariado de Apoio à Instalação dos Municípios - 27 - - - 27
Ministério dos Negócios Estrangeiros e Cooperação 13,186 9,000 - - - 22,186
Gabinete do Ministro - 200 - - - 200
Gabinete do Vice-Ministro - 51 - - - 51
Direção-Geral para os Assuntos da ASEAN - 5 - - - 5
Secretaria Geral 13,186 2,053 - - - 15,239
Direção-Geral para os Assuntos Consulares e Protocolares - 3 - - - 3
Direção-Geral para os Assunto Bilaterais - 108 - - - 108
Direção-Geral para os Assunto Multilaterais e Regionais - 5 - - - 5
Missão Permanente em Nova Iorque - 432 - - - 432
Embaixada - Lisboa - 333 - - - 333
Embaixada - Jacarta - 240 - - - 240
Consulado - Geral de Dempasar - 131 - - - 131

Page 73 of 96
Consulado - Kupang - 49 - - - 49
Embaixada - Washington - 442 - - - 442
Embaixada - Canberra - 259 - - - 259
Consulado - Darwin - 190 - - - 190
Embaixada - Kuala Lumpur - 225 - - - 225
Embaixada - Bruxelas - 336 - - - 336
Embaixada - Banguecoque - 122 - - - 122
Embaixada - Tóquio - 268 - - - 268
Embaixada - Pequim - 233 - - - 233
Embaixada - Maputo - 195 - - - 195
Embaixada - Havana - 158 - - - 158
Embaixada - Manila - 127 - - - 127
Missão Permanente em Genebra - 318 - - - 318
Embaixada - Santa Sé - 159 - - - 159
Embaixada - Brasilia - 197 - - - 197
Embaixada - Seul - 169 - - - 169
Embaixada - Luanda - 212 - - - 212
Embaixada Singapura - 444 - - - 444
Embaixada - Hanói - 158 - - - 158
Agente de Consular em Atambua - 53 - - - 53
Embaixada - Londres - 371 - - - 371
Embaixada - Wellington - 224 - - - 224
Embaixada - Vienciana - 132 - - - 132
Embaixada – Naypyidaw - 151 - - - 151
Embaixada – Phnom Penh - 108 - - - 108
Embaixada – Bandar Seri Begawan - 139 - - - 139
Ministério das Finanças 4,533 13,496 - - - 18,029
Gabinete Executivo 145 - - - - 145
Direção-Geral dos Serviços Corporativos 1,161 13,496 - - - 14,657
Direção-Geral do Financas Estado 507 - - - - 507
Direção-Geral do Tesouro 341 - - - - 341
Direção-Geral de Impostos 592 - - - - 592
Direção-Geral das Alfândegas 870 - - - - 870
Direção-Geral de Estatística 578 - - - - 578

Page 74 of 96
Unidades Orgânicas do Ministério 339 - - - - 339
Dotações para todo o Governo - 55,763 207,834 30 - 263,628
Fundos de Contrapartidas - 5,000 - - - 5,000
Auditoria Externa - 1,579 - - - 1,579
Reserva de Contingência - 8,564 - - - 8,564
Quotas de Membro de Instituições Internacionais - 2,500 - - - 2,500
Pensões aos Ex-Titulares e Ex-Membros dos Órgãos de Soberania - - 4,000 - - 4,000
Serviços de Postos Integrados na Fronteira - 1,300 - - - 1,300
Provisão para g7+ - - 2,250 - - 2,250
Provisão para Serviços Legais - 12,250 - - - 12,250
Provisão para Autoridade Região Administrativa Especial de Oe-cusse (ARAEOA) e Zona Especial de Economia Social e de Mercado de Oe-cusse Ambeno e Ataúro (ZEESM)
- - 172,110 - - 172,110
Provisão para Garantia Credito - - 4,000 - - 4,000
Provisão para Eleições Nacional 2017 - 14,250 - - - 14,250
Provisão para o Apoio Conferecia Epescopal - - 6,474 - - 6,474
Provisão para Melhoramento Infraestrutura rural 2017 - 750 - - - 750
Contribuição do Estado para o Regime Contributivo da Segurança Social
- - 11,000 - - 11,000
Apoio às Reuniões da Comunidade dos Países de Língua Portuguesa - 500 - - - 500
Apoio Financeiro Internacional - - 1,500 - - 1,500
Provisão para a Reforma Fiscal, Reforma da Gestão do Desempenho e Reforma do Desempenho Orçamental
- 3,300 - - - 3,300
Provisão para Capitalização do Banco Central de Timor-Leste - - 5,000 - - 5,000
Provisão para Parcerias Público-Privadas e Empréstimos - 2,000 - - - 2,000
Provisão para Oficina de Manutenção de Veículos do Governo - 970 - 30 - 1,000
Provisão para Governo Electrónico ITC - 800 - - - 800
Provisão para Adesão à Associação de Nações do Sudeste Asiático - ASEAN
- 500 - - - 500
Provisão para pagamento de Empréstimos - - 1,500 - - 1,500
Provisão para a Campanha de Sensibilização Internacional - 1,500 - - - 1,500
Ministério da Justiça 4,367 13,910 - 2 475 18,754
Gabinete do Ministro 80 40 - - - 120
Gabinete do Secretário de Estado de Terras e Propriedades 65 38 - - - 103
Direção Geral 110 80 - - - 190

Page 75 of 96
Gabinete de Inspeção e Auditoria 112 53 - 2 - 167
Direção Nacional de Administração e Financas 256 8,975 - - - 9,231
Direção Nacional de Assessoria Jurídica e Legislação 125 35 - - - 160
Direção Nacional dos Direitos Humanos da Cidadania 131 30 - - - 161
Direção Nacional dos Registos e Notariado 799 2,972 - - - 3,771
Direção Nacional dos Serviços Prisionais e da Reinserção Social 847 1,174 - - 175 2,196
Centro de Formação Jurídica 181 44 - - - 225
Defensoria Pública 917 93 - - 300 1,310
Direção Nacional de Terras, Propriedades e Serviços Cadastrais 744 376 - - - 1,119
Ministério da Saúde 23,683 11,293 8,237 501 - 43,715
Gabinete da Ministra 93 187 - - - 280
Gabinete da Vice-Ministra 76 155 - - - 230
Inspeção Geral da Saúde 118 106 - - - 224
Direção-Geral das Prestações em Saúde 46 104 - - - 149
Direção Nacional dos Recursos Humanos 18,042 2,111 5,780 - - 25,933
Direção Nacional do Planeamento e Gestão Financeira 168 518 - 13 - 699
Direção Nacional de Saúde Pública 420 3,232 75 - - 3,727
Direção Nacional de Política e Cooperação 178 172 - 7 - 357
Direção Nacional dos Serviços Hospitalares e Emergência 340 702 2,382 - - 3,425
Hospital de Referência de Baucau 1,331 1,000 - - - 2,331
Hospital de Referência de Maliana 757 588 - - - 1,345
Hospital de Referência de Maubisse 706 557 - - - 1,263
Hospital de Referência de Suai 692 600 - - - 1,292
Gabinete de Garantia da Qualidade na Saúde 92 76 - - - 168
Direção Nacional da Administração, Logística e Património 290 733 - 482 - 1,504
Direção Nacional de Aprovisionamento 95 140 - - - 235
Direção Nacional de Farmácia e Medicamentos 182 164 - - - 346
Gabinete do Diretor-Geral dos Serviços Corporativos 58 149 - - - 207
Ministério da Solidariedade Social 1,768 6,464 153,337 - 777 162,346
Gabinete da Ministra 82 174 50 - - 306
Gabinete do Vice-Ministro 67 79 - - - 146
Direção Nacional do Regime Contributivo de Segurança Social 61 381 4,140 - - 4,582
Direção Nacional do Regime Não Contributivo de Segurança Social 98 341 34,666 - - 35,105
Inspeção e Auditoria 35 101 - - - 136

Page 76 of 96
Direção Geral dos Servicos Corporativos 21 35 - - - 56
Unidade de Apoio Tecnico 35 68 - - - 103
Unidade Tecnologia de Infromacao 18 219 - - - 237
Unidade de Comunicação Social e Protocolo 35 72 - - - 107
Direção Nacional do Plano, Finanças, Aprovisionamento e Logística 122 908 - - - 1,030
Direção Nacional de Administração e Recursos Humanos 658 778 - - - 1,436
Direção Nacional dos Assuntos dos Combatentes da Libertação Nacional
143 1,696 101,998 - 777 104,614
Direção Nacional de Assistência Social 142 280 9,900 - - 10,322
Direção Nacional do Desenvolvimento Social 106 418 2,000 - - 2,524
Direção Nacional de Gestão de Riscos de Desastre 96 847 583 - - 1,526
Direção Geral de Protecao Social e dos Assuntus dos Combatentes da Libetração Nacional
49 68 - - - 117
Ministério do Comércio, Indústria e de Ambiente 1,898 5,955 - - - 7,853
Gabinete do Ministro e Vice Ministro 196 623 - - - 819
Gabinete Jurídico e Auditoria 118 280 - - - 398
Direção-Geral de Administração e Finanças 366 3,420 - - - 3,786
Direção Geral do Comércio 486 702 - - - 1,188
Direção Geral da Industria e Cooperativas 336 524 - - - 860
Direção Geral do Ambiente 396 406 - - - 802
Ministério do Turismo, Arte e Cultura 1,228 4,744 - 201 170 6,343
Gabinete do Ministro 119 409 - - - 528
Gabinete de Inspeção e Auditoria Interna 43 34 - - - 77
Gabinete da Secretaria de Estado da Arte e Cultura 88 110 - - - 198
Direção Geral do Turismo 31 128 - - - 159
Direção Regional de Turismo I (Município de Díli) 13 - - - - 13
Direção Regional de Turismo II (Município de Baucau) 16 - - - - 16
Direção Regional de Turismo III (Município de Ainaro) 18 - - - - 18
Direção Regional de Turismo IV (Município de Ermera) 17 - - - - 17
Direção-Geral das Artes e da Cultura 118 250 - - - 368
Inspeção Geral de Jogos 81 87 - - - 168
Direção Nacional de Bibliotecas 68 79 - - - 147
Direção Nacional do Patriomónio Cultural 71 178 - - - 249
Direção Nacional de Artes, Cultura e Indústrias Criativas Culturais 58 100 - - - 158
Direção Nacional de Marketing do Turismo e Relações Internacionais 59 123 - - - 182

Page 77 of 96
Direção Nacional do Plano e Desenvolvimento Turístico 49 1,241 - - 170 1,460
Direção Nacional de Empreendimentos, Atividades e Produtos Turísticos
49 573 - - - 622
Direção Nacional dos Museus 53 130 - - - 183
Academia de Artes, Cultura e Indústrias Criativas Culturais - 153 - - - 153
Gabinete da Direção-Geral da Administração e Finanças 33 187 - - - 220
Direção Nacional de Administracção dos Recurso Humanos 51 66 - - - 117
Direção Nacional de Gestão Financeira 47 66 - - - 113
Direção Nacional de Aprovisionamento e Logística 64 638 - 201 - 903
Direção Nacional de Pesquisa e Desenvolvimento 55 57 - - - 112
Centro de Convenções de Díli 27 135 - - - 162
Ministério das Obras Públicas, Transportes e Telecomunições 6,018 77,546 - 1,000 6,448 91,012
Gabinete do Ministro das Obras Públicas 104 505 - - - 609
Gabinete do Vice-Ministro 132 340 - - - 472
Secretaria Geral 514 1,912 - - 6,448 8,874
Direção Geral das Obras Públicas 775 5,536 - - - 6,311
Direção Geral da Eletricidade 2,602 56,397 - 1,000 - 59,999
Direção Geral de Água, Saneamento e Urbanização 936 11,374 - - - 12,310
Direção Geral dos Transportes e Comunicações 956 1,482 - - - 2,438
Ministério do Petrólio e Recursos Minerais 268 1,230 15,950 - - 17,448
Gabinete do Ministro 54 301 - - - 355
Direção Geral 32 8 - - - 40
Gabinete de Inspeção e Auditoria 18 7 - - - 25
Gabinete de Apoio Jurídico 18 7 - - - 25
Direção Nacional de Administração e Finanças 77 628 15,950 - - 16,655
Secretariado TL- EITI 5 268 - - - 273
Direção Nacional Recursos Humanos 39 8 - - - 46
Diração Nacional Planeamento Monitorização e Avaliação 26 3 - - - 28
Ministério de Defesa Incluindo F-FDTL 9,843 15,599 - 25,442
Ministério de Defesa Excluindo F-FDTL 1,185 4,989 - 6,174
Gabinete do Ministro 43 953 - - - 996
Direção-Geral 22 195 - - - 217
Gabinete de Inspeção e Auditoria 37 55 - - - 92
Direção Nacional de Administração e Finanças 92 144 - - - 236

Page 78 of 96
Direção Nacional de Planeamento, Estratégico e Política Internacional da Defesa
842 1,295 - - - 2,137
Direção Nacional de Aprovisionamento 51 1,924 - - - 1,975
Direção Nacional de Gestão do Património 58 321 - - - 379
Direção Nacional de Recursos Humanos 39 102 - - - 141
FALINTIL-Forças de Defesa de Timor-Leste 8,658 10,610 - - - 19,268
FALINTIL-Forças de Defesa de Timor-Leste - 8,865 - - - 8,865
Quartel Geral das F-FDTL 8,658 1,745 - - - 10,403
Ministério do Interior Incluindo PNTL 21,131 18,606 - 465 13 40,215
Ministério do Interior Excluindo PNTL 5,540 4,688 - 465 10,693
Gabinete do Ministro 79 453 - - - 532
Direção Geral dos Serviços Corporativos 75 65 - - - 140
Gabinete de Inspeção e Auditoria 73 23 - - - 96
Direção Nacional de Administração e Finanças 122 436 - - - 558
Direção Nacional de Logística e Gestão do Património 56 53 - - - 109
Direção Nacional de Proteção Civil 1,221 468 - - - 1,689
Direção Nacional de Segurança do Património Público 2,423 1,908 - - - 4,331
Direção Nacional de Prevenção de Conflitos Comunitários 127 197 - - - 324
Direção Nacional de Aprovisionamento 87 45 - - - 132
Serviços de Migração 1,093 852 - 265 - 2,210
Direção Geral dos Serviços Operacionais 33 24 - - - 57
Gabinete de Assessoria 37 24 - - - 61
Autoridade Nacional Segurança Rodoviária 51 123 - 200 - 374
Direção Nacional de Recursos Humanos 63 19 - - - 82
Polícia Nacional de Timor-Leste 15,591 13,918 - - 13 29,522
Direção Nacional de Administração e Finanças 15,591 7,399 - - 13 23,004
Unidade Especial da Polícia - 2,262 - - - 2,262
Unidade de Patrulhamento das Frontreiras - 1,149 - - - 1,149
Unidade Marítima - 916 - - - 916
Comando Nacional de Operações - 450 - - - 450
Centro da Formação da Polícia - 620 - - - 620
Região I - 413 - - - 413
Região II - 318 - - - 318
Região III - 315 - - - 315

Page 79 of 96
Região Oe-cusse - 75 - - - 75
Ministério do Planeamento e Investimento Estratégico 283 6,999 - - 14,690 21,972
Gabinete do Ministro 86 556 - - - 642
Secretariado do FDCH - 185 - - - 185
Direção Geral de Gestão Admnistrativa 19 42 - - - 61
Gabinete Jurídico 16 120 - - - 136
Direção Nacional de Gestão de Recursos Humanos 45 65 - - - 110
Gabinete de Inspeção e Auditoria Interna 13 26 - - - 39
Direção Nacional de Admnistração, Finanças e Aprovisionamento 44 572 - - - 616
Agência de Desenvolvimento Nacional - 2,740 - - 14,690 17,430
Comissão Nacional de Aprovisionamento - 2,036 - - - 2,036
Unidade de Missão para o Desenvolvimento Regional Integrado - TIA - 630 - - - 630
Direção Nacional de Habitação e Planeamento Urbano 60 28 - - - 88
Tribunais 1,603 1,599 - - - 3,202
Conselho Superior da Magistratura Judicial 31 7 - - - 38
Tribunal de Recurso 1,231 1,210 - - - 2,441
Tribunais Distritais 341 382 - - - 723
Procuradoria Geral da República 2,373 1,500 - 245 10 4,128
Procuradoria-Geral da República 1,320 1,363 - 245 10 2,938
Procuradoria Distrital de Baucau 429 74 - - - 503
Procuradoria Distrital de Suai 341 40 - - - 381
Procuradoria Distrital de Oe-Cusse 283 23 - - - 306
Provedoria dos Direitos Humanos e Justica 768 750 - - 98 1,616
Provedoria dos Direitos Humanos e Justiça 768 635 - - 98 1,501
Direções Direitos Humanos e Boa Governação - 115 - - - 115
Comissão Anti Corrupção 784 600 - 43 - 1,427
Comissão Anti-Corrupção 784 600 - 43 - 1,427
Comissão da Função Pública 867 1,600 - - - 2,467
Comissão da Função Pública 867 1,600 - - - 2,467
Universidade Nacional Timor Lorosa’e (Serviço e Fundo Autonómo com Receita Própria)
9,100 2,500 - - - 11,600
Universidade Nacional Timor Lorosae 9,100 2,500 - - - 11,600
Arquivo e Museu da Resistência Timorense (Serviço e Fundo Autónomo)
- 963 - - - 963

Page 80 of 96
Arquivo e Museu da Resistencia Timorense - 963 - - - 963
Conselho de Imprensa (Serviço e Fundo Autónomo) 243 400 - 258 - 901
Conselho de Imprensa 243 400 - 258 - 901
Instituto de Apoio ao Desenvolvimento Empresarial (Serviço e Fundo Autónomo)
492 550 - - - 1,042
Instituto de Apoio ao Desenvolvimento Empresarial 492 550 - - - 1,042
Agência Especializada de Investimento (Serviço e Fundo Autónomo )
- 1,250 - - - 1,250
Agência Especializada de Investimento - 1,250 - - - 1,250
Serviço de Registo e Verificação Empresarial (Serviço e Fundo Autónomo)
- 700 - - - 700
Serviço de Registo e Verificação Empresarial - 700 - - - 700
Instituto de Pesquisa, Desenvolvimento, Formação e Promoção do Bambu (Serviço e Fundo Autónomo)
- 300 - - - 300
BAMBU - 300 - - - 300
Centro Nacional de Formação Profissional–Becora, (Serviço e Fundo Autónomo)
93 129 - 191 - 413
Centro Nacional de Formação Profissional–Becora, 93 129 - 191 - 413
Polícia Científica de Investigação Criminal (Serviço e Fundo Autónomo)
1,083 432 - 384 - 1,898
Polícia Cientítfica de Investigação Criminal 1,083 432 - 384 - 1,898
Hospital Nacional Guido Valadares (Serviço e Fundo Autónomo) 4,223 3,565 - 1,439 - 9,227
Hospital Nacional Guido Valadares 4,223 3,565 - 1,439 - 9,227
Serviço Autónomo de Medicamentos e Equipamentos Médicos (Serviço e Fundo Autónomo)
249 5,318 - 522 - 6,089
Serviço Autónomo de Medicamentos e Equipamentos Médicos 249 5,318 - 522 - 6,089
Laboratório Nacional (Serviço e Fundo Autónomo) 293 644 - 1,068 - 2,005
Laboratório Nacional 293 644 - 1,068 - 2,005
Centro Nacional de Reabilitação (Serviço e Fundo Autónomo) 27 664 - - - 691
Centro Nacional de Reabilitação 27 664 - - - 691
Instituto de Gestão de Equipamentos (Serviço e Fundo Autónomo) 1,042 1,850 - - - 2,892
Instituto de Gestão de Equipamentos 1,042 1,850 - - - 2,892
Administração dos Portos de Timor-Leste (Serviço e Fundo Autónomo)
498 3,202 - 502 - 4,202
Autoridade Portuária de Timor Leste 498 896 - 502 - 1,896

Page 81 of 96
Operações do Berlin - Nakroma - 2,306 - - - 2,306
Autoridade Reguladora das Comunicações (Serviço e Fundo Autónomo)
- 982 - 348 - 1,330
Autoridade Nacional de Comunicações - 982 - 348 - 1,330
Instituto de Defesa Nacional (Serviço e Fundo Autónomo) 47 748 - - - 795
Instituto de Defesa Nacional 47 748 - - - 795
Agência Nacional para a Avaliação e Acreditação Académica (Serviço e Fundo Autónomo)
26 150 - - - 176
Agência Nacional para Avaliação e Acreditação Académica 26 150 - - - 176
Instituto Nacional da Saúde (Serviço e Fundo Autónomo) 248 240 - 18 - 506
Instituto de Ciências da Saúde 248 240 - 18 - 506
Centro de Logístico Nacional (Serviço e Fundo Autónomo) 99 2,928 - - - 3,027
Centro de Logístico Nacional 99 2,928 - - - 3,027
Autoridade de Inspeção Alimentar e Fiscalização da Atividade Económica (Serviço e Fundo Autónomo)
115 282 - 20 - 417
Autoridade de Inspeção Alimentar e Fiscalização da Atividade Económica
115 282 - 20 - 417
Centro Nacional de Emprego e Formação Profissional - Tibar (Serviço e Fundo Autónomo)
- 353 - 31 - 384
Centro Nacional de Emprego e Formação Profissional - Tibar - 353 - 31 - 384
Instituto Nacional do Desenvolvimento de Mão-de-Obra (Órgão Autónomo sem Receitas Próprias)
36 178 - 13 - 227
Instituto Nacional do Desenvolvimento de Mão-de-Obra 36 178 - 13 - 227
Autoridade Municipal de Baucau 1,578 1,305 999 - - 3,881
Secretáriado de Autoridade Municipal 640 146 938 - - 1,723
Serviço Municipal de Saúde 193 108 - - - 301
Serviço Municipal de Educação 209 760 61 - - 1,030
Serviço Municipal de Agricultura 404 138 - - - 542
Serviço Municipal de Obras Públicas e Transportes 55 24 - - - 79
ServiçosMunicipal de Água, Saneamento Básico e Ambiente 64 70 - - - 134
Serviço Municipal de Gestão Mercados e Turismo - 6 - - - 6
Serviço Municipal de Registos, Notariado e Cadastrais 9 4 - - - 12
Serviço Municipal de Ação Social e Gestão de Desastres Naturais 5 50 - - - 55
Autoridade Municipal de Bobonaro 1,631 1,593 715 - - 3,939
Secretáriado de Autoridade Municipal 641 146 715 - - 1,502
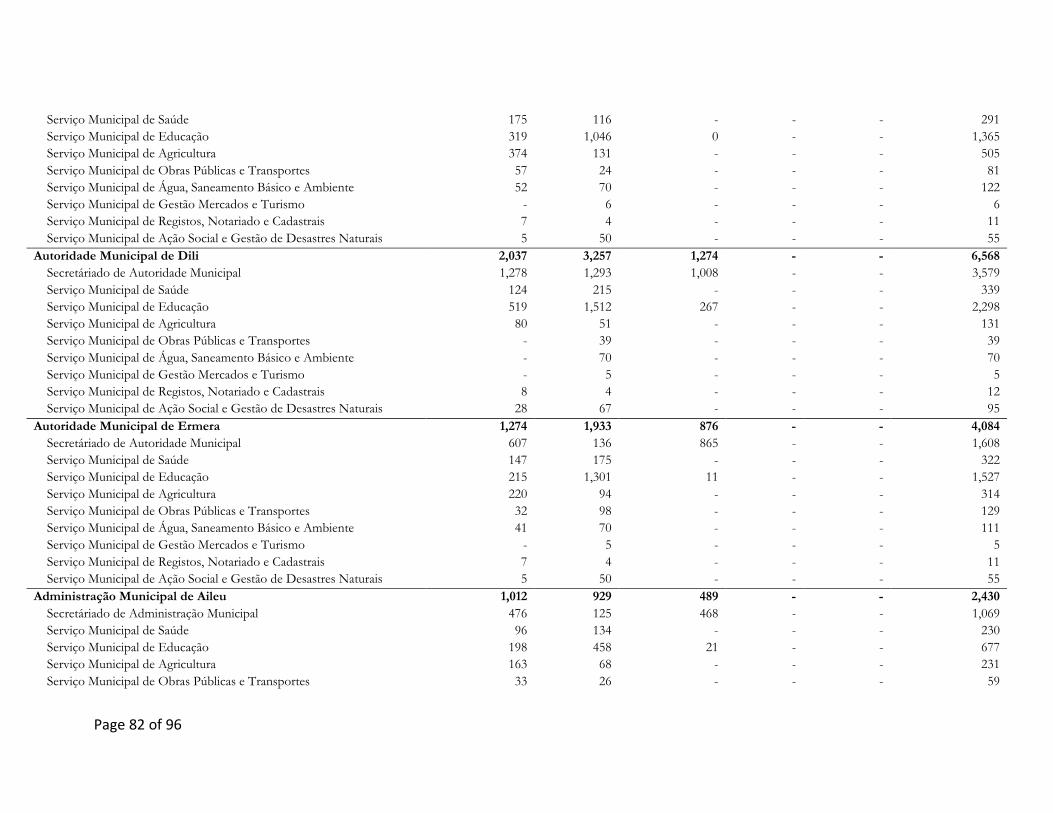
Page 82 of 96
Serviço Municipal de Saúde 175 116 - - - 291
Serviço Municipal de Educação 319 1,046 0 - - 1,365
Serviço Municipal de Agricultura 374 131 - - - 505
Serviço Municipal de Obras Públicas e Transportes 57 24 - - - 81
Serviço Municipal de Água, Saneamento Básico e Ambiente 52 70 - - - 122
Serviço Municipal de Gestão Mercados e Turismo - 6 - - - 6
Serviço Municipal de Registos, Notariado e Cadastrais 7 4 - - - 11
Serviço Municipal de Ação Social e Gestão de Desastres Naturais 5 50 - - - 55
Autoridade Municipal de Dili 2,037 3,257 1,274 - - 6,568
Secretáriado de Autoridade Municipal 1,278 1,293 1,008 - - 3,579
Serviço Municipal de Saúde 124 215 - - - 339
Serviço Municipal de Educação 519 1,512 267 - - 2,298
Serviço Municipal de Agricultura 80 51 - - - 131
Serviço Municipal de Obras Públicas e Transportes - 39 - - - 39
Serviço Municipal de Água, Saneamento Básico e Ambiente - 70 - - - 70
Serviço Municipal de Gestão Mercados e Turismo - 5 - - - 5
Serviço Municipal de Registos, Notariado e Cadastrais 8 4 - - - 12
Serviço Municipal de Ação Social e Gestão de Desastres Naturais 28 67 - - - 95
Autoridade Municipal de Ermera 1,274 1,933 876 - - 4,084
Secretáriado de Autoridade Municipal 607 136 865 - - 1,608
Serviço Municipal de Saúde 147 175 - - - 322
Serviço Municipal de Educação 215 1,301 11 - - 1,527
Serviço Municipal de Agricultura 220 94 - - - 314
Serviço Municipal de Obras Públicas e Transportes 32 98 - - - 129
Serviço Municipal de Água, Saneamento Básico e Ambiente 41 70 - - - 111
Serviço Municipal de Gestão Mercados e Turismo - 5 - - - 5
Serviço Municipal de Registos, Notariado e Cadastrais 7 4 - - - 11
Serviço Municipal de Ação Social e Gestão de Desastres Naturais 5 50 - - - 55
Administração Municipal de Aileu 1,012 929 489 - - 2,430
Secretáriado de Administração Municipal 476 125 468 - - 1,069
Serviço Municipal de Saúde 96 134 - - - 230
Serviço Municipal de Educação 198 458 21 - - 677
Serviço Municipal de Agricultura 163 68 - - - 231
Serviço Municipal de Obras Públicas e Transportes 33 26 - - - 59

Page 83 of 96
Serviço Municipal de Água, Saneamento Básico e Ambiente 35 70 - - - 105
Serviço Municipal de Gestão Mercados e Turismo - 5 - - - 5
Serviço Municipal de Registos, Notariado e Cadastrais 6 4 - - - 9
Serviço Municipal de Ação Social e Gestão de Desastres Naturais 5 39 - - - 45
Administração Municipal de Ainaro 1,201 1,218 381 - - 2,799
Secretáriado de Administração Municipal 474 123 381 - - 977
Serviço Municipal de Saúde 178 138 - - - 316
Serviço Municipal de Educação 233 635 - - - 868
Serviço Municipal de Agricultura 225 105 - - - 330
Serviço Municipal de Obras Públicas e Transportes 28 97 - - - 125
Serviço Municipal de Água, Saneamento Básico e Ambiente 52 70 - - - 122
Serviço Municipal de Gestão Mercados e Turismo - 6 - - - 6
Serviço Municipal de Registos, Notariado e Cadastrais 6 4 - - - 9
Serviço Municipal de Ação Social e Gestão de Desastres Naturais 5 40 - - - 45
Administração Municipal de Covalima 1,577 1,243 499 - - 3,319
Secretáriado de Administração Municipal 641 158 481 - - 1,280
Serviço Municipal de Saúde 200 106 - - - 306
Serviço Municipal de Educação 271 636 19 - - 926
Serviço Municipal de Agricultura 367 125 - - - 492
Serviço Municipal de Obras Públicas e Transportes 29 99 - - - 128
Serviço Municipal de Água, Saneamento Básico e Ambiente 57 70 - - - 128
Serviço Municipal de Gestão Mercados e Turismo - 5 - - - 5
Serviço Municipal de Registos, Notariado e Cadastrais 7 4 - - - 10
Serviço Municipal de Ação Social e Gestão de Desastres Naturais 5 40 - - - 45
Administração Municipal de Lautém 1,367 1,351 530 - - 3,248
Secretáriado de Administração Municipal 543 136 518 - - 1,197
Serviço Municipal de Saúde 150 207 - - - 357
Serviço Municipal de Educação 220 741 12 - - 973
Serviço Municipal de Agricultura 358 121 - - - 479
Serviço Municipal de Obras Públicas e Transportes 37 27 - - - 64
Serviço Municipal de Água, Saneamento Básico e Ambiente 47 70 - - - 118
Serviço Municipal de Gestão Mercados e Turismo - 5 - - - 5
Serviço Municipal de Registos, Notariado e Cadastrais 8 4 - - - 12
Serviço Municipal de Ação Social e Gestão de Desastres Naturais 3 40 - - - 43

Page 84 of 96
Administração Municipal de Liquiçá 1,053 1,095 425 - - 2,573
Secretáriado de Administração Municipal 403 115 401 - - 919
Serviço Municipal de Saúde 160 129 - - - 289
Serviço Municipal de Educação 190 619 24 - - 833
Serviço Municipal de Agricultura 214 85 - - - 299
Serviço Municipal de Obras Públicas e Transportes 36 27 - - - 62
Serviço Municipal de Água, Saneamento Básico e Ambiente 40 70 - - - 110
Serviço Municipal de Gestão Mercados e Turismo - 6 - - - 6
Serviço Municipal de Registos, Notariado e Cadastrais 8 4 - - - 12
Serviço Municipal de Ação Social e Gestão de Desastres Naturais 2 40 - - - 42
Administração Municipal de Manufahi 1,301 1,115 456 - - 2,872
Secretáriado de Administração Municipal 490 131 456 - - 1,077
Serviço Municipal de Saúde 152 174 - - - 326
Serviço Municipal de Educação 210 555 - - - 765
Serviço Municipal de Agricultura 333 112 - - - 445
Serviço Municipal de Obras Públicas e Transportes 57 24 - - - 81
Serviço Municipal de Água, Saneamento Básico e Ambiente 46 70 - - - 116
Serviço Municipal de Gestão Mercados e Turismo - 5 - - - 5
Serviço Municipal de Registos, Notariado e Cadastrais 5 4 - - - 8
Serviço Municipal de Ação Social e Gestão de Desastres Naturais 8 40 - - - 47
Administração Municipal de Manatuto 1,272 1,087 409 - - 2,768
Secretáriado de Administração Municipal 591 144 395 - - 1,130
Serviço Municipal de Saúde 109 210 - - - 319
Serviço Municipal de Educação 183 474 14 - - 671
Serviço Municipal de Agricultura 286 112 - - - 399
Serviço Municipal de Obras Públicas e Transportes 40 27 - - - 67
Serviço Municipal de Água, Saneamento Básico e Ambiente 49 70 - - - 119
Serviço Municipal de Gestão Mercados e Turismo - 5 - - - 5
Serviço Municipal de Registos, Notariado e Cadastrais 7 4 - - - 11
Serviço Municipal de Ação Social e Gestão de Desastres Naturais 7 41 - - - 48
Administração Municipal de Viqueque 1,345 1,473 663 - - 3,482
Secretáriado de Administração Municipal 557 137 657 - - 1,350
Serviço Municipal de Saúde 121 219 - - - 340
Serviço Municipal de Educação 221 777 7 - - 1,006

Page 85 of 96
Serviço Municipal de Agricultura 370 121 - - - 491
Serviço Municipal de Obras Públicas e Transportes 25 99 - - - 124
Serviço Municipal de Água, Saneamento Básico e Ambiente 41 70 - - - 112
Serviço Municipal de Gestão Mercados e Turismo - 5 - - - 5
Serviço Municipal de Registos, Notariado e Cadastrais 5 4 - - - 8
Serviço Municipal de Ação Social e Gestão de Desastres Naturais 5 42 - - - 47
Serviço Nacional de Inteligência (Órgão Autónomo sem Receitas Próprias)
347 1,200 - - - 1,547
Serviço Nacional de Inteligência 347 1,200 - - - 1,547
Inspeção-Geral do Estado (Órgão Autónomo sem Receitas Próprias)
319 450 - - - 769
Gabinete da Inspeção-Geral 319 450 - - - 769
Instituto Nacional da Administração Pública (Órgão Autónomo sem Receitas Próprias)
396 240 - - - 636
Instituto Nacional de Administração Pública 396 240 - - - 636
Comissão Nacional de Eleições 646 3,500 6,000 - - 10,146
Comissão Nacional de Eleições 646 3,500 6,000 - - 10,146
Conselho para a Delimitação Definitiva das Fronteiras Marítimas (Órgão Autónomo sem Receitas Próprias)
- 1,142 - 58 - 1,200
Gabinete das Fronteiras Marítimas - 1,142 - 58 - 1,200
Fundo das Infraestruturas, incluindo as despesas financiadas por empréstimo (Fundo Autónomo com Receitas Próprias)
46 1,150 - - 324,426 325,622
Commissão de Administracão do Fundo Infraestrutura - FI 46 1,150 - - 222,600 223,796
Empréstimo - - - - 101,826 101,826

Page 86 of 96
ANEXO III Serviços e Fundos Autónomos, incluindo Autoridade da Região Administrativa Especial
de Oe-Cusse Ambeno e Zona Especial de Economia Social de Mercado de Oe-Cusse Ambeno e Ataúro (milhares de dólares norte-americanos)
Despesas Receitas Próprias
Dotação OGE
Arquivo e Museu da Resistência Timorense Salários e Vencimentos
-
Bens e Serviços 963
Transferências Públicas -
Capital Menor -
Capital Desenvolvimento -
Total 963
-
963
Conselho de Imprensa Salários e Vencimentos
243
Bens e Serviços 400
Transferências Públicas -
Capital Menor 258
Capital Desenvolvimento -
Total 901
-
901
Instituto de Apoio ao Desenvolvimento Empresarial Salários e Vencimentos
492
Bens e Serviços 550
Transferências Públicas -
Capital Menor -
Capital Desenvolvimento -
Total 1,042
-
1,042
Agência Especializada de Investimento Salários e Vencimentos
-

Page 87 of 96
Bens e Serviços 1,250
Transferências Públicas -
Capital Menor -
Capital Desenvolvimento -
Total 1,250
4
1,246
Serviço de Registo e Verificação Empresarial Salários e Vencimentos
-
Bens e Serviços 700
Transferências Públicas -
Capital Menor -
Capital Desenvolvimento -
Total 700
251
449
Instituto de Pesquisa, Desenvolvimento, Formação e Promoção do Bambu
Salários e Vencimentos -
Bens e Serviços 300
Transferências Públicas -
Capital Menor -
Capital Desenvolvimento -
Total 300
48
252
Centro Nacional de Formação Profissional–Becora Salários e Vencimentos
93
Bens e Serviços 129
Transferências Públicas -
Capital Menor 191
Capital Desenvolvimento -
Total 413
-
413

Page 88 of 96
Polícia Científica de Investigação Criminal Salários e Vencimentos
1,083
Bens e Serviços 432
Transferências Públicas -
Capital Menor 384
Capital Desenvolvimento -
Total 1,898
-
1,898
Agência Nacional para a Avaliação e Acreditação Académica
Salários e Vencimentos 26
Bens e Serviços 150
Transferências Públicas -
Capital Menor -
Capital Desenvolvimento -
Total 176
-
176
Hospital Nacional Guido Valadares Salários e Vencimentos
4,223
Bens e Serviços 3,565
Transferências Públicas -
Capital Menor 1,439
Capital Desenvolvimento -
Total 9,227
175
9,051
Serviço Autónomo de Medicamentos e Equipamentos Médicos
Salários e Vencimentos 249
Bens e Serviços 5,318
Transferências Públicas -
Capital Menor 522

Page 89 of 96
Capital Desenvolvimento -
Total 6,089
4
6,085
Laboratório Nacional Salários e Vencimentos
293
Bens e Serviços 644
Transferências Públicas -
Capital Menor 1,068
Capital Desenvolvimento -
Total 2,005
-
2,005
Instituto Nacional da Saúde Salários e Vencimentos
248
Bens e Serviços 240
Transferências Públicas -
Capital Menor 18
Capital Desenvolvimento -
Total 506
-
506
Centro Nacional de Reabilitação Salários e Vencimentos
27
Bens e Serviços 664
Transferências Públicas -
Capital Menor -
Capital Desenvolvimento -
Total 691
-
691
Instituto de Gestão de Equipamentos Salários e Vencimentos
1,042
Bens e Serviços 1,850
Transferências Públicas -

Page 90 of 96
Capital Menor -
Capital Desenvolvimento -
Total 2,892
58
2,834
Administração dos Portos de Timor-Leste Salários e Vencimentos
498
Bens e Serviços 3,202
Transferências Públicas -
Capital Menor 502
Capital Desenvolvimento -
Total 4,202
4,960
(758)
Autoridade Reguladora das Comunicações Salários e Vencimentos
-
Bens e Serviços 982
Transferências Públicas -
Capital Menor 348
Capital Desenvolvimento -
Total 1,330
-
1,330
Instituto de Defesa Nacional Salários e Vencimentos
47
Bens e Serviços 748
Transferências Públicas -
Capital Menor -
Capital Desenvolvimento -
Total 795
-
795
Universidade Nacional de Timor Lorosa'e Salários e Vencimentos
9,100
Bens e Serviços 2,500

Page 91 of 96
Transferências Públicas -
Capital Menor -
Capital Desenvolvimento -
Total 11,600
657
10,943
Fundo das Infraestruturas Salários e Vencimentos
46
Bens e Serviços 1,150
Transferências Públicas -
Capital Menor -
Capital Desenvolvimento 324,426
Total 325,622
-
325,622
Centro de Logistico Nacional Salários e Vencimentos
99
Bens e Serviços 2,928
Transferências Públicas -
Capital Menor -
Capital Desenvolvimento -
Total 3,027
-
3,027
Autoridade de Inspeção Alimentar e Fiscalização da Atividade Económica
Salários e Vencimentos 115
Bens e Serviços 282
Transferências Públicas -
Capital Menor 20
Capital Desenvolvimento -
Total 417
-
417
Centro Nacional de Emprego e Formação Profissional - Tibar

Page 92 of 96
Salários e Vencimentos -
Bens e Serviços 353
Transferências Públicas -
Capital Menor 31
Capital Desenvolvimento -
Total 384
-
384
Total Serviços e Fundos Autónomos 376,429 6,156 370,273
Autoridade da Região Administrativa Especial de Oe-Cusse Ambeno (ARAEOA) e Zona Especial de Economia Social de Mercado de Oe-Cusse Ambeno e Ataúro (ZEESM)
Despesas Receitas próprias
Dotação OGE
Total 172,110 769 171,341

Page 93 of 96
Anexo IV Dotações Orçamentais para 2017 do Fundo de Desenvolvimento do Capital Humano
(milhares de dólares norte-americanos)
Nome do Programas/ Subprogramas
Despesas financiadas por saldo transitado
de 2016
Salários e Vencimentos
Bens e Serviços
Transferências Publicas
Capital Menor
Capital Desenvolvimento
Total das Despesas
Total - - 27,200 - - - 27,200
Formação Professional - - 7,415 - - - 7,415
Formação Técnica - - 2,505 - - - 2,505
Bolsas de Estudo - - 14,961 - - - 14,961
Outros Tipos de Formação - - 2,318 - - - 2,318

Page 94 of 96
Part 4: Supporting Documents
4.1: Justification for Transfer from the Pertroluem Fund


Page 95 of 96
4.2: ESI Report 1: Requirement for Transfers from the
Petroleum Fund for 2017 ESI


Page 96 of 96
4.3: ESI Report 2: Requirement for Transfers from the
Petroleum Fund for medium term ESI
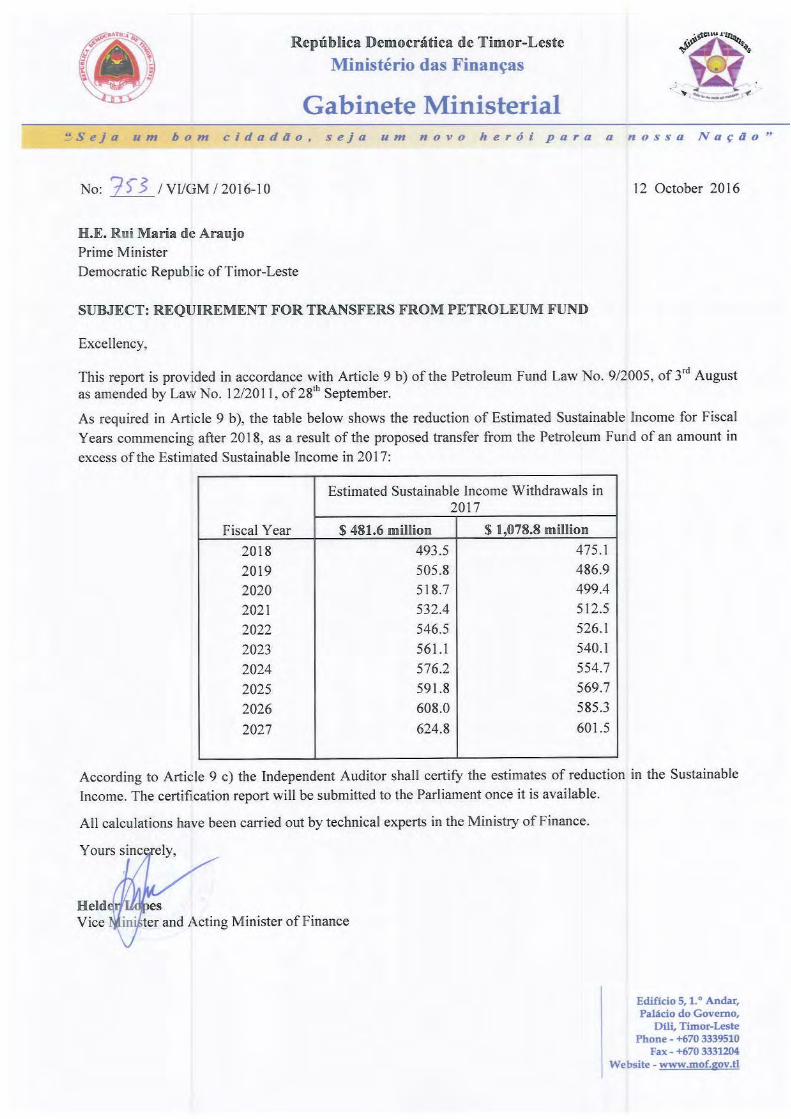

MINISTRY OF FINANCE Edifício 5, 1.º Andar, Palácio do Governo, Díli, Timor-Leste
Phone - +670 3339510 Fax - +670 3331204
Website - www.mof.gov.tl