2.17 enabling rapid naval architecture design space ... 2.17 enabling rapid naval architecture...
TRANSCRIPT

291
2.17 Enabling Rapid Naval Architecture Design Space Exploration
Enabling Rapid Naval Architecture Design Space Exploration Michael A. Mueller, Stephane Dufresne, Santiago Balestrini-Robinson, and Dimitri Mavris
Georgia Institute of Technology [email protected]@asd1.gatech.edu [email protected] [email protected]
Well,accepted ~nceptual ship design 100,IS can b~ used to explore a design space, but more precise results can be found using detailed models In full-feature computer aided design programs. However, defining a detailed model can be a lime intensive task and hen~ th~re is an incentive for time sensitive projects to use conceptual design IDOls to explore the design space. In this project: the comblnallon of advanced aerospace systems design methods and an accepted conceptual design tool facili tates the creation of a tool .that enables the user to not only visualize ship geometry but also determine design feasibility and estimate the performance of a deSign.
1.0 INTRODUCTION The practice of naval architecture parallels the field of aerospace engineering in many ways; both involve a calculated balance of resistance, power, and weight, and both require an early recognition of the desired capabilities in the design of the respective craft. It is in this latter parallel where systems engineering methods can be very useful throughout the design process. An important part of the modern systems engineering process involves modeling the craft to better understand not only the interactions between the internal subsystems but also the interactions between the craft and the environment. In both aerospace engineering and naval architecture, physics-based models, models defined by realistic physics and processes, can be used as models to help the designers develop balanced and effective solutions to the problems posed by the design requirements .
Physics-based models allow for the prediction of performance and can be very precise. Work by Jiang, Forstell , Lavis, and Ritter demonstrated the power of the ship design program PASS, Parametric Analysis of Ship Systems, a physics-based design modeling software, to accurately predict the design parameters of the CG-47 cruiser and carry out additional performance optimization analysis (1]. Though physicsbased models can be useful tool in modem
design methodology, the ability to design and analyze craft can be further advanced through the use of three-dimensional, 3-D, product modeling software. Such software can allow for the creation of electronic mock-ups, reduce the number of design and rework errors, and allow for concurrent engineering methods, which decrease development time (2]. Both physics-based models and 3-D product modeling software give designers great creation and analysis abilities; however, both also share one potential limitation: a time-consuming need for detail.
Three-dimensional product modeling software and physics-based modeling can identify faulty designs and accurately predict performance; but, the accuracy of the estimations is limited by the design's level of detail , where a more-detailed input design will allow for better predictions of performance, and a model with less detail may include more assumptions and a larger degree of uncertainty. Unfortunately, the optimum level of detail is often not obvious to the designer until the latter stages of the design process. Additionally , as Mark Turner concluded in his report detailing the lessons learned from modeling the GE9D ai rcraft engine, though there is enough computing power to run detailed analyses, u ••• (computing power] is not as much of a bottleneck as the infrastructure for geometry definition, collection and grid generation for
https://ntrs.nasa.gov/search.jsp?R=20110012134 2018-05-29T13:45:08+00:00Z

292
a given operating point" [3] . Defining the inputs for a complex design, whether it be an aircraft engine or a destroyer, can take a considerable amount of time, and therefore, most physics·based models and 3--0 product modeling softo.Nare are not conducive to effectively evaluating hundreds of designs during the conceptual design stage of a project. As part of research efforts sponsored by the Canadian Navy at the Aerospace Systems Design Laboratory, ASDL, at the Georgia Institute of Technology, another option was developed: integrate surrogate models with 3-D design visualization to produce a tool that gives near·instantaneous evaluation of a design that is easily defined.
This third option utilizes SHOPS, a legacy conceptual design tool developed by the Canadian Navy that applies naval architecture definitions and regressions of experimental and historical data to accurately and rapidly size and assess the performance of a conceptual design. As useful as SHOPS can be, it requires the creation of an input file, and though modem computers can quickly write an input file, execute the program , and parse the output in about one third of a second, by using surrogate models, the analysis takes orders of magnitude less time. Calculating the formulas that comprise the surrogate models takes as little as a couple hundredths of a second, and when coupled with a graphical user interface makes evaluating a concept a process as easy as manipulating slide bars. Adding a visualization component allows a design to be modeled as a generalized ship that matches the input and output parameters, and this visualization works as a way to check the design to see if it "looks right" and possibly reject a design as infeasible. Another use is to notice trends and discern where to focus development efforts in order to affect the greatest improvement in performance; research by Chris McKesson highlighted how the use of relati vely simple, parametric models can be used for exactly this purpose [4].
By matching the power of a legacy conceptual design tool augmented through surrogate models with an intuitive and responsive interface, it is possible to simplify the exploration of the design space, and by enabling rapid assessment may further enable the evaluation of great numbers of designs and improve the designers' mental model of the design space, effectively empowering them to make better decisions.
2.0 BODY Before discussing the surrogate modeling process, it is necessary to describe and clarify the softo.Nare used. SHOPS stands for SHip OPtimization version 5, and is a legacy conceptual design tool originally developed in the late 1980s by James Colwell of Defense Research & Development Canada (DR DC.) It strives in analyzing batches of hundreds of designs; moreover, SHOPS performs these analyses in a fraction of the time that other analyses tools require. However, when it comes to single designs, SHOPS's computational speed is jeopardized by the time required to write the input file and parse the output file. As a result, it can take practically the same amount of time to analyze either a single case or dozens of cases. Though in some applications this is acceptable or inconsequential , the process does induce a lag that significantly inhibits the performance of a real·time interface. Due to this lag, a different method must be employed to rapidly perform the required analyses.
One possible method is through the use of surrogate models. Surrogate models, being relatively simple formulas, have many benefits including being easy to implement in a program, calculating nearly instantaneously, and when properly created, accurately modeling a response, or output, throughout the entire bounds of a design space. The surrogate modeling process for this work is discussed in the latter sections of this paper. One important caveat is that before surrogate models can be created,
293
data from which to create the models must be collected.
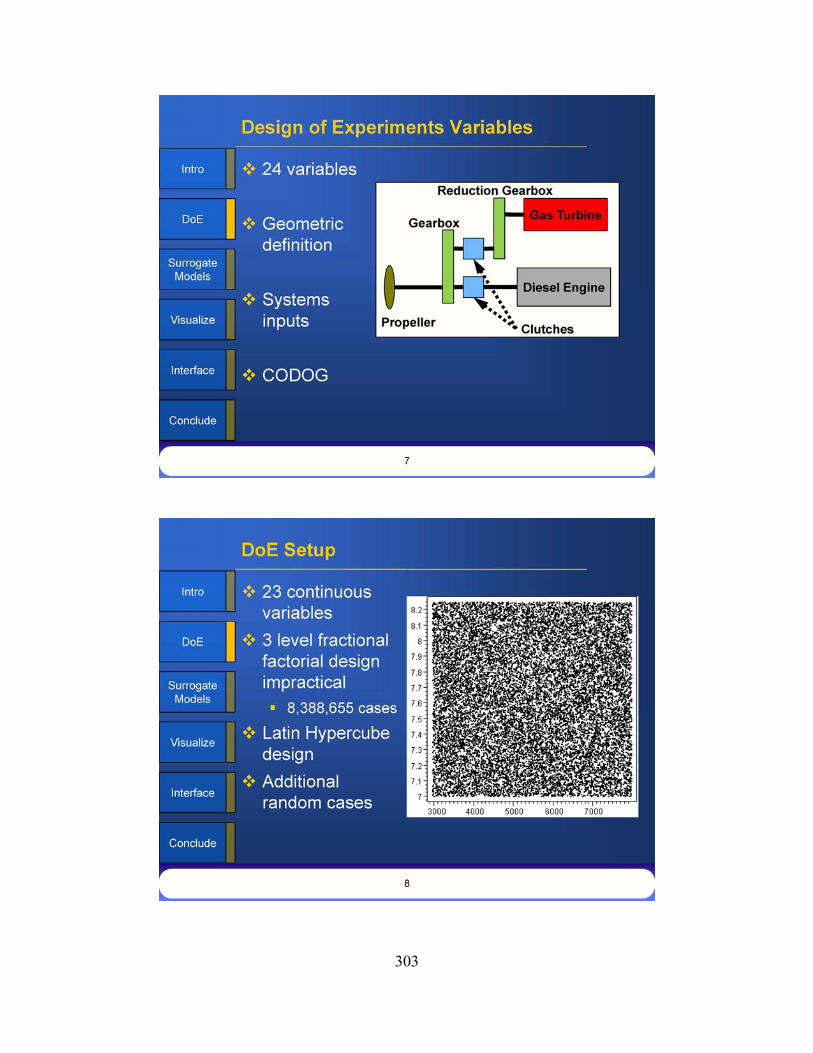
2.1 Design of Experiments Before data collection can begin. the input and output variables to track must be selected. For this project the selected variables allow the user to control the design of the ship by altering characteristics in five separate categories: Characteristic Dimension; Geometry; Speeds; Combat, Power, and Complement; and Propulsion System. In total , tvventy-four input variables are used. More variables can be included in the analysis, but for demonstration purposes, these were considered sufficient.
With the input variables selected, the Design of Experiments can now be formulated . A Design of Experiments, or DoE, is a systematic way of collecting the data required to make surrogate models. This method uses statistical methods described in work by Myers, Montgomery, and Anderson-Cook [51 , and the objective is to limit the number of cases required to thoroughly explore the deSign space and make accurate models. Since only ordinal and continuous variables are suitable for DoEs, the engine configuration, a categorical variable , is not used in the DoE. For this project, the engine configuration is set to be CODOG, or COmbined Diesel Or Gas.
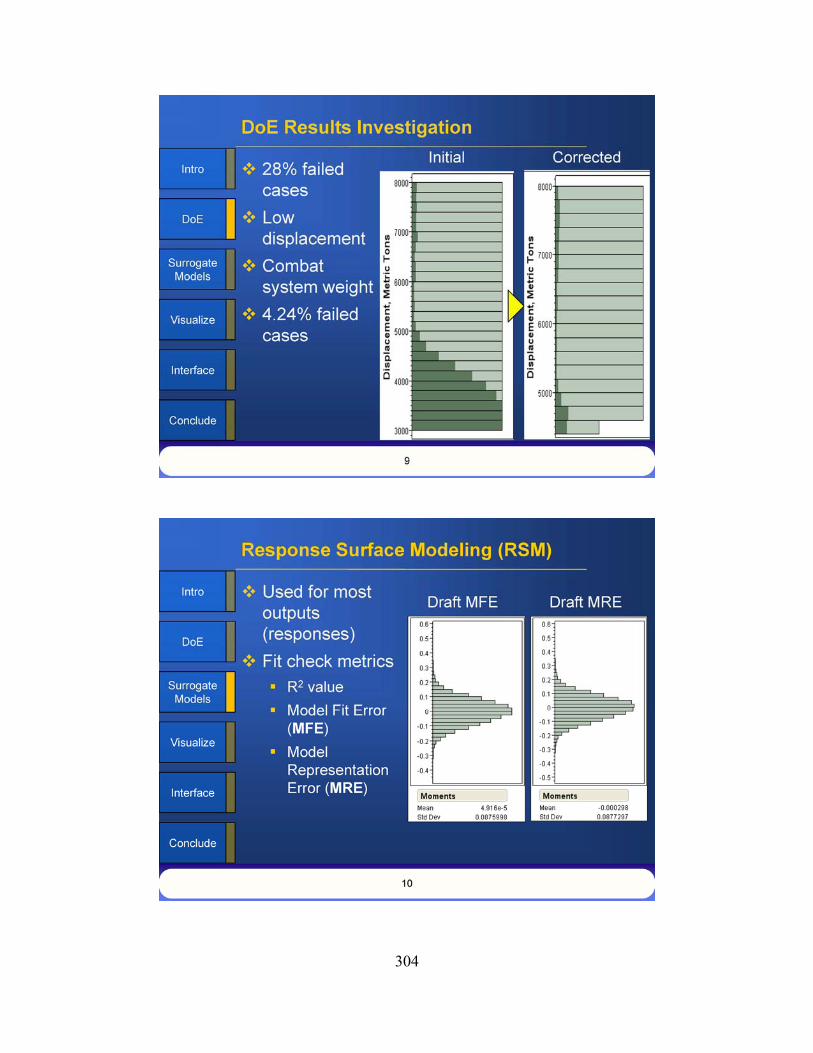
The remaining tvventy-three variables are taken into consideration when choosing what DoE architecture to use. With such a large number of variables in use, a full factorial design is not feasible; for example, a three-level full factorial design requires 323
, or 94,143,178,827, cases to be tested, and a face-centered central composite design is also infeasible since it requires 223+2(23)+1 , or 8,388,655, cases to be tested. If one assumes that it takes onethird of a second to run a case, it would take 32 days to run a face-centered central composite design and 994 years to run the full -factorial DoE. Since those lengths of time are practically beyond the reach of this
project, a different tactic is used: Latin Hypercube I Hypercube designs.
The Latin Hypercube DeSign, like other space-filling designs, is beneficial because it allows the user to specify the number of cases. This design places the cases throughout the hyper and not just at the corners. Through use of the mathematical software MA TLAB~, the DoE is ta ilored to reduce statistical correlation, an indication that there may be skewing in the results of the cases run and, most importantly, that models made from the data will be erroneous because the impact of the independent variables cannot be discerned independently. For this DoE, a Latin Hypercube with 17,250 cases was defined for the 23 variables; though this number appears to be high, it gives a sampling of cases that extend to the edges of the design space and minimizes the unexplored spaces.
In addition to the Latin Hypercube defined cases, there are 5700 random cases added to the DoE. These random cases are used to assess the fit of the surrogate model, but are not used to create the models, so any correlation betvveen them is inconsequential .
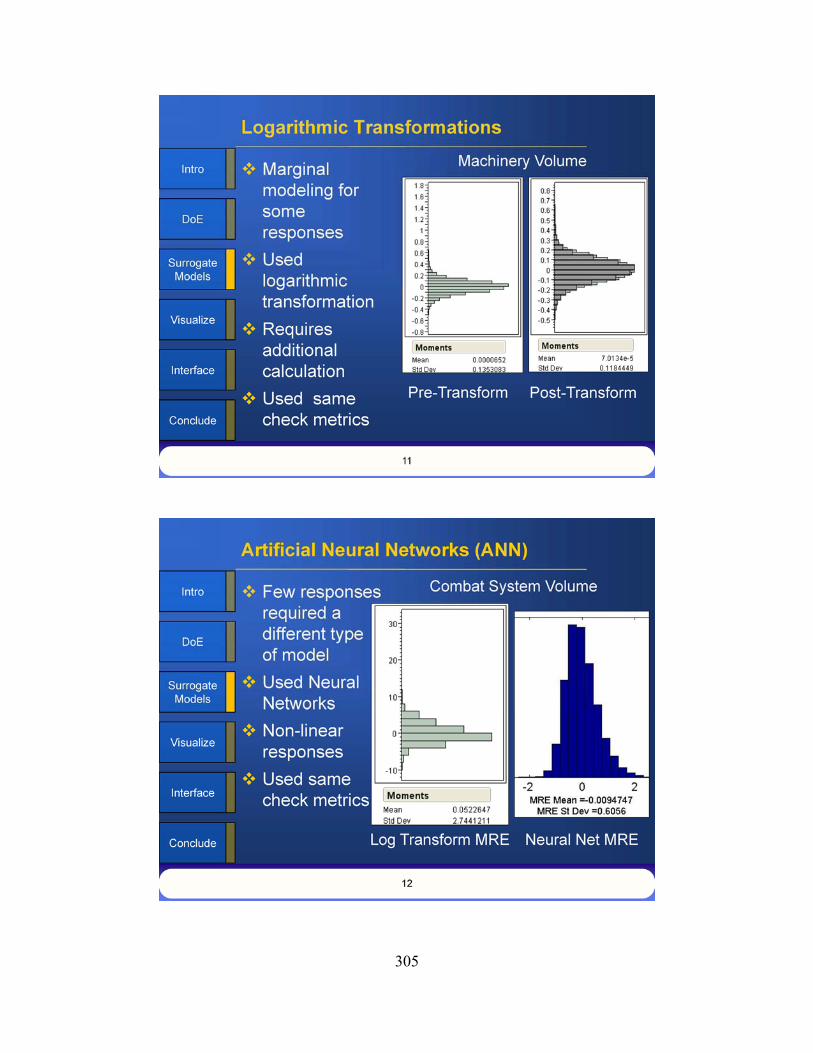
With the entire DoE defined, a MA TLAB~ script is used to write the input file using input values from the DoE, send the input file to the SHOP5 executable, parse the output file, and save the output values to a data table. This completely automates the process of running a DoE; however, there is no simple way to track how many cases lead to failed analyses while the run is in progress. This is an issue because SHOP5 can reject a design for many reasons, and when it does so, it gives a coded message indicating the error, but otherwise produces no output for that design. The results from the initial DoE show that this happened 4826 times out of 17250 Latin Hypercube cases, or in 28% of the cases; this high percentage of failed cases renders the DoE results useless for meaningful surrogate

294
modeling. Through the use of JMp®, a statistical and visual analytics software developed by the SAS Institute Inc. , an investigation into the cause of the failed cases shows that most involved low full load displacement values; this is displayed below in Figure 1 where the darker shading indicates the distribution of the failed cases, and the lighter shading shows the distribution of displacement values for all Latin Hypercube cases.
• c
~ u E • "
Figure II.L:.~~~~::::~~ shading Further investigation of error reports indicates that there is a conflict between low values of full load displacement and high values of combat systems weight. This conflict is often demonstrated by the inability to add fuel weight to the vessel , and hence the design has a predicted range of zero. This problem was solved by raising the minimum value of full load displacement, and after the new DoE was run, it was found that only 732 out of 17250 cases, or 4.24%, failed .
Though a small percentage of failed cases remains, a tradeoff between preventing failed cases and opening the design space is considered. For this project, a 4.24% failure rate is accepted to maintain the size of the design space and usefulness of the resultant tool. With the DoE data now
collected, the surrogate modeling process can begin.
2.2 Surrogate Modeling For this project, a combination of response surface equations and artificial neural networks are used to create the surrogate models for the Conceptual Ship Design Interface. Response surface equations used in this project take the form of linear, second order equations. By using general guidelines and processes developed by the ASDL, response surface equations are created with JMP®. Since these surrogate models are representations of other models, it is essential that the surrogate models accurately represent the behavior of the SHOP5 software throughout the design space. To establish how well a surrogate model actually models a process, 5 metrics are used: RZ value, actual-by-predicted plots, residual-by-predicted plots, Model Fit Error (MFE,) and Model Representation Error (MRE.) Though all give important information about surrogate model performance, the most important are MRE and MFE. Model Fit Error measures the percent error between the prediction formula and the fitting data, and tells how well the model approximates the SHOPS process at the fitting data points only. Model Representation Error tells how well the surrogate model represents the SHOP5 process throughout the design space by measuring the percent error between the prediction formula and all the data in the DoE. In practical terms, the 17250 Latin Hypercube cases are used to fit the model and determine the MFE. and the 5700 random cases are used with the Latin Hypercube cases to calculate the MRE. Surrogate models that accurately model the background process usually have percent error distributions that approximate normal distributions with a mean of zero and a standard distribution of 1. Figure 2 and Figure 3 show the MFE and MRE, respectively, for the surrogate model of draft; since the mean for each distribution is approximately zero and the standard deviation for each is significantly less than

295
one, it is concluded that this is a very wellfitting surrogate model.
the surrogate model the surrogate model fo.· draft. for draft.
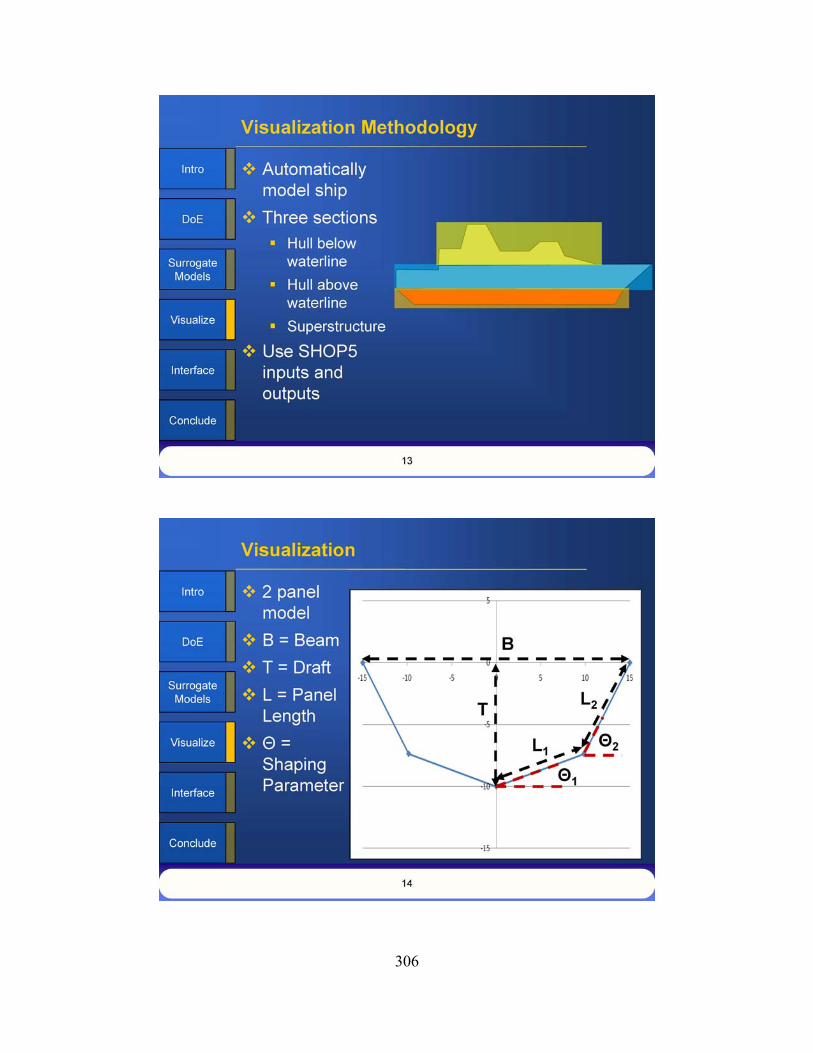
Though many outputs, or responses, are successfully modeled with linear, second order response surface equations, some require a transformation to allow for a better fit. By modeling the logarithmic, or log, transformation of the response, it is observed that some outliers are reduced, and the surrogate model can better represent the response throughout the design space; moreover, though there is an additional calculation where the surrogate model value must be untransformed, modern computers are fast enough that the time required for this additional step is unnoticeable.
Logarithmic transformation improves the modeling of some responses, but there are a few that require an entirely different model.
In the case where linear, second order response surface equations prove to be inadequate for modeling some responses, artificial neural networks are tried. Artificial neural networks simulate the interaction
between neurons and consist of a set of hidden nodes that perform the calculations that transform inputs to outputs. One of the strengths of artificial neural networks is their ability to accurately model non-linear responses, a useful trait for responses that are not modeled well with linear responsesurface equations. The artificial neural networks are created through the use of a MA TlAB® script based tool developed at the ASDL. This tool , BRAINN, was created by Carl Johnson and Jeff Schutte, and it allows for the semi-automated creation of artificial neural networks. During the creation of the neural nets, the MFE and MRE distributions are tracked, and different combinations of hidden nodes and training times are tried. For this project, a large range of number of hidden nodes is tested with short training times. Based on the best number of nodes, the range of number of hidden nodes is narrowed down, the training time is steadily increased, and the process is repeated until the best number of hidden nodes is found. This best number of hidden nodes is used for the artifiCial neural network, and the model performance is checked with the same metrics used to check the performance of response surface equations.
Artificial neural networks are used to model the remaining responses, and the investigation of the performance of these surrogate models shows that they accurately predict the responses they model. With accurate surrogate models now ready to be used, work on integrating the models into a useful interface can begin.
2.3 The Conceptual Ship Design Interface
The surrogate models are used in the background of a graphical user interface, the Conceptual Ship Design Interface, or CSDI; this interface is used to allow a user to rapidly and easily define a design and receive outputs in real-time. The CSDI is written in JMp® scripting language, and it is a relatively straightforward process of linking the surrogate models into the

296
scripting framework. The challenge comes from creating a parametric method to define 3-D ship geometry. To create the parametric model, the ship was broken into three parts: the hull below the waterline, the hull above the waterline, and the superstructure.
The first section defined is the hull below the waterline. Three naval architecture coefficients are used to describe the hull : block, prismatic, and midship coefficients. The midship coefficient is the ratio of the hull cross-section area to a square area defined by the beam at the waterline and the draft; additionally , the midship coeffi cient is the resultant of the block coefficient divided by the prismatic coefficient. For the interface, the crosssection shape of the hull is a function of the beam, draft, and midship coefficient. Figure 4 shows the parameters used to define the underwater panels of the hull.
•
." ." .,
." Figure 4. Hullllllrllmelers.
" -" A"
In Figure 4, B is the beam of the vessel , T is the draft of the vessel , L1 and L2 are panel lengths, and 91 and 92 are shaping parameters. By analyzing the geometry, the panel lengths can be solved for in terms of the other.
( I)
(2)
Using Eq. (1) and Eq . (2,) it is possible to define the midship coefficient, or Cm, in terms of the panel lengths, shaping parameters, beam, and draft of the hull. For the CSDI , 91 is set at a constant fi ve degrees, and an algorithm iterates through values of 92 until the calculated value of the midship coefficient matches the specified value. The shaded areas in Figure 5 and Figure 6 show the different hull forms that can be created by using this method; in both figures , 91 is five degrees, and 92 is set to thirty five degrees and 85 degrees, respectively. For reference, the midship coefficient for the cross-section in Figure 5 is 0.523, and it is 0.912 for the cross-section in Figure 6.
Figure 3, coefficient.
The cross-section defined by the process detailed above is applied along the length of the ship, and since the panels are determined as a function of the beam, the cross-section is automatically sized for the local beam. The local beam is defined as a fraction of the largest, or in this case midship, beam. A theoretical hull design, inspired by the design of international frigates , is drawn up, and from this design, the beam fractions are measured. These beam fractions are then used to fit a model through the use of JMpo!\ and the resulting

297
equation is used to define the local beam length as a function of the fractional length along the hull at the waterline. A similar process is used to define the local beams of the hull at the top of the hull , but the theoretical hull shape is modified to account for flaring. At the current vers ion, the eSDI does not allow the user to modify the shape of the hull ; the hull is merely scaled up or down with the ship length, beam, and draft.
These local beam functions are used to define the hull panels below and above the waterline; however, there is a special consideration for the hull panels above the waterline. To allow for the lowering of the flight deck, some additional steps are required , First, the area of the flight deck is approximated as a trapezoid defined by the port and starboard edges of the flight deck and the forward and aft local beams of the flight deck. Since the hull along the flight deck and above the waterline is defined as a single panel , the trapezoidal approximation works well. With the flight deck area calculated, the maximum allowed amount of lowering is calculated. In order to account for performance changes due to the lowering of the flight deck, a hull volume margin is one of the variables used in the DoE. However, the maximum hull volume margin accounted could allow for different amounts of flight deck lowering based on the size of the flight deck. As a result, maximum amount of lowering must be recalculated whenever the flight deck length or ship size changes. Once the maximum is calculated, the input value of lowering is checked, and if it is less than the maximum allowed amount, the flight deck is lowered by that amount. Once the flight deck is lowered, however, it is no longer correct to use the top local beam function for the top of the lowered hull. To prevent rendering problems, the local beam values of the flight deck are interpolated betvveen the top local beam function value and waterline local beam function . Though doing so would be noticeable in the resultant visualization, there is actually little difference in the local beam created by this interpolation, and any
changes to the area of the fl ight deck due to the interpolation are not noted in future analyses.
With the hull completely defined, the last section of the ship to be modeled is the superstructure. The superstructure crosssection is trapezoidal , and though the user can input the superstructure height in the interface, the front surface area remains constant with respect to the height, though it can change as the local beam changes; this is to account for how SHOP5 models the front area of the superstructure, Once the front surface area is calculated, the length of the superstructure is calculated from the surrogate models. If this length is greater than sixty percent of the length of the ship at the waterline, the visualization program overrides this calculation and sets the superstructure length to sixty percent of the length of the ship at the waterline in order to prevent rendering problems. With these parameters now defined, the modeling of the superstructure begins,
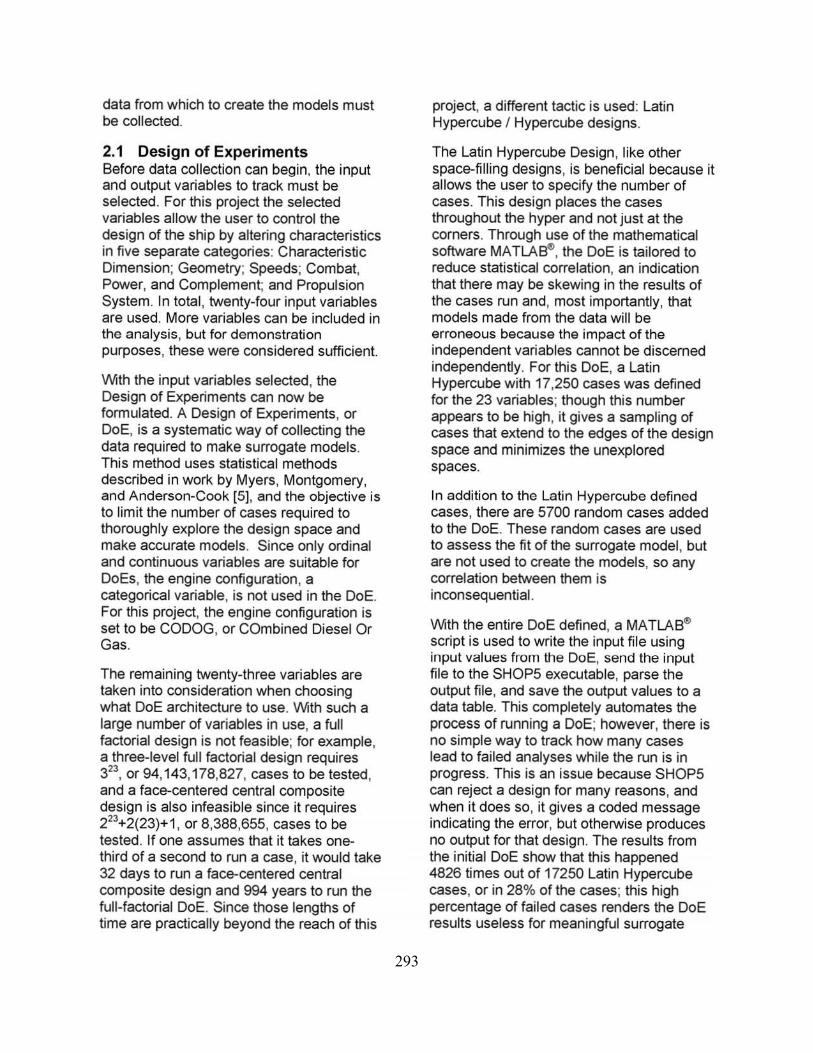
In the visualization, the superstructure is modeled 'backwards,' that is, from the back to the front. The back of the superstructure is defined to start at the forward end of the flight deck. This is done in consideration of the hangar, which must interact with the flight deck in a realistic design. Panels for the superstructure are then defined forwards until the superstructure reaches the previously defined length. On each end of the superstructure, a slight slope is added; to improve the aesthetics of the design. The superstructure is the last part of the ship to be modeled, and an example ship, as visualized in the eSDI , is presented as Figure 7.
298
Figure 7. EXllm l)le \'isualized Shil),
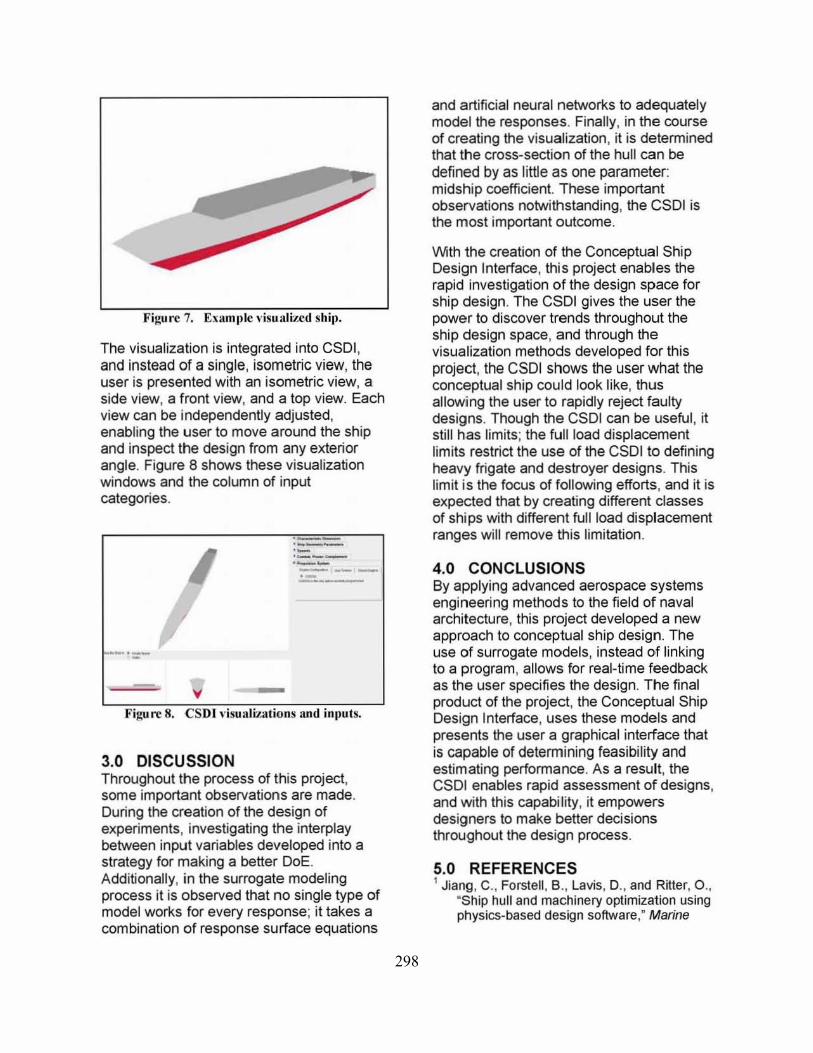
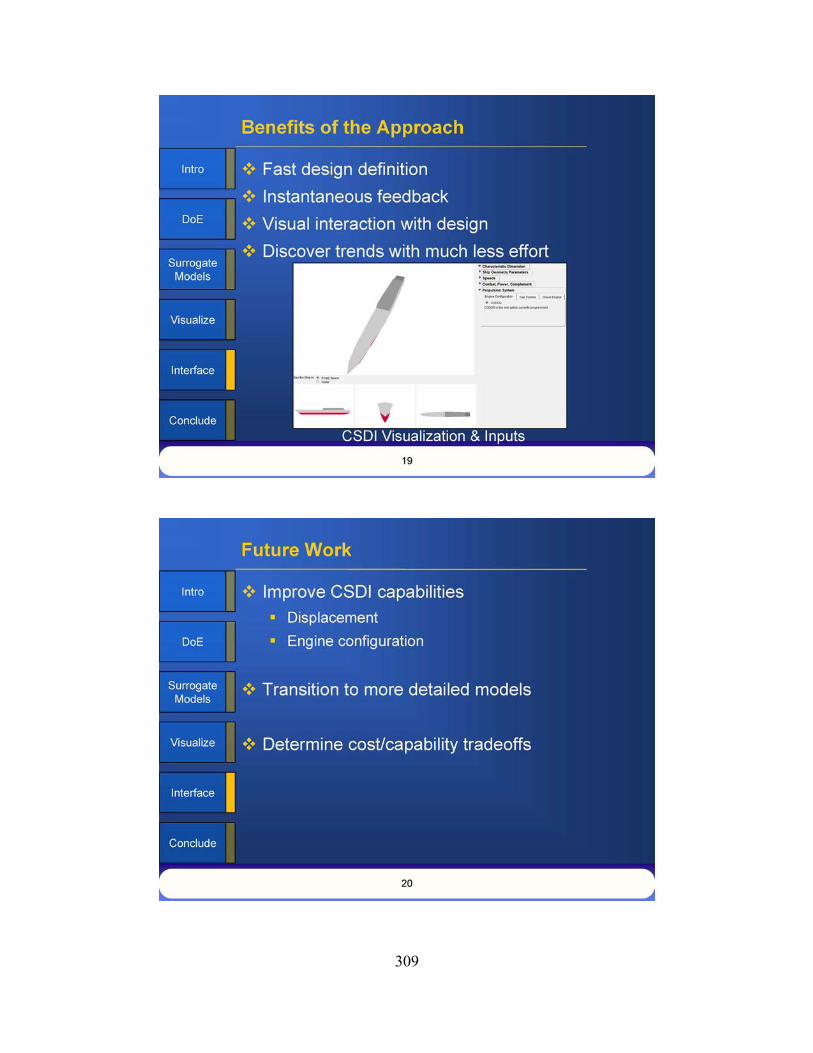
The visualization is integrated into eSDI , and instead of a single, isometric view, the user is presented with an isometric view, a side view, a front view, and a top view. Each view can be independently adjusted, enabling the user to move around the ship and inspect the design from any exterior angle. Figure 8 shows these visualization windows and the column of input categories.
. _._--'._--._--- .. _.---
Figure 8. eSDI \'isualizations and inl)utS.
3.0 DISCUSSION Throughout the process of this project, some important observations are made. During the creation of the design of experiments, investigating the interplay between input variables developed into a strategy for making a better DoE. Additionally, in the surrogate modeling process it is observed that no single type of model works for every response; it takes a combination of response surface equations
and artificial neural networks to adequately model the responses. Finally, in the course of creating the visualization, it is determined that the cross-section of the hull can be defined by as little as one parameter: midship coefficient. These important observations notwithstanding, the CSDI is the most important outcome.
With the creation of the Conceptual Ship Design Interface, this project enables the rapid investigation of the design space for ship design. The CSDI gives the user the power to discover trends throughout the ship design space, and through the visualization methods developed for this project. the CSDI shows the user what the conceptual ship could look like, thus allowing the user to rapidly reject faulty designs. Though the CSDI can be useful, it still has limits; the full load displacement limits restrict the use of the CSDI to defining heavy frigate and destroyer designs. This limit is the focus of following efforts, and it is expected that by creating different classes of ships with different ful l load displacement ranges will remove this limitation .
4.0 CONCLUSIONS By applying advanced aerospace systems engineering methods to the field of naval architecture, this project developed a new approach to conceptual ship design. The use of surrogate models, instead of linking to a program, allows for real-time feedback as the user specifies the design. The final product of the project, the Conceptual Ship Design Interface, uses these models and presents the user a graphical interface that is capable of detennining feasibility and estimating performance. As a resu lt, the CSDI enables rapid assessment of designs, and with this capabi lity, it empowers designers to make better decisions throughout the design process.
5.0 REFERENCES 1 Jiang, C., Forstell , B., Lavis , D. , and Ritter, 0 .,
·Ship hull and machinery optimization using physics-based design software,· Marine
299
Technology and SNAME News, Vol. 39, No. 2, Apr. 2002, pp. 109-117.
2 Baum, S. J., and Ramakrishnan , R , -Applying 3D product modeling technology to shipbuilding: Marine Technology and SNAME News, Vol. 34, No. 1, Jan. 1997, pp. 56·65.
3 Tumer, M., -Lessons Learned from the GE90 3D Full Engine Simulations: 48th AIAA Aerospace Sciences Meeting Including the New Horizons Forum and Aerospace Exposition . AIAA 2010-1606-796, AIM, Washington, DC, 2010, pp. 1-16.
4 McKesson , C. , ~The Utility of Very Simple Models for Very Complex Systems," 2010 International Simulation Mufticonference (CD-ROM), Ottawa, Ontario , 12-14 Jut 2010, pp. 181·187.
, Myers, R. H., Montgomery, D. C., Anderson
Cook, C. M., Response Surface Methodology: Process and Product Optimization Using Designed Experiments, 3rd ed ., John Wiley & Sons, Inc., Hoboken, New Jersey, 2009, Chaps. 7, 6.
6.0 ACKNOWLEDGMENTS The authors thank the Canad ian Navy, particularly LCdr Jacques Olivier and Mr. Sean Tobin, for their support of this project. The authors also thank Dr. James Colwell from Defence Research & Development Canada for sharing his SHOPS expertise with us.

300
301

302
303
304
305
306

307

308
309

310

311

312

313