21st century community learning center participation · 21st century community learning center...
TRANSCRIPT

21st Century Community Learning Center Participation:
The Student Experience—Program Year 2013-2014
AUGUST 2015
PREPARED FOR:
Tennessee Department of Education

21st Century Community Learning Center Participation:
The Student Experience—Program Year 2013-2014
AUGUST 2015
PREPARED FOR THE
Tennessee Department of Education
BY
Emily R. McCutcheon, MSW, MBA, LMSW

The Student Experience, Program Year 2013-2014– 21st CCLC Participation Report
ii University of Tennessee Social Work Office of Research and Public Service Contents
The University of Tennessee, Knoxville
College of Social Work Office of Research and Public Service
Karen Sowers, Dean
Maryanne Cunningham, Interim Director
The University of Tennessee, Knoxville, is an EEO/AA/Title VI/Title IX/Section 504/ADA/ADEA institution
in the provision of its education and employment programs and services. All qualified applicants will
receive equal consideration without regard to race, color, national origin, religion, sex, pregnancy,
marital status, sexual orientation, gender identity, age, physical or mental disability, or covered veteran
status.
In accordance with the requirements of Title VI of the Civil Rights Act of 1964, Title IX of the Education
Amendments of 1972, Section 504 of the Rehabilitation Act of 1973, and the Americans with Disabilities
Act of 1990, The University of Tennessee affirmatively states that it does not discriminate on the basis of
race, sex, or disability in its education programs and activities, and this policy extends to employment by
the University.
Inquiries and charges of violation of Title VI (race, color, national origin), Title IX (sex), Section 504
(disability), ADA (disability), Age Discrimination in Employment Act (age), sexual orientation, or veteran
status should be directed to the Office of Equity and Diversity (OED), 1840 Melrose Avenue, Knoxville,
TN 37996‐3560, telephone (865) 974‐2498 (V/TTY available) or 974‐2440. Requests for accommodation
of a disability should be directed to the ADA Coordinator at the Office of Equity and Diversity.
This project is funded through a contract with the Tennessee Department of Education and the
University of Tennessee, College of Social Work Office of Research and Public Service.
Contract #: 33109-00615
Project # 15050

The Student Experience, Program Year 2013-2014– 21st CCLC Participation Report
Contents University of Tennessee Social Work Office of Research and Public Service iii
Contents Contents ........................................................................................................................................... iii
List of Tables ..................................................................................................................................... iv
List of Figures ..................................................................................................................................... v
Executive Summary ............................................................................................................................1
Tennessee’s 21st Century Community Learning Centers: Key Findings Participation—Who and What .. 1
Conclusion .........................................................................................................................................5
Introduction ......................................................................................................................................6
Evaluation ................................................................................................................................................. 6
Organization of the Report ....................................................................................................................... 7
Methodology ............................................................................................................................................. 7
Findings .............................................................................................................................................8
Who Participated in the 21st CCLC Programs—The Students ................................................................... 8
Demographics ....................................................................................................................................... 8
Attendance ............................................................................................................................................ 9
What did the Overall Participation look like for PY13-14? ..................................................................... 12
What Activities did students experience in PY2013-2014? .................................................................... 12
Summary of Findings ........................................................................................................................ 24
Conclusion ....................................................................................................................................... 26
References ....................................................................................................................................... 27
Appendices ...................................................................................................................................... 28
Appendix A—Activity Families ................................................................................................................ 28
Appendix B—Contact Hours and Number of Students Participating ..................................................... 32
Appendix C—Median Contact Hours and Number of Students ............................................................. 34

The Student Experience, Program Year 2013-2014– 21st CCLC Participation Report
iv University of Tennessee Social Work Office of Research and Public Service Contents
List of Tables
Table 1. Percent of Students from Each Group Who Attend Regularly or Intensely ..................................... 2
Table 2. Activity with the Highest Median Contact Hours for Program Year 2013-14, by Grade Level ........ 5

The Student Experience, Program Year 2013-2014– 21st CCLC Participation Report
Contents University of Tennessee Social Work Office of Research and Public Service v
List of Figures
Figure 1. Percent of All Contact Hours Spent in Each Activity Family ........................................................... 3
Figure 2. Hours Students Spent in Academic Activities, PY13-14 ................................................................. 3
Figure 3. 21st CCLC Participant Grade Level (N = 23,928, 0 missing) ........................................................... 8
Figure 4. Program Type, by Attendance ..................................................................................................... 10
Figure 5. Grade Level, by Attendance ......................................................................................................... 10
Figure 6. Race/Ethnicity, by Attendance ..................................................................................................... 11
Figure 7. Years Attended, by Attendance ................................................................................................... 11
Figure 8. Percentage of Total Time Participants Spent in Activity Categories ............................................ 13
Figure 9. Percentage of Time Students Spent in Academic Activities ........................................................ 13
Figure 10. Percentage of Time Students Spent in Academic Enrichment Activities ................................... 14
Figure 11. Median Number of Academic Enrichment Contact Hours, by Grade Level .............................. 15
Figure 12. Percentage of Time Students Spent in Skills Practice/Homework Help Activities .................... 15
Figure 13. Median Number of Skills Practice/Homework Help Contact Hours, by Grade Level ................ 16
Figure 14. Percentage of Time Students Spent in Academic Remediation Activities ................................. 16
Figure 15. Median Number of Academic Remediation Contact Hours, by Grade Level............................. 17
Figure 16. Percentage of Time Students Spent in State Test Prep Activities .............................................. 17
Figure 17. Median Number of State Test Prep Contact Hours, by Grade Level ......................................... 18
Figure 18. Percentage of Time Students Spent in Recreational Activities .................................................. 19
Figure 19. Median Number of Recreational Contact Hours, by Grade Level.............................................. 19
Figure 20. Percentage of Time Students Spent in Creative Arts Activities ................................................. 20
Figure 21. Median Number of Creative Arts Contact Hours, by Grade Level ............................................. 21
Figure 22. Percentage of Time Students Spent in Interpersonal Enrichment Activities ............................. 21
Figure 23. Median Number of Interpersonal Enrichment Contact Hours, by Grade Level ........................ 22
Figure 24. Percentage of Time Students Spent in Counseling and Mentoring Activities ........................... 23
Figure 25. Median Number of Counseling and Mentoring Contact Hours, by Grade Level ....................... 23
The Student Experience, Program Year 2013-2014– 21st CCLC Participation Report
Executive Summary University of Tennessee Social Work Office of Research and Public Service 1
Executive Summary
Tennessee’s 21st Century Community Learning Centers: Key Findings
Participation—Who and What
As part of an ongoing statewide evaluation of 21st Century Community Learning Centers programs (21st CCLC), University of Tennessee, Knoxville, Social Work Office of Research and Public Service (UT SWORPS) evaluators examined data entered into a web-based attendance and participation tracking program. Site coordinators logged demographic information about the students enrolled in their afterschool programs (ASP) and then tracked the amount of time those students spent in various activities at the afterschool programs. This is the second participation report generated; the first examined data from the 2011-2012 Program Year (PY11-12), whereas the current report examines Program Year 2013-2014 (PY13-14). The following key findings stand out from the analysis of those data.
The 23,928 students who participated in the 21st CCLC program in PY13–14 were
• Evenly split between boys and girls: 49.5% and 50.5%, respectively; • Mostly White: 71.4%, 20.9% were Black/African American, and 6.9% identified as
Hispanic/Latino; • 10.8 years old on average: The students were between 1 and 19 years old; • Most frequently in grades 3–5: 40.0%, 27.1% were in grades K–2, 22.4% were in grades 6–8, and
10.1% were in grades 9–12; • Mostly attending programs operated by LEAs: 92.7%; • In their first year at their current center: 46.0%; and • Attending regularly: 54.0% attended 30 or more days, 29.6% attended 60 or more days.
Despite a notable decline of almost 3,000 students in the number of students served from PY11-12, the
demographic breakdown of participants remained largely unchanged. Students are slightly younger (in
PY11-12 average age was 11.6), less likely to be in their first year (first year attendees comprised 59.2%
of those enrolled in PY11-12), but also less likely to attend regularly (60.4% attended 30 or more days
and 43.3% attended 60 or more days in PY11-12).

The Student Experience, Program Year 2013-2014– 21st CCLC Participation Report
2 University of Tennessee Social Work Office of Research and Public Service Executive Summary
Some groups of students were more likely to be regular (30+ days) or intense (60+ days) attendees than
their counterparts. The largest proportion is bolded in each participation range in the table below.
Table 1. Percent of Students from Each Group Who Attend Regularly or Intensely
30+ Days 60+ Days
Students Who Have Attended for More Years Are More Likely to Attend Regularly or Intensely
1 year 51.0% 24.7%
2 years 54.3% 30.7%
3 years 59.3% 36.1%
4 years 63.0% 44.5%
5 years 58.7% 46.2%
Younger Students Are More Likely to Attend Regularly or Intensely
K-2 56.3% 32.9%
3-5 61.3% 31.8%
6-8 35.6% 29.3%
9-12 22.0% 13.0%
Students of Color are More Likely to Attend Regularly or Intensely
Black/African American 65.1% 36.8%
Hispanic/Latino 62.0% 30.4%
Other/Unknown 58.3% 29.0%
White 49.8% 27.4%
Students Enrolled in CBO Programs Are More Likely to Attend Regularly or Intensely
LEA 52.7% 27.9%
CBO 69.7% 51.8%
Students in 21st CCLC Programs received more than 2.15 million contact hours1 in PY13-14. While these
hours fell into five activity families2, the vast majority of those hours were spent in Academic activities.
1 For this and the previous report, “contact hours” is defined as the total number of hours experienced by all students participating in a 21st
CCLC program. For example, if one ASP was open for two hours one afternoon and offered one hour of Academic Enrichment in Math and one hour of Arts and Recreation playing board games, and 20 students attended both activities, the total number of contact hours would be 40 (1 hour*20 students + 1 hour*20 students = 40 contact hours)—20 in in Academics and 20 in Arts and Recreation.
2 Activities in this report are organized slightly differently from the groupings found in the online 21st CCLC Attendance Tracking Site. See
Appendix A for a complete listing.

The Student Experience, Program Year 2013-2014– 21st CCLC Participation Report
Executive Summary University of Tennessee Social Work Office of Research and Public Service 3
Figure 1. Percent of All Contact Hours Spent in Each Activity Family
The Academic hours fell into four subcategories (Skills Practice/Homework Help, Academic Enrichment, Remedial Education, and State Test Prep), each with activities focusing on different subjects. State Test Prep subcategories differed from the other families in that they identify the test for which the student is preparing. Almost three fourths of student hours in State Test Prep were devoted to TCAP Preparation. Among the other families, Math, Reading/Language Arts, and Other subjects were consistently the activities with the most contact hours.
Figure 2. Hours Students Spent in Academic Activities, PY13-14
1.4%
7.2%
9.3%
28.0%
54.1%
0.0% 10.0% 20.0% 30.0% 40.0% 50.0% 60.0%
Counseling and Mentoring
Interpersonal Enrichment
Creative Arts
Recreation
Academics
Percent of All Contact Hours Spent in Each Activity Family
0.00
20,000.00
40,000.00
60,000.00
80,000.00
100,000.00
120,000.00
140,000.00
160,000.00
Academic Enrichment Skills Practice Remedial Education
Hours Students Spent in Academic Activities, PY13-14
Math Reading/ Language Arts Other

The Student Experience, Program Year 2013-2014– 21st CCLC Participation Report
4 University of Tennessee Social Work Office of Research and Public Service Executive Summary
Among the other Activity Families, certain activities dominated the distribution of contact hours.
• The Recreational activity Nutritious Snack/Meal had the most contact hours overall—203,247 hours in PY13-14. This outcome is a drastic change from PY11-12 when this activity had logged a total of only 2,100 hours all year.
• The Creative Arts catchall activity of Arts & Crafts had the most contact hours of the activity family, with 82,264.
• Computer/Technology dominated the Interpersonal Enrichment family with students devoting 44,472 contact hours in PY13-14.
• The top Counseling and Mentoring activity was Character Education, although it was the 24th most attended activity overall. Students spent 19,765 hours in Character Education activities in PY13-14.
The popularity of Nutritious Snack/Meal was the only change in the top activity in each family from PY11-12.
To determine if there were differences in the type of participation across grade levels, the median contact hours in each activity were calculated. Median (the middle number in a dataset) is reported instead of an average due to the existence of outliers in the dataset. The activity with the highest median contact hours frequently differed by grade level (in bold in Table 2).

The Student Experience, Program Year 2013-2014– 21st CCLC Participation Report
Executive Summary University of Tennessee Social Work Office of Research and Public Service 5
Table 2. Activity with the Highest Median Contact Hours for Program Year 2013-14, by Grade Level
(Median Contact Hours in the Activity) Grades K-2 Grades 3-5 Grades 6-8 Grades 9-12
Academic Enrichment
Reading/ Language Arts
(11.0)
Reading/ Language Arts
(9.6)
Science (7.0)
Math (5.5)
Skills Practice Other Academic Subjects
(15.8)
Reading/ Language Arts
(11.5)
Other Academic Subjects
(14.1)
Other Academic Subjects
(4.0)
Remedial Education
Other Academic Subjects
(24.0)
Other Academic Subjects
(48.0)
Other Academic Subjects
(14.3)
Other Academic Subjects
(4.3)
State Test Prep TCAP Prep
(11.75) TCAP Prep
(11.0)
Credit Recovery History/Math—
Tie (20.0)
Credit Recovery—Science (20.0)
Recreation Nutritional Snacks/Meals
(15.5)
Nutritional Snacks/Meals
(14.7)
Nutritional Snacks/Meals
(12.3)
Structured Fitness (36.0)
Creative Arts Arts & Crafts ( 8.1)
Arts & Crafts (6.8)
Other (4.5)
Drama (36.0)
Interpersonal Enrichment
Computer/ Technology
(7.0)
Field Trips (8.8)
Field Trips (7.0)
Health Education (70.0)
Counseling and Mentoring Conflict Resolution
(8.3)
Character Education and
Conflict Resolution —Tie (5.0)
Drug Prevention (3.0)
Character Education
(14.9)
Conclusion Students in 21st CCLC afterschool programs have participated in a variety of activities that address the educational, emotional, creative, and health needs of the individual. The main focus is academic, through Homework Help, Remediation, Test Prep, and Enrichment activities. However, students also participate in Physical Recreation, Creative Arts, and Counseling activities. Some differences appear among groups, and site coordinators may want to look at their individual programs to determine whether any steps could be taken to address the differences in the amount of time students spend in various activities. Although participation and attendance decreased between PY11-12 and PY13-14, thousands of students continue to experience millions of hours of activities they likely otherwise would not without the 21st CCLC afterschool programs.

The Student Experience, Program Year 2013-2014– 21st CCLC Participation Report
6 University of Tennessee Social Work Office of Research and Public Service Introduction
Introduction For the past 18 years, children in Tennessee have had the opportunity to attend afterschool programs
funded by the 21st Century Community Learning Center (21st CCLC) initiative. When the program was
first created, grantees were selected directly by the U.S. Department of Education, with a preference
given to programs operating in high-poverty areas. The purpose of the program was to improve
academic performance, offer enrichment opportunities, and open schools up to the larger community.
In 2001, the program structure changed to one of awarding formula grants to the states, which were
then responsible for selecting grantees. While the purpose of the program remained the same, the focus
shifted to targeting academically at-risk students and those at low-performing schools.
Since taking over grant administration in 2001, the Tennessee Department of Education (TDOE) has
awarded grants to programs operated by local educational entities (LEAs) and community-based
organizations (CBOs), which also include clubs and faith-based organizations. TDOE gives primary
consideration to grant applicants which serve students in grades Pre-K-12 who attend schools with a
high concentration of low-income families and attend schools that have not made Adequate Yearly
Progress (AYP) for 2 consecutive years. Services may also be provided to the family members of these
students.
Evaluation
In 2009 the TDOE partnered with the University of Tennessee, Knoxville, Social Work Office of Research
and Public Service (UT SWORPS) to conduct a state-level evaluation of the 21st CCLC program. These
evaluation activities were broken into two studies: Implementation and Outcome (for specific
information on the evaluation’s objectives, research questions, design, and phases, see McCutcheon,
Hadjiharalambous, Myers, & Homer, 2010). This report is part of the Outcome Study series and
comprises an analysis of student demographic and program participation data to describe participation
patterns. The current report is the second in the series to describe these patterns; the first was
published in April 2013, and covered Program Year 2011-2012 (see McCutcheon & Homer, 2013). As
with the first report, the questions the current report answers are
Who is attending the 21st CCLC programs? What is the demographic profile of participants?
Are some students more likely to participate regularly than others?
What activities are students experiencing? In which activities are they participating most often?
Are some students more likely to participate in certain activities than others?
In addition to the above questions, the current report examines changes in participation from the
previous to the current report.

The Student Experience, Program Year 2013-2014– 21st CCLC Participation Report
Introduction University of Tennessee Social Work Office of Research and Public Service 7
Organization of the Report
The next section of the report outlines the Methodology used to collect and analyze the student
participation data. The Findings sections details the demographics of the students served, attendance,
and the activities in which they participated. A Summary of Findings and Conclusions follow.
Methodology
The data source for this report is the online 21st CCLC Attendance Tracking Site (hereinafter referred to
as “web-app”). Beginning in the fall of 2010, 21st CCLC programs began entering student demographic,
attendance, and participation information in this online database developed by the UT SWORPS
Information Technology team. Site coordinators of 21st CCLC programs, or their agents, enrolled
students in their programs by entering the student’s name, state-issued ID number, date of birth, grade
level, enrollment date (when they began attending the 21st CCLC program), sex, and race/ethnicity. Site
coordinators then tracked the student’s daily attendance and participation in the 21st CCLC web-app.
Attendance was noted by marking the students as present for the day and noting the total amount of
time spent at the afterschool program. Participation, however, required the site coordinator to note
what activities the students experienced for the duration of their time in the 21st CCLC program.
Activities were predefined, and the site coordinator chose from lists of academic, recreational, creative,
enrichment, and mentoring activities, indicating the length of time (in hours and minutes) the student
participated in each activity. If a student stopped attending the program, the site coordinator
“terminated” the student in the database by providing a date and reason the student was no longer
enrolled.
In April 2015, a member of the UT SWORPS Information Technology team downloaded the participation
data for all students between August 2013 and July 2014 from the 21st CCLC web-app. The data included
the student’s ID number, center, race, sex, age, grade, and years participated (based on enrollment date
and either the termination date or the date the data were downloaded if the student was still an active
participant). The download also included the number of hours the student spent in any activity during
each month of the 2013-2014 program year (PY13-14). These data were sent to a UT SWORPS evaluator
who reviewed the data for accuracy and removed obviously incorrect information (e.g., If a student’s
age was reported as 20 years or more, the “age” was treated as “missing”). The IT team member then
calculated regular attendance (students with participation data for 30 or more days and 60 or more
days), monthly activity totals, overall activity totals, median contact hours, and activity totals based on
the students’ demographic characteristics (grade, race, sex, organization type [LEA or CBO], length of
participation, and regular attendance). Descriptions of the students and the activities in which they
participated follow.

The Student Experience, Program Year 2013-2014– 21st CCLC Participation Report
8 University of Tennessee Social Work Office of Research and Public Service Findings
Findings
Who Participated in the 21st CCLC Programs—The Students
Demographics
The analysis of the demographic data that site coordinators entered in the web-app revealed that an
even mix of boys and girls comprised the 23,928 students participating in 21st CCLC programs in PY13-
14 (50 missing data on students’ sex):
• 50.5% (12,049) were female
• 49.5% (11,829) were male
The majority of participants were White (312 missing race/ethnicity data):
• 71.4% (16,853) were White
• 20.9% (4,933) were Black/African American
• 6.9% (1,622) were Hispanic/Latino
Students ranged in age from 1 to 19 and had an average age of 10.8 years (29 missing). The largest
percentage (more than 40.0%) were in grades 3-5 (0 missing):
Figure 3. 21st CCLC Participant Grade Level (N = 23,928, 0 missing)
K-2, 27.2%
3-5, 40.2%
6-8, 22.5%
9-12, 10.2%
Participant Grade Level

The Student Experience, Program Year 2013-2014– 21st CCLC Participation Report
Findings University of Tennessee Social Work Office of Research and Public Service 9
Most participants (92.7%, 22,187) attended a program operated by an LEA (0 missing). Almost half of
the students (46.0%) attending during PY13-14 were in their first year of participation in the 21st CCLC
program (0 missing):
• 46.0% (11,006) had attended for 1 year
• 33.2% (7,933) had attended for 2 years
• 14.3% (3,427) had attended for 3 years
• 5.3% (1,269) had attended for 4 years
• 1.2% (288) had attended for 5 years
Changes in Demographics from the Previous Report
While almost 3,000 fewer students were enrolled in PY13-14 than in PY11-12, the sex and racial/ethnic
makeup of the enrolled students did not change markedly. The average age of students decreased by 8
months. Only part of this change is explained by the recent inclusion of Pre-K participants in 21st CCLC
programs. Along these same lines, while the majority of participants were in grades 3-5, the proportion
of students enrolled who were in grades K-2 increased by 5 percentage points. Students attending LEA
programs again dominated enrollment (90.7% in PY11-12 compared to 92.7% in PY13-14). First-year
participants were again the largest proportion of attendees in ASPs. This may hint at a retention
problem for ASPs and bears further investigation.
Attendance
While outcomes will be examined and linked to levels of attendance in future reports, a description of
students who did attend regularly, and any differences from all attendees, follow here. Overall, the
majority of students in Tennessee’s 21st CCLC programs attended regularly:
• During PY13-14, 54.0% (12,916) of participants attended 30 or more days (0 missing),
54.8% of those (7,084) attended 60 or more days; however,
These 7,084 students represent only 29.6% of all attendees, meaning
more than two thirds of all participants attended fewer than 60 days in PY13-14.
These numbers are much lower than in the previous report, which found that more than 60.0%
attended more than 30 days and 43.3% attended 60 or more days.
Attendance was analyzed by certain demographic characteristics to determine if the makeup of students
who attended regularly (30 or more days) or intensely (60 or more days) differed from the makeup of all
attendees. As with the previous report, little difference was revealed between boys and girls: 53.0% of
all girls attended 30 or more days, whereas 55.0% of all boys attended 30 or more days. The
percentages are even closer at the 60 or more day mark, with 29.1% of all girls and 30.2% of all boys
attending 60 or more days.
The Student Experience, Program Year 2013-2014– 21st CCLC Participation Report
10 University of Tennessee Social Work Office of Research and Public Service Findings
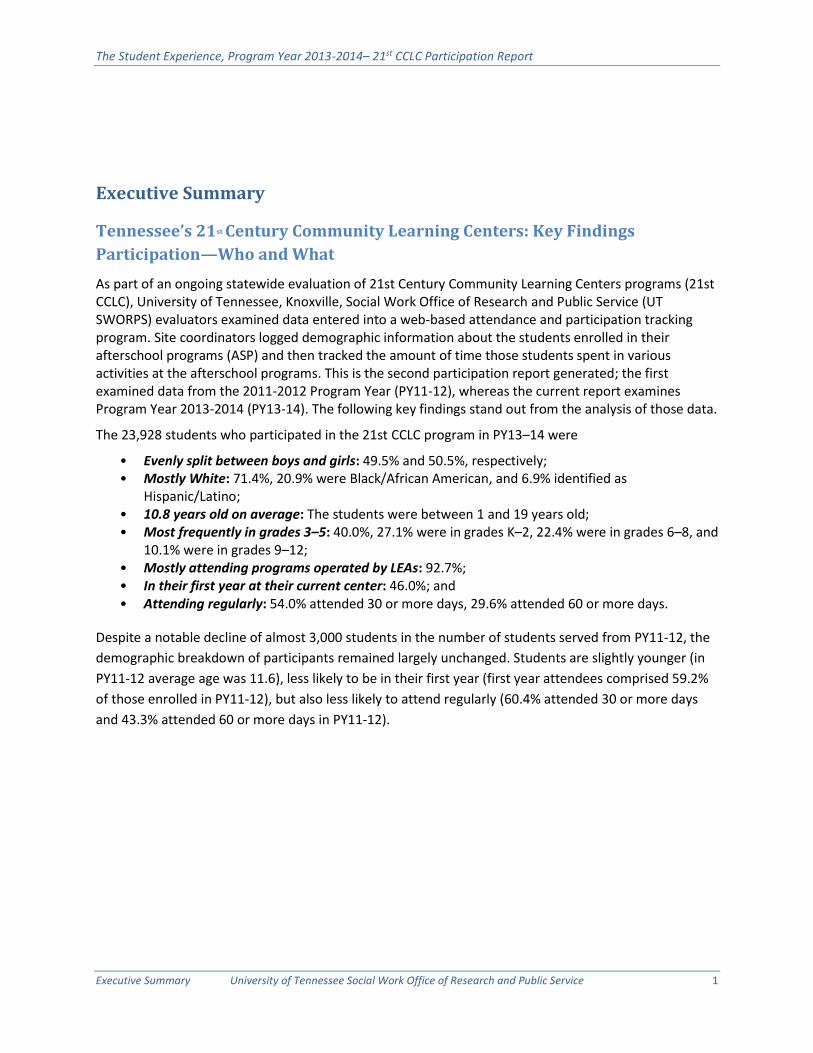
Some notable findings appeared from the analysis of attendance by program type. For example,
students who attended CBOs were much more likely to attend their programs regularly. As Figure 4
shows, they were almost twice as likely to attend their ASP intensely.
All Attendees, N = 23,928 (0 missing); Regular Attendees at 30+ Days n = 12,916 (0 missing);
Regular Attendees at 60+ days, n = 7,084 (0 missing)
Figure 4. Program Type, by Attendance
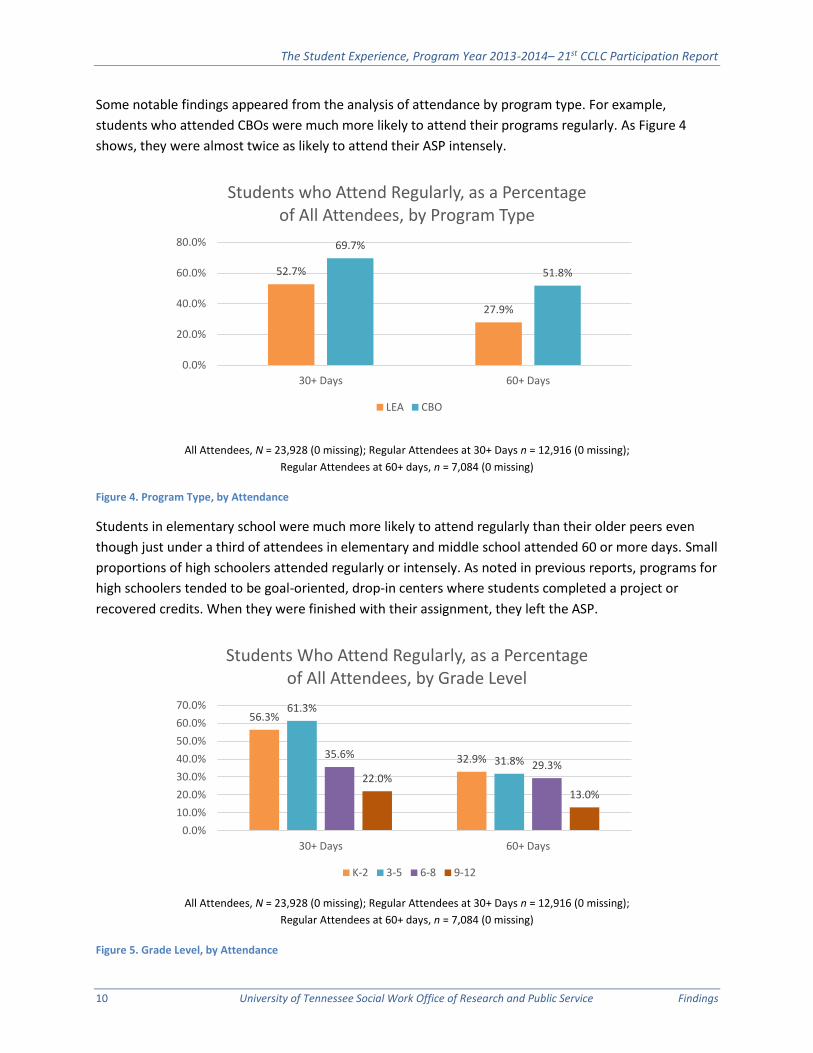
Students in elementary school were much more likely to attend regularly than their older peers even
though just under a third of attendees in elementary and middle school attended 60 or more days. Small
proportions of high schoolers attended regularly or intensely. As noted in previous reports, programs for
high schoolers tended to be goal-oriented, drop-in centers where students completed a project or
recovered credits. When they were finished with their assignment, they left the ASP.
All Attendees, N = 23,928 (0 missing); Regular Attendees at 30+ Days n = 12,916 (0 missing);
Regular Attendees at 60+ days, n = 7,084 (0 missing)
Figure 5. Grade Level, by Attendance
52.7%
27.9%
69.7%
51.8%
0.0%
20.0%
40.0%
60.0%
80.0%
30+ Days 60+ Days
Students who Attend Regularly, as a Percentage of All Attendees, by Program Type
LEA CBO
56.3%
32.9%
61.3%
31.8%35.6%
29.3%22.0%
13.0%
0.0%
10.0%
20.0%
30.0%
40.0%
50.0%
60.0%
70.0%
30+ Days 60+ Days
Students Who Attend Regularly, as a Percentage of All Attendees, by Grade Level
K-2 3-5 6-8 9-12

The Student Experience, Program Year 2013-2014– 21st CCLC Participation Report
Findings University of Tennessee Social Work Office of Research and Public Service 11
Black/African American students were more likely to attend regularly and intensely in PY13-14 than
students in any other racial/ethnic group. Conversely, White students were the least likely group to
attend at these levels.
All Attendees, N = 23,616 (312 students missing race/ethnicity data); Regular Attendees at 30+ Days n = 12,836 (80 missing);
Regular Attendees at 60+ days, n = 7,004 (80 missing)
Figure 6. Race/Ethnicity, by Attendance
The PY13-14 findings support the logical conclusion that continued program attendance over the years
correlates with regular attendance. Students who were in their fourth year at their ASPs were the most
likely to attend regularly and those in their fifth year were most likely to attend intensely.
All Attendees, N = 23,928 (0 missing); Regular Attendees at 30+ Days n = 12,916 (0 missing);
Regular Attendees at 60+ days, n = 7,084 (0 missing)
Figure 7. Years Attended, by Attendance
65.1%
36.8%
62.0%
30.4%
49.8%
27.4%
58.3%
29.0%
0.0%
10.0%
20.0%
30.0%
40.0%
50.0%
60.0%
70.0%
30+ Days 60+ Days
Students Who Attend Regularly, as a Percentage of All Attendees, by Race/Ethnicity
Black/African American Hispanic/Latino White Other/Unknown
51.0%
24.7%
54.3%
30.7%
59.3%
36.1%
63.0%
44.5%
58.7%
46.2%
0.0%
10.0%
20.0%
30.0%
40.0%
50.0%
60.0%
70.0%
30+ Days 60+ Days
Students Who Attend Regularly, as a Percentage of All Attendees, by Years Attended
1 year 2 years 3 years 4 years 5 years

The Student Experience, Program Year 2013-2014– 21st CCLC Participation Report
12 University of Tennessee Social Work Office of Research and Public Service Findings
Changes in Attendance from the Previous Report
As noted earlier, the overall numbers represent a slight decrease in regular attendance from the
previous report. In PY11-12, more than 60.0% of all participants attended 30 or more days, and more
than 43.0% attended 60 or more days, compared to 54.0% and 29.6%, respectively, in PY13-14.
The proportions and attendance patterns were generally unchanged for students in the demographic
analysis. While a smaller proportion of students attended regularly in PY13-14 than in PY11-12, the
groups most likely to attend regularly (students attending CBOs, elementary schoolers, Black/African
Americans) remained the same.
What did the Overall Participation look like for PY13-14?
Tennessee students participated in more than 2.16 MILLION CONTACT HOURS of afterschool activities3
in PY13-14 through 21st CCLC programs. Collectively, students experienced a little less than 180,000
hours of activities each month.
Centers logged the fewest hours in July—just over 30,000.
This finding is likely the result of most centers closing for either the entire summer or for
a few weeks of planning time prior to the start of the school year.
The most hours were logged in April (almost 275,000); October was second (just under
269,000).
The increase in April may be a result of TCAP preparation or students attempting to catch up on missed
assignments before the end of the school year.
What Activities did students experience in PY2013-2014?
By far, Academic activities comprised the majority of the hours students in Tennessee experienced in
PY13-14.4 Students participated in more than 1.15 million hours of Academic activities in PY13-14,
which is almost a quarter of a million fewer hours than students spent in Academic activities in PY11-12.
This finding may be due to the fact that fewer students were enrolled in ASPs overall. Academic
activities included Skills Practice/Homework Help, Academic Enrichment, State Test Prep, and
Remediation in subjects such as math, science, reading/language arts, and others. Recreational activities
were the next most common, but made up only 28.0% of all afterschool hours students experienced.
This is an increase in proportion from the previous report. Board Games, Computer Games, and
Unstructured Time for Physical Play are a few of the Recreational activities centers offered. Creative Arts
and Interpersonal Enrichment each comprised less than 10.0% of the activity hours. A mere 1.4% of all
3 For this and the previous report, “contact hours” is defined as the total number of hours experienced by all students participating in a 21st
CCLC program. For example, if one ASP was open for two hours one afternoon and offered 1 hour of Academic Enrichment in Math and 1 hour of Arts and Recreation playing board games and had 20 students attend both activities, this would represent 40 contact hours (1 hour*20 students + 1 hour*20 students = 40 contact hours), 20 in in Academics and 20 in Arts and Recreation.
4 Activities in this report are organized slightly differently from the groupings found in the web-app. See Appendix A for a complete listing.

The Student Experience, Program Year 2013-2014– 21st CCLC Participation Report
Findings University of Tennessee Social Work Office of Research and Public Service 13
afterschool hours students experienced were in Counseling and Mentoring Activities. The proportion of
time students spent in Creative Arts, Interpersonal Enrichment, and Counseling and Mentoring Activities
was similar to the data reported for PY11-12.
Figure 8. Percentage of Total Time Participants Spent in Activity Categories
What ACADEMIC ACTIVITIES did students experience in PY13-14?
Academic activities fall into four categories: Skills Practice/Homework Help, Academic Enrichment, State
Test Prep, and Remedial Education. Within each of these categories, the suboffering is identified either
by the subject (i.e., math, reading/language arts, etc.) or by the type of preparation (Gateway exams,
TCAPs, etc.). As Figure 9 clearly shows, the majority of student time (75.6%) was spent in Academic
Enrichment and Skills Practice/Homework Help activities. However, this finding represents a
proportional decrease from the previous report, which stated that more than 80.0% of student hours
were spent in these activities. The shift was toward Remedial Education activities, which had comprised
only 12.8% of all academic contact hours; however, in this analysis, they comprised a total of 22.6% of
all academic contact hours.
Figure 9. Percentage of Time Students Spent in Academic Activities
1.4%
7.2%
9.3%
28.0%
54.1%
0.0% 10.0% 20.0% 30.0% 40.0% 50.0% 60.0%
Counseling and Mentoring
Interpersonal Enrichment
Creative Arts
Recreation
Academics
Percent of All Contact Hours Spent in Each Activity Family
Skills Practice/ Homework Help
(37.0%)
Academic Enrichment(38.6%)
Remedial Education
(21.6%)
State Test Prep(2.9%)
Academic Activities

The Student Experience, Program Year 2013-2014– 21st CCLC Participation Report
14 University of Tennessee Social Work Office of Research and Public Service Findings
Of these four categories, students spent the most time in Academic Enrichment activities: 38.6% of all
Academic hours (442,065 total hours). Reading/Language Arts was the most common subject covered in
these sessions, with just under a third of the Academic Enrichment hours spent in this subject.
Figure 10. Percentage of Time Students Spent in Academic Enrichment Activities
Figure 11 reports the median number of contact hours that students experienced in each of the
Academic Enrichment activities, broken out by age group.5 The median number of hours spent in
Academic Enrichment activities indicates that students in grades K-2 spent most of their time in
Reading/Language Arts activities; however, they also spent much more time in activities that provide
assistance to students with Limited English Proficiency than their older peers. This finding could indicate
a greater need in that age group or an imbalance in the availability of programing for older students.
Students in grades 3-5 spent the most time in Reading/Language Arts and Math activities. Middle
schoolers spent most Academic Enrichment time in Science activities, which, because it is not a subject
that is tested, can fall by the wayside during the regular school day, per information obtained during site
visits. For high schoolers, the analysis revealed a fairly even distribution of median contact hours across
academic activities.
5 Median (the middle number in a dataset) is reported due to the existence of outliers in the dataset.
Reading / Language Arts (30.6%)
Math (29.1%)
Other Academic Enrichment
Programs (23.2%)
Science (15.7%)
Limited English Proficiency
(1.4%)
Academic Enrichment Hours

The Student Experience, Program Year 2013-2014– 21st CCLC Participation Report
Findings University of Tennessee Social Work Office of Research and Public Service 15
Figure 11. Median Number of Academic Enrichment Contact Hours, by Grade Level
Students spent 423,904 hours in Skills Practice/Homework Help activities (37.0% of all Academic hours).
While students experienced more hours of Other Academic activities than any other Skills
Practice/Homework Help activity, Reading/Language Arts was a close second, as it was in PY11-12.
However, fewer individual students participated in these Other Academic Activities than in
Reading/Language Arts.
Figure 12. Percentage of Time Students Spent in Skills Practice/Homework Help Activities
10
.0
2.0
1.5
1.0
9.0 9
.5
5.8
5.5
8.3
6.4
5.0
4.5
11
.0
9.6
4.5
4.0
6.8
6.5 7
.0
3.0
0.0
2.0
4.0
6.0
8.0
10.0
12.0
Grades K-2 Grades 3-5 Grades 6-8 Grades 9-12
Median Number of Academic Enrichment Contact Hours, by Grade Level
Limited English Proficiency Math Other Academic Subjects
Reading / Language Arts Science
Other Academic Subjects (35.0%)
Reading / Language Arts (31.3%)
Math (27.2%)
Science (4.4%)
Limited English Proficiency (1.8%)
Special Needs (0.3%)Skills Practice Hours

The Student Experience, Program Year 2013-2014– 21st CCLC Participation Report
16 University of Tennessee Social Work Office of Research and Public Service Findings
For all age groups, the medians align with the proportions of hours spent overall and indicate that
students spent most of their skills practice time in Math, Reading/Language Arts, or Other Academic
Subjects. Middle Schoolers was the only group that did not have the highest median in Other Academic
Subjects.
Figure 13. Median Number of Skills Practice/Homework Help Contact Hours, by Grade Level
Students spent 21.6% of their Academic hours in Remedial Education activities, a 69.0% increase from
PY11-12. Even though total contact hours decreased, students spent almost 70,000 MORE hours in
Remedial Education Activities in PY13-14 than they did in PY11-12. This finding may be indicative of 21st
CCLC programs specializing—targeting their efforts to those who have the greatest academic needs.
Other Remedial Education was by far the activity with the highest number of hours in this category,
comprising more than half of all student contact hours.
Figure 14. Percentage of Time Students Spent in Academic Remediation Activities
2.0
1.0
3.1
1.5
9.0 10
.3
8.5
2.0
15
.8
8.5
14
.1
4.0
12
.0
11
.5
8.3
2.0
3.5
3.9
3.0
2.0
2.0
2.0
1.0
2.0
0.0
5.0
10.0
15.0
20.0
Grades K-2 Grades 3-5 Grades 6-8 Grades 9-12
Median Number of Skills Practice/Homework Help Contact Hours, by Grade Level
Limited English Proficiency Math Other Academic Subjects
Reading / Language Arts Science Special Needs
Other Remedial Education (52.4%)
Reading / Language Arts (23.5%)
Math (21.6%)
Science(2.2%)
Limited English Proficiency
(0.3%)
Academic Remediation Hours

The Student Experience, Program Year 2013-2014– 21st CCLC Participation Report
Findings University of Tennessee Social Work Office of Research and Public Service 17
Because students spent the majority of their time in Other Remedial Education activities, it follows that
this activity had the highest median number of contact hours across all grade levels.
Figure 15. Median Number of Academic Remediation Contact Hours, by Grade Level
The final Academic activity category was State Test Prep, and students spent more than 33,000 hours
(2.9%) in these activities. This figure represents a proportional decrease from the PY11-12 report, which
showed that students spent 5.3% of their total contact hours in State Test Prep. Because the activity
fields have changed since the PY11-12 report, no comparison can be made regarding the specific
activities in which students participated. In PY13-14, almost three fourths of all State Test Prep contact
hours were spent in TCAP Preparation.
Figure 16. Percentage of Time Students Spent in State Test Prep Activities
24.0
48.0
14.3
4.3
0.0
10.0
20.0
30.0
40.0
50.0
Grades K-2 Grades 3-5 Grades 6-8 Grades 9-12
Median Number of Academic Remediation Contact Hours, by Grade Level
Limited English Proficiency Math Other Academic Subjects
Reading / Language Arts Science
ACT / SAT Preparation (10.0%)
Other (6.6%)
Credit Recovery - Math, (3.5%)
Credit Recovery - Science (2.7%)
Credit Recovery - Reading / Lang. Arts (1.8%)
Gateway / End of Course Exams - Science (1.3%)
Credit Recovery - History (0.7%)
Gateway / End of Course Exams – Math (0.1%)
Gateway / End of Course Exams – Reading / Lang. Arts (0.1%)
TCAP Preparation(73.4%)
Academic Enrichment Hours

The Student Experience, Program Year 2013-2014– 21st CCLC Participation Report
18 University of Tennessee Social Work Office of Research and Public Service Findings
The median analysis indicates that while the majority of time students spent in State Test Prep Activities
was in TCAP Preparation, the amount of time was spread across a large number of students (1,998).
Although only between 12-40 students total attended a credit recovery activity in Math, Science, or
History, they spent a lot more time individually in those activities. Students spent 6-12 hours in TCAP
Preparation and 18-20 hours in Math or Reading/Language Arts Credit Recovery.
Figure 17. Median Number of State Test Prep Contact Hours, by Grade Level
What RECREATIONAL ACTIVITIES did students experience in PY13-14?
Recreational activities comprise both structured and unstructured, physical and mental pursuits.
Activities that fell into the Recreational activities category were Board Games, Computer Games,
Organized Sports (such as a planned game of dodgeball among participants), Participating in Organized
Team Sports (such as playing baseball with a league), Structured Fitness (i.e., Zumba, soccer, walking
track), unstructured physical play (open gym time), and Other Recreational Activities.
As noted above, students spent 28.0% of all logged hours in Recreational activities, totaling 592,600
hours in PY13-14, an increase of more than 140,500 hours from PY11-12. Students spent a third of the
Recreational time (203,246 hours) receiving Nutritious Meals/Snacks, the activity with the most hours
logged overall. This figure represents a dramatic shift from the PY11-12 report which showed that only
2,100 hours were spent in this activity. Additionally, in the previous report, only 1 hour of Structured
Fitness Activity was logged, compared to more than 89,000 hours in the current analysis. This may
indicate that those responsible for data entry became more familiar with the activity options available in
the web-app and were able to capture their offerings more accurately.
Credit Recovery -History/ Math, 20.0
Credit Recovery -
Science, 20.0
TCAP
Preparation, 11.75
TCAP Preparation,
11.0
0
5
10
15
20
25
Grades K-2 Grades 3-5 Grades 6-8 Grades 9-12
Median Number of State Test Prep Contact Hours,
by Grade Level
ACT / SAT Preparation
Credit Recovery - History
Credit Recovery - Math
Credit Recovery - Reading /Lang. Arts
Credit Recovery - Science
Gateway / End of Course Exams – Math
Gateway / End of Course Exams – Reading / Lang. Arts
Gateway / End of CourseExams - Science
Other
TCAP Preparation

The Student Experience, Program Year 2013-2014– 21st CCLC Participation Report
Findings University of Tennessee Social Work Office of Research and Public Service 19
Figure 18. Percentage of Time Students Spent in Recreational Activities
The medians indicate that elementary and middle school students spent the most time in Nutritional
Meals/Snacks. High schoolers, however, had the highest median number of contact hours in Structured
Fitness activities. This is a notable change from the previous report, which as stated earlier, found these
two activities to be underutilized.
Figure 19. Median Number of Recreational Contact Hours, by Grade Level
Nutritional Snacks / Meals (34.3%)
Unstructured Physical Play
(21.2%)Structured Fitness (ie zumba, yoga, walking
track) (15.0%)
Organized Sports(10.8%)
Computer Games (10.2%)
Board Games, (8.4%)Recreational Activities
15.5 14.712.3
7.3
Structured Fitness (ie zumba, yoga, walking
track), 36.0
0.0
5.0
10.0
15.0
20.0
25.0
30.0
35.0
40.0
Grades K-2 Grades 3-5 Grades 6-8 Grades 9-12
Median Number of Recreational Contact Hours, by Grade Level
Board Games
Computer Games
Nutritional Snacks / Meals
Organized Sports
Unstructured Physical Play
Structured Fitness (ie zumba,yoga, walking track)

The Student Experience, Program Year 2013-2014– 21st CCLC Participation Report
20 University of Tennessee Social Work Office of Research and Public Service Findings
What CREATIVE ARTS ACTIVITIES did students experience in PY13-14?
The Creative Arts activities included Cooking, Creative Writing, Dance, Drama, Music, Photography,
Sewing, Arts and Crafts, and Other. Students spent 27,369 fewer hours in Creative Arts activities in PY13-
14 than they did in PY11-12.
Two thirds of the 196,988 Creative Arts contact hours were logged in the Arts and Crafts or Other
activities (82,264 [41.8%] and 49,578 [25.2%], respectively). Music came in third with almost 12.0% of
student hours spent in Creative Arts. As indicated in the previous report, activities such as Dance,
Sewing, and Photography garnered the fewest activity hours in the 2013-2014 program year. This
finding may be due to the specialized nature of these activities and the high equipment costs. Overall,
only 423 students attended a Sewing activity and 395 attended a Photography activity. It is likely that
few centers have the resources to offer these activities to their students.
Figure 20. Percentage of Time Students Spent in Creative Arts Activities
The median number of hours students spent in Creative Arts activities is fairly evenly distributed across
activities by grade level. For all elementary and middle school students, the default activities of Arts and
Crafts or Other had the highest medians. The highest median for the high schoolers stands out not only
for its size, 36 hours, but also for the activity—Drama—possibly due to poor-quality data; however, it is
likely that a niche activity such as Drama draws a group of dedicated students who spend a great deal of
time working toward a goal, such as a stage production.
Arts & Crafts(41.8%)
Other (25.2%)
Music (11.7%)
Drama (7.3%)
Cooking (5.9%)
Creative Writing(3.4%)
Dance(3.1%) Sewing, (0.9%)
Photography(0.7%)
Creative Arts

The Student Experience, Program Year 2013-2014– 21st CCLC Participation Report
Findings University of Tennessee Social Work Office of Research and Public Service 21
Figure 21. Median Number of Creative Arts Contact Hours, by Grade Level
What INTERPERSONAL ENRICHMENT ACTIVITIES did students experience in PY13-14?
Students spent more than 152,300 hours in Interpersonal Enrichment activities, a decrease of just under
15,000 from PY11-12. Interpersonal Enrichment activities include Computer/Technology, Health
Education, Unstructured Time for Socializing, Field Trips, Community Service/Service Learning, Family
Activities (i.e., Family Fun Nights, Special Programs), Expanded Library Hours, Career Explorations/Job
Shadowing, and Other Youth Development activities. Computer/Technology activities occupied the most
hours (44,472) with Health Education being second (26,880). Students spent very little time in Career
Exploration/Job Shadowing activities (2,616 hours).
Figure 22. Percentage of Time Students Spent in Interpersonal Enrichment Activities
Arts & Crafts,
8.1
Arts & Crafts,
6.8Arts & Crafts,
4.0
Drama, 36.0
Other, 4.5
0.0
5.0
10.0
15.0
20.0
25.0
30.0
35.0
Grades K-2 Grades 3-5 Grades 6-8 Grades 9-12
Median Number of Creative ArtsContact Hours, by Grade Level Arts & Crafts
Creative Writing
Drama
Music
Other
Photography
Sewing
Cooking
Dance
Health Education(17.6%)
Unstructured Time for Socializing
(15.1%)
Field Trips (12.9%)
Other Youth Development
(11.8%)Community Service / Service Learning (4.9%)
Family Activities (3.5%)
Expanded Library Hours (3.2%)
Career Explorations / Job Shadowing (1.7%)
Computer/ Technology(29.2%)
Interpersonal Enrichment

The Student Experience, Program Year 2013-2014– 21st CCLC Participation Report
22 University of Tennessee Social Work Office of Research and Public Service Findings
The medians for Interpersonal Enrichment activities have a startling outlier in the high school findings.
The median number of hours high school students spent in Health Education is 70 contact hours for the
year. Only 166 high school students participated in Health Education activities in PY13-14, but they
amassed more than 19,000 hours. This finding could be a result of an intensive program the students
participated in or it could indicate problematic data. It is unclear which reason is correct.
Students in grades K-2 and 6-8 had the highest medians in Field Trips and Computer/Technology
activities. For the upper elementary schoolers in grades 3-5, Field Trips and Unstructured Time for
Socializing had the highest medians.
Figure 23. Median Number of Interpersonal Enrichment Contact Hours, by Grade Level
What COUNSELING and MENTORING ACTIVITIES did students experience in PY13-14?
The number of hours spent in Counseling and Mentoring activities (28,695) represents a decrease of
more than 138,000 hours from the PY11-12 report. This is the second largest decrease in terms of the
number of hours spent in an activity family; only Academic activities decreased by more total hours. In
PY13-14, Counseling and Mentoring activities account for only 1.4% of all contact hours. Counseling and
Mentoring activities include Assistance to Truant, Suspended or Expelled Students; Character Education;
Conflict Resolution; Drug Prevention; Violence Prevention; and Other Counseling-Mentoring activities.
More than two thirds of all Counseling and Mentoring hours (19,765 hours) were spent in Character
Education activities. This amount represents a proportional increase from the PY11-12 findings. While
Drug Prevention, Conflict Resolution, and Other Counseling-Mentoring were the next most popular
activities, students spent relatively few contact hours in these activities, and fewer than 1,000 students
Health Education, 70.0
Field trips, 6.0Field trips, 8.8
Field trips, 7.0
Computer/ Technology, 7.0
Computer/ Technology, 5.0
0.0
10.0
20.0
30.0
40.0
50.0
60.0
70.0
Grades K-2 Grades 3-5 Grades 6-8 Grades 9-12
Median Number of Interpersonal EnrichmentContact Hours,
by Grade Level
Health Education
Family Activities (ie - Family Fun Nights,Special Programs)
Field trips
Career Explorations / Job Shadowing
Community Service / Service Learning
Computer/ Technology
Expanded Library Hours
Other Youth Development
Unstructured Time for Socializing

The Student Experience, Program Year 2013-2014– 21st CCLC Participation Report
Findings University of Tennessee Social Work Office of Research and Public Service 23
participated during the year. Only 34 students participated in an Assistance to Truant, Suspended or
Expelled Students activity.
Figure 24. Percentage of Time Students Spent in Counseling and Mentoring Activities
Among elementary schoolers, Conflict Resolution activities had the highest median number of contact
hours. Among middle schoolers, Drug Prevention had the highest median number of hours, but the
difference in medians is small. Data showed another anomaly among high schoolers: the median
number of contact hours spent in the activity with the highest finding, Character Education, is more than
double the next highest finding. Again, this may be due to a concentration of students in these activities.
Figure 25. Median Number of Counseling and Mentoring Contact Hours, by Grade Level
Character Education(68.9%)
Drug Prevention(10.6%)
Other Counseling-Mentoring (8.9%)
Conflict Resolution(8.0%)
Violence Prevention(3.1%) Assistance to truant,
suspended or expelled students
(0.5%)
Counseling and Mentoring
4.55.0
14.9
8.3
3.0
7.3
0.0
2.0
4.0
6.0
8.0
10.0
12.0
14.0
16.0
Grades K-2 Grades 3-5 Grades 6-8 Grades 9-12
Median Number of Counseling and Mentoring Contact Hours,
by Grade Level
Assistance to truant,suspended or expelledstudentsCharacter Education
Conflict Resolution
Drug Prevention
Other Counseling-Mentoring
Violence Prevention

The Student Experience, Program Year 2013-2014– 21st CCLC Participation Report
24 University of Tennessee Social Work Office of Research and Public Service Summary of Findings
Summary of Findings As part of a multifaceted statewide evaluation of 21st CCLC programs in Tennessee, the TDOE partnered
with UT SWORPS to conduct both Implementation and Outcome evaluations. The current report is the
second in the Outcome Evaluation series and explores program usage in PY13-14. To that end, UT
SWORPS program evaluators examined data entered by site coordinators into an online web-app. The
data tracked students’ demographics, attendance, and participation in their afterschool programs. The
analysis sought to answer questions addressing who attends the afterschool programs and what they do
when they are there. The specific questions are addressed below.
Who is attending the 21st CCLC programs? What is the demographic profile of
participants?
For PY13-14, the average student enrolled in the 21st CCLC afterschool programs was a White child,
almost 11 years old. The students were evenly split between boys and girls and were mainly in upper
elementary school grades (3rd through 5th). The vast majority of students attended a program run by a
Local Educational Agency (LEA). These demographics are very similar to those in the previous report,
except for the average student age, which has decreased. Almost half of all participants were new to the
21st CCLC program, which, when considered in light of the reduction in participation from the previous
report, may indicate a retention problem among the ASPs.
Are some students more likely to participate regularly than others?
More than 50.0% of all students were present at their afterschool program for 30+ days in PY13-14.
However, only about 30.0% of all participants were present for 60+ days. Despite an overall decrease in
the number of students attending their ASPs regularly or intensely, the groups of students most likely to
attend at those levels remained unchanged from the findings of the PY11-12 report. Larger proportions
of Black/African American students, students attending CBOs, students in Elementary school and
students who have attended for more than 1 year were more likely to attend regularly or intensely than
their counterparts.
What activities are students experiencing? In which activities are they
participating most often?
Students spent the most time in Academic activities, specifically Academic Enrichment.
Of the 2.16 million activity hours students experienced in PY13-14, 1.15 million were in Academic
activities (54.1%). These hours were closely split between Skills Practice/Homework Help and Academic
Enrichment activities. The Academic activity with the highest number of logged hours in the online web-
app was Skills Practice/Homework Help in Other Academic Subjects, with 148,338 hours logged during
the program year. The activity with the most contact hours overall, however, was Nutritional

The Student Experience, Program Year 2013-2014– 21st CCLC Participation Report
Summary of Findings University of Tennessee Social Work Office of Research and Public Service 25
Snacks/Meals, in which students logged 203,247 contact hours. This is a drastic change from the
previous report, which showed that this activity was underutilized, and only 2,100 contact hours were
logged during the year.
The next most popular activity family was Recreational Activities. This was due in no small part to the
number of contact hours spent in Nutritious Snacks/Meals, which account for a third of all hours in this
activity family. Creative Arts, Interpersonal Enrichment, and Counseling and Mentoring Activities
combined accounted for less than 18.0% of all contact hours.
How does activity participation vary for different age groups?
Students in grades K-2 had the highest median Academic contact hours in Remediation in Other
Academic Subjects (24.0). Second for the group was 15.8 median hours in Skills Practice/Homework
Help. They also spent more time in Recreation—Nutritional Snacks/Meals (15.5 median contact hours),
Creative Arts—Arts and Crafts (8.1), Interpersonal Enrichment—Computer/Technology (7.0), and
Counseling and Mentoring—Conflict Resolution (8.3) than other activities in those respective families.
The 48.0 median contact hours students in grades 3-5 accumulated in Remediation Activities in Other
Academic Subjects was by far the highest median across all Academic activities for students in this age
group. The second highest median was 11.5 in Reading/ Language Arts and Skills Practice/Homework
Help. As for the other Activity families, students spent more time in Recreation—Nutritional
Snacks/Meals (14.7 median contact hours), Creative Arts—Arts and Crafts (6.8), Interpersonal
Enrichment—Fieldtrips (8.8), and Counseling and Mentoring—Conflict Resolution and Character
Education (both were 5.0) than other activities in those respective families.
Middle schoolers (grades 6-8) focused on Credit Recovery activities in History and Math, with 20.0
median contact hours each. They also had 14.3 contact hours (the next highest) in Remediation activities
in Other Academic Subjects, indicating that middle schoolers are using their ASPs as a way to catch up
on their academic work. They spent more time in Recreation—Nutritional Snacks/Meals (12.3 median
contact hours), Creative Arts—Other (4.5), Interpersonal Enrichment—Fieldtrips (7.0), and Counseling
and Mentoring—Drug Prevention (3.0) than other activities in those respective families.
High schoolers (grades 9-12) continued the pattern of using ASPs for academic recovery. The three
activities with the highest median number of contact hours were all Credit Recovery Activities: Science
(20.0), Math (18.3), and History (18.0). They spent more time in Recreation—Structured Fitness (36.0
median contact hours), Creative Arts—Drama (36.0), Interpersonal Enrichment—Health Education
(70.0), and Counseling and Mentoring—Character Education (14.9) than other activities in those
respective families.

The Student Experience, Program Year 2013-2014– 21st CCLC Participation Report
26 University of Tennessee Social Work Office of Research and Public Service Conclusion
Conclusion Students in 21st CCLC afterschool programs have participated in a variety of activities that address the
educational, emotional, creative, and health needs of the individual. The main focus is academic,
through homework help, remediation, test prep, and enrichment activities. However, students also
participate in physical recreation, creative arts, enrichment, and counseling activities. Some differences
appear among groups, and site coordinators may want to look at their individual programs to determine
whether any steps could be taken to address the differences in the amount of time students spend in
various activities. Even though a decrease in participation and attendance occurred between PY11-12
and PY 13-14, thousands of students continue to experience millions of hours of activities they likely
otherwise would not without the 21st CCLC afterschool programs.

The Student Experience, Program Year 2013-2014– 21st CCLC Participation Report
References University of Tennessee Social Work Office of Research and Public Service 27
References McCutcheon, E., Hadjiharalambous, S., Myers, G., & Homer, K. (2010). Statewide evaluation of 21st
century community learning centers in Tennessee–feasibility study. Knoxville: University of
Tennessee.
McCutcheon, E. R. & Homer, K. (2013) 21st Century Community Learning Center Participation: The
Student Experience. Knoxville, TN: University of Tennessee

The Student Experience, Program Year 2013-2014– 21st CCLC Participation Report
28 University of Tennessee Social Work Office of Research and Public Service Appendices
Appendices
Appendix A—Activity Families
Activity Web-app Category Report Category
Academic Enrichment—Limited English Proficiency
Academic—Academic Enrichment
Academic—Academic Enrichment
Academic Enrichment—Math Academic—Academic Enrichment
Academic—Academic Enrichment
Academic Enrichment—Other Academic Enrichment Programs
Academic—Academic Enrichment
Academic—Academic Enrichment
Academic Enrichment—Reading/Language Arts Academic—Academic Enrichment
Academic—Academic Enrichment
Academic Enrichment—Science Academic—Academic Enrichment
Academic—Academic Enrichment
Remedial Education—Limited English Proficiency
Academic—Remedial Education
Academic—Remedial Education
Remedial Education—Math Academic—Remedial Education
Academic—Remedial Education
Remedial Education—Other Remedial Education
Academic—Remedial Education
Academic—Remedial Education
Remedial Education—Reading/Language Arts Academic—Remedial Education
Academic—Remedial Education
Remedial Education—Science Academic—Remedial Education
Academic—Remedial Education
Skills Practice/Homework Help—Limited English Proficiency
Academics—Skill Practice/ Homework Help
Academics—Skill Practice/ Homework Help
Skills Practice/Homework Help—Math Academics—Skill Practice/ Homework Help
Academics—Skill Practice/ Homework Help
Skills Practice/Homework Help—Other Academics
Academics—Skill Practice/ Homework Help
Academics—Skill Practice/ Homework Help
Skills Practice/Homework Help—Reading/Language Arts
Academics – Skill Practice/ Homework Help
Academics—Skill Practice/ Homework Help
Skills Practice/Homework Help—Science Academics—Skill Practice/ Homework Help
Academics—Skill Practice/ Homework Help
Skills Practice/Homework Help—Special Needs Academics—Skill Practice/ Homework Help
Academics—Skill Practice/ Homework Help
State Test Prep—Math Academics—State Test Prep
Academics—State Test Prep
State Test Prep—Other State Test Prep Academics—State Test Prep
Academics—State Test Prep
State Test Prep—Reading/Language Arts Academics—State Test Prep
Academics—State Test Prep
State Test Prep—Science Academics—State Test Prep
Academics—State Test Prep

The Student Experience, Program Year 2013-2014– 21st CCLC Participation Report
Appendices University of Tennessee Social Work Office of Research and Public Service 29
Activity Web-app Category Report Category
Arts and Recreation—Arts and Crafts Arts and Recreation/
Fitness and Nutrition—Arts
and Recreation
Creative Arts
Arts and Recreation—Creative Writing Arts and Recreation/
Fitness and Nutrition/Arts
and Recreation
Creative Arts
Arts and Recreation—Drama Arts and Recreation/Fitness
and Nutrition/Arts and
Recreation
Creative Arts
Arts and Recreation—Music Arts and Recreation/Fitness
and Nutrition/Arts and
Recreation
Creative Arts
Arts and Recreation—Other Arts and Recreation/Fitness and Nutrition/Arts and Recreation
Creative Arts
Arts and Recreation—Photography Arts and Recreation/Fitness and Nutrition/Arts and Recreation
Creative Arts
Arts and Recreation—Sewing Arts and Recreation/Fitness and Nutrition/Arts and Recreation
Creative Arts
Fitness and Nutrition—Cooking Arts and Recreation/ Fitness and Nutrition/ Fitness/Nutrition
Creative Arts
Fitness and Nutrition—Dance Arts and Recreation/ Fitness and Nutrition/ Fitness/Nutrition
Creative Arts
Arts and Recreation—Board Games Arts and Recreation/Fitness
and Nutrition/Arts and
Recreation
Recreational Activities
Arts and Recreation—Computer Games Arts and Recreation/Fitness
and Nutrition/Arts and
Recreation
Recreational Activities
Fitness and Nutrition—Nutritional Snacks/
Meals
Arts and Recreation/
Fitness and Nutrition/
Fitness/Nutrition
Recreational Activities

The Student Experience, Program Year 2013-2014– 21st CCLC Participation Report
30 University of Tennessee Social Work Office of Research and Public Service Appendices
Activity Web-app Category Report Category
Fitness and Nutrition—Organized Sports Arts and Recreation/
Fitness and Nutrition/
Fitness/Nutrition
Recreational Activities
Fitness and Nutrition—Other Recreation
Activities
Arts and Recreation/
Fitness and Nutrition/
Fitness/Nutrition
Recreational Activities
Fitness and Nutrition—Participating/Org Team
Sports
Arts and Recreation/
Fitness and Nutrition/
Fitness/Nutrition
Recreational Activities
Fitness and Nutrition—Structured
Fitness/zumba/yoga/track
Arts and Recreation/
Fitness and Nutrition/
Fitness/Nutrition
Recreational Activities
Fitness and Nutrition—Unstructured Physical
Play
Arts and Recreation/ Fitness and Nutrition/ Fitness/Nutrition
Recreational Activities
Counseling—Mentoring—Assist
truant/suspended/expelled
Prevention and Youth Development—Counseling—Mentoring
Counseling and Mentoring
Counseling—Mentoring—Character Education Prevention and Youth Development—Counseling—Mentoring
Counseling and Mentoring
Counseling—Mentoring—Conflict Resolution Prevention and Youth Development—Counseling—Mentoring
Counseling and Mentoring
Counseling—Mentoring—Drug Prevention Prevention and Youth Development—Counseling—Mentoring
Counseling and Mentoring
Counseling—Mentoring—Other Counseling—Mentoring
Prevention and Youth Development—Counseling—Mentoring
Counseling and Mentoring
Counseling—Mentoring—Violence Prevention Prevention and Youth Development—Counseling—Mentoring
Counseling and Mentoring
Student/Family Services—Fieldtrips Prevention and Youth Development—Student/ Family Services
Interpersonal Enrichment
Youth Development—Career Explorations/Job Shadowing
Prevention and Youth Development—Youth Development
Interpersonal Enrichment

The Student Experience, Program Year 2013-2014– 21st CCLC Participation Report
Appendices University of Tennessee Social Work Office of Research and Public Service 31
Activity Web-app Category Report Category
Youth Development—Community Service/ Service Learning
Prevention and Youth Development—Youth Development
Interpersonal Enrichment
Youth Development—Computer/Technology Prevention and Youth Development—Youth Development
Interpersonal Enrichment
Youth Development—Expanded Library Hours Prevention and Youth Development—Youth Development
Interpersonal Enrichment
Youth Development—Field Trips—Cultural Events
Prevention and Youth Development—Youth Development
Interpersonal Enrichment
Youth Development—Field Trips—Ethnic Centers
Prevention and Youth Development—Youth Development
Interpersonal Enrichment
Youth Development—Field Trips—Local Businesses
Prevention and Youth Development—Youth Development
Interpersonal Enrichment
Youth Development—Field Trips—Special Programs
Prevention and Youth Development—Youth Development
Interpersonal Enrichment
Youth Development—Health Education Prevention and Youth Development—Youth Development
Interpersonal Enrichment
Youth Development—Other Youth Development
Prevention and Youth Development—Youth Development
Interpersonal Enrichment
Youth Development—Social—Attending Sports Events
Prevention and Youth Development—Youth Development
Interpersonal Enrichment
Youth Development—Social—Festival Prevention and Youth Development—Youth Development
Interpersonal Enrichment
Youth Development—Social—Party Prevention and Youth Development—Youth Development
Interpersonal Enrichment
Youth Development—Unstructured Time for Socializing
Prevention and Youth Development—Youth Development
Interpersonal Enrichment

The Student Experience, Program Year 2013-2014– 21st CCLC Participation Report
32 University of Tennessee Social Work Office of Research and Public Service Appendices
Appendix B—Contact Hours and Number of Students Participating
Total Contact Hours Logged for ALL Students
% of all Academic Enrichment Hours
Total Number of Students Participating
Academic Enrichment Activity
Reading/Language Arts 135,240.0 (30.6%) 9,293
Math 128,601.3 (29.1%) 8,722
Other Academic Enrichment Programs
102,424.7 (23.2%) 6,172
Science 69,493.1 (15.7%) 6,187
Limited English Proficiency 6,306.4 (1.4%) 609
Skill Practice Activity
Other Academic Subjects 148,338.2 (35.0%) 5,653
Reading/Language Arts 132,475.7 (31.3%) 7,715
Math 115,204.2 (27.2%) 7,741
Science 18,738.4 (4.4%) 2,599
Limited English Proficiency 7,672.3 (1.8%) 591
Special Needs 1,475.3 (0.3%) 277
Academic Remediation Activity
Other Remedial Education 129,507.6 (52.4%) 3,160
Reading/Language Arts 57,949.5 (23.5%) 4,935
Math 53,226.3 (21.6%) 4,825
Science 5,551.7 (2.2%) 1,399
Limited English Proficiency 741.8 (0.3%) 271
Test Prep Activity
ACT/SAT Preparation 3,310.1 (10.0%) 196
Other 2,171.7 (6.6%) 197
Credit Recovery - Math 1,143.7 (3.5%) 43
Credit Recovery - Science 880.0 (2.7%) 40
Credit Recovery - Reading/ Lang. Arts
604.4 (1.8%) 45
Gateway/End of Course Exams - Science
420.0 (1.3%) 128
Credit Recovery - History 227.1 (0.7%) 12
Gateway/End of Course Exams – Math
28.0 (0.1%) 7
Gateway/End of Course Exams – Reading/Lang. Arts
19.0 (0.1%) 19
TCAP Preparation 24,304.5 (73.4%) 1,998

The Student Experience, Program Year 2013-2014– 21st CCLC Participation Report
Appendices University of Tennessee Social Work Office of Research and Public Service 33
Recreational Activity
Nutritional Snacks/Meals 203,246.7 (34.3%) 9,910
Unstructured Physical Play 125,685.1 (21.2%) 7,155
Structured Fitness (i.e., Zumba, yoga, walking track)
89,033.8 (15.0%) 6,057
Organized Sports 64,188.9 (10.8%) 5,012
Computer Games 60,467.9 (10.2%) 5,148
Board Games 49,977.3 (8.4%) 4,794
Creative Arts Activity
Arts & Crafts 82,264.4 (41.8%) 6,720
Other 49,578.2 (25.2%) 4,420
Music 23,054.0 (11.7%) 2,644
Drama 14,299.5 (7.3%) 1,297
Cooking 11,684.9 (5.9%) 2,260
Creative Writing 6,674.4 (3.4%) 1,520
Dance 6,160.0 (3.1%) 1,645
Sewing 1,846.9 (0.9%) 423
Photography 1,425.4 (0.7%) 395
Interpersonal Enrichment Activities
Computer/Technology 44,472.2 (29.2%) 3,504
Health Education 26,879.6 (17.6%) 2,032
Unstructured Time for Socializing
23,010.8 (15.1%) 2,090
Fieldtrips 19,713.3 (12.9%) 1,860
Other Youth Development 18,030.9 (11.8%) 1,982
Community Service/Service Learning
7,477.6 (4.9%) 1,638
Family Activities (i.e. - Family Fun Nights, Special Programs)
5,254.9 (3.5%) 1,442
Expanded Library Hours 4,848.2 (3.2%) 815
Career Explorations/Job Shadowing
2,616.3 (1.7%) 1,024
Counseling and Mentoring Activities
Character Education 19,764.7 (68.9%) 3,209
Drug Prevention 3,040.2 (10.6%) 724
Other Counseling-Mentoring 2,546.4 (8.9%) 921
Conflict Resolution 2,306.9 (8.0%) 520
Violence Prevention 902.3 (3.1%) 289
Assistance to truant, suspended or expelled students
134.8 (0.5%) 34

The Student Experience, Program Year 2013-2014– 21st CCLC Participation Report
34 University of Tennessee Social Work Office of Research and Public Service Appendices
Appendix C—Median Contact Hours and Number of Students
Activity, by Family Median Number of Hours and Number of Students Participated
Academic Enrichment Grades K-2 Grades 3-5 Grades 6-8 Grades 9-12
Median Hours
# of Students
Median Hours
# of Students
Median Hours
# of Students
Median Hours
# of Students
Limited English Proficiency 10.0 159 2.0 322 1.5 106 1.0 21
Math 9.0 2,380 9.5 4,137 5.8 1,812 5.5 363
Other Academic Subjects 8.3 1,787 6.4 2,993 5.0 1,121 4.5 249
Reading/Language Arts 11.0 2,930 9.6 4,358 4.5 1,799 4.0 163
Science 6.8 1,817 6.5 2,708 7.0 1,497 3.0 141
Skills Practice/Homework Help
Grades K-2 Grades 3-5 Grades 6-8 Grades 9-12 Median Hours
# of Students
Median Hours
# of Students
Median Hours
# of Students
Median Hours
# of Students
Limited English Proficiency 2.0 89 1.0 203 3.1 164 1.5 132
Math 9.0 1,713 10.3 3,138 8.5 2,037 2.0 837
Other Academic Subjects 15.8 1,471 8.5 2,366 14.1 1,348 4.0 439
Reading/Language Arts 12.0 1,828 11.5 3,124 8.3 2,348 2.0 397
Science 3.5 430 3.9 1,214 3.0 770 2.0 184
Special Needs 2.0 20 2.0 159 1.0 84 2.0 14
Academic Remediation Grades K-2 Grades 3-5 Grades 6-8 Grades 9-12
Median Hours
# of Students
Median Hours
# of Students
Median Hours
# of Students
Median Hours
# of Students
Limited English Proficiency 1.8 107 3.5 69 1.3 77 1.8 17
Math 8.2 1,428 5.0 1,697 5.9 1,190 4.0 480
Other Academic Subjects 24.0 1,071 48.0 1,490 14.3 525 4.3 23
Reading/Language Arts 9.4 1,874 5.0 1,723 3.8 1,036 3.0 263
Science 1.8 482 1.8 469 2.0 372 4.0 66
State Test Prep Grades K-2 Grades 3-5 Grades 6-8 Grades 9-12
Median Hours
# of Students
Median Hours
# of Students
Median Hours
# of Students
Median Hours
# of Students
ACT/SAT Preparation 2.5 21 2.5 33 2.5 24 8.0 118
Credit Recovery - History -- -- -- -- 20.0 1 18.0 11
Credit Recovery - Math -- -- -- -- 20.0 6 18.3 37
Credit Recovery - Reading/Language Arts -- -- -- -- 11.0 4 4.0 41
Credit Recovery - Science -- -- -- -- 15.0 14 20.0 26
Gateway/End of Course Exams – Math -- -- 4.0 2 -- -- 4.0 5
Gateway/End of Course Exams – Reading/ Language Arts -- -- -- -- -- -- 1.0 19

The Student Experience, Program Year 2013-2014– 21st CCLC Participation Report
Appendices University of Tennessee Social Work Office of Research and Public Service 35
Gateway/End of Course Exams - Science -- -- -- -- -- -- 2.0 128
Other 1 12 0.3 2 1.0 34 10.5 149
TCAP Preparation 11.75 401 11.0 885 12.0 668 6.0 44
Recreational Activities Grades K-2 Grades 3-5 Grades 6-8 Grades 9-12
Median Hours
# of Students
Median Hours
# of Students
Median Hours
# of Students
Median Hours
# of Students
Board Games 7.0 1,627 5.3 1,856 2.3 1,174 5.9 99
Computer Games 5.5 1,751 6.0 2,152 3.8 1,114 8.6 89
Nutritional Snacks/ Meals 15.5 2,813 14.7 4,328 12.3 2,363 7.3 323
Organized Sports 8.5 1,461 5.3 1,926 8.1 1,447 6.0 148
Structured Fitness (i.e., Zumba, yoga, walking track) 9.0 2,019 8.0 2,453 3.5 1,300 36.0 249
Unstructured Physical Play 9.0 2,070 8.5 3,099 7.2 1,754 8.3 187
Creative Arts Grades K-2 Grades 3-5 Grades 6-8 Grades 9-12
Median Hours
# of Students
Median Hours
# of Students
Median Hours
# of Students
Median Hours
# of Students
Arts and Crafts 8.1 2,306 6.8 2,757 4.0 1,482 1.0 143
Creative Writing 3.0 516 2.0 623 1.8 345 2.0 23
Drama 5.8 473 3.5 538 3.0 249 36.0 31
Music 4.0 829 5.0 1,172 3.5 579 4.0 45
Other 4.8 1,379 5.0 1,796 4.5 996 2.5 220
Photography 3.0 80 3.0 141 2.0 172 1.8 2
Sewing 3.0 196 2.0 80 2.6 138 0.8 8
Cooking 3.0 729 2.5 851 2.3 643 2.0 31
Dance 3.0 605 2.9 677 2.0 327 2.8 28
Interpersonal Enrichment Grades K-2 Grades 3-5 Grades 6-8 Grades 9-12
Median Hours
# of Students
Median Hours
# of Students
Median Hours
# of Students
Median Hours
# of Students
Health Education 3.0 523 2.3 763 2.0 568 70.0 166
Family Activities (i.e., Family Fun Nights, Special Programs) 1.8 303 2.0 534 3.3 241 3.0 362
Fieldtrips 6.0 512 8.8 740 7.0 476 7.0 126
Career Explorations/Job Shadowing 3.0 122 1.5 210 2.0 527 2.0 165
Community Service/ Service Learning 1.3 407 2.0 657 2.0 416 3.5 158
Computer/Technology 7.0 840 5.0 1,460 5.0 923 1.0 278
Expanded Library Hours 5.0 216 5.0 325 2.0 258 1.5 16
Other Youth Development 3.0 540 2.5 707 2.0 573 6.5 159

The Student Experience, Program Year 2013-2014– 21st CCLC Participation Report
36 University of Tennessee Social Work Office of Research and Public Service Appendices
Unstructured Time for Socializing 3.5 521 6.1 756 2.9 614 2.5 193
Counseling and Mentoring Activities
Grades K-2 Grades 3-5 Grades 6-8 Grades 9-12 Median Hours
# of Students
Median Hours
# of Students
Median Hours
# of Students
Median Hours
# of Students
Assistance to truant, suspended or expelled students -- -- 3.6 28 2.0 2 3.0 4
Character Education 4.5 969 5.0 1,393 2.3 736 14.9 97
Conflict Resolution 8.3 87 5.0 155 2.5 243 0.9 35
Drug Prevention 3.0 128 3.0 204 3.0 316 3.0 76
Other Counseling-Mentoring 2.5 188 1.3 349 1.0 298 7.3 86
Violence Prevention 3.0 69 3.0 50 2.0 154 0.8 16